Abstract
Asymmetrical V-shaped tunnels often appear in tunnels crossing the river or urban underground road tunnels. The smoke flow inside is affected by a lot of factors. A full understanding of the smoke flow in this kind of tunnel is the basis of the smoke control. In this study, the effects of slope composition and fire heat release rate (HRR) on the longitudinal induced airflow velocity, the smoke back-layering length at the small slope side, and the maximum ceiling temperature were studied by the numerical method. The results show that when the fire occurs at the slope change point of the V-shaped tunnel, the maximum ceiling temperature decreases with the increase in the slope of the large-slope side tunnel. The longitudinally induced velocity is primarily related to the slope of the large-slope side tunnel and the fire HRR. When the slope difference between the side tunnels or the slope of the large-slope side tunnel is large, the smoke in the small-slope side tunnel flows back toward the fire source after reaching its maximum dispersion distance and then reaches a quasi-steady state. The smoke back-layering length is mainly affected by the slope and length of the large-slope side tunnel. When the slope of the large-slope side tunnel is 9%, the induced airflow velocity from the small-slope side can prevent the spread of smoke. The empirical models of the smoke back-layering length and the longitudinal induced airflow velocity in the small-slope side tunnel are drawn, respectively, by the theoretical analysis and the numerical results. This study can provide technical support for the design and operation of smoke control systems in V-shaped tunnels.
1. Introduction
Due to the continuous development and utilization of urban underground space in recent years, new urban underground tunnels need to pass across existing underground facilities, such as subways, utility tunnels, and underground transportation hubs. The vertical structure of the tunnels is becoming more complex, and some continuous asymmetric V-shaped sections are found in the tunnels [1,2,3,4]. Due to the relatively long and narrow structure, high-temperature smoke and toxic gases pose a fatal threat to people when a fire occurs in a tunnel [5,6,7].
The smoke flow and dispersion in V-shaped tunnels differ significantly from those in horizontal or inclined tunnels. The smoke flow in V-shaped tunnels is affected by the slope compositions, the cross-section of the tunnel, fire power, and other factors. When the fire occurs near the slope change point of the V-shaped tunnel, an asymmetric driving pressure difference will be created if the slopes of the side tunnels are different. This asymmetric pressure difference will increase with the duration of the fire and the increase in the temperature in the tunnel, significantly affecting the entrainment of the plume at the fire source and the flow of the ceiling jet. Consequently, the smoke flow within the tunnel will exhibit obvious spatiotemporal variations. The smoke diffusion in the large-slope side tunnel is greater than that in the small-slope side, generating higher driving pressure. Simultaneously, longitudinal-induced airflow emerges from the entrance of the small-slope side tunnel. This induced airflow effectively inhibits the forward spread of smoke. When the induced airflow velocity is sufficiently high, smoke in the small-slope side tunnel will flow back to the fire source. The prediction of the induced airflow velocity and the back-layering length of the smoke on the small-slope side is fundamental for further analysis and understanding of smoke movement and control within V-shaped tunnels.
Many previous studies have investigated the smoke back-layering length and critical velocity in horizontal and inclined tunnels [8,9,10,11,12,13,14,15]. For the horizontal tunnels, when the longitudinal ventilation speed is less than the critical speed, the smoke continues to move upstream for a certain distance, known as the back-layering length. Vantelon et al. [16] carried out small-scale experiments in a 3 m long tunnel to study the characteristics of the smoke layer and proposed that there is a 0.3 power variation relationship between the length of the back layer and the modified Richardson number. Li et al. [17] conducted a small-scale experiment on the back-layering length of a tunnel fire, showing that the ratio of ventilation velocity to critical velocity is exponentially related to the dimensionless back-layering length, and proposed an empirical model to predict the back-layering length. Hu et al. [18] analyzed the relationship between the buoyancy force driving the forward movement of smoke and the longitudinal ventilation pressure inhibiting the forward movement of smoke. The maximum temperature of the tunnel adopted the maximum temperature rise empirical model proposed by Kurioka et al. [19], and the expression of smoke back-layering length was obtained:
where Lb is the length of the back-layering, m; g is the gravitational acceleration constant, m/s2; Vup is the longitudinal mechanical ventilation velocity, m/s; Ck is a dimensionless constant, which was found empirically to fall within the range of 0.19–0.37; and H is the height of the tunnel. γ and ε are empirical coefficients; Q* is the dimensionless heat release rate (HRR) of the fire, and Fr is the Froude number. Q* and Fr can be calculated by the following equations:
In an inclined tunnel, the stack effect generated by the hot smoke will accelerate the smoke moving upward along the slope direction [11,20,21,22,23]. In the natural ventilation of the inclined tunnel, the stack effect will create a longitudinal induced airflow downstream, and this induced airflow can effectively prevent the flow of smoke in the downslope tunnel. Chow et al. [24] studied smoke movement in a tilted tunnel with longitudinal ventilation and proposed a model for the back-layering length in horizontal tunnels.
where k is the temperature decay coefficient and h is the smoke layer height, m.
Then, considering that the total driving force in a tilted tunnel should be the sum of stack effect and static pressure, the relationship between longitudinal velocity V, HRR, and back-layering length Lb was given by the following equation:
where θ is the tunnel inclined angle.
There are numerous factors affecting the characteristics of smoke spread in inclined tunnels [25,26,27,28,29]. Shafee and Yozgatligil [30] investigated how tunnel slope influences the behavior of smoke plumes and the HRR. Their findings indicated that when the tunnel is inclined downhill, there is an increase in the HRR. Conversely, in uphill scenarios, the critical velocity needed to avert backflow diminishes. Caliendo et al. [31] conducted a study on the impact of longitudinal slope on user risk levels in natural ventilation during fire accidents by establishing a CFD model. The results showed that the number of dangerous scenarios facing user safety in the case of adverse wind or negative slope significantly increased. Zhang et al. [23] considered the effect of HRR, slope, source ceiling height, and tunnel width on the maximum temperature and back-layering length and proposed a simple model to predict the smoke back-layering length. Du et al. [32] showed that the longitudinal velocity upstream of the fire is determined by the fire location, the tunnel inclination, and fire buoyancy flux. The effect of HRR on the back-layering length is negligible. Yu et al. [33] studied the asymmetric flow phenomenon caused by the combined effects of tunnel slope and fire location in naturally ventilated tunnels. The study results show that the longitudinal flow may exhibit bidirectional characteristics, depending on the location of the longitudinal fire. Additionally, they proposed a model for inducing longitudinal flow and predicting the length of the smoke back-layering. Wang et al. [22] considered the effects of the different tunnel slopes, HRR, tunnel lengths, and tunnel widths and established a simple model for predicting the induced air velocity and smoke back-layering length.
However, few studies have investigated the smoke propagation in V-shaped tunnels. Jiang et al. [34] investigated the impact of fire location on smoke propagation in symmetrical V-shaped tunnels using numerical simulations. They observed that as the distance between the fire source and the gradient change point increases, the smoke recirculation length initially decreases and then slightly increases. However, there are few studies on the smoke flow and dispersion in asymmetrical V-shaped tunnels. In this study, the influence of a V-shaped tunnel structure and HRR on smoke spread will be investigated by numerical simulations, and the prediction model for the back-layering length and longitudinal induced velocity in the small-slope side tunnel will be obtained. The flowchart depicting the methodology employed in the study is illustrated in Figure 1. The research findings might offer valuable insights for developing a smoke control strategy for tunnels with complex vertical sections.
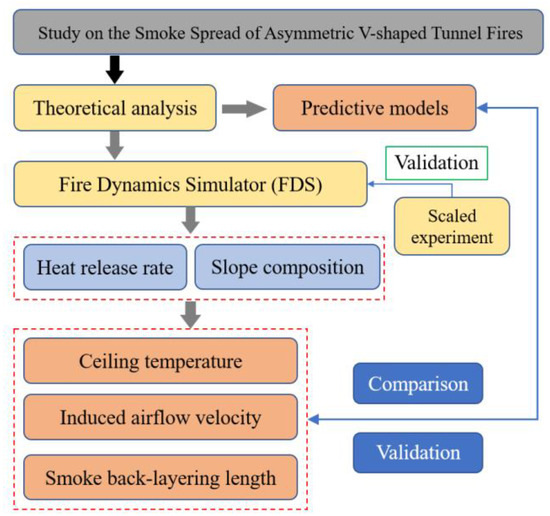
Figure 1.
Flowchart of the methodology.
2. Theoretical Analysis
The static pressure of the smoke and the thermal buoyancy due to the height difference jointly drive the smoke to spread upward, while the longitudinal induced ventilation inhibits the upward spread of smoke in the small-slope side tunnel. If the dynamic pressure of the longitudinally induced velocity equals the driving force of the smoke, the equilibrium state is reached. The back-layering length of the smoke in the small-slope side tunnel will stabilize, and this distance is defined as Lb, as shown in Figure 2. Therefore, at the smoke front in the small-slope side tunnel, the relationship is as follows:
where ΔPstatic is the static pressure difference of the smoke front; ΔPHs is the thermal pressure difference of the smoke in the inclined tunnel; ΔPhydraulic is the dynamic pressure of the longitudinally induced flow; and α is the inclination angle of the small-slope side tunnel.

Figure 2.
Schematic diagram of smoke spread in V-shaped tunnel.
The static pressure of the smoke front layer ΔPstatic is as follows:
where Δρb is the density difference between the smoke front and the ambient air, g is the acceleration due to gravity, and h is the smoke front thickness.
Analyzing the smoke flow in the large-slope side tunnel as shown in Figure 2, the buoyancy force generated by the smoke of a micro-element section in the vertical direction of the inclined tunnel is as follows:
The buoyancy force over the entire length L can be expressed as follows:
where Δρx is the density difference between the smoke and the ambient air; L is the longitudinal distance between the fire source and the smoke front; xr is the position of the reference point near the fire source; and θ is the inclination angle of the inclined tunnel.
The dynamic pressure of the longitudinally induced flow in the small-slope side of the asymmetric V-shaped tunnel is as follows:
where ρa is the air density; Vin is the longitudinal induced velocity.
The density difference between smoke and ambient air can be obtained by the ideal gas law:
Hu et al. [21] investigated the impact of a tunnel gradient on the ceiling temperature distribution during fires using numerical simulations. They proposed an exponential decay gradient correction model, which suggests that when the back-layering length Lb in the small-slope side is greater than zero, the temperature rise along the tunnel ceiling decays exponentially.
where a1 and k1 are the temperature rise decay coefficient in the small-slope side tunnel; x is the distance from the maximum temperature rise point; and xr is the position of the maximum temperature rise.
In this study, the middle section of the physical model of the asymmetrical V-shaped tunnel uses a horizontal transition segment. Therefore, the longitudinal induced airflow acts on the flame in a horizontal direction, similar to the maximum ceiling temperature observed in longitudinally ventilated tunnel fires as proposed by Kurioka et al. [19]. Accordingly, the maximum temperature rise in this study is calculated using the empirical formula provided by Kurioka:
The values of γ and ε are as follows:
Combining Equations (12) and (13), the longitudinal temperature decay is as follows:
Inserting Equations (11) and (15) into Equation (7), the static pressure of the smoke front is obtained:
Inserting Equations (11) and (16) into Equation (9), the stack effect of the smoke in the small-slope side tunnel can be replaced by the following equation:
Combining Equation (6), Equation (10), and Equations (16) and (17), we obtain the following:
Expanding the Equation (18), the smoke back-layering length in the small-slope side tunnel can be obtained:
According to Equation (19), the back-layering length in the small-slope side tunnel is related to the HRR, the longitudinal induced velocity, the inclination angle of the tunnel, and the temperature decay coefficients. The longitudinal induced velocity of the small slope side tunnel is the key parameter of the equation of back-layering length. In a naturally ventilated asymmetrical V-shaped tunnel fire, the smoke mainly exhausts through the large-slope side tunnel. The longitudinally induced airflow in the small-slope side tunnel is dominantly driven by the stack effect of the large-slope side tunnel.
To simplify the solution for the longitudinal induced velocity, the following assumptions are made:
- The fire smoke flow fills the large-slope side tunnel section and exits the tunnel.
- The entrainment effect of the tunnel smoke layer on the longitudinally induced flow in the small-slope side tunnel is not considered.
It is considered that the longitudinally induced flow in the small-slope side tunnel has a certain resistance dissipation along the V-shaped tunnel and at the near-fire region. Combining Equations (10) and (20), this can be expressed as follows:
where the flow impedance coefficient is as follows:
where λ is the friction factor; L is the tunnel length; d is the tunnel equivalent diameter; ξ is the local resistance coefficients; and F is the cross-sectional area of longitudinal flow.
Similarly, the temperature rise along the ceiling of the large-slope side tunnel is also assumed to exhibit exponential decay.
Combining Equations (13) and (23) gives the following:
where C, a2, and k2 are the temperature rise decay coefficients in the large-slope side tunnel.
Inserting Equations (11) and (24) into Equation (9), the stack effect of the smoke in the large-slope side tunnel can be replaced by the following equation:
where L is the length of the large-slope side tunnel; Δρx is the density difference between the smoke and the ambient air in the large-slope side tunnel; and β is the inclination angle of the large-slope side tunnel.
Combining Equations (21) and (25), the longitudinally induced velocity in the small-slope side tunnel can be obtained:
Inserting Equation (26) into Equation (19), the smoke back-layering length in the small-slope side tunnel is replaced by:
Observation Equation (27), it can be found that the back-layering length in the small-slope side tunnel is independent of HRR but, rather, related to the longitudinal temperature rise decay coefficients of the large-slope side and the small-slope side tunnel, the flow impedance coefficient, and the slope of the tunnels on both sides. This is different from the previous theoretical models on smoke back-layering length.
3. CFD Simulation
3.1. The Physical Model
Due to the limitation of experimental conditions, it is necessary to use numerical simulation to study the influence of the asymmetric V-shaped tunnel structure on smoke propagation characteristics. Fire Dynamics Simulator (FDS) is a reliable and practical software for modeling fire scenarios and is widely used in the study of the smoke diffusion of tunnel fire [35,36,37]. FDS 6.7.0 is selected for the numerical simulation in this study.
The length and the slope of the asymmetric V-shaped tunnel have a significant influence on the smoke diffusion in tunnel. In this study, two tunnel lengths are selected. The total length of the tunnel is 410 m and 510 m, and the middle horizontal parts is 10 m. The physical tunnel model is shown in Figure 3. The cross-section of the numerical tunnel is 13.5 m (width) × 7.5 m (height), which refers to the cross-section of the real tunnel in Beijing.
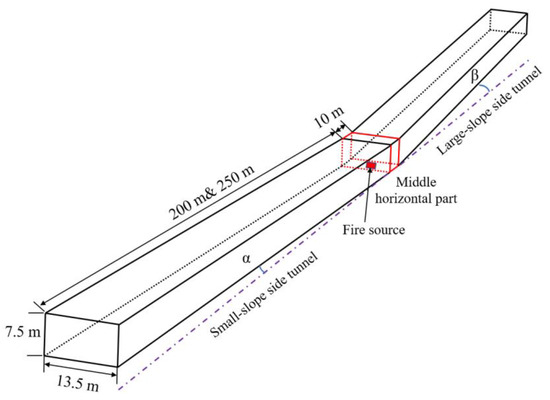
Figure 3.
The schematic diagram of the V-shaped tunnel.
3.2. Grid Sensitivity Analysis
Mesh size directly affects the accuracy of numerical simulation results. When the ratio of the characteristic fire diameter D* to the calculation grid size δx is between 4 and 16, the simulation results are better. The characteristic fire diameter D* is defined as follows:
In this study, the minimum HRR is 20 MW. For 20 MW, D* is calculated as 3.26 m, and the grid size δx should fall within the range of 0.20 m to 0.81 m. Comparing the simulation results of four different grid sizes (0.25 m, 0.5 m, 0.6 m, and 0.8 m), the numerical temperature beneath the ceiling under different grid sizes is shown in Figure 4. As can be seen from the figure, the simulation results of the grid size of 0.8 m are lower than those of the other three grid sizes, while the simulation results of the grid size of 0.25 m, 0.5 m, and 0.6 m are very close to each other. To balance computational efficiency with accuracy, the grid size near the fire source is set to 0.25 m, and the rest of the area is 0.5 m.
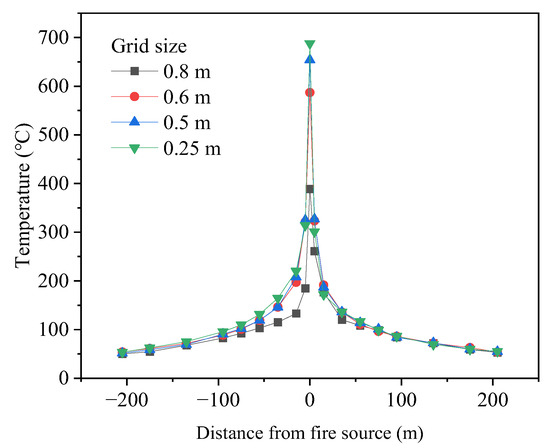
Figure 4.
The temperature distribution of the ceiling under different grid sizes.
3.3. Numerical Fire Scenarios
To investigate the impact of different asymmetric V-shaped tunnel structures on the smoke spread in the tunnel, the slope of the large-slope side tunnel was set as 3%, 5%, 7%, and 9%, and the small-slope side tunnel was set as 1%, 3%, and 5%. Due to large goods vehicles (LGVs) being forbidden in most urban tunnels, following the fire HRR of the vehicle recommended in the relative tunnel design guides, the HRR was set as 20 MW, 30 MW, and 50 MW in the simulation. The numerical scenarios are shown in Table 1, which includes three different fire powers and nine types of V-shaped tunnel structures.

Table 1.
Summary of all fire conditions.
3.4. FDS Model Validation
In order to ensure the accuracy of the study on the expansion of asymmetric V-shaped tunnels by numerical simulation, the 1:20 small-size experiment results of three slope forms of 1–3%, 3–5%, and 5–7% were compared with the numerical simulation results of the same small-size ceiling temperature along the way, as shown in Figure 5. The results show that the results of the two research methods are in good agreement, so it can be judged that the reliability of using FDS to simulate the smoke diffusion of asymmetric V-shaped tunnels is high.

Figure 5.
Comparison of the experimental ceiling temperature with those by FDS.
4. Results and Discussion
4.1. The Longitudinal Ceiling Temperature Distribution and the Maximum Ceiling Temperature
Figure 6 shows the simulation results of the longitudinal temperature distribution beneath the ceiling under different slope combinations. The longitudinal induced flow of the tunnel on the small-slope side inhibits the upward diffusion of smoke. When the slope of the tunnel on the small-slope side is constant, the temperature under the ceiling of the tunnel on the small-slope side decreases with the increase in the slope difference on both sides of the V-shaped tunnel, and the position closer to the ambient temperature on the small slope side tunnel is nearer to the fire source. When the slope of the large-slope side tunnel is 9%, there is almost no high temperature smoke in the small-slope side tunnel. With the increase in the slope difference between the two side tunnels, the temperature decay on the large-slope side slows down. When the slope difference is 2%, the influence of the slope of the small-slope side tunnel on the longitudinal temperature distribution is small. When the slope difference exceeds 4%, the difference in the temperature distribution on both sides increases with the increase in the slope of the small slope side, and the greater the length of the temperature close to the ambient temperature.
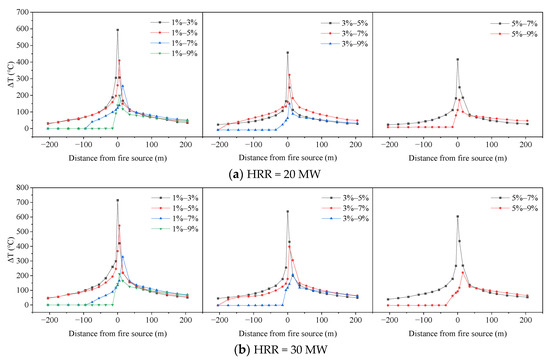

Figure 6.
Longitudinal temperature distribution beneath the ceiling under different HRRs.
The simulation results indicate that the maximum ceiling temperature decreases with the increase in the slope of the large-slope side tunnel, and the location of the maximum temperature shifts to the large-slope side. Figure 7 illustrates the ceiling temperature near the fire source from the small-scale experiments. When the slope difference between the two side tunnels is about 2%, the location of the maximum ceiling temperature occurs directly above the fire source, and it decreases with the increase in the slope of the small-slope side tunnel. When the slope difference is greater than 2%, the position of the maximum ceiling temperature is closer to the large-slope side and is about 0.125 m from the fire source. The maximum ceiling temperature decreases with the increase in the slope of the large-slope side tunnel.
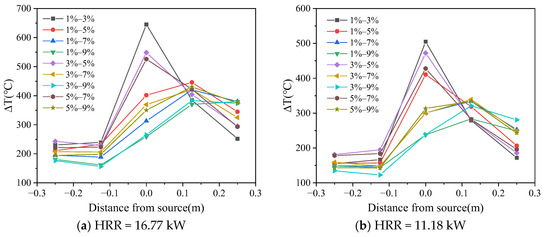
Figure 7.
The temperature of the ceiling near the fire source.
In this study, the theoretical model used for deriving the maximum temperature is based on the empirical equation proposed by Kurioka et al. [19]. Within this model, the longitudinal velocity plays a key role in influencing the ceiling temperature. Similarly, in this study, the induced velocity simulates the effects of longitudinal ventilation on the maximum temperature, and the analysis of the induced velocity will be discussed in the next section. A comparative analysis between the simulated and experimental maximum temperatures using Kurioka′s empirical equation is depicted in Figure 8, where the induced airflow velocity is considered the longitudinal ventilation velocity. The maximum temperature from the scaling experiment agrees well with the results by Kurioka′s empirical equation. This is well explained by the fact that the experimental maximum temperature rise occurs in the middle horizontal section of the tunnel. Contrastingly, the simulation results indicate an overestimation in asymmetric V-shaped tunnels when the (Q*2/3/Fr1/3)6/5 is less than 1. This discrepancy is attributed to the enhanced induced velocity causing the maximum temperature point to shift toward the large-slope tunnel sections, thereby increasing the distance from the ceiling to the fire source. The coefficient γ, derived from fitting (Q*2/3/Fr1/3)6/5 to ΔTmax/ΔTa in the simulation, was fitted to be 1.44. The comparison between the maximum temperature results from the simulations and the scaled experimental results demonstrates the feasibility of using FDS for studying fires in asymmetrical V-shaped tunnels.
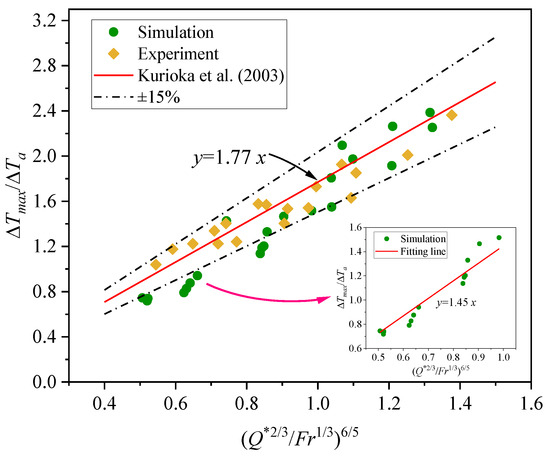
Figure 8.
Comparison of experimental and simulation results with Kurioka′s empirical equation [19].
The dimensionless temperature rise beneath the ceiling along the longitudinal direction and the dimensionless distance from a reference point of the asymmetric V-shaped tunnel are plotted. According to Equation (12), the temperature rise within the smoke back-layering length segment in the small-slope side tunnel was fitted. The results, shown in Figure 9, indicate that the R2 values are all greater than 0.95. However, the fitting results for the temperature rise in the large-slope side of the tunnel using Equation (12) are poor. In previous studies, double exponential decay functions have been employed by scholars to characterize the longitudinal ceiling temperature rise decay in tunnel fires [38,39] In this study, Equation (29) was used to model the ceiling temperature rise in the large-slope side tunnel. The fitting results are shown in Figure 10, and the temperature decay coefficients are listed in Table 2. The results indicate a good fit.
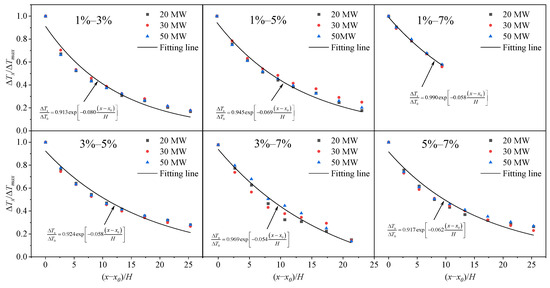
Figure 9.
Longitudinal temperature distribution in the small-slope side tunnel.
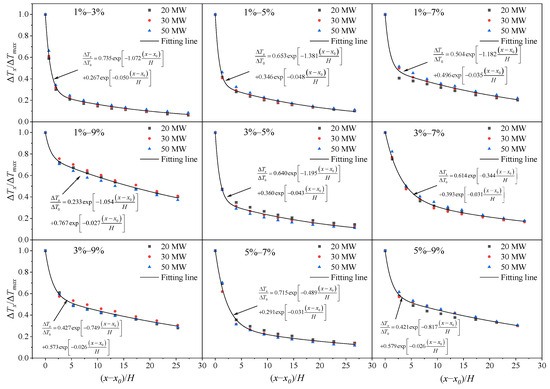
Figure 10.
Longitudinal temperature distribution in the large-slope side tunnel.

Table 2.
Summary of fitting results.
4.2. The Induced Airflow Velocity
Table 3 presents the numerical induced velocity under different fire scenarios. The induced airflow velocity is calculated by computing the flow rate at a cross-section 25 m away from the small-slope side of the tunnel entrance and dividing it by the cross-sectional area. The flow rate used is the average value of the 50 s after the steady-state stage of the smoke dispersion. The results show that the induced airflow velocity is primarily affected by the slope of the large-slope side tunnel. Comparing the induced airflow velocity results of different HRRs under the same tunnel structure, it is observed that the longitudinal induced airflow velocity increases significantly with the increase in HRR.

Table 3.
Numerical induced airflow velocity under different fire scenarios.
Combing Equation (29) with the induced airflow velocity theoretical model Equation (26), a new induced airflow velocity model is obtained as follows:
Figure 11 shows the comparisons of numerical induced airflow velocities with those predicted by Equation (30), and it can be found that the simulation results are in good agreement with those calculated by the empirical equation.
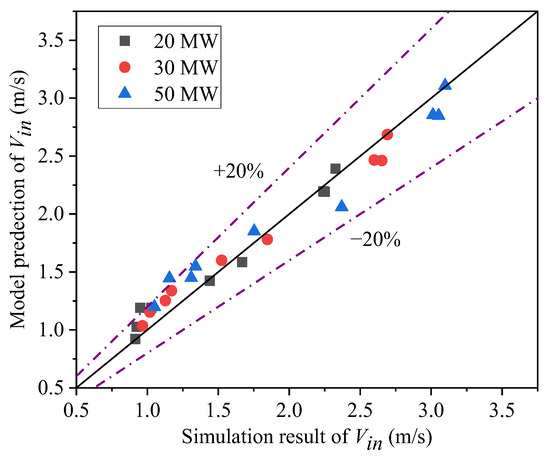
Figure 11.
Comparison of the numerical induced velocity with the results by Equation (30).
4.3. The Back-Layering Length
In asymmetrical V-shaped tunnels, due to the different buoyancy forces of the smoke, there is mutual competition between the small-slope side tunnel and the large-slope side tunnel, and this competition changes with time. Figure 12 shows the variation of smoke propagation with time when the tunnel slope structure is 1–7%. At the initial stage of the fire, the smoke spreads rapidly to the tunnels on both sides. After about 100 s, the smoke back-layering length reaches the maximum in the small-slope side tunnel and then gradually decreases to a stable value after 400 s.
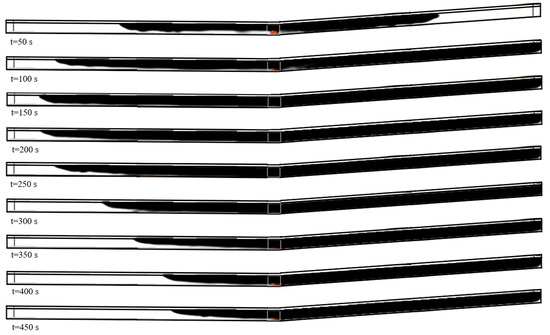
Figure 12.
Smoke spread under HRR of 50 MW, 1–7%.
Variations of smoke spreading distance with time for all asymmetric V-shaped tunnel structures with three HRRs are shown in Figure 13. The smoke spreading velocity in the large-slope side tunnel is higher than that in the small-slope side tunnel. For example, when the tunnel structure is 1–5%, the HRR is 30 MW; about 100 s later, the smoke fills the tunnel on the large-slope side tunnel, which occurs about 200 s later for the small-slope side. When the V-shaped tunnel structure is 1–3%, 1–5%, and 3–5%, the smoke fills the entire tunnel about 150 s after the fire starts. For the tunnel structure of 3–7%, after the smoke spreads to the entire tunnel, the smoke flows back toward the fire source and gradually keeps a stable value. With the increase in the slope difference between the two side tunnels, the smoke back-layering length in the small-slope side tunnel decreases.
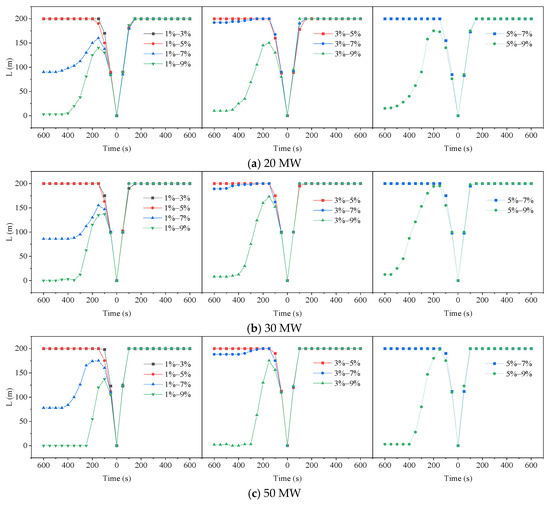
Figure 13.
Comparison of smoke spreading distance with time under different HRRs.
Comparisons of the smoke spreading distance over time within the same asymmetric V-shaped tunnel structure under different HRRs are shown in Figure 14. The results indicate that as the HRR increases, the velocity of smoke movement also increases, and the time for the smoke back-layering length to reach its steady value shortens. This is because the smoke temperature rises with the increase in HRR, enhancing the stack effect, which generates stronger induced airflow and accelerates the stabilization of smoke dispersion. The smoke back-layering lengths after stabilization in the small-slope side tunnel are found to be the same under different HRRs, and they decrease slightly with increasing HRR. This is consistent with the theoretical analysis by Equation (27). The HRR has little effect on the back-layering length. The increase in HRR not only enhances the stack effect for upward smoke propagation but also augments the longitudinally induced velocity, which mitigates smoke spread in the small-slope side tunnel. When the slope of the large-slope side tunnel is 9%, the smoke back-layering length in the small-slope side tunnel is 0, where the longitudinal induced velocity exceeds the critical velocity.
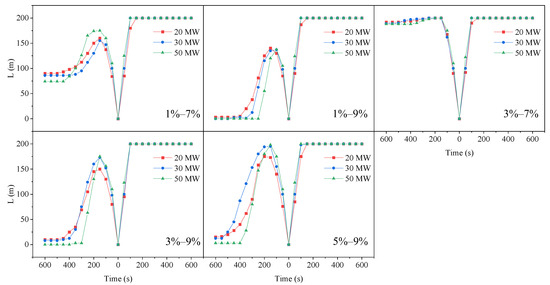
Figure 14.
Comparison of smoke spreading distance under different HRRs for the tunnel length of 410 m.
When the length of a side tunnel is 250 m and the total length of the tunnel is 510 m, the smoke spreading distance changes with time, as shown in Figure 15. The results show that the smoke backflow occurs in tunnels with slope forms of 1–5%, 1–7%, 1–9%, 3–7%, 3–9%, and 5–9%. Comparing the smoke diffusion distance of two tunnel lengths with the same slopes, the increase in tunnel length can significantly reduce the smoke diffusion distance in the small-slope side tunnel. The increase in the length of the large-slope side tunnel can significantly strengthen the stack effect and increase the induced airflow velocity. Similarly, the HRR has almost no effect on the smoke back-layering length.
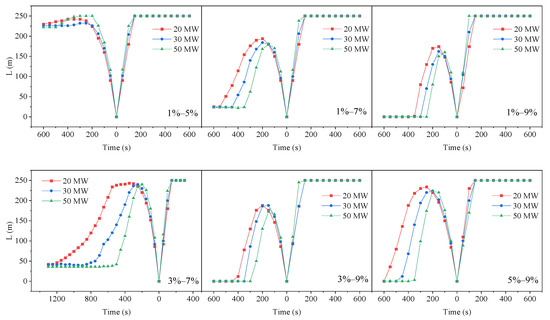
Figure 15.
Comparison of smoke spreading distance under different HRRs for the tunnel length of 510 m.
Figure 16 shows the comparisons of simulation and experiment results of the smoke back-layering length with those predicted by Equation (27). It can be seen from the figure that there are some discrepancies between the predicted results by Equation (27) and the numerical results and experimental results when the smoke back-layering length is large and the induced airflow is small. This might be due to the fact that the smoke flow entrainment effect of the small-slope sideways was ignored in the theoretical derivation process. Under this assumption, when the induced airflow velocity on the small-slope side tunnel is low, the model results are usually higher than the simulation results, while the smoke back-layering length shows the opposite trend. However, the error caused by this assumption does not affect the overall accuracy of the results and is still within an acceptable range.
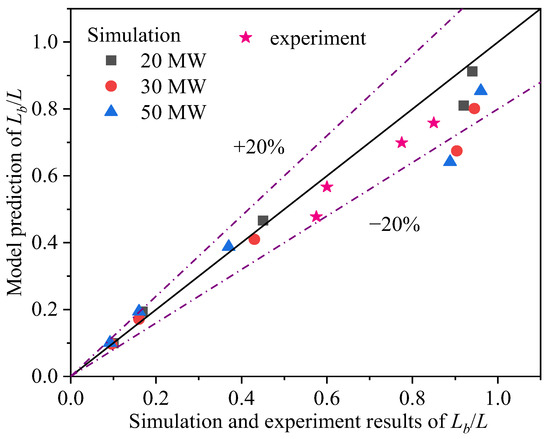
Figure 16.
Comparison of the smoke back-layering length in small-slope side tunnel calculated by Equation (27) with numerical and experimental results.
5. Conclusions
The effects of a V-shaped tunnel structure and fire HRR on the smoke spread in asymmetric V-shaped tunnels were studied by the theoretical analysis and numerical methods in this paper, and the main results are as follows:
- Based on the theoretical analysis of the smoke movement in the asymmetric V-shaped tunnels, the predictive models for the smoke back-layering length in the small-slope side tunnel and the longitudinal induced airflow velocity are proposed, and they are also validated by the numerical results.
- The maximum ceiling temperature of the asymmetric V-shaped tunnel decreases with the increase in the slope of the large-slope side tunnel but increases with the increase in the fire HRR. In addition, the position of the maximum ceiling temperature gradually moves toward the large-slope side tunnel.
- The longitudinally induced airflow velocity is mainly related to the slope of the large-slope side tunnel and the fire HRR. When the slope difference between the two side tunnels or the slope of the two side tunnels is small, the smoke spreads along both sides of the tunnel. While the slope difference or the slope of the small-slope side tunnel is large, the smoke back-layering length in the small-slope side tunnel decreases with the increase in the slope difference or the slope of the small-slope side tunnel. The increase in tunnel length significantly reduces the smoke back-layering length, and the HRR has little effect on the smoke back-layering length.
This study reveals the influence of a V-shaped tunnel structure and HRR on smoke diffusion under natural ventilation conditions. For the asymmetric V-shaped tunnels, the location of the fire source and the length of the tunnel also have great effects on the smoke diffusion and smoke flow in the tunnel. Research on these effects will be carried out in the future.
Author Contributions
Conceptualization, J.L. and Y.L.; methodology, D.T. and J.L.; formal analysis, D.T. and D.X.; writing—original draft preparation, D.T.; writing—review and editing, J.L. and Y.L.; funding acquisition, J.L. All authors have read and agreed to the published version of the manuscript.
Funding
This research was funded by the Beijing Natural Science Foundation (grant no. 8222002).
Data Availability Statement
Data will be made available on request.
Conflicts of Interest
The authors declare no conflicts of interest.
Nomenclature
| A | cross-sectional area of the tunnel (m2) |
| a | temperature decay coefficient |
| cp | specific heat capacity of air (kJ/(kg·K)) |
| de | tunnel equivalent diameter(m) |
| D* | characteristic grid length |
| F | cross-sectional area of longitudinal flow (m2) |
| g | gravitational acceleration (m/s2) |
| H | tunnel height (m) |
| k | coefficient of temperature decay |
| L | tunnel length (m) |
| Lb | length of the back-layering (m) |
| Pstatic | static pressure of the smoke front (Pa) |
| PH | thermal pressure of the smoke (Pa) |
| Phydraulic | dynamic pressure (Pa) |
| Q | fire heat release rate (kW) |
| S | flow impedance coefficient |
| T | temperature (K) |
| Vc | critical velocity (m/s) |
| Vup | longitudinal ventilation velocity (m/s) |
| Vin | induced airflow velocity (m/s) |
| x | distance from fire source (m) |
| xr | position where the maximum ceiling temperature rise occurs (m) |
| Greek Symbols | |
| γ | experimental coefficients in the maximum ceiling temperature equation of Kurioka′s model |
| ε | experimental coefficients in the maximum ceiling temperature equation of Kurioka′s model |
| θ | inclination angle of the tunnel |
| α | angle of the small-slope side tunnel |
| β | angle of the large-slope side tunnel |
| ρ | density (kg/m3) |
References
- Chow, W.K.; Wong, K.Y.; Chung, W.Y. Longitudinal ventilation for smoke control in a tilted tunnel by scale modeling. Tunn. Undergr. Space Technol. 2009, 25, 122–128. [Google Scholar] [CrossRef]
- Li, J.; Li, Y.F.; Bi, Q.; Li, Y.; Chow, W.K.; Cheng, C.H.; To, C.W.; Chow, C.L. Performance evaluation on fixed water-based firefighting system in suppressing large fire in urban tunnels. Tunn. Undergr. Space Technol. 2019, 84, 56–69. [Google Scholar] [CrossRef]
- Wang, T.Y.; Tan, L.X.; Xie, S.Y.; Ma, B.S. Development and applications of common utility tunnels in China. Tunn. Undergr. Space Technol. 2018, 76, 92–106. [Google Scholar] [CrossRef]
- Wang, J.; Gao, D.M.; Kong, X.W.; Jiang, X.P.; Lu, K.H. Water spray effects on fire smoke temperature distribution beneath a symmetrical V-shaped tunnel ceiling. Case Stud. Therm. 2023, 51, 103568. [Google Scholar] [CrossRef]
- Atkinson, G.T.; Wu, Y. Smoke control in sloping tunnels. Fire Saf. J. 1996, 27, 335–341. [Google Scholar] [CrossRef]
- Ingason, H.; Lönnermark, A. Heat release rates from heavy goods vehicle trailer fires in tunnels. Fire Saf. J. 2005, 40, 646–668. [Google Scholar] [CrossRef]
- Ingason, H.; Li, Y.Z.; Lönnermark, A. Runehamar tunnel fire tests. Fire Saf. J. 2015, 71, 134–149. [Google Scholar] [CrossRef]
- Chen, L.F.; Hu, L.H.; Zhang, X.L.; Zhang, X.Z.; Zhang, X.C.; Yang, L.Z. Thermal buoyant smoke back-layering flow length in a longitudinal ventilated tunnel with ceiling extraction at difference distance from heat source. Appl. Therm. Eng. 2015, 78, 129–135. [Google Scholar] [CrossRef]
- Du, T.; Yang, D.; Ding, Y. Driving force for preventing smoke backlayering in downhill tunnel fires using forced longitudinal ventilation. Tunn. Undergr. Space Technol. 2018, 79, 76–82. [Google Scholar] [CrossRef]
- Du, T.; Yang, D.; Wei, H.B.; Zhang, Z.J. Experimental study on mixing and stratification of buoyancy-driven flows produced by continuous buoyant source in narrow inclined tank. Int. J. Heat Mass Tran. 2018, 121, 453–462. [Google Scholar] [CrossRef]
- Fan, C.G.; Li, X.Y.; Mu, Y.; Guo, F.Y.; Ji, J. Smoke movement characteristics under stack effect in a mine laneway fire. Appl. Therm. Eng. 2017, 110, 70–79. [Google Scholar] [CrossRef]
- Gaillot, S.; Revell, A.; Blay, D.; Vantelon, J.; Deberteix, P. Contribution to the control of fire-induced smoke flow in longitudinally ventilated tunnels. Fire Saf. Sci. 2005, 8, 1449–1460. [Google Scholar] [CrossRef][Green Version]
- Hu, L.H.; Huo, R.; Li, Y.Z.; Wang, H.B.; Chow, W.K. Full-scale burning tests on studying smoke temperature and velocity along a corridor. Tunn. Undergr. Space Technol. 2005, 20, 223–229. [Google Scholar] [CrossRef]
- Thomas, P.H. The movement of buoyant fluid against a stream and the venting of underground fires. Fire Res. Notes 1958, 351, 1–7. [Google Scholar]
- Vauquelin, O. Parametrical study of the back flow occurrence in case of a buoyant release into a rectangular channel. Exp. Therm. Fluid Sci. 2005, 29, 725–731. [Google Scholar] [CrossRef]
- Vantelon, J.P.; Guelzim, A.; Quach, D.; Son, D.K.; Gobay, D.; Dallent, D. Investigation of fire-induced smoke movement in tunnels and stations: An application to the Paris Metro. Fire Saf. Sci. 1991, 3, 907–918. [Google Scholar] [CrossRef]
- Li, Y.Z.; Lei, B.; Ingason, H. Study of critical velocity and backlayering length in longitudinally ventilated tunnel fires. Fire Saf. J. 2010, 45, 6–8. [Google Scholar] [CrossRef]
- Hu, L.H.; Huo, R.; Chow, W.K. Studies on buoyancy-driven back-layering flow in tunnel fires. Exp. Therm. Fluid Sci. 2008, 32, 1468–1483. [Google Scholar] [CrossRef]
- Kurioka, H.; Oka, Y.; Satoh, H.; Sugawa, O. Fire properties in near field of square fire source with longitudinal ventilation in tunnels. Fire Saf. J. 2003, 38, 1468–1483. [Google Scholar] [CrossRef]
- Gao, Z.H.; Li, L.J.; Sun, C.P.; Zhong, W.; Yan, C.B. Effect of longitudinal slope on the smoke propagation and ceiling temperature characterization in sloping tunnel fires under natural ventilation. Tunn. Undergr. Space Technol. 2022, 123, 104396. [Google Scholar] [CrossRef]
- Hu, L.H.; Chen, L.F.; Wu, L.; Li, Y.F.; Zhang, J.Y.; Meng, N. An experimental investigation and correlation on buoyant gas temperature below ceiling in a slopping tunnel fire. Appl. Therm. Eng. 2013, 51, 246–254. [Google Scholar] [CrossRef]
- Wang, B.W.; Peng, W.; Zhong, W.; Liang, T.S. Investigation on smoke propagation behavior and smoke back-layering length of fires in an inclined tunnel under natural ventilation. Tunn. Undergr. Space Technol. 2024, 150, 105823. [Google Scholar] [CrossRef]
- Zhang, X.L.; Lin, Y.J.; Shi, C.L.; Zhang, J.P. Numerical simulation on the maximum temperature and smoke back-layering length in a tilted tunnel under natural ventilation. Tunn. Undergr. Space Technol. 2021, 107, 103661. [Google Scholar] [CrossRef]
- Chow, W.K.; Gao, Y.; Zhao, J.H.; Dang, J.F.; Chow, C.L.; Miao, L. Smoke movement in tilted tunnel fires with longitudinal ventilation. Fire Saf. J. 2015, 75, 14–22. [Google Scholar] [CrossRef]
- Meng, N.; Yang, W.Y.; Xin, L.; Li, X.; Liu, B.B.; Jin, X.N. Experimental study on backlayering length of thermal smoke flow in a longitudinally ventilated tunnel with blockage at upstream of fire source. Tunn. Undergr. Space Technol. 2018, 82, 315–324. [Google Scholar] [CrossRef]
- Salizzoni, P.; Creyssels, M.; Jiang, L.; Mos, A.; Mehaddi, R.; Vauquelin, O. Influence of source conditions and heat losses on the upwind back-layering flow in a longitudinally ventilated tunnel. Int. J. Heat Mass Tran. 2018, 117, 143–153. [Google Scholar] [CrossRef]
- Huang, Y.B.; Luo, C.J.; Liu, X.; Tang, F.; Dong, B.Y.; Zhong, H. Evaluating the smoke back-layering length and critical velocity in branched tunnel fire with sloped mainline: An experimental study. Tunn. Undergr. Space Technol. 2024, 143, 105498. [Google Scholar] [CrossRef]
- Li, J.X.; Li, Y.F.; Li, J.; Zhong, H.; Zhao, J.L.; Xu, D.S. Experimental analysis of the effect of the ramp slopes on the maximum exceedance temperature in a branched tunnel fire. Tunn. Undergr. Space Technol. 2023, 131, 104829. [Google Scholar] [CrossRef]
- Yang, D.; Ding, Y.; Du, T.; Mao, S.H.; Zhang, Z.J. Buoyant back-layering and the critical condition for preventing back-layering fluid in inclined tunnels under natural ventilation: Brine water experiments. Exp. Therm. Fluid Sci. 2018, 90, 319–329. [Google Scholar]
- Shafee, S.; Yozgatligil, A. An analysis of tunnel fire characteristics under the effects of vehicular blockage and tunnel inclination, Tunn. Undergr. Space Technol. 2018, 79, 274–285. [Google Scholar] [CrossRef]
- Caliendo, C.; Genovese, G.; Russo, I. A 3D CFD modeling for assessing the effects of both longitudinal slope and traffic volume on user safety within a naturally ventilated road tunnel in the event of a fire accident. IATSS Res. 2022, 46, 547–558. [Google Scholar] [CrossRef]
- Du, T.; Li, P.; Wei, H.B.; Yang, D. On the backlayering length of the buoyant smoke in inclined tunnel fires under natural ventilation. Case Stud. Therm. 2022, 39, 102455. [Google Scholar] [CrossRef]
- Yu, L.; Lei, X.; Huang, P.; Liu, C.; Zhang, H.; Yang, F. Study on the combination effect of tunnel slope and longitudinal fire location on the asymmetric flow fields in a naturally ventilated tunnel. Tunn. Undergr. Space Technol. 2024, 146, 105623. [Google Scholar] [CrossRef]
- Jiang, X.P.; Chen, X.G.; Xiao, N.Q.; Liao, X.J.; Fan, C.G. Influence of the competitive effect of V-shaped slope tunnel on smoke characteristics. Tunn. Undergr. Space Technol. 2021, 118, 104193. [Google Scholar] [CrossRef]
- Sun, C.P.; Weng, M.C.; Liu, F.; Ling, K.W. Study on the smoke flow characteristics in inclined tunnel with an upstream shaft under natural ventilation. Tunn. Undergr. Space Technol. 2024, 149, 105806. [Google Scholar] [CrossRef]
- McGrattan, K.; Bilson, M. Modeling longitudinal ventilation in tunnels using fire dynamics simulator. Fire Saf. J. 2023, 141, 103982. [Google Scholar] [CrossRef]
- Wang, Z.Y.; Ji, J.; Tan, T.T.; Gao, Z.H.; Zhou, Y.; Zhou, F. Numerical study on the critical criterion for predicting the plug-holing under lateral mechanical exhaust in tunnel fires: Considering the effect of smoke flow in longitudinal direction. Tunn. Undergr. Space Technol. 2022, 128, 104666. [Google Scholar] [CrossRef]
- Gong, L.; Jiang, L.; Li, S.; Shen, N.; Zhang, Y.C.; Sun, J.H. Theoretical and experimental study on longitudinal smoke temperature distribution in tunnel fires. Int. J. Therm. Sci. 2016, 102, 319–328. [Google Scholar] [CrossRef]
- Li, Y.Z.; Ingason, H. Fire-Induced Ceiling Jet Characteristics in Tunnels under Different Ventilation Conditions; SP Technical Research Institute of Sweden: Växjö, Sweden, 2015. [Google Scholar]
Disclaimer/Publisher’s Note: The statements, opinions and data contained in all publications are solely those of the individual author(s) and contributor(s) and not of MDPI and/or the editor(s). MDPI and/or the editor(s) disclaim responsibility for any injury to people or property resulting from any ideas, methods, instructions or products referred to in the content. |
© 2024 by the authors. Licensee MDPI, Basel, Switzerland. This article is an open access article distributed under the terms and conditions of the Creative Commons Attribution (CC BY) license (https://creativecommons.org/licenses/by/4.0/).