Abstract
A safe separation distance (SSD) needs to be considered during firefighting activities (fire suppression or people evacuation) against wildfires. The SSD is of critical interest for both humans and assets located in the wildland–urban interfaces (WUI). In most cases, the safety zone models and guidelines assume a flat terrain and only radiant heating. Nevertheless, injuries or damage do not result exclusively from radiant heating. Indeed, convection must be also considered as a significant contribution of heat transfer, particularly in the presence of the combined effects of sloping terrain and a high wind velocity. In this work, a critical case study is considered for the village of Sari-Solenzara in Corsica (France). This site location was selected by the operational staff since high-intensity fire spread is likely to occur in the WUI during wind-blown conditions. This study was carried out for 4 m high shrubland, a sloping terrain of 12° and a wind speed of 16.6 m/s. The numerical simulations were performed using a fully physical fire model, namely, FireStar2D, to investigate a case of fire spreading, which is thought to be representative of most high wildfire risk situations in Corsica. This study is based on the evaluation of the total (radiative and convective) heat flux received by two types of targets (human bodies and buildings) located ahead of the fire front. The results obtained revealed that the radiation was the dominant heat transfer mode in the evaluation of the SSD. In addition, the predictions were consistent with the criterion established by the operational experts, which assumes that in Corsica, a minimum SSD of 50 m is required to keep an equipped firefighter without injury in a fuelbreak named ZAL. This numerical work also provides correlations relating the total heat flux to the SSD.
1. Introduction
Wildfires are a complex mechanism of the interaction between environmental parameters (fuel particles, terrain slope, wind and ambient properties) and physical processes (heat and mass transfers, combustion). These interactions, which occur over a wide range of space and time scales, regulate their behavior [1,2]. The main issue nowadays is the emergence of high-intensity fire events. These extreme fires are very difficult to control and often overwhelm suppression capabilities [3]. It should be noticed that the effectiveness of ground and aerial firefighting is limited by a fireline intensity of 4000 kW/m and 7000 kW/m, respectively [4,5]. These limits are very often exceeded and will be even more so in the future. Climate change and global warming tend to extend the fire season and combine heat waves and droughts. As a result, an increase in the frequency and severity of wildfires is observed [3,6,7]. In addition, human activities such as agricultural land abandonment and expansion of the wildland–urban interfaces (WUIs) also lead to an increase in wildfire risk.
The concept of the WUIs was introduced for the first time by Butler [8], who defined it as any area where the fuel consumed by the fire changes from being a wildland natural fuel (vegetation) to urban fuel (homes). In these areas, the correlation between human activities and wildfires is strong, meaning that there are more opportunities for fires to ignite and spread [9]. The risk is the highest in the WUIs not only because of the high ignition hazard, but also because of the concentration of vulnerable populations, ecosystems, infrastructure and buildings. A significant development of the WUIs is observed in many parts of the world, especially in the USA, Canada [10,11], Argentina [12], Australia [13] and South Africa [14]. Consequently, the growth of the WUIs over the years resulted in more wildfire ignitions, putting more lives and houses in danger. For instance, the WUIs in the United States witnessed an exponential growth between 1990 and 2010 with an increase of 41% in the number of houses and 31% in land areas [15]. According to the latest data, more than 46 million homes in 70,000 communities, with an estimated value of USD 1.3 trillion, are now at risk of wildfires in the USA [16]. Over the last decades, the WUIs in southern Europe also had such issues, particularly in the Mediterranean regions, where 90% of the wildland fires were caused by human activities [17,18,19]. In these regions, homes and people became increasingly heavily threatened and impacted by these events such as the fires that occurred in France, Portugal and Spain in 2003, in Portugal and Spain in 2005 and 2006, in Greece in 2007 [20,21] and in Portugal [22] and Greece in 2018 [7]. More recently, many European countries have experienced severe summer heatwaves and droughts, resulting in the most destructive year on record since 2006 [23]. For example, the extreme wildfires that occurred in France (Gironde) in July and August 2022 resulted in nearly 30,000 hectares burnt, a record since the massive fires of 1949, and also 50,000 preventive evacuations [24]. In Portugal, due to an exceptional drought, fires burned more than 100,000 hectares in 2022, the largest area since the deadly fires that burned more than 530,000 hectares in 2017 [25]. These destructive wildfires have unfortunately become the norm in many regions.
Raising public awareness regarding the wildfire issues led to an increase in interest from the scientific community. In this context, intensive efforts are underway to prevent fire hazards, mitigate their impacts and improve firefighting safety, in particular, for firefighters who need to maintain a safe separation distance (SSD) from the fire front [26,27] to avoid being injured or trapped. The SSD is also useful for the construction of fuelbreaks in order to reduce the spread of a wildfire and enhance safety and efficiency during suppression operations. Finally, the SSD can be very helpful for wildfire prevention, emergency planning and the building of infrastructures (houses, roads, etc.) with vegetation in the surrounding area.
As the SSD depends on the intensity of the fire as well as the dominant heat transfer mode and duration, the overriding issue is to accurately define the minimum distance required between a fire and the people or structures to prevent injuries or damages [28]. Usually, operational models [28,29,30,31,32] evaluate the SSD for a vulnerability threshold of 7 kW/m2 which corresponds to the maximum heat flux value that an equipped firefighter could withstand without injury. Several guidelines and models were developed to help firefighters estimate the separation distance to the flames. The earliest guidelines were developed for fuelbreak dimensioning, based on the radiation heat transfer mode during high-intensity bush fires [33]. A later model was related to the flame geometry, suggesting that the separation distance for firefighters should be at least four times the flame height [31,32]. Additionally, other physical models based on the radiant heating, using similar approaches with different assumptions regarding flame front width and temperature, were developed to estimate the SSD [30].
Despite their wide use, these models suffer from some limitations. Some models use empirical relationships between the fireline intensity [34,35] and flame geometry estimated from statistical fitting approaches [36,37,38,39,40]. Therefore, the use of these relationships requires the knowledge of their limitations in assessing the SSD, especially for fuel types that are structurally very different. In addition, all these models are only based on radiative heating without considering the convection that may have a non-negligible contribution, particularly in the presence of strong wind and a steep slope. Butler et al. [41] discussed the necessity of using field measurements of radiation and convection in order to improve the existing safety zone guidelines. Additionally, physical formulations are efficient in assessing the SSD because such modelling approaches do not only predict the fire front dynamics, but also the potential fire impact, by determining the radiative and convective heat fluxes impinging on targets [42,43].
This study aims to evaluate the SSD for different target types (humans and structures) based on the maximum total heat fluxes received at different positions, using a fully physical fire model, namely, Firestar2D [44,45,46,47,48,49]. This work lies within the framework of the GOLIAT project [50], whose objectives are to develop tools for firefighting and land management [51]. This study follows the request of the GTI (Groupe Technique Interdépartemental) in Corsica, and it aims to show the relevance of scientific contribution and physical modelling in evaluating the effectiveness of the SSD. To date, their scale is evaluated according to operational experts and is assumed to be equal to 50 m around habitations [52]. Therefore, this study was carried out in close collaboration with the operational team in order to provide useful information, and in particular, the correlations relating SSD to the heat fluxes emitted by the fire front. The concerns of this study are closely linked to the potential damage caused by high-intensity fire events on people and buildings. For this purpose, the sectors exposed to wildfire risk in Corsica were identified during visits to several locations. A study area in the WUI (shrubland vegetation) was finally selected in the south-eastern region of Corsica. Ambient conditions representative of the summer period were chosen by the operational staff in order to obtain a high-intensity fire.
In the next section, the selected site and fire spread conditions are described. Then, the configuration and the modelling approach used in the FireStar2D model are presented. Finally, the numerical results concerning the high-intensity fire dynamic and the evaluation of the SSD for both humans and buildings are discussed.
2. Materials and Methods
2.1. Characteristics of the Case Study
2.1.1. Site Description
Corsica (France) provides a unique study area for fire risk research. On this island, it is estimated that among 360 villages or towns, about 200 are subject to wildfire risk and have a high probability that such events would affect people, homes and infrastructures [53]. The susceptibility to wildfires in this area is not only due to climatic change, but also to the vegetation characteristics (type and cover). Indeed, the vegetation growth due to land abandonment resulted in dense and flammable fuel [54]. The risk increases during summer periods with increasing population (doubles) in this popular touristic region. Population in agglomerations doubles and human frequentation expands in isolated fire-prone areas (outdoor activities in forests or mountains, nature campsites, car parking near seashore, etc.) [55]. Therefore, the site selected for this study, located in the commune of Sari-Solenzara (41°50′13″ N 9°22′23″ E) in the south-eastern region of Corsica (Figure 1), represents an illustration of some WUIs where the risk of wildfires threatening the lives and properties of the people is very significant. This site has the particularity of having a house at the top of an inclined terrain covered by a dense vegetation composed of high shrubs (Figure 2). The terrain slope was evaluated using GPS measurements on site. An average value of 12° was obtained along the main propagation axis of a most-likely fire.
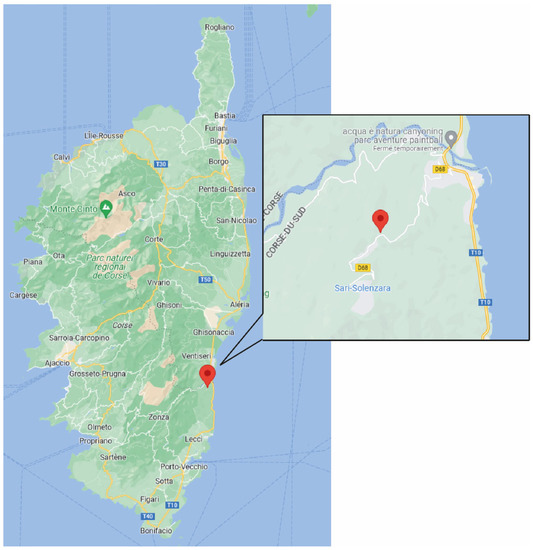
Figure 1.
Localization of the commune of Sari-Solenzara and study site.
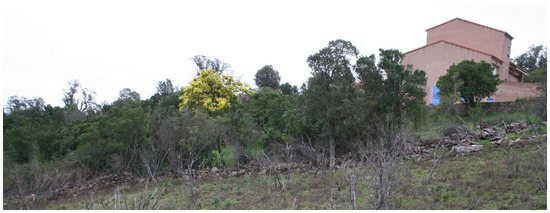
Figure 2.
Vegetation cover and house in the WUI considered for this study.
2.1.2. Characterization of the Vegetation and Meteorology
As mentioned previously, this site was selected for the apparent structural homogeneity of its vegetation layer mostly composed of 4 m high shrubland with a cover > 90%. The vegetation is one of the most important factors affecting the fire dynamics. So, vegetation modeling is essential for the purpose of predicting wildfire behavior and to assess its impact on targets. This topic is relevant to many people, from the fire modeler to the fire and land managers. The fuel model concept was developed in the USA as a way to accommodate the detailed and complex fuel input requirements of Rothermel’s fire spread model [56]. It should be noted that, for the same vegetation typology, the fuel model may be different according to the fire model used. Nevertheless, the need to develop customized fuel models for the specificities of southern European vegetation is well-recognized [57]. Thus, a fuel model, used in two previous studies [42,43], was adapted to consider the local shrubland in the study site and to be applied as inputs to FireStar2D. The physical and thermochemical characteristics of both live and dead particles forming the fuel layer are listed in Table 1. These characteristics were determined from field sampling for accurate representation.

Table 1.
Fuel model: main average properties of dead Corsican shrubland particles as well as the live fuel particle characteristics mentioned between brackets.
Concerning the environmental conditions, in consultation with the members of the GTI group, it was decided to apply particular conditions, called “critical case”, that could generate high-intensity fire. Firstly, the wind intensity and direction along the main slope direction were assumed to remain constant at a speed of 60 km/h (16.7 m/s) at 10 m above the ground. Secondly, the air temperature and relative humidity considered are those of a hot and dry period, and they are equal to 35 °C and 20%, respectively.
2.1.3. Description of the Targets
In order to study the impact of a high-intensity fire, two different targets were selected and are described in this section; the targets are a human body and a building.
- Human body target: A person with an average height of 1.70 m is considered as the target for the calculation of the different heat fluxes (radiative and convective). As shown in Figure 3, the person is assumed to be standing perpendicular to the ground at a distance d from the flame front.
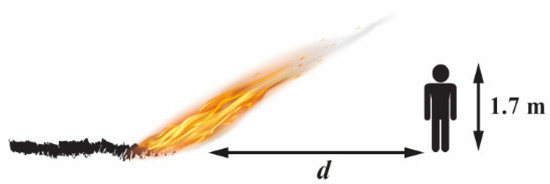 Figure 3. Configuration of the “human body” target with respect to the flame front position.
 - Building target: A three-level building with a 10 m wide façade is considered. R0 is the level at 0 m, R1 is the level at 3 m, R2 at 6 m and the roof R3 at 9 m (Figure 4). Radiative and convective heat fluxes are assessed at these levels, and the SSD values are then determined based on the maximum tolerable heat flux related to the type of construction material at each level of the building.
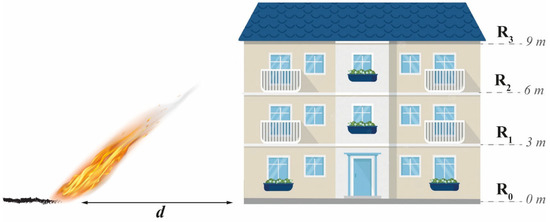 Figure 4. Configuration of the “building” target with respect to the flame front position.
2.2. Numerical Method
2.2.1. Numerical Configuration
Numerical simulations were conducted using the fully physical fire model FireStar2D based on multiphase formulation [58]. This 2D model was validated from calculations carried out at different scales and homogeneous vegetation types, and the predictions obtained were compared to experimental results, empirical and semi-empirical models [43,45,49,59,60]. In addition, FireStar2D appears to be suitable for operational works since it does not only provide results for fire dynamic, but also valuable estimations of the fire front impact in the case of high-intensity fire events with a reasonable computing time (almost 24 h for a simulation in this studied case) [43].
The mathematical model used in this 2D numerical approach consists of space-averaging the conservation equations (mass, momentum, energy, etc.) governing the behavior of the coupled system formed by the vegetation and the surrounding atmosphere. This averaging is performed on elementary control volumes including both the gaseous phase and the solid phase representing the vegetation. The model consists of two parts that are solved on two distinct grids. The first part involves the equations of a reactive turbulent flow in the gas phase composed by a mixture of fresh air with the gaseous products from the solid phase degradation (by drying, pyrolysis and heterogeneous combustion) and its homogeneous combustion in the flaming zone. The second part consists of the equations governing the state and the composition of the solid phase subjected to an intense heat flux coming from the flaming zone. The interaction between the gaseous and the solid phases (mass transfer, drag, heat fluxes, etc.), is obtained through coupling terms that appear in both parts of the model. The details of FireStar2D model are thoroughly described in previous works. The reader is invited to consult the references [44,45,46,47,48,49] for more information about this 2D model and for a comparison with other wildfire tools available within the literature.
The 2D computational domain used for the simulations was 190 m long and 40 m in height (Figure 5), and the vegetation layer of height e = 4 m and 100 m long is located 20 m away from the domain inlet. In the fuel model used in this study (Table 1), an average value for each parameter is considered regarding dead and live fuel particles, which leads to an equivalent vegetation model considering a single species in a homogenous stratum. For instance, the total fuel load is equal to the sum of dead and live fine particle loads (Table 1), which gives a value of kg/m2 . These loads are also used to evaluate the distribution of dead and live particles within the fuel bed (33.2% dead and 66.8% live). The fuel volume fraction is then obtained and is given by the following:
where is the total dry fuel load, is the fuel density and e is the average vegetation height. This parameter is equal to .

Figure 5.
Computational domain and boundary conditions used in the 2D simulations.
Concerning the surface area to volume ratio, the equivalent value of this parameter is equal to m−1 ( (Table 1). Finally, the equivalent fuel moisture content between live and dead fine particles is equal to FMC = 69.45% (FMC = (Table 1).
Concerning the mesh size in the computational domain, both solid and fluid phase grids were characterized by cells sizes below the radiation extinction length scale within the vegetation given by 4/sβ [61], where s is the surface to volume ratio of the vegetation (m−1) and is the volume fraction of the solid phase. Ignition was obtained by injecting CO gas at 1600 K from the ground during 5 s and with a constant velocity of 1 m/s. It is activated after 30 s of simulation time when a statistically steady profile of the turbulent boundary layer inside and above the fuel bed is reached [49].
The simulation was carried out for a 10 m open wind speed U10 = 16.6 m/s (assuming a one-seventh power wind velocity profile at the inlet of the computational domain) and for a slope angle α = 12°. Open boundary conditions are applied at the top of the domain and an outflow is assumed at the domain outlet. The inclination angle was specified through two non-zero components of gravitational acceleration as follows: and , where g = 9.81 m/s2 is Earth gravity. All the input parameters of FireStar2D concerning the fuel characteristics, meteorological and topographical conditions are listed in Table 2.

Table 2.
Main average properties of the vegetation, meteorological and topographical conditions.
2.2.2. Calculation Methods
- Rate of spread
The rate of spread (ROS) represents one of the main parameters that characterize wildland fire behavior. Using FireStar2D [49,59], the ROS is evaluated based on the variation with time of the pyrolysis front position at the fuel bed surface when the fire front reaches a steady state.
- Fireline intensity
The fireline intensity using FireStar2D is evaluated as follows:
where is the vegetation heat yield and is the mass loss rate due to pyrolysis and charcoal combustion. The mas loss rate [49,59] is given by the following:
where and represent the rate of dry material pyrolysis and charcoal combustion in the solid phase, respectively.
- Heat fluxes
Both radiative and convective heat transfer play a critical role in assessing fire impact. The dominant heat transfer mode depends on the wind conditions and terrain slope. These parameters influence the flame inclination angle, and therefore, the heat fluxes received by the target located ahead of the fire front.
In FireStar2D, the evaluation of the radiative heat transfer is based on the total irradiance J, given in Equation (4) [59], calculated by the integral of the radiation intensity I in every direction.
The radiation intensity I is obtained from the contribution of both soot particles produced in the flame and the embers located behind the fire front. The variation of the radiation intensity I along an optical path S, is obtained from the radiation transfer equation (RTE) that describes its propagation through an absorbing and an emitting medium. The RTE is given by the following:
where sg is the absorption coefficient of the gas/soot mixture, βg is the volume fraction of the gaseous phase, and B is the Stephan–Boltzmann constant. Equation (5) is solved in FireStar2D using the discrete ordinates method (DOM) for a finite number of directions [62].
Concerning the convective heat flux, it is calculated using Newton’s law of cooling [63] as follows:
where is the difference between the gas mixture temperature that can be evaluated at every position in the computational domain, and the target temperature (assumed to be equal to the ambient temperature), and is the convective heat transfer coefficient calculated using empirical correlations for laminar or turbulent fluids, and its evaluation is based on the target type. The model proposed by Oguro et al. [64] was considered for a standing human body target. This model was tested up to a wind speed of 6 m/s. For a building target, the MOWITT model [65] was used, which was validated for wind speeds up to 12 m/s. In the correlations established in these two models, air properties evaluated at ambient temperature were taken into account.
When the target is a human body, is assumed to be equal to 34.2 °C [66] and is given in Equation (7) [64] as follows:
where U is the speed of the fluid flow evaluated at the target position.
With regard to the building target, there are different methods to determine the convective heat transfer coefficient for evaluating the convective heat exchange between the external environment (turbulent flow generated by a wildfire) and the façade of the building. Analytical methods are only applicable for some specific flow regimes and simple geometries such as flat plates or cylinders [67]. Numerical methods are powerful tools to calculate ; however, these simulations need large computational resources and the results need improvements [68]. So, the experimental methods, both from reduced and full scale tests, are still the main source of evaluation for . Considering the complexity involved in the evaluation of this parameter, previous experimental research has led to a variety of models proposing empirical methods to estimate this parameter. Mirsadeghi et al., reviewed these models in a detailed paper [69]. In this study, the MOWITT model [65] is used to evaluate the convective heat transfer between fire generated flow and the façade of the building. This model is based on large-scale experiments and proposes the following expression of the convective heat transfer coefficient:
where is the turbulent natural convection constant, is the surface temperature supposed to be equal to the ambient temperature and is the gas mixture temperature. V0 represents the gas flow speed and a and b are the constants for windward and leeward surfaces. In this case, the constants corresponding to the windward surface are used (Table 3). According to Equation (8), this correlation includes components of both natural and forced convection in such a way that the effect of each component, in its region, dominates the calculation [65]. The results provided by this model show a good agreement with the experimental measurements compared to some other existing models. As a result, the constants a and b have a low level of uncertainty. It is worth mentioning that this model is implemented in different building energy simulations (BES) and simulation codes that represent important tools in building design and operation [70]. Consequently, the use of this correlation is assumed as a correct representation of the convective heat transfer between the flame and the vertical windward surface of the building considered in the present study.

Table 3.
Values of the constants evaluated using the MOWITT model.
3. Results and Discussion
3.1. Fire Behavior
The numerical simulation of the fire behavior predicts a value of ROS = 1.9 m/s (time derivative of the pyrolysis front position as shown in Figure 6) and a fireline intensity 45 MW/m. These results reveal an extreme wildfire event with rapid fire spread and very high fireline intensity that can easily overwhelm suppression efforts. For comparison purposes, a surface fire propagating across shrubland, grassland or forest, with an intensity lower than 2 MW/m, is moderately difficult to control with ground means, whereas between 4 and 10 MW/m, it becomes very or extremely difficult to fight, especially when the flame length is in the range between 3.5 and 10 m [4,5]. In this case, any terrestrial attempt to contain the fire’s head may fail. Moreover, for a fire intensity exceeding 10 MW/m as in this study, an uncontrollable extreme fire behavior occurs where the direct attack of the fire front, even with aerial means, becomes inefficient. Ground or aerial actions can only be performed when atmospheric conditions are less severe, such as with lower air temperature level, higher relative air humidity and lower wind velocity. It is obvious that the order of magnitude of these results is relatively high and is not frequently observed by field operators, but this is justified by the fact that a constant strong wind (60 km/h) is assumed in the direction of the slope (12°) with a high ambient temperature (35°) and low relative air humidity (20%). It is not often the case that such extreme conditions occur, but these considerations were taken into account to increase the safety margin when using these results by operational staff.
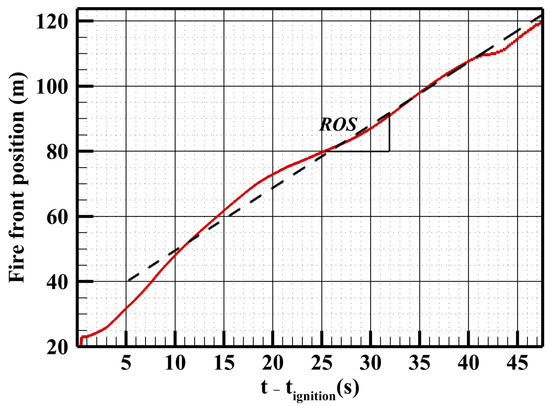
Figure 6.
Variation with time of the furthermost point of the pyrolysis front at the fuel bed surface obtained by FireStar2D after ignition time.
3.2. Fire Impact
The evaluation of the SSD in this studied case, for both human bodies and buildings, is based on the radiative and convective heat fluxes received by these targets, when the flame front reaches the end of the vegetation area as shown in Figure 7. It is assumed that there is no surface fuel between the target and the end of the plot.
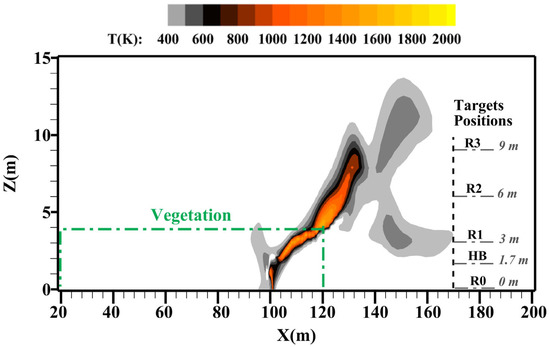
Figure 7.
Instantaneous temperature field obtained using FireStar2D when the fire front reaches the end of the plot.
Once the heat transfer between the fire front and the target is evaluated as a function of distance, the consequences for people and buildings can be estimated using vulnerability threshold values related to the target type. For example, the maximum tolerable value of heat flux for people without protection is considered to be equal to 5 kW/m2, which is quite different for a firefighter wearing clothes that are resistant to thermal radiation and cover almost the whole surface of the body. In this case, a maximum of 7 kW/m2 is considered. It is worth mentioning that the heat flux threshold may vary if the duration of exposure is considered. For example, according to the API 521 [71], for a thermal radiation of approximately 5 kW/m2, the time to reach the pain threshold is on the order of 16 s. Hence, an individual would react to an emergency release before feeling pain [72]. Therefore, API 521 suggests a tolerable level of 6.3 kW/m2 for situations in which emergency actions lasting up to 1 minute may be required by personnel without shielding or wearing appropriate clothing. For a continuous exposure, a threshold of 1.58 kW/m2 is suggested.
Table 4 shows examples of heat flux thresholds for non-protected people, firefighters and some building materials that can be found in buildings such as steel, wood and plastic materials (polystyrene, expanded polyurethane, PVC, etc.).

Table 4.
Consequences of different thermal flux threshold values for different target types [73,74,75,76].
3.2.1. Human Body Target
Figure 8 shows the time evolution of the radiative heat fluxes, calculated with FireStar2D, for a person located at distances of 10, 20, 30, 40 and 50 m from the end of the plot.
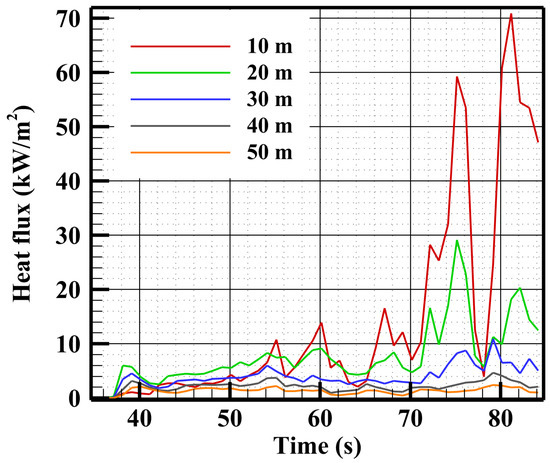
Figure 8.
Variation with time of the radiative heat fluxes received by the human body at different positions ahead of the plot end.
Figure 9 shows that the variation of the maximum radiative heat flux (Qrad) received by the target follows an exponential curve as a function of the distance d to the flame front. For instance, if the target considered is a firefighter with equipment who can withstand a flux of less than 7 kW/m2 without injury (Table 4), the SSD for this threshold value, considering only the radiative heat flux, can be determined graphically, and it gives a value of SSD = 36.3 m (Figure 9).
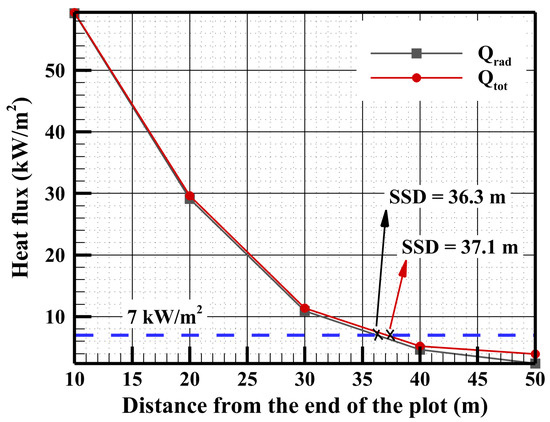
Figure 9.
Maximum radiative heat fluxes received by the human body at different positions ahead of the fire front when the flames reach the end of the vegetation area.
By introducing the convective heat transfer contribution, the total heat flux (Qtot), which is the sum of the radiative and convective heat fluxes, also follows an exponential pattern as a function of the distance between the flame front and the human body (Figure 9). In this case, the SSD value evaluated graphically is equal to 37.1 m. Therefore, considering the convection contribution increases the SSD by less than 2%. For instance, previous high-intensity surface fires conducted in shrubland vegetation show almost the same order of magnitude of convective heat fluxes received by fluxmeters (height < 3 m) located beyond 6 m from the plot end [42,43]. Knowing that the convection contribution is related to the contact between the flame and the target, it is then dependent on the flame inclination angle, and especially the orientation of the hot gases. Figure 7 shows that for a person with a height of 1.7 m, there is no significant contact between the flame and the target. Consequently, small convective fluxes were obtained with a dominance of the radiative heat transfer at different distances ahead of the fire front.
This result also confirms that the theoretical SSD models, even when based on the radiative heat transfer only, can be used to assist operational staff in making decisions about such high-intensity wildfire behavior. According to some previous models, for flame heights below 10 m and slopes less than 25%, the SSD required ranged from 20 to 50 m to ensure no more than 1 or 5% probability of fatal injury without the use of a fire shelter [77]. However, when the flame height exceeds 10 m, for all the combinations of fire shelters and probability levels, the SSD ranges from one to four times the flame height [28,30,77]. In this studied case, where the slope is moderate (21%), an average flame height Hf between the top of the visual flame (at a hot gas isotherm of 1000 K) and the ground surface was numerically predicted, and it is equal to Hf 8 m. Therefore, when comparing the results obtained using FireStar2D and these previous empirical models, a 50 m SSD may be sufficient to prevent fatal injuries. However, a newly proposed guideline assumes that the flame height of a crown fire is approximately twice the vegetation height, taking into consideration a slope wind factor to account for the convective heat transfer mechanism [78]. As a result, the SSD evaluated using this model becomes three to four times higher than the value evaluated numerically in this study. It is worth mentioning that the case studied represents a surface fire type, which means that a further study on crown fires will be carried out in a future work in order to compare the results with the empirical models considering this type of vegetation.
3.2.2. Building
The fire impact on a building was studied by evaluating the radiative (Figure 10), convective (Figure 11) and total heat fluxes (Figure 12) received by a four-level construction (0, 3, 6 and 9 m) at different positions ahead of the fire, when the fire front reaches the end of the vegetation area.
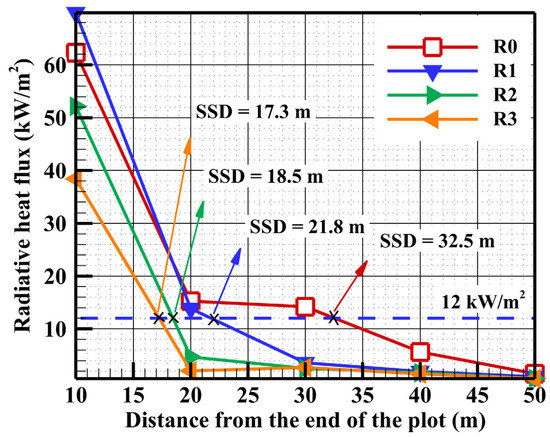
Figure 10.
Variation of the radiative heat fluxes received by each level with respect to the distance separating the building from the fire front.
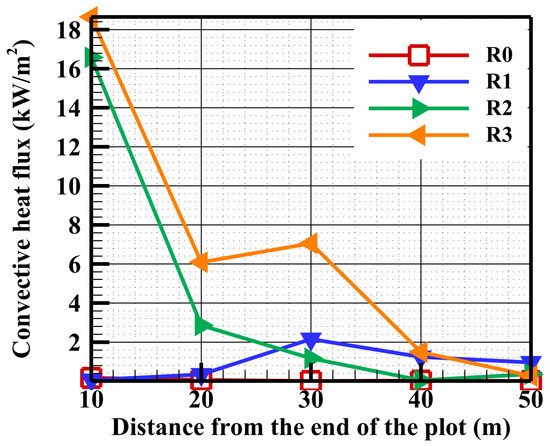
Figure 11.
Variation of the convective heat fluxes received by each level with respect to the distance separating the building from the fire front.
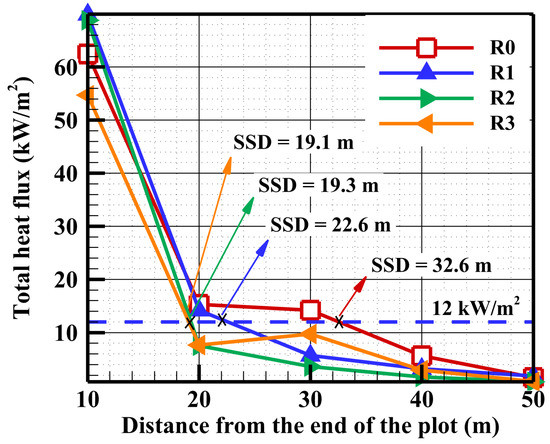
Figure 12.
Variation of the total heat fluxes received by each level with respect to the distance separating the building from the fire front.
For instance, taking the example of the maximum tolerable value for the wood ignition (Qtot = 12 kW/m2), the safe separation distances to prevent damage evaluated graphically, considering only the radiative contribution, are 32.5 m, 21.8 m, 18.5 m and 17.3 m for the levels R0, R1, R2 and R3, respectively (Figure 10). Considering the convective heat transfer, these values increase to 32.6 m, 22.6 m, 19.3 m and 19.1 m, respectively (Figure 12). These results reveal that the radiation contribution was the dominant factor in evaluating the SSD at the different levels of the building. In addition, the results in Figure 11 show that the convection contribution was significant for a separation distance lower than 30 m and it increases globally with the building level height. Nevertheless, the convection at certain levels (R1 and R3 (Figure 11)) do not exactly match this tendency, and this may be due to the movements of the hot gases that do not follow a unique direction, as shown in Figure 7. Consequently, while the radiation globally follows an exponential decrease with distance for the different levels, the convective heat transfer is more dependent on the combination of the target elevation and position, because they both affect the contact between the hot gas flows and the levels of the building. Finally, regardless of the construction material type, the graphical evaluation of the SSD can be made using Figure 12 based on the thermal flux threshold that the target can withstand without damage.
3.2.3. Numerical Correlations for the SSD Evaluation
One of the main objectives of this study was to establish correlations that can be used by the firefighters in order to determine the total heat flux at each position ahead of the fire front, and especially to evaluate the safe separation distance in the case of a high-intensity fire. These correlations are derived from the results shown in Figure 9 and Figure 12 and can be represented by the following general expression (Equation (9)):
where A and B are constants related to each target type (human body and the different building levels) as shown in Table 5.

Table 5.
Coefficients of the correlation relating the total heat flux to the distance separating the target (human body and building) from the fire front.
The SSD for a target can be estimated by replacing Qtot by the maximum tolerable value of the thermal flux in Equation (9). For instance, for an equipped firefighter, Qmax = Qtot, HB = 7 kW/m2 gives a value of d = SSD = 33.6 m. For the building, taking an example of the threshold value of the wood ignition (Qtot = 12 kW/m2), the safe separation distances to prevent damage are 25.5 m, 21.6 m, 18.5 m and 13.7 m, for the levels R0, R1, R2 and R3, respectively. It is worth mentioning that the SSD values obtained graphically and analytically using correlations are less than 50 m for both the equipped firefighters and the buildings, which indicates that this SSD value set by the experts’ regulation in Corsica can be sufficient to prevent damage and injuries when firebrands are not considered.
4. Conclusions
This study investigates suitable safe separation distances between a wildland fire and different target types (human bodies and buildings). A physically based numerical fire spread model was used to investigate a case of fire spreading through a high shrubland under a moderate slope and strong wind. This case study is considered to be representative of most high wildfire risk situations in Corsica. This paper first describes the methodology applied using FireStar2D to determine the safe separation distance (SSD). This methodology leads to correlations that relate the total heat flux (radiative and convective) to the distance separating the targets from the fire front. The SSD is then evaluated by considering the maximum tolerable value of the thermal heat flux that can be received by the target without causing harm or damage. In this “critical” case, the propagation conditions defined by the operational staff generated a high-intensity fire. The safe separation distances evaluated using this methodology, for an equipped firefighter as well as for a building, are less than 50 m. Consequently, this confirms the effectiveness of the safety distance value around habitations, fixed by the operational experts, assumed to be equal to a minimum of 50 m in France. Therefore, this regulation can also be pertinent for all the wildfire events propagating under a wind speed of <16 m/s and a terrain slope of <12°. It is worth mentioning that the radiative heat transfer contribution was the dominant factor in the evaluation of the SSD.
Author Contributions
Conceptualization, all the authors; methodology, J.-L.R., J.F., J.-Y.D. and F.M.; software, J.F., G.A. and S.M.; validation, all the authors; formal analysis, all the authors; writing—original draft preparation, J.F. and J.-L.R.; writing—review and editing, J.F., J.-L.R., F.-J.C., D.M. and S.M.; supervision, J.-L.R., F.-J.C., G.A. and D.M. All authors have read and agreed to the published version of the manuscript.
Funding
This work was funded by the Corsican Collectivity and the French state in the framework of the collaborative project GOLIAT (CPER: 40031).
Institutional Review Board Statement
Not applicable.
Informed Consent Statement
Not applicable.
Data Availability Statement
Not applicable.
Acknowledgments
This study required the cooperation of many people and would not have been possible without the assistance of the Groupe Technique Interdepartmental Technical Group of Corsica (GTI) who selected the site and gave the “critical case”. The authors really appreciate the collaboration with Claude PERRIN, member of the Regional Service of Agriculture of Corsica, who directed the GTI.
Conflicts of Interest
The authors declare no conflict of interest.
Nomenclature
| B | Stephan–Boltzmann constant (W/m2·K4) |
| Ct | Turbulent natural convection constant (W/m2·K4/3) |
| Cp | Fuel specific heat (J/kg/K) |
| e | Fuel bed depth (m) |
| FMC | Fuel moisture content (mass of water/mass of dry fuel) |
| g | Gravity (m/s2) |
| Convective heat transfer coefficient for a human body (W/m2·K) | |
| Convective heat transfer coefficient for the exterior surface building (W/m2·K) | |
| Hf | Flame height (m) |
| Byram fireline intensity evaluated numerically (W/m) | |
| I | Radiation intensity (W/m2) |
| J | Total irradiance (W/m2) |
| Qconv | Convective heat flux received by a target (W/m2) |
| Qrad | Radiative heat flux received by a target (W/m2) |
| Qtot | Total heat flux received by a target (W/m2) |
| RH | Relative humidity (%) |
| ROS | Rate of spread (m/s) |
| s | Surface area to volume ratio (m−1) |
| sg | Absorption coefficient of gas/soot mixture |
| T0 | Gas mixture temperature (K) |
| Ta | Ambient temperature (K) |
| Ts | Fuel particle temperature (K) |
| Ux | Wind speed at x meters above the ground (m/s) |
| V0 | Gas flow speed (m/s) |
| ΔHc | Fuel yield heat (J/kg) |
| Vegetation mass loss rate (kg/m·s) | |
| Rate of dry material pyrolysis (kg/m·s) | |
| Rate of charcoal combustion (kg/m·s) | |
| Greek | |
| α | Slope angle |
| ρs | Fuel particle density (kg/m3) |
| βs | Volume fraction of the solid phase |
| σ | Dry fuel load (kg/m2) |
| βg | Volume fraction of the gaseous phase |
References
- Van Wagner, C.E. Drought, Timelag, and Fire Danger Rating. In Proceedings of the Eighth Conference on Fire and Meteorology, Detroit, MI, USA, 29 April–2 May 1985; Foresters, S., Ed.; American Meteorological Society: Boston, MA, USA, 1985; pp. 178–185. [Google Scholar]
- Finney, M.A.; Forthofer, J.; Grenfell, I.C.; Adam, B.A.; Akafuah, N.K.; Saito, K. A Study of Flame Spread in Engineered Cardboard Fuelbeds: Part I: Correlations and Observations. In Proceedings of the Seventh International Symposium on Scale Modeling, Hirosaki, Japan, 6–9 August 2013. [Google Scholar]
- Rossi, J.-L.; Komac, B.; Migliorini, M.; Schwarze, R.; Sigmund, Z.; Awad, C.; Chatelon, F.-J.; Goldammer, J.G.; Marcelli, T.; Morvan, D.; et al. Evolving Risk of Wildfires in Europe—The Changing Nature of Wildfire Risk Calls for a Shift in Policy Focus from Suppression to Prevention; UN Office for Disaster Risk Reduction: Brussels, Belgium, 2020. [Google Scholar]
- Hirsch, K.; Martell, D. A Review of Initial Attack Fire Crew Productivity and Effectiveness. Int. J. Wildl. Fire 1996, 6, 199–215. [Google Scholar] [CrossRef]
- Alexander, M.E.; Cole, F.V. Predicting and Interpreting Fire Intensities in Alaskan Black Spruce Forests Using the Canadian System of Fire Danger Rating. In Proceedings of the Managing Forests to Meet People’s Needs, Anchorage, AK, USA, 18–22 September 1994; Publication 95-02. Society of American Forest: Bethesda, MD, USA; pp. 185–192. [Google Scholar]
- Ganteaume, A.; Barbero, R.; Jappiot, M.; Maillé, E. Understanding Future Changes to Fires in Southern Europe and Their Impacts on the Wildland-Urban Interface. J. Saf. Sci. Resil. 2021, 2, 20–29. [Google Scholar] [CrossRef]
- Castro Rego, F.M.C.; Moreno Rodriguez, J.M.; Vallejo Calzada, V.R.; Xanthopoulos, G. Forest Fires—Sparking Firesmart Policies in the EU; Faivre, N., Ed.; Publications Office of the European Union: Luxembourg, 2018. [Google Scholar]
- Butler, C. The Urban/Wildland Fire Interface. Proc. West. States Sect. Inst. Pap. 1974, 74, 1–17. [Google Scholar]
- Jappiot, M.; González-Olabarria, J.R.; Lampin-Maillet, C.; Borgniet, L. Assessing Wildfire Risk in Time and Space. In Living with Wildfires: What Science Can Tell Us? A Contribution to the Science-Policy Dialogue; Birot, Y., Ed.; European Forest Institute, Mediterranean Regional Office—EFIMED: Joensuu, Finland, 2009; pp. 41–48. ISBN 987-952-5453-29-4. [Google Scholar]
- Radeloff, V.C.; Hammer, R.B.; Stewart, S.I.; Fried, J.S.; Holcomb, S.S.; Mckeefry, J.F. The Wildland–Urban Interface in the United States. Commun. Ecol. Appl. 2005, 15, 799–805. [Google Scholar] [CrossRef]
- Davis, J.B. The Wildland-Urban Interface: Paradise or Battleground? J. For. 1990, 88, 26–31. [Google Scholar]
- Argañaraz, J.P.; Radeloff, V.C.; Bar-Massada, A.; Gavier-Pizarro, G.I.; Scavuzzo, C.M.; Bellis, L.M. Assessing Wildfire Exposure in the Wildland-Urban Interface Area of the Mountains of Central Argentina. J. Environ. Manag. 2017, 196, 499–510. [Google Scholar] [CrossRef]
- Buxton, M.; Haynes, R.; Mercer, D.; Butt, A. Vulnerability to Bushfire Risk at Melbourne’s Urban Fringe: The Failure of Regulatory Land Use Planning. Geogr. Res. 2011, 49, 1–12. [Google Scholar] [CrossRef]
- Van Wilgen, B.W.; Forsyth, G.G.; Prins, P. The Management of Fire-Adapted Ecosystems in an Urban Setting: The Case of Table Mountain National Park, South Africa. Ecol. Soc. 2012, 17, 8. [Google Scholar] [CrossRef]
- Radeloff, V.C.; Helmers, D.P.; Anu Kramer, H.; Mockrin, M.H.; Alexandre, P.M.; Bar-Massada, A.; Butsic, V.; Hawbaker, T.J.; Martinuzzi, S.; Syphard, A.D.; et al. Rapid Growth of the US Wildland-Urban Interface Raises Wildfire Risk. Proc. Natl. Acad. Sci. USA 2018, 115, 3314–3319. [Google Scholar] [CrossRef]
- U.S. Fire Administration. US Fire Administration Wildland Urban Interface: A Look at Issues and Resolutions a Report of Recommendations for Elected Officials, Policymakers and All Levels of Government, Tribal and Response Agencies; FEMA, U.S. Fire Administration: Emmitsburg, MD, USA, 2022. [Google Scholar]
- Moreno, J.M.; Vázquez, A.; Vélez, R. Recent History of Forest Fires in Spain. In Large Forest Fires; Moreno, J.M., Ed.; Backhuys Publishers: Leiden, The Netherlands, 1998; pp. 159–185. [Google Scholar]
- Doerr, S.H.; Santin, C. What Links Portugal’s Deadliest Wildfre to Grenfell Tower? Economics and Neglect. Available online: https://theconversation.com/what-links-portugals-deadliest-wildfir…ics-and-neglect-79815?utm_source=twitter&utm_medium=twitterbutton (accessed on 17 March 2023).
- Bento-Gonçalves, A.; Vieira, A.; Da Vinha, L.; Hamada, S. Changes in Mainland Portuguese Forest Areas since the Last Decade of the XXth Century. Mediterranee 2018, 130. [Google Scholar] [CrossRef]
- Leite, F.F.; Bento-Gonçalves, A.; Vieira, A.; Da Vinha, L. Mega-Fires around the World: A Literature Review. In Wildland Fires: A Worldwide Reality; Nova Science Publishers: New York, NY, USA, 2015; pp. 15–34. ISBN 978-1-63483-408-7. [Google Scholar]
- Tedim, F.; Xanthopoulos, G.; Leone, V. Chapter 5—Forest Fires in Europe: Facts and Challenges. In Wildfire Hazards, Risks and Disasters; Shroder, J.F., Paton, R., Disasters, D.B.T.-W.H., Eds.; Elsevier: Oxford, UK, 2015; pp. 77–99. ISBN 978-0-12-410434-1. [Google Scholar]
- Oliveira, R.; Oliveira, S.; Zêzere, J.; Viegas, D. Human Perception of Fire Hazard in Wildland Urban Interface Areas—A Portuguese Survey Analysis of Spot Fires. In Advances in Forest Fire Research 2018; Viegas, D.X., Ed.; Imprensa da Universidade de Coimbra: Coimbra, Portugal, 2018; pp. 1130–1136. ISBN 9789892616506. [Google Scholar]
- Europe Set for Record Wildfire Land Loss in 2022—DW—08/14/2022. Available online: https://www.dw.com/en/europe-set-for-record-wildfire-destruction-in-2022/a-62802068 (accessed on 15 March 2023).
- Buccio, F. Incendies Été 2022—Gironde et Landes, Retour d’expérience. 2022. Available online: https://www.gironde.gouv.fr/contenu/telechargement/64007/426953/file/RETEX%20incendies%20-%20Gironde%20et%20Landes%20%20octobre%202022.pdf (accessed on 17 March 2023).
- Portugal: Plus de 100 000 Hectares Brûlés Par Les Feux de Forêt Cette Année. Available online: https://www.sudouest.fr/environnement/portugal-plus-de-100-000-hectares-brules-par-les-feux-de-foret-cette-annee-12023067.php (accessed on 5 April 2023).
- Zhang, J.Q.; Lu, S.X.; Yuan, M.; Li, C.H.; Li, Q. Safe Separation Distance Calculation Model with Changing Area of Fuel Packages in Large Space. Procedia Eng. 2011, 11, 666–674. [Google Scholar] [CrossRef]
- USDA Forest Service the Safe Separation Distance Evaluator: Is My Safety Zone Big. Available online: https://www.fs.usda.gov/research/rmrs/products/sycu/safe-separation-distance-evaluator-my-safety-zone-big-enough (accessed on 17 March 2023).
- Rossi, J.L.; Simeoni, A.; Moretti, B.; Leroy-Cancellieri, V. An Analytical Model Based on Radiative Heating for the Determination of Safety Distances for Wildland Fires. Fire Saf. J. 2011, 46, 520–527. [Google Scholar] [CrossRef]
- Bisgambiglia, P.-A.; Rossi, J.-L.; Franceschini, R.; Chatelon, F.-J.; Bisgambiglia, P.A.; Rossi, L.; Marcelli, T. DIMZAL: A Software Tool to Compute Acceptable Safety Distance. Open J. For. 2017, 7, 11–33. [Google Scholar] [CrossRef]
- Zárate, L.; Arnaldos, J.; Casal, J. Establishing Safety Distances for Wildland Fires. Fire Saf. J. 2008, 43, 565–575. [Google Scholar] [CrossRef]
- Butler, B.W.; Cohen, J.D. Firefighter safety zones: How big is big enough? Fire Manag. Notes 1998, 58, 13–16. [Google Scholar]
- Butler, B.W. Wildland Firefighter Safety Zones: A Review of Past Science and Summary of Future Needs. Int. J. Wildl. Fire 2014, 23, 295–308. [Google Scholar] [CrossRef]
- Green, L.R.; Schimke, H.E. Guides for Fuel-Breaks in Sierra Nevada Mixed-Conifer Type; Forest Service US Department of Agriculture: Washington, DC, USA, 1971. [Google Scholar]
- Rossi, J.L.; Chatelon, F.J.; Marcelli, T. Fire Intensity. In Encyclopedia of Wildfires and Wildland-Urban Interface (WUI) Fires; Manzello, S.L., Ed.; Springer International Publishing: Cham, Switzerland, 2018; pp. 1–6. ISBN 978-3-319-51727-8. [Google Scholar]
- Alexander, M.E.; Cruz, M.G. Fireline Intensity. In Encyclopedia of Wildfires and Wildland-Urban Interface (WUI) Fires; Springer: Berlin/Heidelberg, Germany, 2019; pp. 1–8. [Google Scholar]
- Butler, B.W.; Finney, M.A.; Andrews, P.L.; Albini, F. A Radiation-Driven Model for Crown Fire Spread. Can. J. For. Res. 2004, 34, 1588–1599. [Google Scholar] [CrossRef]
- Byram, G.M. Combustion of Forest Fuels. In Forest Fire: Control and Use; Davis, K.P., Ed.; New York McGraw Hill: New York, NY, USA, 1959; pp. 61–89. [Google Scholar]
- Catchpole, W.R.; Bradstock, R.A.; Choate, J.; Fogarty, L.G.; Gellie, N.; McCarthy, G.; McCaw, W.L.; Marsden-Smedley, J.B.; Pearce, G. Cooperative Development of Equations for Heathland Fire Behaviour. In Proceedings of the 3rd International Conference on Forest Fire Research and 14th Conference on Fire and Forest Meteorology, Luso, Portugal, 16–20 November 1998; Viegas, D.X., Ed.; Volume 2, pp. 16–20. [Google Scholar]
- Nelson, R.M., Jr. Flame Characteristics for Fires in Southern Fuels. In USDA Forest Service, General Research Paper SE-205; Southeast Forest Experimental Station: Asheville, NC, USA, 1980. [Google Scholar]
- Vega, J.A.; Cuinas, P.; Fonturbel, T.; Perez-Gorostiaga, P.; Fernandez, C. Predicting Fire Behavior in Galician (NW Spain) Shrubland Fuel Complexes. In Proceedings of the 3rd International Conference on Forest Fire Research and 14th Conference on Fire and Forest Meteorology, Luso, Portugal, 16–20 November 1998; Viegas, D.X., Ed.; University of Coimbra: Coimbra, Portugal; Volume II, pp. 713–728. [Google Scholar]
- Butler, B.W.; Parsons, R.A.; Mell, W. Recent Findings Relating to Firefighter Safety Zones. In Proceedings of the Large Wildland Fires Conference, Missoula, MT, USA, 19–23 May 2014; Proc. RMRS-P-73. U.S. Department of Agriculture, Forest Service, Rocky Mountain Research Station: Fort Collins, CO, USA, 2014; pp. 30–34. [Google Scholar]
- Fayad, J.; Morandini, F.; Accary, G.; Chatelon, F.; Wandon, C.; Burglin, A.; Rossi, L.; Marcelli, T.; Cancellieri, D.; Cancellieri, V.; et al. A Study of Two High Intensity Fires across Corsican Shrubland. Atmosphere 2023, 14, 473. [Google Scholar] [CrossRef]
- Fayad, J.; Rossi, L.; Frangieh, N.; Awad, C.; Accary, G.; Chatelon, F.-J.; Morandini, F.; Marcelli, T.; Cancellieri, V.; Cancellieri, D.; et al. Numerical Study of an Experimental High-Intensity Prescribed Fire across Corsican Genista Salzmannii Vegetation. Fire Saf. J. 2022, 131, 103600. [Google Scholar] [CrossRef]
- Awad, C.; Frangieh, N.; Marcelli, T.; Accary, G.; Morvan, D.; Meradji, S.; Chatelon, F.-J.; Rossi, J.-L. Numerical Study of the Moisture Content Threshold under Prescribed Burning Conditions. Fire Saf. J. 2021, in press. [Google Scholar] [CrossRef]
- Awad, C.; Morvan, D.; Rossi, J.-L.; Marcelli, T.; Chatelon, F.J.; Morandini, F.; Balbi, J.-H. Fuel Moisture Content Threshold Leading to Fire Extinction under Marginal Conditions. Fire Saf. J. 2020, 118, 11. [Google Scholar] [CrossRef]
- Morvan, D.; Dupuy, J.L. Modeling the Propagation of a Wildfire through a Mediterranean Shrub Using a Multiphase Formulation. Combust. Flame 2004, 138, 199–210. [Google Scholar] [CrossRef]
- Morvan, D.; Meradji, S.; Accary, G. Wildfire Behavior Study in a Mediterranean Pine Stand Using a Physically Based Model. Combust. Sci. Technol. 2008, 180, 230–248. [Google Scholar] [CrossRef]
- Morvan, D.; Dupuy, J.L. Modeling of Fire Spread through a Forest Fuel Bed Using a Multiphase Formulation. Combust. Flame 2001, 127, 1981–1994. [Google Scholar] [CrossRef]
- Morvan, D. Numerical Study of the Effect of Fuel Moisture Content (FMC) upon the Propagation of a Surface Fire on a Flat Terrain. Fire Saf. J. 2013, 58, 121–131. [Google Scholar] [CrossRef]
- GOLIAT—Groupement d’Outils Pour La Lutte Incendie et l’Aménagement Du Territoire. Available online: https://goliat.universita.corsica/ (accessed on 5 May 2021).
- Marcelli, T.; Rossi, L.; Accary, G.; Awad, C.; Burglin, A.; Cancellieri, D.; Cancellieri, V.; Chatelon, F.-J.; Fayad, J.; Ferrat, L.; et al. GOLIAT, a Project to Develop Tools for Firefighting and Land Use Planning. In Proceedings of the Advances in Forest Fire Research 2022, Coimbra, Portugal, 11–18 November 2022; Viegas, D.X., Ribeiro, L.M., Eds.; pp. 234–239. [Google Scholar]
- Rigolot, E.; Costa, M. Conception Des Coupures de Combustible; de la Cardère, M., Ed.; Réseau Cou.: Portoi-Vecchio, France, 2000. [Google Scholar]
- Vaiciulyte, S.; Galea, E.R.; Veeraswamy, A.; Hulse, L.M. Island Vulnerability and Resilience to Wildfires: A Case Study of Corsica. Int. J. Disaster Risk Reduct. 2019, 40, 101272. [Google Scholar] [CrossRef]
- Mouillot, F.; Ratte, J.P.; Joffre, R.; Mouillot, D.; Rambal, S. Long-Term Forest Dynamic after Land Abandonment in a Fire Prone Mediterranean Landscape (Central Corsica, France). Landsc. Ecol. 2005, 20, 101–112. [Google Scholar] [CrossRef]
- Pasqualini, V.; Oberti, P.; Vigetta, S.; Riffard, O.; Panaïotis, C.; Cannac, M.; Ferrat, L. A GIS-Based Multicriteria Evaluation for Aiding Risk Management Pinus Pinaster Ait. Forests: A Case Study in Corsican Island, Western Mediterranean Region. Environ. Manag. 2011, 48, 38–56. [Google Scholar] [CrossRef]
- Rothermel, R.C. A Mathematical Model for Predicting Fire Spread in Wildland Fuels; USDA Forest Service, Research Paper INT-115; Intermountain Forest and Range Experiment Station: Ogden, UT, USA, 1972. [Google Scholar]
- Arca, B.; Duce, P.; Laconi, M.; Pellizzaro, G.; Salis, M.; Spano, D. Evaluation of FARSITE Simulator in Mediterranean Maquis. Int. J. Wildl. Fire 2007, 16, 563. [Google Scholar] [CrossRef]
- Grishin, A.M. Mathematical Modeling of Forest Fires and New Methods of Fighting Them; Albini, F.A., Ed.; Publishing House of the Tomsk University: Tomsk, Russia, 1996. [Google Scholar]
- Morvan, D.; Méradji, S.; Accary, G. Physical Modelling of Fire Spread in Grasslands. Fire Saf. J. 2009, 44, 50–61. [Google Scholar] [CrossRef]
- Chatelon, F.J.; Balbi, J.H.; Cruz, M.G.; Morvan, D.; Rossi, J.L.; Awad, C.; Frangieh, N.; Fayad, J.; Marcelli, T. Extension of the Balbi Fire Spread Model to Include the Field Scale Conditions of Shrubland Fires. Int. J. Wildl. Fire 2022, 31, 176–192. [Google Scholar] [CrossRef]
- Morvan, D. Physical Phenomena and Length Scales Governing the Behaviour of Wildfires: A Case for Physical Modelling. Fire Technol. 2011, 47, 437–460. [Google Scholar] [CrossRef]
- Siegel, R.; Howell, J.R. Thermal Radiation Heat Transfer—Third Edition; Hemisphere Publishing Corporation: Washington, DC, USA, 1992; ISBN 0-89116-271-2. [Google Scholar]
- Owen, M.S. 2009 ASHRAE Handbook: Fundamentals. In 2009 Ashrae Handbook—Fundamentals; American Society of Heating, Refrigeration and Air-Conditioning Engineers: Peachtree Corners, GA, USA, 2009; ISBN 9781933742557. [Google Scholar]
- Oguro, M.; Arens, E.; de Dear, R.; Zhang, H.; Katayama, T. Convective Heat Transfer Coefficients and Clothing Insulations for Parts of the Clothed Human Body under Airflow Conditions. J. Archit. Plan. Environ. Eng. 2002, 561, 21–29. [Google Scholar] [CrossRef]
- Yazdanian, M.; Klems, J.H. Measurement of the Exterior Convective Film Coefficient for Windows in Low-Rise Buildings. ASHRAE Trans. 1994, 100, 17. [Google Scholar]
- Imessad, K.; Messaoudène, N.A. Modèle Mathématique de Prédiction de La Sensation Thermique et de La Réponse Physiologique Chez l ’ Être Humain. Rev. Des Energ. Renouvelables 2008, 11, 545–556. [Google Scholar]
- Cai, R.; Zhang, N. Explicit Analytical Solutions of 2-D Laminar Natural Convection. Int. J. Heat Mass Transf. 2003, 46, 931–934. [Google Scholar] [CrossRef]
- Blocken, B.; Defraeye, T.; Derome, D.; Carmeliet, J. High-Resolution CFD Simulations for Forced Convective Heat Transfer Coefficients at the Facade of a Low-Rise Building. Build. Environ. 2009, 44, 2396–2412. [Google Scholar] [CrossRef]
- Mirsadeghi, M.; Cóstola, D.; Blocken, B.; Hensen, J.L.M. Review of External Convective Heat Transfer Coefficient Models in Building Energy Simulation Programs: Implementation and Uncertainty. Appl. Therm. Eng. 2013, 56, 134–151. [Google Scholar] [CrossRef]
- Hensen, J.L.M.; Lamberts, R.; Negrao, C.O.R. A View of Energy and Building Performance Simulation at the Start of the Third Millennium. Energy Build. 2002, 34, 853–855. [Google Scholar] [CrossRef]
- API STANDARD 521. Pressure-Relieving and Depressuring Systems, 6th ed.; American Petroleum Institute, Ed.; API Publishing Services: Washington, DC, USA, 2014; ISBN 5925731107. [Google Scholar]
- Raj, P.K. A Review of the Criteria for People Exposure to Radiant Heat Flux from Fires. J. Hazard. Mater. 2008, 159, 61–71. [Google Scholar] [CrossRef]
- Butler, B.; Cohen, J. Firefighter Safety Zones: A Theoretical Model Based on Radiative Heating. Int. J. Wildl. Fire 1998, 8, 73–77. [Google Scholar] [CrossRef]
- Casal Fàbrega, J.; Montiel Boadas, H.; Planas Cuchi, E.; Vílchez Sánchez, J.A. Análisis Del Riesgo En Instalaciones Industriales; Edicions UPC: Barcelona, Spain, 1999. [Google Scholar]
- Crocker, W.P.; Napier, D.H. Thermal Radiation Hazards of Liquid Pool Fires and Tank Fires. Inst. Chem. Eng. Symp. Ser. 1986, 97, 159–184. [Google Scholar]
- Lilley, D.G. Minimum Safe Distance from Pool Fires. J. Propuls. Power 2000, 16, 649–652. [Google Scholar] [CrossRef]
- Page, W.G.; Butler, B.W. An Empirically Based Approach to Defining Wildland Firefighter Safety and Survival Zone Separation Distances. Int. J. Wildl. Fire 2017, 26, 655–667. [Google Scholar] [CrossRef]
- Campbell, M.J.; Dennison, P.E.; Thompson, M.P.; Butler, B.W. Assessing Potential Safety Zone Suitability Using a New Online Mapping Tool. Fire 2022, 5, 5. [Google Scholar] [CrossRef]
Disclaimer/Publisher’s Note: The statements, opinions and data contained in all publications are solely those of the individual author(s) and contributor(s) and not of MDPI and/or the editor(s). MDPI and/or the editor(s) disclaim responsibility for any injury to people or property resulting from any ideas, methods, instructions or products referred to in the content. |
© 2023 by the authors. Licensee MDPI, Basel, Switzerland. This article is an open access article distributed under the terms and conditions of the Creative Commons Attribution (CC BY) license (https://creativecommons.org/licenses/by/4.0/).