Abstract
To reduce the thermal runaway risk of lithium-ion batteries, a good thermal management system is critically required. As phase change materials can absorb a lot of heat without the need for extra equipment, they are employed in the thermal management of batteries. The thermal management of a Sanyo 26,650 battery was studied in this work by using different composite phase change materials (CPCMs) at different charge–discharge rates. The thorough analysis on the thermal conductivity of CPCMs and the effect of CPCMs was conducted on the maximum surface temperature while charging and discharging. The findings demonstrate the ability of the composite thermal conductivity filler to increase thermal conductivity. It is increased to 1.307 W/(m K) as the ratio of silica and graphene is 1:1 (CPCM-3). The CPCMs can reduce the surface temperature of the cell, and the cooling effect of CPCM-3 is the most obvious, which can reduce the maximum temperature of the cell surface by 13.7 °C and 19 °C under 2 C and 3 C conditions. It is also found that the risk of thermal runaway of batteries under CPCMs thermal management is effectively reduced, ensuring the safe operation of the battery. This research can assist in the safe application of batteries and the development of new energy sources.
1. Introduction
The carbon peaking and carbon neutrality goals in China promote a low-carbon, eco-friendly and green way of living. In this context, it is of great significance to vigorously develop renewable energy. Lithium-ion batteries (LIBs) have received extensive attention and development in the past decade due to their high energy density, long cycle life and high efficiency [1]. Although local overheating may increase the risk of thermal runaway, the performance of LIBs is directly correlated with its operating temperature. The safe operation of grid-side energy storage power stations requires better management of densely arranged LIB packs in order to avoid the risk of thermal runaway and fires [2,3]. Therefore, to guarantee the operation’s safety and the good charge and discharge performance of the LIB, it is essential to utilize the battery thermal management system to make the battery pack work effectively [4].
Battery thermal management cooling technologies are mainly divided into air cooling, liquid cooling and phase change cooling [5,6]. Qian et al. [7] improved the cooling performance by increasing the battery separation. The cell spacing distribution for the battery pack was designed using this optimization approach, which was effective and time-saving. However, due to the characteristics of the air itself, its cooling effect had certain limitations [8]. Amalesh et al. [9] found that the cooling effect was better than that of the straight rectangle, and the zigzag and circular channels performed better. Liquid cooling also exhibits better cooling effects due to the higher thermal conductivity of liquids. However, the danger of liquid leaking is one drawback of the liquid cooling method, along with complicated system manufacturing, and the need for additional power consumption [10]. Phase change cooling uses phase change materials (PCM) to absorb a large amount of latent heat, and its temperature change is small. Compared with other cooling systems, it has the advantages of simple structure and low cost [11,12]. In order to create composite phase change material (CPCM), Abu-Hamdeh et al. [13] added two different thermally conductive fillers, graphene and graphene oxide, to paraffin. It was found that the addition of the two materials would improve the thermal conductivity, and the properties exhibited by graphene more excellent. Yang et al. [14] prepared a thermally CPCM with segregated structure by hot-pressing paraffin and graphene microencapsulated phase change materials (MEPCMs). Saydam et al. [15] studied the long-term thermal stability of PCMs by adding multi-walled carbon nanotubes, graphene nanosheets and alumina nanoparticles to paraffin. Their results showed that different nanoparticles had little effect on long-term thermal stability. Guo et al. [16] developed a silicone rubber/paraffin wax and silica CPCM through microcapsules. The results showed that the addition of silica was helpful to enhance the thermal and mechanical characteristics of the PCM. Jilte et al. [17] adjusted the PCM layout and used the natural or forced convection of the air around the PCM to minimize the battery pack’s maximum temperature, and the range of its typical temperatures was less than 0.12 °C at 4 C. Cao et al. [18] mixed paraffin wax, styrene-ethylene-butylene-styrene and hexagonal boron nitride to prepare a CPCM with good flexibility, high electrical insulation and high thermal conductivity. Previous work has made a lot of progress in adding high thermal conductivity fillers to enhance the performance of PCMs, mainly through research into adding different types of thermal conductivity fillers, and has found the optimal material to improve the performance of phase change materials. However, the synergistic effect of multiple thermally conductive fillers on enhancing the performance of PCMs still needs further research.
On the other hand, LIBs’ thermal runaway and fire accidents have occurred frequently. LIBs are very likely to experience thermal runaway under conditions of thermal abuse, mechanical abuse and electrical abuse, including short circuit, overcharge, over discharge, acupuncture, collision, etc. [19]. In a large battery system, LIBs are densely arranged; this is likely to cause the surrounding batteries to continue to go out of control after a single battery is in thermal runaway and eventually cause a serious fire or even an explosion. Therefore, the prevention technology for thermal runaway risk of LIBs research was carried out at this stage. One such study was on LIB materials, including the thermal stability of the positive electrode material and separator, the reactivity between the positive electrode material and the electrolyte, the combustion characteristics of the electrolyte itself, etc., and it provided relevant basic data for the safety research and development of LIBs [20,21,22]. Some researchers conducted the studies on the causes and extension mechanism of thermal runaway of batteries, the critical conditions of thermal runaway propagation and their fire characteristics, and revealed the law of thermal runaway propagation [23,24]. Other research has been used to evaluate the fire risk of LIBs, establish thermal runaway critical criteria and provide a scientific basis for fire protection layout planning and resource allocation for battery applications [25,26]. The safety monitoring and early warning technology were conducted for the real-time online monitoring of batteries, modules, etc., and the change rules of key factors such as voltage, temperature, characteristic gas and smoke are used to provide early warning and graded warning of thermal runaway [27,28]. In this way, countermeasures can be taken in the early stages of the abnormal situation of the LIB so as to stop or slow down the abnormal temperature rise and prevent the occurrence of thermal runaway. The above research had a good effect on the safety protection of LIBs and the prevention of thermal runaway risks, though the technology still needs further development. To this end, CPCMs have a good heat dissipation effect, and the prevention technology of thermal runaway risk with CPCMs can be used as an important development direction.
In this paper, EG, Kaolin, Graphene and Silicon dioxide were used as additives in the research and development of CPCMs, which effectively improved the thermal conductivity of PCM and then improved their effect in battery thermal management applications. Temperature analyses were used to show more quantitatively how CPCMs can reduce the risk of thermal runaway. This data of this work could provide a basis for the risk prevention and control of thermal runaway of LIBs in electrochemical energy storage systems.
2. Experimental Section
2.1. Materials
Paraffin (PA) has the advantages of large latent heat, suitable phase change temperature, stable chemical properties, non-toxic, non-corrosive, no overcooling and cheap price and is suitable for the thermal management of LIBs. Hebei Haoyu New Energy Technology Co., Ltd., Cangzhou, China, provided the PA, which has a 210 J g−1 latent heat and a 46.0 °C melting point. A 99% pure expanded graphite (EG), which was used as the main supporting material, was bought from Tengshengda Carbon Machinery Co., Ltd., Qingdao, China. The silicon dioxide with the advantages of non-toxic, non-corrosion, high thermal conductivity and stable chemical performance was acquired from Nanjing Baoket New Material Co., Ltd., Nanjing, China, and kaolin originated in Shandong West Asia Chemical Industrial Co., Ltd., Linyi, China. The Jingrui Alloy Products Co., Ltd., Nangong City, China provided the few-layer graphene. The type of battery used in the experiment is a 26,650 LIB (Sanyo MH12210 26650A) produced by Sanyo Company with a capacity of 5000 mAh.
2.2. The Preparation of CPCMs
In this paper, the EG and kaolin are selected to support the PCM of PA, and silica and graphene are used as thermally conductive fillers to improve thermal conductivity. In order to ensure the good performance of the materials, the EG is placed in the oven for 24 h before the experiments. The quantitative PA is weighed and placed in a constant temperature box at 100 °C for one hour, then placed on a magnetic stirrer heated by an oil bath at 90 °C. EG and kaolin are added for evenly stirring, and graphene or silicon dioxide is added to be fully stirred. The CPCMs are obtained after standing still for 24 h. Through the above preparation method, CPCMs with different proportions of thermally conductive fillers are prepared, as shown in Figure 1. Table 1 presents the composition ratio and naming rules of the CPCMs.
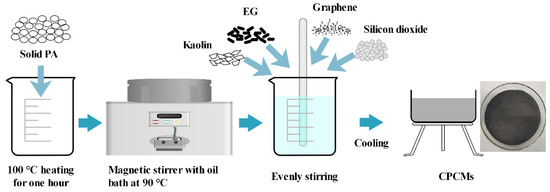
Figure 1.
Material preparation flow chart.

Table 1.
Composition ratio of composite phase change materials.
2.3. Sample Tests
2.3.1. XRD
The CPCMs were tested and analyzed by Rigaku’s Ultima IV X-ray diffractometer (XRD). The tests were carried out on a copper target with a voltage of 40 kV, a current of 40 mA, a temperature range of 10–60 °C and a speed of 5 °C/min. By contrasting the diffraction peak regions between the reference picture and the scanned sample, the content ratio of each component and whether new substances are formed can be obtained.
2.3.2. Thermal Conductivity
The thermal conductivities of CPCMs were evaluated using the DRE-III multipurpose fast thermal conductivity tester provided by Xiangyi Instrument Co., Ltd., Xiangtan, China, as show in Figure 2a. This series of thermal conductivity meters uses the transient plane heat source method to measure the thermal conductivity of samples. The principle is based on the step in the infinite medium transient temperature response from a heated disc-shaped heat source. Using a tablet press, the produced samples were compressed into two samples, each measuring 40 mm in diameter and 8 mm in thickness. During the measurement, we clamped two samples and completely covered the thermal conductivity meter’s hot wire for its temperature sensor, placed them in an incubator and started the test when there was a temperature differential of less than 0.01 K between the test sample and the hot wire. Each sample was measured six times, with the average value being used to decrease error.
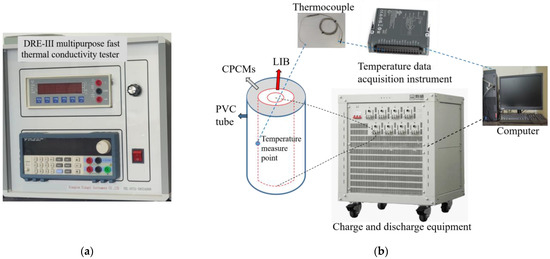
Figure 2.
Experimental device: (a) DRE-III multipurpose fast thermal conductivity tester; (b) LIB-CPCM structure and charge–discharge process.
2.3.3. Battery Thermal Performance Test
The Sanyo 26,650 LIB was charged and discharged once before this experiment and then left for 24 h to stabilize its performance. As shown in Figure 2b, the CPCMs were filled around the battery. The middle surface of LIB was where the thermocouple was affixed, and the CPCM powder was fixed with a PVC tube to conduct the charge–discharge experiment. The experimental process carried out at room temperature is also presented in Figure 2b. The cycle was carried out by an instrument for charging and discharging (offered by Shenzhen Neware Electronics Co., Ltd., Shenzhen, China (Model: CT-4008-10V20A-NA)). The temperature data of the thermocouple were recorded by a data acquisition instrument provided by National Instruments (Model: NI-9217). The design rates were intended to make the LIB discharge at 1 C, 2 C and 3 C. During the experiment, the lower limit of the safety protection voltage for discharging of the battery was set to 2.75 V, and the upper limit of the voltage was set to 4.3 V. The specific charging and discharging test conditions of the battery are shown in Table 2.

Table 2.
Charging and discharging test conditions of lithium-ion batteries.
3. Results and Discussions
3.1. Properties of CPCMs
3.1.1. XRD
The XRD pattern in Figure 3 shows that the diffraction peaks related to PA appear at 10.79°, 12.94°, 17.3°, 21.48° and 23.76°, and there is an obvious diffraction peak at 26.51° for EG and graphene. Silica has no obvious peak, and kaolin has a peak at 32.7°. The diffraction peak for CPCM-1 on the XRD curve is located at the same 2-Theta value as for PA and EG. It is discovered that CPCM-1 does not have a new peak, although the diffraction intensity is different. Similar to the EG peak, graphene exhibits a significant diffraction peak around 26.5°. Although the thermal conductive materials of other CPCMs are not the same as those of CPCM-1, the diffraction peaks’ locations on the CPCMs’ XRD curves are consistent, and no new peaks appear. The CPCMs have different diffraction peaks at 26.51° due to the difference in the amount of graphene added, and the addition ratio of graphene is reflected on the side. Analysis of the XRD pattern shows that PA/EG is only physically combined with silica and graphene, rather than via a chemical reaction, and the structure of the synthesized CPCMs is relatively stable.
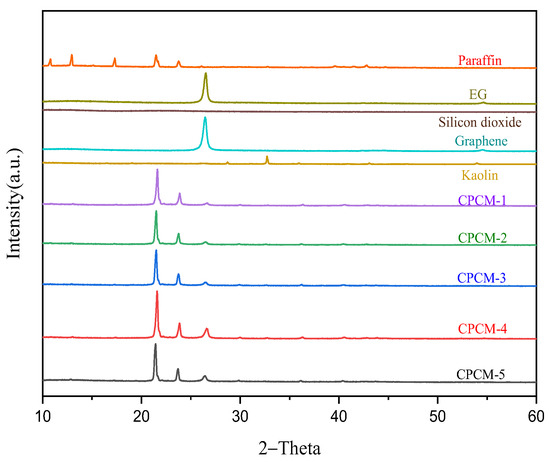
Figure 3.
XRD curves.
3.1.2. Thermal Conductivity
As shown in Figure 4, the CPCMs have different thermal conductivities. The tested thermal conductivity of CPCM-1 with silica added and CPCM-5 with graphene are 1.132 W/(m K) and 1.131 W/(m K), respectively, which are 325.5% and 325.1% higher than those of pure paraffin. Comparing CPCM-1 and CPCM-5, the thermal conductivity of silica-based CPCM composites is not much different from that of graphene-based CPCM composites. The CPCMs made of silica/graphene (CPCM-2, CPCM-3 and CPCM-4) have thermal conductivities of 1.188 W/(m K), 1.307 W/(m K) and 1.224 W/(m K), respectively. It has been discovered that adding hybrid thermally conductive fillers helps to increase thermal conductivity. The thermal conductivity is the largest when the mass ratio of silica and graphene is 1:1, reaching 1.307 W/(m K), which is 391.3% superior to that of pure paraffin wax. This is because adding only one thermally conductive filler makes it simple for particles to collect and distribute unevenly across the surface of the material, and the hybrid thermally conductive filler can improve the thermal conduction channel by reducing flaws and expanding the PA/EG contact area, thereby improving the performance of the CPCMs.
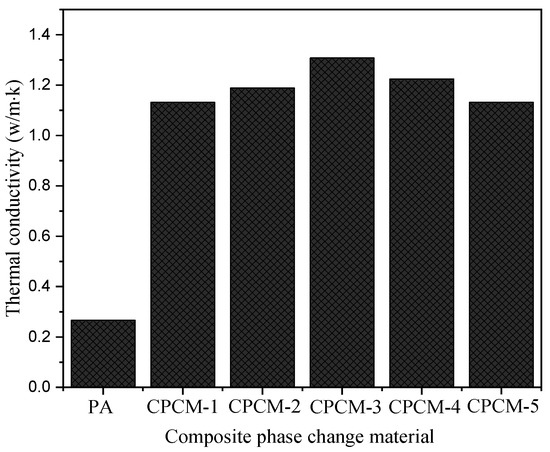
Figure 4.
Thermal conductivity of CPCMs.
3.2. Battery Cycle Performances
Figure 5 is a graph corresponding to the change of current and voltage during the 1 C charging and discharging. The battery charge and discharge status can be clearly observed from the figure. The battery should be put on hold for 5 min to ensure that the current and voltage are stable. Then, it is discharged at a constant current. When the voltage drops to 2.75 V, it should be put on hold for another 5 min. It is charged subsequently with a constant current until the battery voltage is 4.2 V. It is then switched to constant voltage charging, and charging ceased when the current was less than 0.05 A. It can be seen from the voltage and current diagram that the LIB is basically stable during normal use. The follow-up experiments can better discover the effect of temperature on its charge–discharge performance’s and the role of CPCMs.
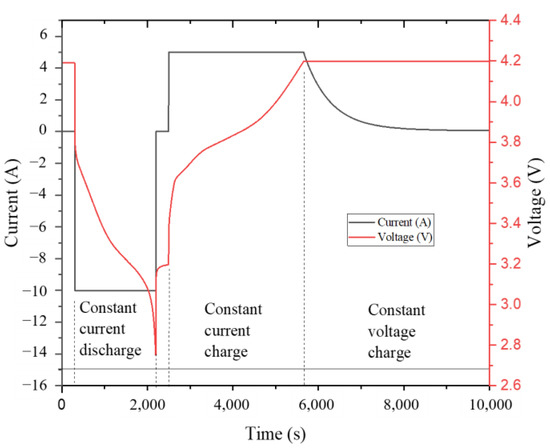
Figure 5.
The current and voltage during 1 C charging and discharging.
The two principal heat generating sources used in the charging and discharging of LIBs to increase the temperature of the battery are the heat released by the Joule effect (from the resistance of charge transfer in the battery) and the heat released by the electrochemical reactions. Macroscopically, the battery has exothermic discharging and endothermic charging, and there is a rise first and then a fall in the temperature curve. When the temperature is too high, there may be uneven temperature distribution inside the battery, resulting in battery damage or thermal runaway. The optimal temperature of the battery under normal applications is between 15–35 °C. When it is lower than 15 °C, the battery capacity and performance will decrease. An irreversible reaction will occur and the battery life will be reduced when the temperature exceeds 35 °C [4]. The battery cycle performances test under natural convection is a control test, which will be used to compare and observe the cooling effect of adding CPCMs. Figure 6 shows the temperature changes of 1 C, 2 C and 3 C of the 26,650 LIB without adding CPCMs. All experiments are carried out in a constant current discharge experiment of different discharge rates on the single battery at an ambient temperature of 25 °C, and the temperature changes of the battery are observed and analyzed. As shown in Figure 6, under three different discharge rates, the battery temperature rises rapidly at the initial stage of discharge, mainly due to the large internal resistance of the battery and more heat generation. The battery temperature is relatively flat and shows a steady upward trend in the middle of discharge. During the ending part of discharge, the battery temperature increases quickly, and as the discharge process progresses, the curve’s slope likewise has huge differences. When the battery discharge rate is 1 C, the maximum temperature reaches 39.2 °C, the maximum temperature is 62.6 °C at 2 C discharged, and the maximum temperature reaches 81.6 °C at 3 C discharged. The faster discharged battery has the higher maximum surface temperature, and the highest surface temperature of the 3 C discharged cell is 42.4 °C higher than that of the 1 C discharged battery.
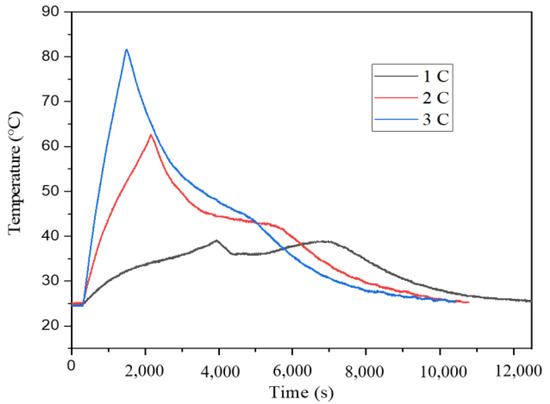
Figure 6.
The temperatures during discharging without CPCMs.
3.3. Prevention Technology of Thermal Runaway Risk with CPCMs
3.3.1. Cooling Effects
The surface temperatures of the LIB with CPCMs of different proportions in the discharge process were tested experimentally. By observing the temperature rise curves of the battery under several working conditions, the cooling effects of the CPCMs on the battery can be found. Figure 7a shows the temperature changes of the LIB wrapped by CPCMs during 1 C discharge. The No-PCM test represents the working condition of the LIB without adding any CPCMs in the constant temperature box, which is used as the control group for all the experiments. The results show that the maximum temperature of the LIB at 1 C discharging is 39.2 °C without adding CPCMs. After adding the CPCMs, its maximum temperature distribution is between 36 and 37.2 °C. The heat absorbed by the CPCMs is normally distributed at different temperatures, and the heat absorption reaches the maximum near the melting point. The melting points of the CPCMs are around 46 °C, which is higher than the maximum temperatures at 1 C discharging. Therefore, under the condition of 1 C, the surface temperature of the battery does not exceed the suitable temperature for battery operation, and the CPCMs does not show excellent cooling effects. Figure 7b shows the temperature changes of the LIB wrapped with different CPCMs during 2 C discharging. It is found that the maximum temperature of the LIB is 62.6 °C without adding CPCMs, and the maximum temperature of the battery can be reduced to 48.9 °C after adding CPCMs. When CPCM-1 is added, the highest temperature is 55.7 °C, which is 6.9 °C lower than that of the control group (No-PCM test). When CPCM-3 is added, the battery’s highest temperature is the lowest at 48.9 °C, which is 6.8 °C lower than that of CPCM-1 and 13.7 °C lower than that of the control group. In the 2 C working condition, the battery surface temperature exceeds the melting point of the CPCMs, and the CPCMs can absorb more heat to exert its cooling effect. Therefore, the cooling effect of adding CPCMs can be expressed from the temperature difference, among which CPCM-3 has the best cooling effect. Figure 7c shows the temperature changes of the LIB wrapped with different CPCMs during 3 C discharging. It is found that the maximum temperature of the LIB is as high as 81.6 °C without the addition of CPCMs. At this time, the long-time usage of LIBs already has a certain risk of thermal runaway. After adding the CPCMs, the maximum temperature of the battery can be reduced to 63.6 °C. When CPCM-5 is added, the maximum temperature is 69.1 °C, which is 12.5 °C lower than that of the control group (No-PCM test). When CPCM-3 is added, the battery’s highest temperature is 63.6 °C, which is 5.5 °C lower than that of CPCM-5 and 18 °C lower than that of the control group. The cooling effect under the condition of adding phase change materials is more obvious, which is the same as that of 2 C, and CPCM-3 has the best cooling effect.
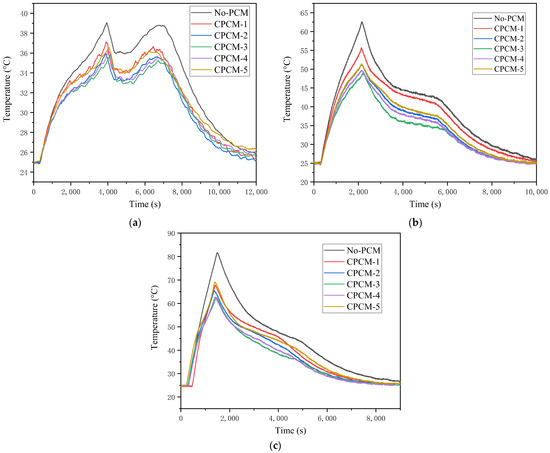
Figure 7.
Temperature changes of LIB with CPCMs at different discharging rates: (a) 1 C; (b) 2 C; (c) 3 C.
Figure 8 selects a part of the temperature rise to analyze the change law of the temperature rise rate during the LIB discharge process. Comparing these three sets of curves, it can be clearly found that the temperature rise rates during the LIB discharge process grow when the discharge rate is added. Nonetheless, the impact of the discharge rate on the peak temperature rise rate is not obvious, and the peak temperature rise rates in the three sets of data are all around 400 s. The common feature of the three clusters of curves is that the temperature rise rate is relatively large at the beginning of the discharge, and after reaching the peak value, the heat accumulation and release gradually decreases as the discharge continues and the process is carried out. In the case of 3 C discharging, the temperature rise rate will increase again in the second half, but the increase rate is small. In the case of 1 C discharging, the temperature rise rate of the battery can reach up to 0.01 °Cs−1, and in the case of 2 C discharging, it is about 0.03 °Cs−1. The temperature rise rate and peak value in the case of 3 C discharging are more obvious, and the peak value can reach about 0.06 °Cs−1, which is six times that in the case of 1 C discharging. Excessive battery temperature and temperature rise rates are likely to trigger the reaction inside the battery, causing the battery to enter a self-heating stage, which may further cause thermal runaway. The temperature rise rate difference of different curves within a group becomes obvious as the discharge rate increases. It shows that under the high discharge rate, the difference of temperature rises and change of LIB is very significant. At the same time, it can be found that the influence of CPCMs on the temperature increase is lower than temperature rise rate. In the case of 1 C discharging, the temperature rise rate of the working conditions with and without CPCMs basically remained at the same level. In the case of 2 C discharging, the temperature rise rate with CPCMs is smaller than that without CPCMs, and the temperature rise rate of CPCM-3 is the lowest. In the case of 3 C discharging, relatively large fluctuations occurred. However, it can be seen that the temperature rise rate in the later period of the working condition without CPCMs is higher than that of other working conditions.
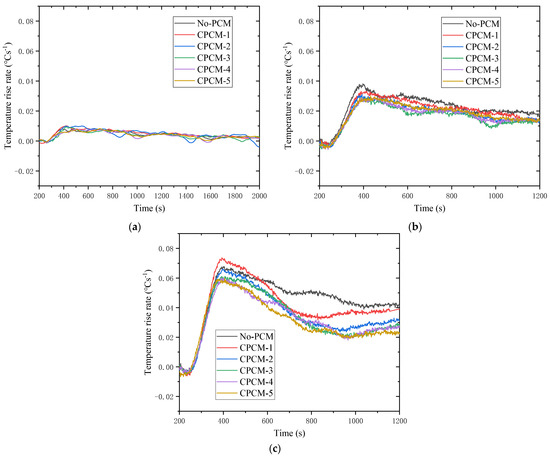
Figure 8.
Temperature rises rate of LIB at different discharging rate: (a) 1 C; (b) 2 C; (c) 3 C.
It has been founded that the cooling effect of CPCMs with a hybrid composite filler on a battery will be more outstanding than one with a single filler when comparing the effects of various CPCMs on the temperature and temperature rise rate of LIBs under the conditions of 1 C, 2 C and 3 C discharging. Table 3 shows the temperature differences between the maximum discharge temperature with the addition of CPCMs and the case without CPCMs (test W). It can be found that the temperature difference of CPCM-3 at 1 C, 2 C and 3 C reaches 3.2 °C, 13.7 °C and 19 °C, respectively. Compared with the CPCMs (CPCM-1 and CPCM-5), the cooling effect of CPCM-3 under the three working conditions has been greatly improved. CPCM-3’s cooling effect is also the most noticeable. According to the thermal conductivity results of CPCMs, the compound addition of thermally conductive fillers helps to enhance the surface heat transfer system of CPCMs, thereby improving thermal conductivity. It can be concluded that the addition of the composite thermally conductive filler will further increase the thermal conductivity of CPCMs and reduce the apparent temperature. According to the research of Qu et al. [29], the addition of different thermally conductive fillers can improve the overall performance of PCMs. In the comparison of CPCMs prepared with different proportions of thermally conductive fillers, it can be found that CPCM-3 has the best cooling effect, and the ratio of graphene and silicon dioxide in CPCM-3 is 1:1. Therefore, when graphene and silicon dioxide are used as thermal conductive fillers to improve the performance of PCMs, the ratio of 1:1 can achieve the best effect.

Table 3.
Temperature difference of adding CPCMs.
3.3.2. Impact on Battery Performance
The factors of battery performance are significantly influenced by temperature, and battery capacity, charge and discharge efficiency, etc., will vary greatly under different temperatures. As an example, Figure 9a,b shows the LIB’s 2C-discharge working condition voltage and current change curves. It can be seen that the battery under the action of different CPCMs has almost the same performance. Under the action of variable materials, the discharging time is slightly shortened. The main reason for this phenomenon is related to the battery temperature during the charging and discharging process. When no CPCMs are used, the highest temperature on the battery surface is 62.6 °C, while the normal operating temperature of the battery is about 15–40 °C. As LIBs are being charged and discharged, the transfer between lithium ions is achieved by the concentration gradient difference inside the battery. In other words, when the battery temperature is too high, the lithium-ion diffusion rate inside the battery is fast, and a lower concentration gradient is required to meet the required flux, resulting in an increase in battery charge and discharge time when working at a higher temperature. The use of CPCMs will reduce the cell temperature during operation, reduce the cycle time, stabilize the performance and be more conducive to ensuring the long-term operation of the battery. The battery’s surface temperature has a bigger effect on performance the quicker the battery is charged and discharged, and the addition of CPCMs will make the battery performance more stable.
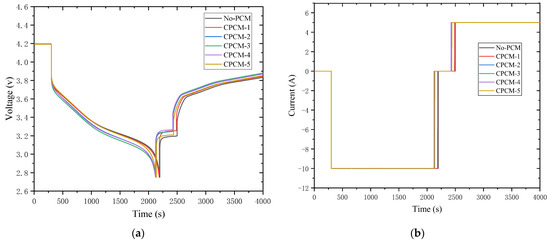
Figure 9.
Voltage and current at 2 C discharging rate: (a) voltage; (b) current.
3.3.3. Thermal Runaway Risk Analysis
The heat source of LIBs in normal operation mainly comes from the reversible heat generated by the electrochemical reaction and the irreversible heat generated by the charge–discharge cycle [30]. As shown in Figure 10, the continuous accumulation of heat during battery operation leads to a continuous rise in battery temperature, causing battery damage and even thermal runaway. Ta is the temperature range in which the LIB can be used normally. When the temperature exceeds Ta and reaches To, the battery is overheated, and there is a risk of triggering thermal runaway. When this risk continues to increase, the temperature reaches the critical temperature of thermal runaway, Tr, which will inevitably lead to the occurrence of thermal runaway. LIBs usually start to self-heat since their temperature comes to 80 °C, and the internal temperature of an LIB is too high to cause exothermic chemical reactions inside the battery, including the decomposition of the solid electrolyte interface film, the reaction of the negative electrode active material and the electrolyte, the reaction between the active material and the binder, the oxidative decomposition reaction of the electrolyte, etc. [31,32]. The addition of flame retardants in the electrolyte of the LIB can ameliorate the thermal stability and reduce the risk of battery thermal runaway from a certain point of view [33]. It is also mentioned in the study by Börger et al. [34] that as the temperature reaches the threshold, the response rate rises as a result of the rising temperature, and external methods to control the temperature rise are no longer effective. This will cause thermal runaway to develop. Understanding the risk of thermal runaway may be conducted more scientifically by defining several forms of battery thermal runaway and examining the heat generation in LIBs. In the study by Meng et al. [35], battery surface temperature and overheating are also important in thermal runaway risk analysis methods (including fault tree analysis (FT) and dynamic Bayesian network (DBN)). An overheated environment greatly increases the risk of thermal runaway. Under the condition of 3 C in the experiment, the maximum surface temperature of the battery reaches 81.6 °C. If the heat accumulation time is increased, it is easy to cause thermal runaway of the battery. Therefore, applying an effective battery thermal management (BTM) method such as CPCMs-based BTM during the process of battery temperature rising can effectively reduce the possibility of battery overheating, thereby reducing the risk of thermal runaway.
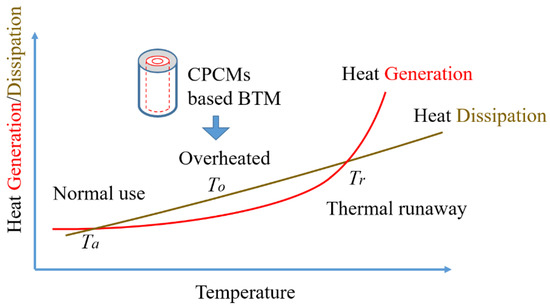
Figure 10.
Heat generation/dissipation and thermal runaway.
Wang et al. [36] believe that when the maximum temperature of the battery exceeds 50 °C, the battery’s cycle life and charging efficiency will both be severely shortened. As a result, the battery’s temperature must not exceed 50 °C. In the research of this paper, the 1 C discharge of the battery fully meets the requirements under the thermal management of CPCMs, and CPCM-3 can meet the requirements under the condition of 2 C discharge. In the previous LIB research on mechanical abuse by Ren et al., it was found that when the battery temperature rises less than 30 °C, its thermal runaway risk score is 0, and the risk level is 0–1. When the battery temperature rises in the range of 30–100 °C, the thermal runaway risk score is 50, the risk level is 2–3 and thermal runaway will occur. When the temperature rises above 100 °C in a short period of time, the thermal runaway risk score is 100, the risk level is 4–7 and there will be gas leakage, ejection, fire, explosion and other behaviors [37]. According to the experiment in this paper, the ambient temperature of the experiment is 25 °C. If the temperature rise should be controlled within 30 °C, the peak temperature of the battery surface should be below 55 °C. From Figure 7, it can be found that in the case of 1 C discharging, the highest temperature rise of all batteries is less than 55 °C, and the battery basically cannot experience thermal runaway. In the case of 2 C discharging, the CPCMs can effectively control the surface temperature of the battery, the maximum temperature of the battery is controlled from 62.6 °C to below 55 °C, and the risk of thermal runaway is reduced from level 2–3 to level 0–1. In the case of 3 C discharging, the highest temperature of the battery exceeds 80 °C, and the addition of CPCMs ensures that the battery temperature is controlled between 60 °C and 70 °C. Wang et al.’s research on the risk of thermal runaway of LIBs also maintained that the battery is at a very safe risk level when the surface temperature of the battery is below 70 °C [25]. Therefore, the CPCMs provided in this paper have a good inhibitory effect on the risk of battery thermal runaway.
The development of an emergency cooling system to lessen thermal overheating produced by the battery’s ongoing temperature rise is one of the finest ways to counteract and avoid abnormal battery functioning. An emergency cooling system’s usual novel design idea involves blasting or spraying a cooling medium onto the surface of a damaged battery cell to absorb heat. The chance of achieving the thermal runaway initiation temperature is diminished by the emergency cooling. In addition, this action also enables the thermal shielding of other adjacent battery cells in the event of thermal overheating of a faulty cell dissipating through radiated heat. To maximize the heat transfer capacity of the emergency cooling system, the CPCMs with good cooling effects should be popularized and applied.
The generation of LIB thermal runaway will cause the temperature of the surrounding batteries to rise, which will lead to the propagation of thermal runaway. This greatly increases the fire risk of the entire battery system. Some researchers have also found that the risk of spontaneous combustion of the entire battery pack system increases when the number of batteries in the battery system increases and the heat dissipation methods cannot be effectively used [38]. The application of CPCMs can also provide assistance to the heat management of the entire battery pack, thereby reducing the risk of the system. On the other hand, researchers realize that PCMs can be improved to be flame retardant, thereby inhibiting the spread of thermal runaway in battery packs [39,40]. This will also be the research trend and focus of future work, using PCMs to reduce the risk of thermal runaway propagation in LIB packs.
4. Conclusions
In this work, by analyzing the effect of PCMs with composite thermally conductive fillers on the safety prevention and control of LIB thermal runaway risks, the following conclusions are drawn:
- (1)
- There are no new chemicals created throughout the synthesis process, and the XRD diffraction peaks of CPCMs emerge at the same 2-Theta value as PA, EG and graphene;
- (2)
- Compared with PA, the thermal conductivity of the CPCMs is greatly improved. When the ratio of silica and graphene is 1:1, the thermal conductivity of the CPCM is the largest, which is 1.307 W/(m K);
- (3)
- CPCMs have a significant cooling effect on the thermal management of LIBs, and the battery surface temperature and temperature rise rate are effectively reduced. The cooling impact of CPCM-3 is the most pronounced of them. Compared with the experimental group without CPCMs, the maximum temperature of the battery surface decreased by 13.7 °C at 2 C discharging and decreased by 19 °C at 3 C discharging;
- (4)
- CPCMs have little impact on the battery performance but can effectively reduce the risk of thermal runaway and ensure its stable operation.
CPCMs can absorb a large amount of heat to reduce the surface temperature of the battery, without requiring additional energy consumption to ensure that the battery is used normally, and to improve battery safety. Therefore, it is worth continuing to study the thermal runaway risk safety prevention and control application of large LIB packs under the carbon peaking and carbon neutrality goals.
Author Contributions
Conceptualization, K.Z. and D.H.; Methodology, L.W. and K.J.; Validation, C.X.; Formal analysis, H.W.; Investigation, X.X.; Writing—original draft, K.J.; Writing—review & editing, K.Z. and D.H. All authors have read and agreed to the published version of the manuscript.
Funding
This research was funded by the National Natural Science Foundation of China, grant number 51976205 and the Zhejiang Provincial Natural Science Foundation of China, grant number Y23E040006.
Institutional Review Board Statement
Not applicable.
Informed Consent Statement
Not applicable.
Data Availability Statement
Not applicable.
Conflicts of Interest
The authors declare no conflict of interest.
References
- Ouyang, D.; Weng, J.; Chen, M.; Wang, J.; Wang, Z. Sensitivities of lithium-ion batteries with different capacities to overcharge/over-discharge. J. Energy Storage 2022, 52, 104997. [Google Scholar] [CrossRef]
- Zhang, X.; Li, Z.; Luo, L.; Fan, Y.; Du, Z. A review on thermal management of lithium-ion batteries for electric vehicles. Energy 2022, 238, 121652. [Google Scholar] [CrossRef]
- Lai, X.; Yao, J.; Jin, C.; Feng, X.; Wang, H.; Xu, C.; Zheng, Y. A Review of Lithium-Ion Battery Failure Hazards: Test Standards, Accident Analysis, and Safety Suggestions. Batteries 2022, 8, 248. [Google Scholar] [CrossRef]
- Ianniciello, L.; Biwolé, P.H.; Achard, P. Electric vehicles batteries thermal management systems employing phase change materials. J. Power Sources 2018, 378, 383–403. [Google Scholar] [CrossRef]
- Weng, J.; Huang, Q.; Li, X.; Zhang, G.; Ouyang, D.; Chen, M.; Yuen, A.C.Y.; Li, A.; Lee, E.W.M.; Yang, W.; et al. Safety issue on PCM-based battery thermal management: Material thermal stability and system hazard mitigation. Energy Storage Mater. 2022, 53, 580–612. [Google Scholar] [CrossRef]
- Tete, P.R.; Gupta, M.M.; Joshi, S.S. Developments in battery thermal management systems for electric vehicles: A technical review. J. Energy Storage 2021, 35, 102255. [Google Scholar] [CrossRef]
- Qian, X.; Xuan, D.; Zhao, X.; Shi, Z. Heat dissipation optimization of lithium-ion battery pack based on neural networks. Appl. Therm. Eng. 2019, 162, 114289. [Google Scholar] [CrossRef]
- Cao, Y.; Mansir, I.B.; Mouldi, A.; Aouaini, F.; Bouzgarrou, S.M.; Marzouki, R.; Dahari, M.; Wae-hayee, M.; Mohamed, A. Designing a system for battery thermal management: Cooling LIBs by nano-encapsulated phase change material. Case Stud. Therm. Eng. 2022, 33, 101943. [Google Scholar] [CrossRef]
- Amalesh, T.; Narasimhan, N.L. Introducing new designs of minichannel cold plates for the cooling of Lithium-ion batteries. J. Power Sources 2020, 479, 228775. [Google Scholar] [CrossRef]
- Wazeer, A.; Das, A.; Abeykoon, C.; Sinha, A.; Karmakar, A. Phase change materials for battery thermal management of electric and hybrid vehicles: A review. Energy Nexus 2022, 7, 100131. [Google Scholar] [CrossRef]
- Liu, K.; Yuan, Z.F.; Zhao, H.X.; Shi, C.H.; Zhao, F. Properties and applications of shape-stabilized phase change energy storage materials based on porous material support—A review. Mater. Today Sustain. 2023, 21, 100336. [Google Scholar] [CrossRef]
- Diaconu, B.M.; Cruceru, M.; Anghelescu, L. A critical review on heat transfer enhancement techniques in latent heat storage systems based on phase change materials. Passive and active techniques, system designs and optimization. J. Energy Storage 2023, 61, 106830. [Google Scholar] [CrossRef]
- Abu-Hamdeh, N.H.; Khoshaim, A.; Alzahrani, M.A.; Hatamleh, R.I. Study of the flat plate solar collector’s efficiency for sustainable and renewable energy management in a building by a phase change material: Containing paraffin-wax/Graphene and Paraffin-wax/graphene oxide carbon-based fluids. J. Build. Eng. 2022, 57, 104804. [Google Scholar] [CrossRef]
- Yang, W.; Zhang, L.; Guo, Y.; Jiang, Z.; He, F.; Xie, C.; Fan, J.; Wu, J.; Zhang, K. Novel segregated-structure phase change materials composed of paraffin@graphene microencapsules with high latent heat and thermal conductivity. J. Mater. Sci. 2017, 53, 2566–2575. [Google Scholar] [CrossRef]
- Saydam, V.; Duan, X. Dispersing different nanoparticles in paraffin wax as enhanced phase change materials. J. Therm. Anal. Calorim. 2018, 135, 1135–1144. [Google Scholar] [CrossRef]
- Guo, Y.; Yang, W.; Jiang, Z.; He, F.; Zhang, K.; He, R.; Wu, J.; Fan, J. Silicone rubber/paraffin@silicon dioxide form-stable phase change materials with thermal energy storage and enhanced mechanical property. Sol. Energy Mater. Sol. Cells 2019, 196, 16–24. [Google Scholar] [CrossRef]
- Jilte, R.D.; Kumar, R.; Ahmadi, M.H.; Chen, L. Battery thermal management system employing phase change material with cell-to-cell air cooling. Appl. Therm. Eng. 2019, 161, 114199. [Google Scholar] [CrossRef]
- Cao, J.; Ling, Z.; Lin, X.; Wu, Y.; Fang, X.; Zhang, Z. Flexible composite phase change material with enhanced thermophysical, dielectric, and mechanical properties for battery thermal management. J. Energy Storage 2022, 52, 104796. [Google Scholar] [CrossRef]
- Amano, K.O.A.; Hahn, S.-K.; Tschirschwitz, R.; Rappsilber, T.; Krause, U. An Experimental Investigation of Thermal Runaway and Gas Release of NMC Lithium-Ion Pouch Batteries Depending on the State of Charge Level. Batteries 2022, 8, 41. [Google Scholar] [CrossRef]
- Jiang, X.; Chen, Y.; Meng, X.; Cao, W.; Liu, C.; Huang, Q.; Naik, N.; Murugadoss, V.; Huang, M.; Guo, Z. The impact of electrode with carbon materials on safety performance of lithium-ion batteries: A review. Carbon 2022, 191, 448–470. [Google Scholar] [CrossRef]
- Wang, F.; Ke, X.; Shen, K.; Zhu, L.; Yuan, C. A Critical Review on Materials and Fabrications of Thermally Stable Separators for Lithium-Ion Batteries. Adv. Mater. Technol. 2022, 7, 2100772. [Google Scholar] [CrossRef]
- Gribble, D.A.; McCulfor, E.; Li, Z.; Parekh, M.; Pol, V.G. Enhanced capacity and thermal safety of lithium-ion battery graphite anodes with conductive binder. J. Power Sources 2023, 553, 232204. [Google Scholar] [CrossRef]
- Mallick, S.; Gayen, D. Thermal behaviour and thermal runaway propagation in lithium-ion battery systems–A critical review. J. Energy Storage 2023, 62, 106894. [Google Scholar] [CrossRef]
- Liu, Y.; Niu, H.; Xu, C.; Huang, X. Thermal runaway propagation in linear battery module under low atmospheric pressure. Appl. Therm. Eng. 2022, 216, 119086. [Google Scholar] [CrossRef]
- Wang, Z.; Chen, S.; He, X.; Wang, C.; Zhao, D. A multi-factor evaluation method for the thermal runaway risk of lithium-ion batteries. J. Energy Storage 2022, 45, 103767. [Google Scholar] [CrossRef]
- Brzezinska, D.; Bryant, P. Performance-based analysis in evaluation of safety in car parks under electric vehicle fire conditions. Energies 2022, 15, 649. [Google Scholar] [CrossRef]
- Zhang, W.; Ouyang, N.; Yin, X.; Li, X.; Wu, W.; Huang, L. Data-driven early warning strategy for thermal runaway propagation in Lithium-ion battery modules with variable state of charge. Appl. Energy 2022, 323, 119614. [Google Scholar] [CrossRef]
- Wang, Z.; Zhu, L.; Liu, J.; Wang, J.; Yan, W. Gas Sensing Technology for the Detection and Early Warning of Battery Thermal Runaway: A Review. Energy Fuels 2022, 36, 6038–6057. [Google Scholar] [CrossRef]
- Qu, Y.; Wang, S.; Zhou, D.; Tian, Y. Experimental study on thermal conductivity of paraffin-based shape-stabilized phase change material with hybrid carbon nano-additives. Renew. Energy 2020, 146, 2637–2645. [Google Scholar] [CrossRef]
- Wang, Q.; Mao, B.; Stoliarov, S.I.; Sun, J. A review of lithium ion battery failure mechanisms and fire prevention strategies. Prog. Energy Combust. Sci. 2019, 73, 95–131. [Google Scholar] [CrossRef]
- Ramadass, P.; Haran, B.; White, R.; Popov, B.N. Capacity fade of Sony 18650 cells cycled at elevated temperatures Part I. Cycling performance. J. Power Sources 2002, 112, 606–613. [Google Scholar] [CrossRef]
- Nagasubramanian, G. Electrical characteristics of 18650 Li-ion cells at low temperatures. J. Appl. Electrochem. 2001, 31, 99–104. [Google Scholar] [CrossRef]
- Wu, Z.-H.; Huang, A.-C.; Tang, Y.; Yang, Y.-P.; Liu, Y.-C.; Li, Z.-P.; Zhou, H.-L.; Huang, C.-F.; Xing, Z.-X.; Shu, C.-M.; et al. Thermal Effect and Mechanism Analysis of Flame-Retardant Modified Polymer Electrolyte for Lithium-Ion Battery. Polymers 2021, 13, 1675. [Google Scholar] [CrossRef]
- Börger, A.; Mertens, J.; Wenzl, H. Thermal runaway and thermal runaway propagation in batteries: What do we talk about? J. Energy Storage 2019, 24, 100649. [Google Scholar] [CrossRef]
- Meng, H.; Yang, Q.; Zio, E.; Xing, J. An integrated methodology for dynamic risk prediction of thermal runaway in lithium-ion batteries. Process Saf. Environ. Prot. 2023, 171, 385–395. [Google Scholar] [CrossRef]
- Wang, W.; Li, C.; Zeng, X.; Chen, J.; Sun, R. Application of polymer-based phase change materials in thermal safety management of power batteries. J. Energy Storage 2022, 55, 105646. [Google Scholar] [CrossRef]
- Ren, F.; Cox, T.; Wang, H. Thermal runaway risk evaluation of Li-ion cells using a pinch–torsion test. J. Power Sources 2014, 249, 156–162. [Google Scholar] [CrossRef]
- Kong, X.; Lu, L.; Yuan, Y.; Sun, Y.; Feng, X.; Yang, H.; Zhang, F.; Zhang, J.; Liu, X.; Han, X. Foreign matter defect battery and sudden spontaneous combustion. ETransportation 2022, 12, 100170. [Google Scholar] [CrossRef]
- Weng, J.; Xiao, C.; Ouyang, D.; Yang, X.; Chen, M.; Zhang, G.; Yuen, R.K.K.; Wang, J. Mitigation effects on thermal runaway propagation of structure-enhanced phase change material modules with flame retardant additives. Energy 2022, 239, 122087. [Google Scholar] [CrossRef]
- Dai, X.; Kong, D.; Du, J.; Zhang, Y.; Ping, P. Investigation on effect of phase change material on the thermal runaway of lithium-ion battery and exploration of flame retardancy improvement. Process Saf. Environ. Prot. 2022, 159, 232–242. [Google Scholar] [CrossRef]
Disclaimer/Publisher’s Note: The statements, opinions and data contained in all publications are solely those of the individual author(s) and contributor(s) and not of MDPI and/or the editor(s). MDPI and/or the editor(s) disclaim responsibility for any injury to people or property resulting from any ideas, methods, instructions or products referred to in the content. |
© 2023 by the authors. Licensee MDPI, Basel, Switzerland. This article is an open access article distributed under the terms and conditions of the Creative Commons Attribution (CC BY) license (https://creativecommons.org/licenses/by/4.0/).