Article

Modification of Soil Hydroscopic and Chemical Properties Caused by Four Recent California, USA Megafires

1
Division of Atmospheric Sciences, Desert Research Institute, Reno, NV 89512, USA
2
Joint Mass Spectrometry Centre, University of Rostock, 18059 Rostock, Germany
3
Department Life, Light & Matter (LLM), University of Rostock, 18059 Rostock, Germany
4
Division of Hydrologic Sciences, Desert Research Institute, Las Vegas, NV 89119, USA
5
Division of Earth and Ecosystem Sciences, Desert Research Institute, Reno, NV 89512, USA
6
Department of Physics, University of Nevada, Reno, NV 89557, USA
7
Division of Hydrologic Sciences, Desert Research Institute, Reno, NV 89512, USA
8
Joint Mass Spectrometry Centre, Cooperation Group “Comprehensive Molecular Analytics” (CMA), Helmholtz Zentrum München, 81479 München, Germany
*
Author to whom correspondence should be addressed.
Fire 2023, 6(5), 186; https://doi.org/10.3390/fire6050186
Submission received: 27 March 2023 / Revised: 24 April 2023 / Accepted: 26 April 2023 / Published: 3 May 2023

Abstract

:
While it is well known that wildfires can greatly contribute to soil water repellency by changing soil chemical composition, the mechanisms of these changes are still poorly understood. In the past decade, the number, size, and intensity of wildfires have greatly increased in the western USA. Recent megafires in California (i.e., the Dixie, Beckwourth Complex, Caldor, and Mosquito fires) provided us with an opportunity to characterize pre- and post-fire soils and to study the effects of fires on soil water repellency, soil organic constituents, and connections between the two. Water drop penetration time (WDPT) tests performed in the field showed a significant increase (from <1 s up to >600 s) in WDPT from pre- to post-fire soils. This increase in soil water repellency after fires was confirmed by increases in apparent contact angle (ACA) between 1.1 and 9 times from unburned to burned soils. The chemical characterization of burned soils with high resolution mass spectrometry showed the increased abundance of hydrophobic organics (e.g., PAH-like compounds and organic molecules with a low number of oxygen atoms) as well as the correlation of the average H/C ratio and aromaticity index (AI) with ACA. Most likely, these compounds contribute to post-fire soil water repellency that triggers hydrological effects such as landslides, flooding, and debris flows.

1. Introduction

It is well known that wildfires affect flora and fauna [1,2,3,4,5], burn various fuels [6], and emit large quantities of gases (e.g., CO2 and CO) and particles (e.g., black [7], brown [8,9], and organic carbon [10,11,12]) that are further modified during atmospheric transport [13,14,15,16]. Wildfires greatly affect air quality [17,18,19], human health [18,20,21], cloud formation and properties [22,23], and atmospheric light absorption and radiative forcing in the atmosphere [24,25,26] and after deposition onto snow [27,28]. Moreover, wildfires also alter soil properties [29], including soil wettability (or water repellency) [30,31,32,33,34]. Fire-induced soil water repellency (SWR) decreases water infiltration into the soil, leading to increased runoff, soil erosion, flooding, and debris flows [35,36,37].
Fire-induced SWR and its impact on watershed hydrology has been a focus of scientific research since the early 1960s [30,38,39]. Recent studies of wildfires in California and Colorado and their hydrological impacts showed an increase in mudslides, flash floods, and debris flows as a hydrological response to wildfire-burned areas [40,41,42]. In the past decade, the severity and frequency of wildfires have increased in forests of the western United States (USA) [43,44], especially in California, where ecosystems are dominated by dry conifers [45,46]. This increase is linked to current shifts in temperature and weather patterns due to vapor pressure deficit [47,48], fuel buildup caused by fire suppression [49,50], and a rapidly changing climate [47,51,52,53]. According to the Wildfire Activity Statistics report [54], in 2019, 7148 fire incidents burned 1122 km2 in California, in 2020, 8648 incidents burned 17,419 km2, in 2021, 7396 incidents burned 10,398 km2, while, in 2022, 7667 incidents burned 1473 km2 [55].
The four recent California wildfires, whose impacts on soil hydraulic and chemical properties are investigated here, are summarized in Table 1, and briefly described in the following. The 2021 Dixie fire was the largest single (i.e., non-complex) fire in the history of California with over 3890 km2 burned and over 1300 structures destroyed. On 18 August 2021, it also became the first fire known to have burned across the crest of the Sierra Nevada, CA. The adjacent 2021 Beckwourth complex fire burned 428 km2 and included the Sugar and the Dotta fire. Another very large 2021 California wildfire was the Caldor fire that burned an area of 897 km2 southwest of Lake Tahoe and destroyed 1003 structures. On 30 August 2021, Caldor became the second fire known to have burned across the crest of the Sierra Nevada, CA. For the Caldor fire, changes in physical soil properties have been studied in detail [56]. The largest 2022 California wildfire was the Mosquito fire that burned an area of 311 km2 west of Lake Tahoe causing “hazardous” air quality (up to 900 μg/m3 of PM2.5 in Reno, NV, USA) up to a few hundred km around the fire for approximately four weeks [57,58].
Fire-induced changes to soil hydraulic properties, and subsequent changes to infiltration, runoff, and erosion, can last from one to six years [59,60,61]. The combination of the climate-driven increase in fire frequency, size, and severity in the western USA, as well as soil erosion, flooding, and debris flows, highlight the urgency to investigate further fire-induced changes to soil hydraulic properties, especially SWR, its creation and remediations, and consequences for the hydrologic responses of watersheds to wildland fires [62]. The effects of fire temperatures on SWR have been studied for many years in laboratory and field conditions [63,64]. DeBano et al. [30] observed the strongest SWR between 175–200 °C, which is most likely due to chemical changes of soil organic compounds [65,66]. Several studies [31,67] reported that SWR can be disturbed at temperatures greater than 270 °C.
There are two commonly used and well-described parameters to measure SWR: water drop penetration time (WDPT) and apparent contact angle (ACA). The WDPT test measures the time needed for water droplets to be absorbed by the soil surface [38,68,69]. A recent study by Shillito et al. [68] used the classification system proposed by Bisdom et al. [70] and Doerr et al. [71] to assess the level of SWR in terms of WDPT. Bisdom et al. [70] and Doerr et al. [71] proposed the following ranges of WDPT values to classify the different levels of soil water repellency: wettable soil (WPDT < 5 s), slightly water-repellent soil (WDPT between 5 and 60 s), strongly water-repellent soil (WDPT between 60 and 600 s), severely water-repellent soil (WDPT between 600 and 3600 s), and extremely water-repellent soil (WDPT > 3600 s). In several studies [72,73], the ACA between the droplet and the soil surface, onto which the droplet was placed, has been measured with a goniometer. Goniometry is a powerful and sensitive method to determine the ACA to assess the wettability of fire-affected soils [74,75]. If the ACA is around or above 90°, the soil has strong water repellency (or low wettability), whereas if the ACA is below 90° the soil has medium or low water repellency [76,77,78].
In the past few decades, several studies characterized post-fire SWR in coniferous forests, such as in the Colorado Front Range (CO, USA) [69], near Orleans (France) [79], in the Blue Ridge Mountains (VA and NC, USA) [80], South-Central Chile [81], and North-West Spain [82]. Although the soil types, climate, and environments, as well as fire intensities, were different for all these studies, an increase in SWR due to fires, measured in terms of WDPT, was commonly observed. In addition, several authors [59,60,61] reported a wide range of “recovery times” (ranging from a few months up to six years [83]) after the fires, during which soils are returning to pre-fire soil conditions. This wide range is mainly due to different fire intensities, variations in soil types, and dissimilarity in litter. Several authors reported noticeable water repellency for unburned coniferous forest soils as well [82,84] and questioned the notion that unburned soils have low water repellency in general. A few papers described ACA measurements for the post-fire coniferous soils of coniferous forests worldwide [85,86] and in the western USA [84]. However, the question “What chemical soil modifications are behind the formation of fire-induced SWR?” is still far from being answered.
The literature on the nature of fire-induced SWR suggests that the chemical properties of soil organic matter (SOM) are changed by fire, turning the burned soil more water repellent than the unburned soil [31,78]. For example, Atanassova and Doerr [66] performed the gas chromatography mass spectrometry (GC/MS) analysis of individual organic species for extracts of eucalypt-forest soils, and they concluded that fatty acids (with a carbon count below 12) as well as aromatic compounds in conjunction with low molecular weight hydroxy acids and aromatics probably were responsible for the formation of extreme water repellency following heating. Mainwaring et al. [87] also performed the GC/MS analysis of individual soil organic species (sterols, linear alkanes, and fatty acids) loaded either on acid-washed sand or soils. They concluded that a combination of long-chain fatty acids (>C18) and alkanes caused water repellency. In contrast to Atanassova and Doerr [66], Mainwaring et al. [87] did not observe an increase in SWR when applying a C14 long fatty acid/alkane mixture to sandy soils. Our recent laboratory study [33] on acid-washed silica sand and the combustion of Jeffrey pine needles showed that even cold combustion smoke, ducted through initially organic-free sand, changed the sand from wettable (WDPT < 0.5 s) to severely water repellent (WDPT > 1000 s), while Uddin et al. [88] found that volatile organic compounds derived from vegetation combustion did not increase SWR. These different and to some extent contradictory results are due in part to the complexity and variety of organic constituents from different places, especially when soils are modified at different fire temperatures in the presence of different types of litter. Identifying individual organics accountable for pre- and post-fire water repellency is an extremely difficult task [89]. Despite a significant effort and several comprehensive studies on the chemistry of post-fire organic constituents in soils, a large gap remains in the current knowledge and understanding of which organic compounds are responsible for post-fire SWR. This study attempts to shed more light on the chemical nature of fire-induced SWR, using thermogravimetry (TG) atmospheric pressure photoionization (APPI) in combination with Fourier transform ion cyclotron resonance (FT-ICR) mass spectrometry (MS) (or TG APPI FT-ICR MS). The TG APPI FT-ICR MS method is a comprehensive state-of-the-art method to characterize complex mixtures of organic molecules including organic constituents in soils.
Thermal analysis methods are a common analytical standard for the chemical characterization of soil organic matter, and pyrolysis gas chromatography (Py-GC) with mass spectrometric detection and hard electron impact or soft field ionization in particular has been used for a broad variety of soil and soil-related materials [90,91]. Directly hyphenated thermal analysis methods, such as TG, have also been deployed for studying the pyrolytically released organic mixture, such as thermogravimetry with soft photoionization [92]. In the framework of wildfire-affected soil, Py-GC and spectroscopy techniques have been heavily deployed for examining real soils after wildfire events [91,93,94,95,96,97] or mimicking a fire event with laboratory-heating procedures [91,98,99]. It could be seen that burn intensity drives the alteration of phenolic lignin into polycyclic aromatic hydrocarbons (PAHs) [100]. However, direct mass spectrometric approaches with soft atmospheric pressure photoionization (APPI) have also been utilized for molecular-level elucidation in combination with high-performance mass analyzers. The electrospray ionization of SOM extracts has been extensively used for studying the molecular impact on the polar constituents [97,101,102,103]. In this respect, Roth et al. [101] have been able to speciate pyrogenic organic matter from a wildfire event by electrospray ionization and ultra-high resolution mass spectrometry, characterizing phosphor-containing species. However, extraction procedures can be tiresome and bear a risk of contamination and workflow bias. Moreover, sample preparation protocols often rely on the usage of strong acids, such as hydrofluoric acid, potentially altering the chemical composition. In this study, the advantages of thermal analysis, in terms of direct temperature-programable analysis, and high-resolution mass spectrometry, allowing for the discrimination of isobaric constituents, are combined by using TG APPI FT-ICR MS [104]. This concept allows addressing highly viscous and solid materials, resolving the tremendous molecular complexity, e.g., from residual chars [105,106], heavy petroleum fractions [107,108], or even meteorite organic matter [109]. To the best of the authors’ knowledge, this is the first study combining soil water repellency, quantified by means of WDPT and ACA, with molecular-level information given by direct high-resolution mass spectrometry of wildfire-affected soil samples.
The goal of the present research is to investigate SWR after real-life wildfires and link these soil properties to the fire-induced modifications of soil organic constituents. In the summers of 2021 and 2022, four megafires that occurred in the Sierra Nevada Mountains, CA, USA (i.e., the Dixie, Beckwourth Complex, Caldor, and Mosquito fires) provided us an opportunity to study such fire-induced soil modifications. We performed field and laboratory experiments to determine the level of water repellency of burned as well as unburned soils from these four fires and collected samples for further laboratory analyses to explore the chemical nature of fire-induced water repellency for the various soils. To assess SWR, WDPT tests were performed in the field shortly after the fires, as well as six and twelve months after the fires occurred. Samples of ash, burned soil, and unburned (“control”) soil were collected to measure their ACA in the laboratory using a goniometer. The WDPT and ACA results were summarized and compared with the results of comprehensive chemical analysis of the soil organic constituents of the collected samples employing TG APPI FT-ICR MS. By means of these different methods, we were able to link the water repellency of post-fire soils with organic components that are known to have hydrophobic properties. For example, we tested the hypothesis of whether aromatic organic constituents play an important role in soil hydrophobicity after wildfire events. To our knowledge, this is the first study on soil repellency and the comprehensive chemical composition of soil samples collected from recent California megafires.

2. Materials and Methods

2.1. Sample Locations and Fire Description

Study sites within the perimeters of the Dixie, Beckwourth Complex, Caldor, and Mosquito megafires that occurred in the Sierra Nevada Mountains of California, USA in 2021 and 2022 [55] were chosen for this research. The first set of WDPT tests were carried out in the field and bulk samples were collected right after the fires (within two weeks after the individual fire was contained) at all four locations. Water drop penetration time tests were run six months and one year post-fire and soil as well as ash samples were collected for the three 2021 fires Dixie, Beckwourth Complex, and Caldor (Table 2). In the field, each bulk sample (10–100 g of ash or soil per sample) was packed into an aluminum foil envelope and then into a separate zip-lock bag and kept in a cooler with ice during transportation to the laboratory. Prior to laboratory analyses, samples were stored refrigerated at −20 °C. The sampling spots were selected based on visual observation of the areas, and areas with medium or high burn severity were selected. The maps and pictures of the chosen areas are presented in Figure 1 and Figure S1, respectively.
Table 1 summarizes information about the four wildfires and gives the coordinates of the four study sites where soil and ash samples were collected and field measurements of WDPT were performed. These locations were selected based on available fire maps and on visual observations of the post-fire landscapes yielding sampling locations with high burn severity where ground fuels were uniformly and fully consumed over an area larger than ~30 m2 (Figure S1). Three types of soil surfaces were characterized in the field with the WDPT test and the following samples were collected at each location: (i) ash—fine particles remaining and deposited on the soil surface after the complete combustion of litter and ground fuels (Figure S2a); (ii) burned soil—the top 5–10 mm layer of the mineral soil surface underneath the ash (Figure S2b); and (iii) unburned (or control) soil—the top layer of the mineral soil collected at the unburned areas of the same soil type closest to the fire-affected sites (Figure S2c).
Detailed descriptions of all fires, soil burn severities, and their potential effects on the environment (soil erosion, vegetation recovery, hydrologic responses, etc.) are provided in the Burned Area Emergency Response (BAER) reports [110] for these four fires. Briefly, a post-fire BAER assessment of the Dixie fire identified ~52% of the fire area as moderate soil burn severity, while ~5% was assigned high soil burn severity. The remaining area (43%) was classified as unburned/very low and/or low soil burn severity. For the Caldor fire, moderate and high soil burn severities were estimated for 13.1% and 41.2% of the fire area, respectively. The remainder of the fire-affected landscape was rated as low soil burn severity (46.3%) and “not rated” (or rock outcrop) (6.2%). For the Beckwourth Complex fires, the combination of the Dotta and Sugar fires, 48.4% of the fire area was classified with moderate and 7.5% with high soil burn severity. In the case of the Mosquito fire, moderate and high soil burn severities were 25% and 9.3% of the fire area, respectively. According to the BAER reports for all four fires, herb and shrub recovery for areas of moderate and high burn severity is expected to be within 1–10 years, while for mature forest recovery will take 50–100 years. Overall, these fires were characterized as medium-to-intense fires; however, the burn severity was not homogeneous for fire-affected areas on a scale from a few square meters (m2) to a few square kilometers (km2).
Dominant soil and forest types are presented in Table 1 and Table 2, with all four fire areas being dominated by mixed pine and Sierran mixed coniferous forests, with greater representation of Sierran montane hardwood forest in the Mosquito fire area. The soil at the Dixie location is classified as a Luvic Phaeozem of the Fopiano-Sattley families complex characterized as a cobbly sandy loam (66% sand, 19% silt, and 15% clay with a SOM content of 1.5%; fractions of dry soil mass) in the top 0 to 8 cm of the soil profile. The soil at the Beckwourth Complex location is a Leptic Phaeozem, part of the Franktown-Sattley families complex and characterized as an extremely cobbly loam (42% sand, 38% silt, and 20% clay) with a SOM content of 2% in the top 0 to 18 cm of the soil profile. For the Caldor location, the soil is a Meeks gravely loamy coarse sand (Dystric Arenosol) with 84% sand, 11% silt, 5% clay, and SOM content of 5% in the top 0 to 28 cm of the mineral soil profile. In case of the Mosquito fire, the soil is a McCarthy cobbly loam (Andic Cambisol) with a SOM content of 6% in the top 0 to 25 cm of the soil profile and 45% sand, 45% silt, and 10% clay. Soil properties for all sampling locations were obtained from the USDA-NRCS Web Soil Survey [111] using the coordinates given in Table 1. Note that percentages of sand, silt, clay, and SOM reported above were calculated by dividing the mass of the dry sand, silt clay, and SOM fractions of the soil by the total dry mass of the soil bulk sample.

2.2. Water Drop Penetration Time (WDPT) Measurements

Water drop penetration time measurements were performed at all four sampling sites shortly after each of the four fires was contained as well as six months and one year after the Dixie, Caldor, and Beckwourth Complex fires (Table 2). The WDPT method is widely used and well documented elsewhere [33] so we only give a brief description here. For the WDPT test, five to ten droplets of deionized water were applied to the ash or soil surfaces from a height of ~1 cm using a disposable 2 mL-volume glass pipette (VWR, Radnor, PA, USA) equipped with a latex bulb (Fisher Scientific, Pittsburg, PA, USA). The mass of each droplet was 25 ± 4 mg. The WDPT was determined as the average time it took for the droplets to be absorbed by the soil or ash surfaces (Figure 2—WDPT measurement in the field). The WDPT recording was stopped at 600 s even if the drop was still visible on the soil surface. This was to reduce the influence of droplet changes not related to infiltration, such as due to evaporation.

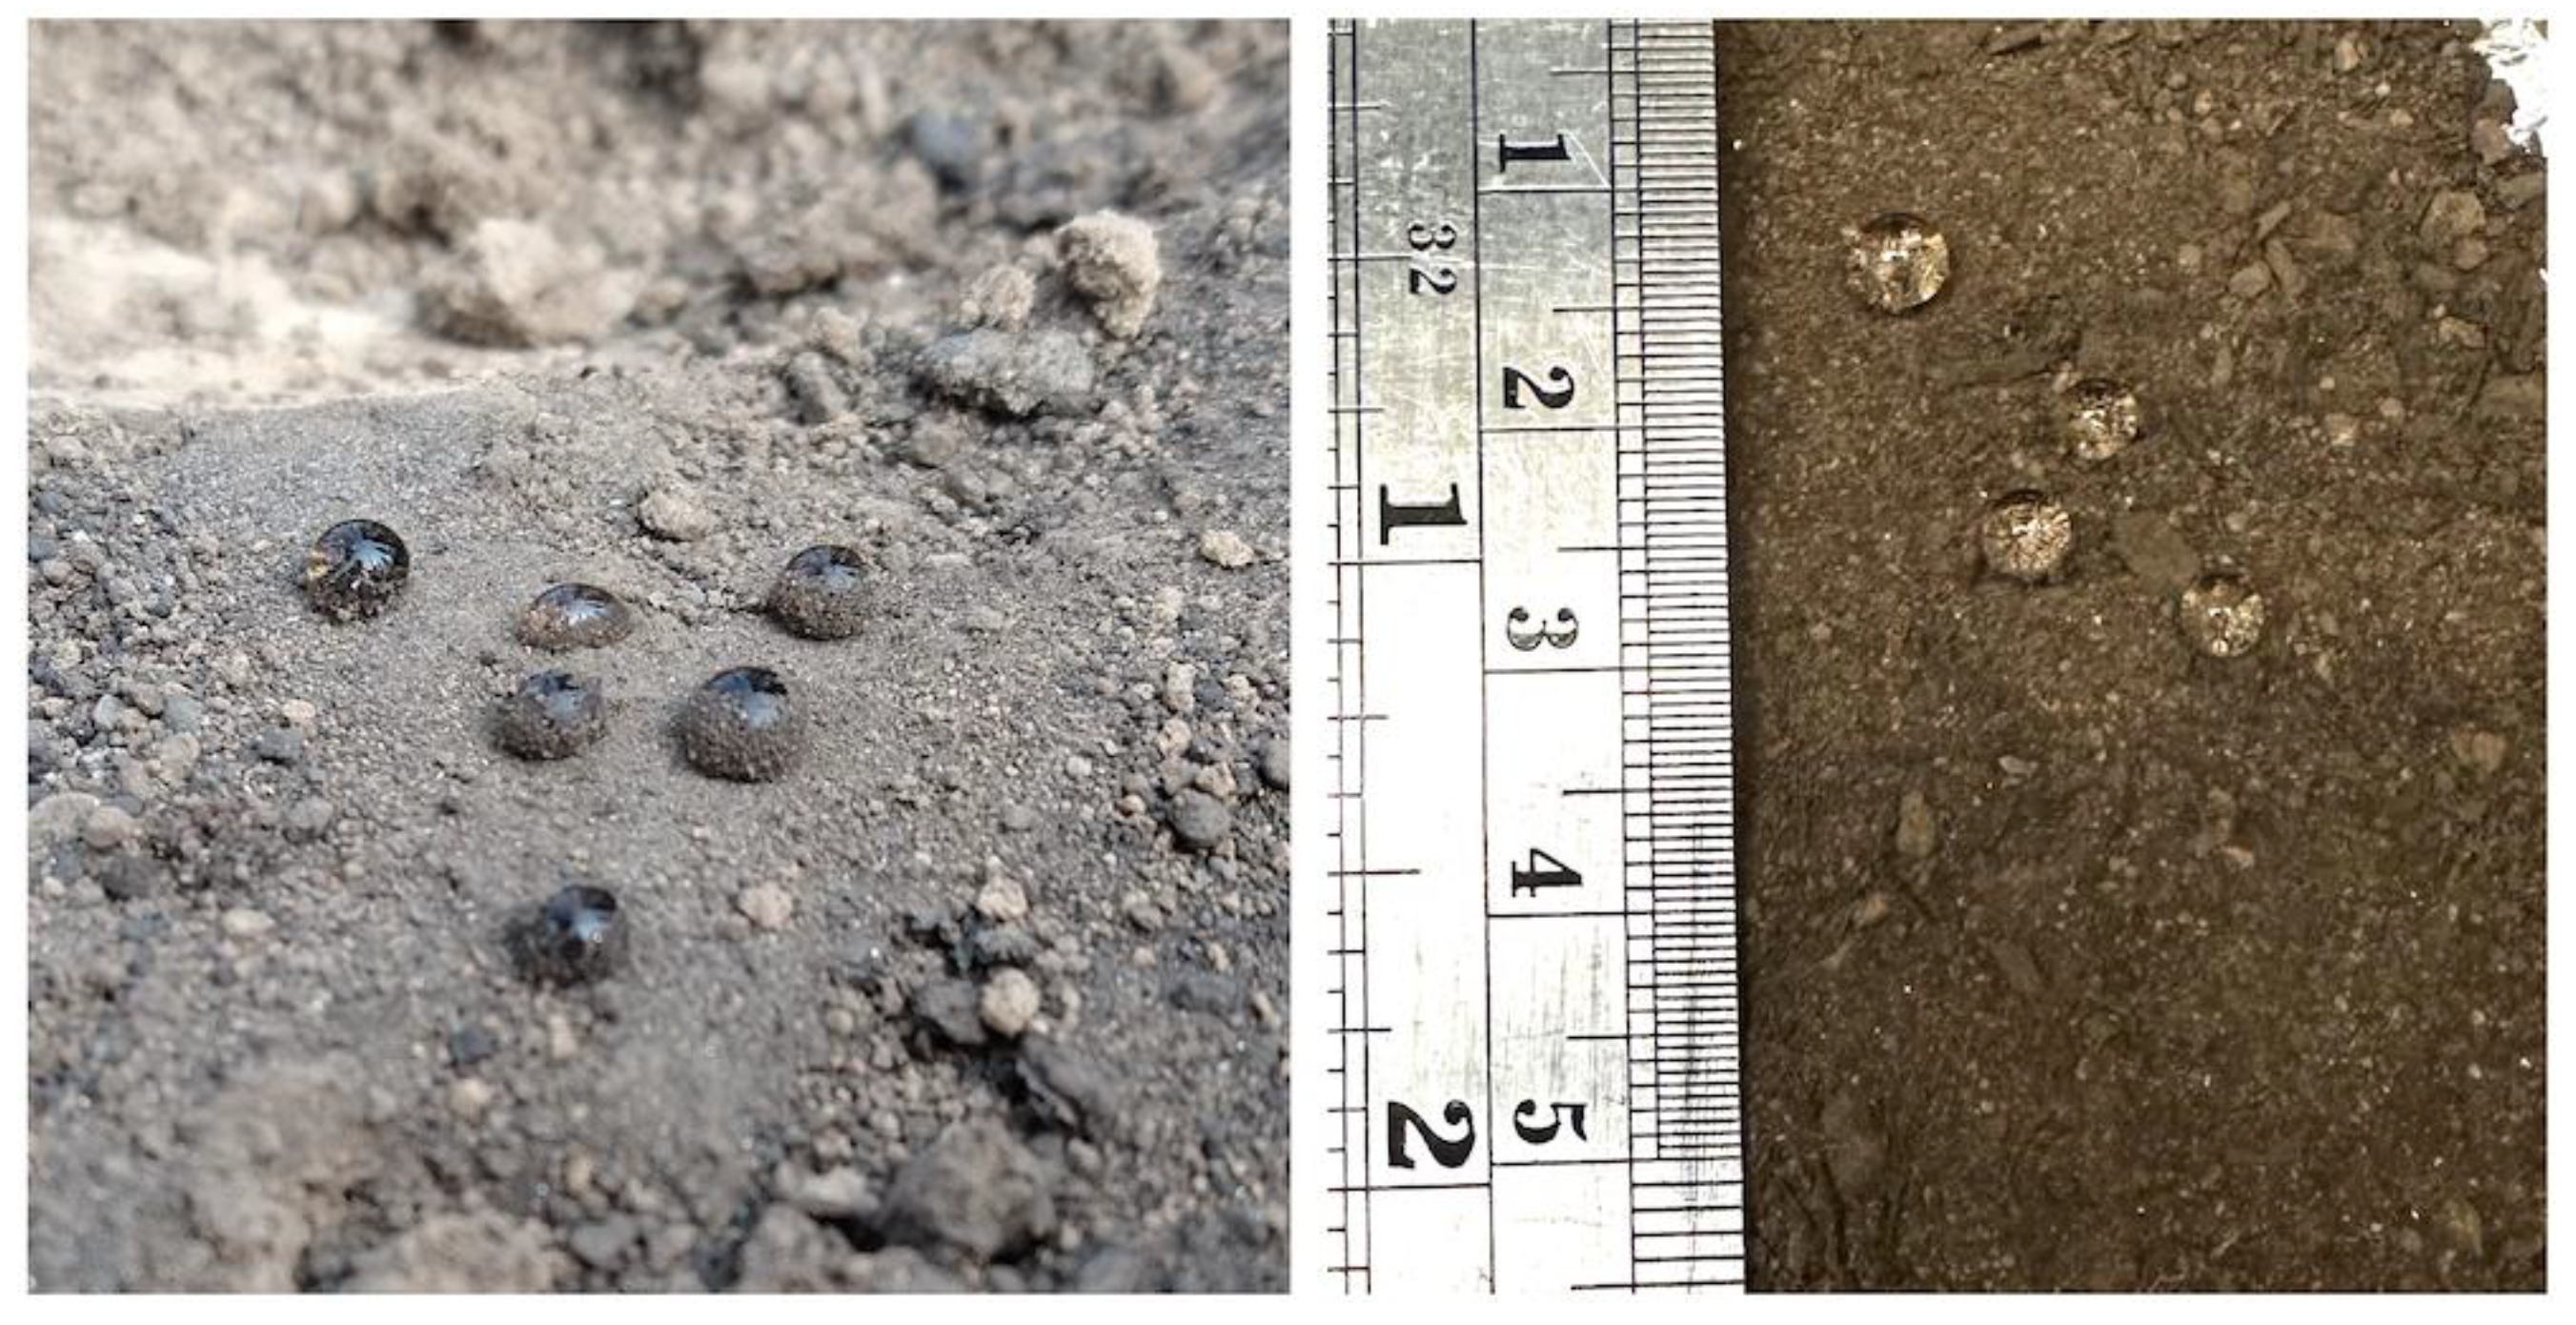
2.3. Apparent Contact Angle (ACA) Measurements

Prior to the ACA measurements, soil subsamples of the ash and soil bulk samples were brought up to room temperature (23–24 °C) then air-dried at room temperature with relative humidity (RH) ranging between 10% and 30% for at least 12 h before being prepared for the goniometer tests. Larger soil aggregates in the subsamples were gently broken down with a pestle and mortar. All subsamples were then sifted with a sieve of 500 μm mesh size (ASTM E-11, No. 35; Soiltest Inc., Evanston, IL, USA).
For the ACA measurements, subsamples were mounted on glass microscopy slides, hereafter termed “sample slides”. To create the sample slides, double-sided adhesive tape Scotch (Hutchinson, MN, USA) and 3M (Saint Paul, MN, USA) Permanent Double-Sided Tape “Narrow”) was attached to one side of a blank glass slide. The slide was then “dipped” into dried, sieved subsample soil material so that the surface of the adhesive tape was completely coated with and holding some excess soil material. The excess soil material was then removed by turning the slide over and gently shaking the slide 1–3 times. Alternatively, if there was not enough material present to “dip” the slide into the soil material (~5 g), approximately 0.2–1 g of soil was sprinkled onto the surface of the adhesive tape with a pre-cleaned spatula until the adhesive tape was completely coated and holding excess soil material. The excess soil material was removed by turning the sample over and gently shaking the slide 1–5 times.
The ACA was measured with a goniometer (model FTÅ1000, First Ten Ångstroms Inc., Portsmouth, VA, USA). For each measurement, a drop of deionized water (8 μL drop volume) was dispensed from a syringe through a 27-gauge needle onto the sample slide, followed by optically measuring the ACA between the water drop and the underlying soil surface on the sample slide using FTÅ1000’s high resolution camera, zoom microscope, and image analysis software. On each sample slide, 5–10 replicate measurements could be carried out. Figure 3a shows the FTÅ1000 goniometer with sample stage, high resolution camera, and zoom microscope. Figure 3b shows an example of six water drops on a sample slide during a goniometer test.

2.4. TG APPI FT-ICR MS Measurements

The organic constituents of the soil samples were characterized by thermogravimetry with evolved gas analysis. For this purpose, a thermobalance is hyphenated to a high-resolution mass spectrometer for direct analysis of the complex evolved gas mixture along a temperature gradient. The thermobalance gives temperature-resolved data on the sample mass loss and residual weight information. More specifically, a thermobalance (TG 209, Netzsch Gerätebau, Selb, Germany) is coupled to a modified Bruker GC-APCI II source (Bruker Daltonics, Bremen, Germany), equipped with a Krypton vacuum ultraviolet discharge lamp (10/10.6 eV, 124/117 nm) for soft APPI. Further details and a scheme of the equipment are given elsewhere [106,112].
Changes in the chemical composition of the soil affected by wildfires were addressed by supplement thermogravimetry evolved gas analysis. For this purpose, selected soil samples from the Caldor, Dixie, and Beckwourth fires were analyzed (Table 2) with APPI being applied as an ionization scheme to sensitively ionize non-polar constituents [113]. Particularly aromatic compounds, often suspected of having a decisive influence on hydrophobicity [96,100,103], were efficiently detected. Thermal analysis enabled us to desorb a gas mixture from the samples, which evolved as a function of temperature, for subsequent mass spectrometric description. Adsorbed volatile and semi-volatile compounds were intactly detected at lower temperatures during the thermo-desorption phase. At elevated temperatures, non-volatile larger molecular humin structures were pyrolyzed within the inert nitrogen atmosphere and diagnostic fragments were detected [107,113].
Depending on the sample (ash, burned/unburned soil) behavior in terms of mass loss, 20–60 mg of the sample was placed in an aluminum crucible directly prior to the analysis without any sample pretreatment, except that the samples were brought back to room temperature (~20 °C) before the analysis. This input weight was adjusted for each sample to gain sufficient signal intensities for the mass spectrometric evolved gas analysis. The measurements were performed in an inert nitrogen atmosphere with a flow rate of 200 mL/min. The temperature program was as follows: 2 min isothermal equilibration at 20 °C, then ramp up the sample temperature to 600 °C at a rate of 20 °C/min, followed by holding the temperature constant at 600 °C for 39 min. The evolved gas mixture was sampled with a 280 °C interface and guided to the ion source via a heated transfer line (280 °C, deactivated fused silica capillary, 0.53 mm inner diameter, length 3 m). For the ionization chamber, a nebulizer gas flow of 4.5 L/min and a dry gas flow of 1.5 L/min were used. A Bruker Apex II ultra Fourier-transform ion cyclotron resonance mass spectrometer (FT-ICR MS) equipped with a 7 T superconducting magnet was used as an analyzer (positive mode; m/z 100–1000; resolving power 260 k at m/z 400) [104]. Thermogravimetry APPI FT-ICR MS analyses were performed only for the ash and soil samples collected shortly after the Caldor, Dixie, and Beckwourth Complex fires (Table 2).
Data processing was performed with Bruker Data Analysis 5.1 (Bruker Daltonics, Bremen, Germany), self-written MATLAB (MATLAB R2019b, MathWorks, Natick, MA, USA) routines, and the in-house data processing and assignment software CERES [106,108,114]. First, an external m/z calibration was performed using the characteristic thermal degradation pattern of polystyrene. Second, an internal m/z calibration based on the manually identified CHOx homolog rows was achieved. The resulting mass spectra were peak picked with a minimum signal-to-noise ratio of nine, exported, and sum-formulae-attributed for each scan individually (scan-by-scan time-resolved processing) utilizing a maximum error of 1 ppm and the following chemical boundaries: C2–100H2–200N0–1O0–6S0–1. The aromaticity index (AI) and double bond equivalents (DBE) were calculated from the attributed sum formulae based on the equations given elsewhere [115].

3. Results and Discussion

3.1. Water Drop Penetration Time (WDPT)

Figure 4 summarizes the results of the WDPT measurements performed in the field shortly after each of the fires was contained. In all cases, a significant increase in WDPT was observed (a 3.5- to 300-fold ratio in mean WDPT values) for burned soils compared with unburned (control) soils. The lowest WDPT values were found for the unburned soils of the Dixie, Beckwourth, and Mosquito fires, ranging from 0.5 to 5 s, which classified these soils as “wettable” following Doerr et al. [84]. Remarkably, for the Caldor fire the average WDPT of the control soil was 166 ± 93 s, which classifies the soil as “strongly” water-repellent, even though it had not been exposed to fire for at least one century [56]. Unburned soils are typically considered “wettable”. However, high levels of water repellency have been reported for unburned soils in coniferous forests [82,84,86]. Many different factors may cause water repellency in unburned forest soils and the origin of soil water repellency in these soils is still not well understood. Possible causes for water repellency in forest soils are hydrophobic organic compounds, such as resins and waxes from fresh and dead leaves and needles [116,117], fungal activity that may increase the concentration of hydrophobic compounds in the soils [118], soil texture (e.g., coarse sands) in combination with high levels of SOM [119], as well as low soil moisture content [120]. In our study, all the soils analyzed were from typical western USA Sierra Nevada region coniferous forests where Jeffrey and Ponderosa pines are the most abundant trees and sources of litter [83]. A Mediterranean climate with hot and dry summers and generally wet and cold winters is common for all the fire areas of our study [121,122]. We hypothesize that the “strong” water repellency of the unburned soil in the Caldor fire region might be due to the difference in soil texture (high sand fraction) as well as the higher SOM content found at the Caldor location compared to the other three locations (Table 1). In addition, hydrological and/or biologic activities and hydrophobic organic constituents from the thick smoke of the Caldor fire may have affected local soils for over four weeks [33]. Despite the elevated level of SWR for the unburned soil at Caldor, the mean WDPT value for the burned soil was approximately 3.5-fold higher than the mean WDPT value for the unburned soil. The results from the WDPT tests agreed well with the ACA values for the same soil (presented in Section 3.2). For the ash layers, WDPT values were consistently <1 s for all the tests performed in this study, indicating that the ash found on burned soils at the four study sites was wettable and with WDPTs similar to values reported in the literature [123,124].
The comparison between the soils at all the sampling sites showed that burned soils reached levels of “strong” soil water repellency with mean WDPT values ranging from 267 to 550 s (Figure 4) and either “severe” or “extreme” water repellency for the ~30% to 95% of WDPT values that reached the maximum recording time of 600 s. As mentioned in Section 2, the WDPT measurements were stopped at 600 s due to visible droplet evaporation. Thus, soils for which the WDPT tests were stopped after 600 s may have had even higher than the here-reported levels of SWR. Our WDPT results align well with several other studies that reported a significant increase in SWR due to fires in coniferous forests [37,69]. However, these are the first reported measurements for the recent (2021–2022) megafires in the Californian coniferous forests of the Sierra Nevada, CA.

3.2. Apparent Contact Angle (ACA)

The results of the ACA measurements are shown in Figure 5. For all four fires, the ACA values of burned soils were between 1.1 and 9 times higher than the ACA values for unburned soils from the same study site. As expected, based on our WDPT measurements (Figure 4), the smallest ratio of ACA change between burned and unburned soil (1.1-fold increase) was found for soil from the Caldor fire. However, the ACA increase was still statistically significant with p = 0.0001 (average ACA of 119 ± 6° for burned compared to 105 ± 7° for unburned soil, N = 15). Also, the average ACAs for the unburned and burned soils of the Caldor fire area were greater than 90° and, hence, both unburned and burned soils would be classified as hydrophobic in terms of ACA [75,78], in agreement with our WDPT results. For the unburned soils from the other three fires, however, the mean ACAs were 10° for the Mosquito fire, 11° for the Beckwourth Complex fires, and 16° for the Dixie fire with a minimum value of 10° (noting that an ACA of 10° corresponds to the detection limit of the goniometer) and there was a maximum value of 35° for all the unburned soils tested from these three fires. Surfaces with such small ACAs are classified as hydrophilic [78]. The differences in average ACA between the unburned soil from the Caldor site and the other three sampling sites may be due to the thick layer of litter/duff that was found above the unburned soils for the Caldor site but not for the other three sites. Litter/duff at the mineral soil surface is a likely source of organic components, such as waxes, resin acids, and terpenoids, that could increase SWR as well as being a sign of increased fungal activity in the soil known to affect SWR [116,125,126]. Interestingly, based on our WDPT and ACA measurements, the strongest SWR for the burned soil samples was observed for the soils with the highest SOM content (Caldor and Mosquito) in their unburned soils (Table 2).
Apparent contact angle measurements for soils from coniferous forests are rather sparse. Doerr et al. [84] presented ACA measurements for “natural background” soils collected in coniferous forests for six north-western states of the United States. The authors reported ACAs for “natural background” soils of between 90° and 135° and called attention to naturally highly repellent soils. These results agreed well with our ACA measurements for unburned soils collected within the Caldor fire area (Figure 5). However, Doerr et al. [84] did not include soils with low repellency levels. The mean ACAs for the burned soils were diverse among fires, with the lowest value for the Dixie fire (66° ± 36°) and the highest for the Caldor fire (119° ± 6°) (Figure 5). For the Dixie fire, the ACA varied the most (min: 41°, max: 113°), likely because irregular/patchy areas with different burn severity occurred even within a few square meters. Although several studies on the water repellency of post-fire coniferous forest soils have been published [30,38,69,81], analyses of ACAs for these types of samples, especially for the Sierra Nevada, CA region, are generally missing, which is particularly surprising considering that this is an extremely fire-prone area [44,55].
Our next step was to assess the temporal change of the SWR in terms of WDPT and ACA. Figure 6 presents the results of the WDPT and ACA measurements for burned soil samples right after the fire (hereafter termed “zero-months”), six months, and one year after the burn for the Dixie, Beckwourth Complex, and Caldor fires (Table 1). For the Mosquito fire that occurred in September–October 2022, only data for zero-months after the burn were available. Comparing the values between the zero-month and one-year data after the fires for burned soils, no statistically significant changes in WDPT and ACA values were observed for all three 2021 fires, except for a slight increase in WDPT for the Dixie fire (from 268 ± 195 s to 521 ± 158 s, p = 0.015) and a statistically significant decrease (p = 0.0001) in ACA for the Beckwourth Complex samples (from 88.9° ± 4.6° to 65.3° ± 9.6°). Interestingly, the WDPT values for the same fire had not changed significantly by the one-year mark compared to the values right after the fire. Our visual observations also concluded that, one year after the megafires, there were no notable changes, such as any vegetation recovery or visual disappearance of the ash layer at all three sampling sites (Table 2). In general, after one year, SWR had not changed for the Dixie, Caldor, and Beckwourth Complex fire sampling sites. The WDPT and ACA measurements of unburned soils for these fires also showed no change in SWR (Figure S8). Similarly, Chen et al. [80] performed WDPT field tests for soils after wildfires in the broadleaf deciduous forests of the Blue Ridge Mountains (USA). Their measurements also showed no SWR for most unburned samples and strong SWR for burned samples. However, they did observe some degree of SWR diminishing one year after the fires. There are several studies on the temporal evolution of SWR after coniferous forest wildfires in the western USA [69,127], and the common understanding is that typically 1–2 years (for some areas 3–5 years) are needed for the soil to reach pre-fire hydrophobicity levels. Since extremely large forest areas were affected by the 2021–2022 megafires in California (Table 1, Figure 1), and current rapid climate change may contribute to the timing of soil and forest post-fire recovery, further monitoring of post-fire SWR and research on chemical changes in fire-affected soil organic constituents are needed.
To study the role of organic constituents that may cause fire-induced SWR, we performed the comprehensive chemical characterization of burned, unburned, and ash samples with TG APPI FT-ICR MS and compared the chemical properties of their organic constituents with our WDPT and ACA measurements (Section 3.3).

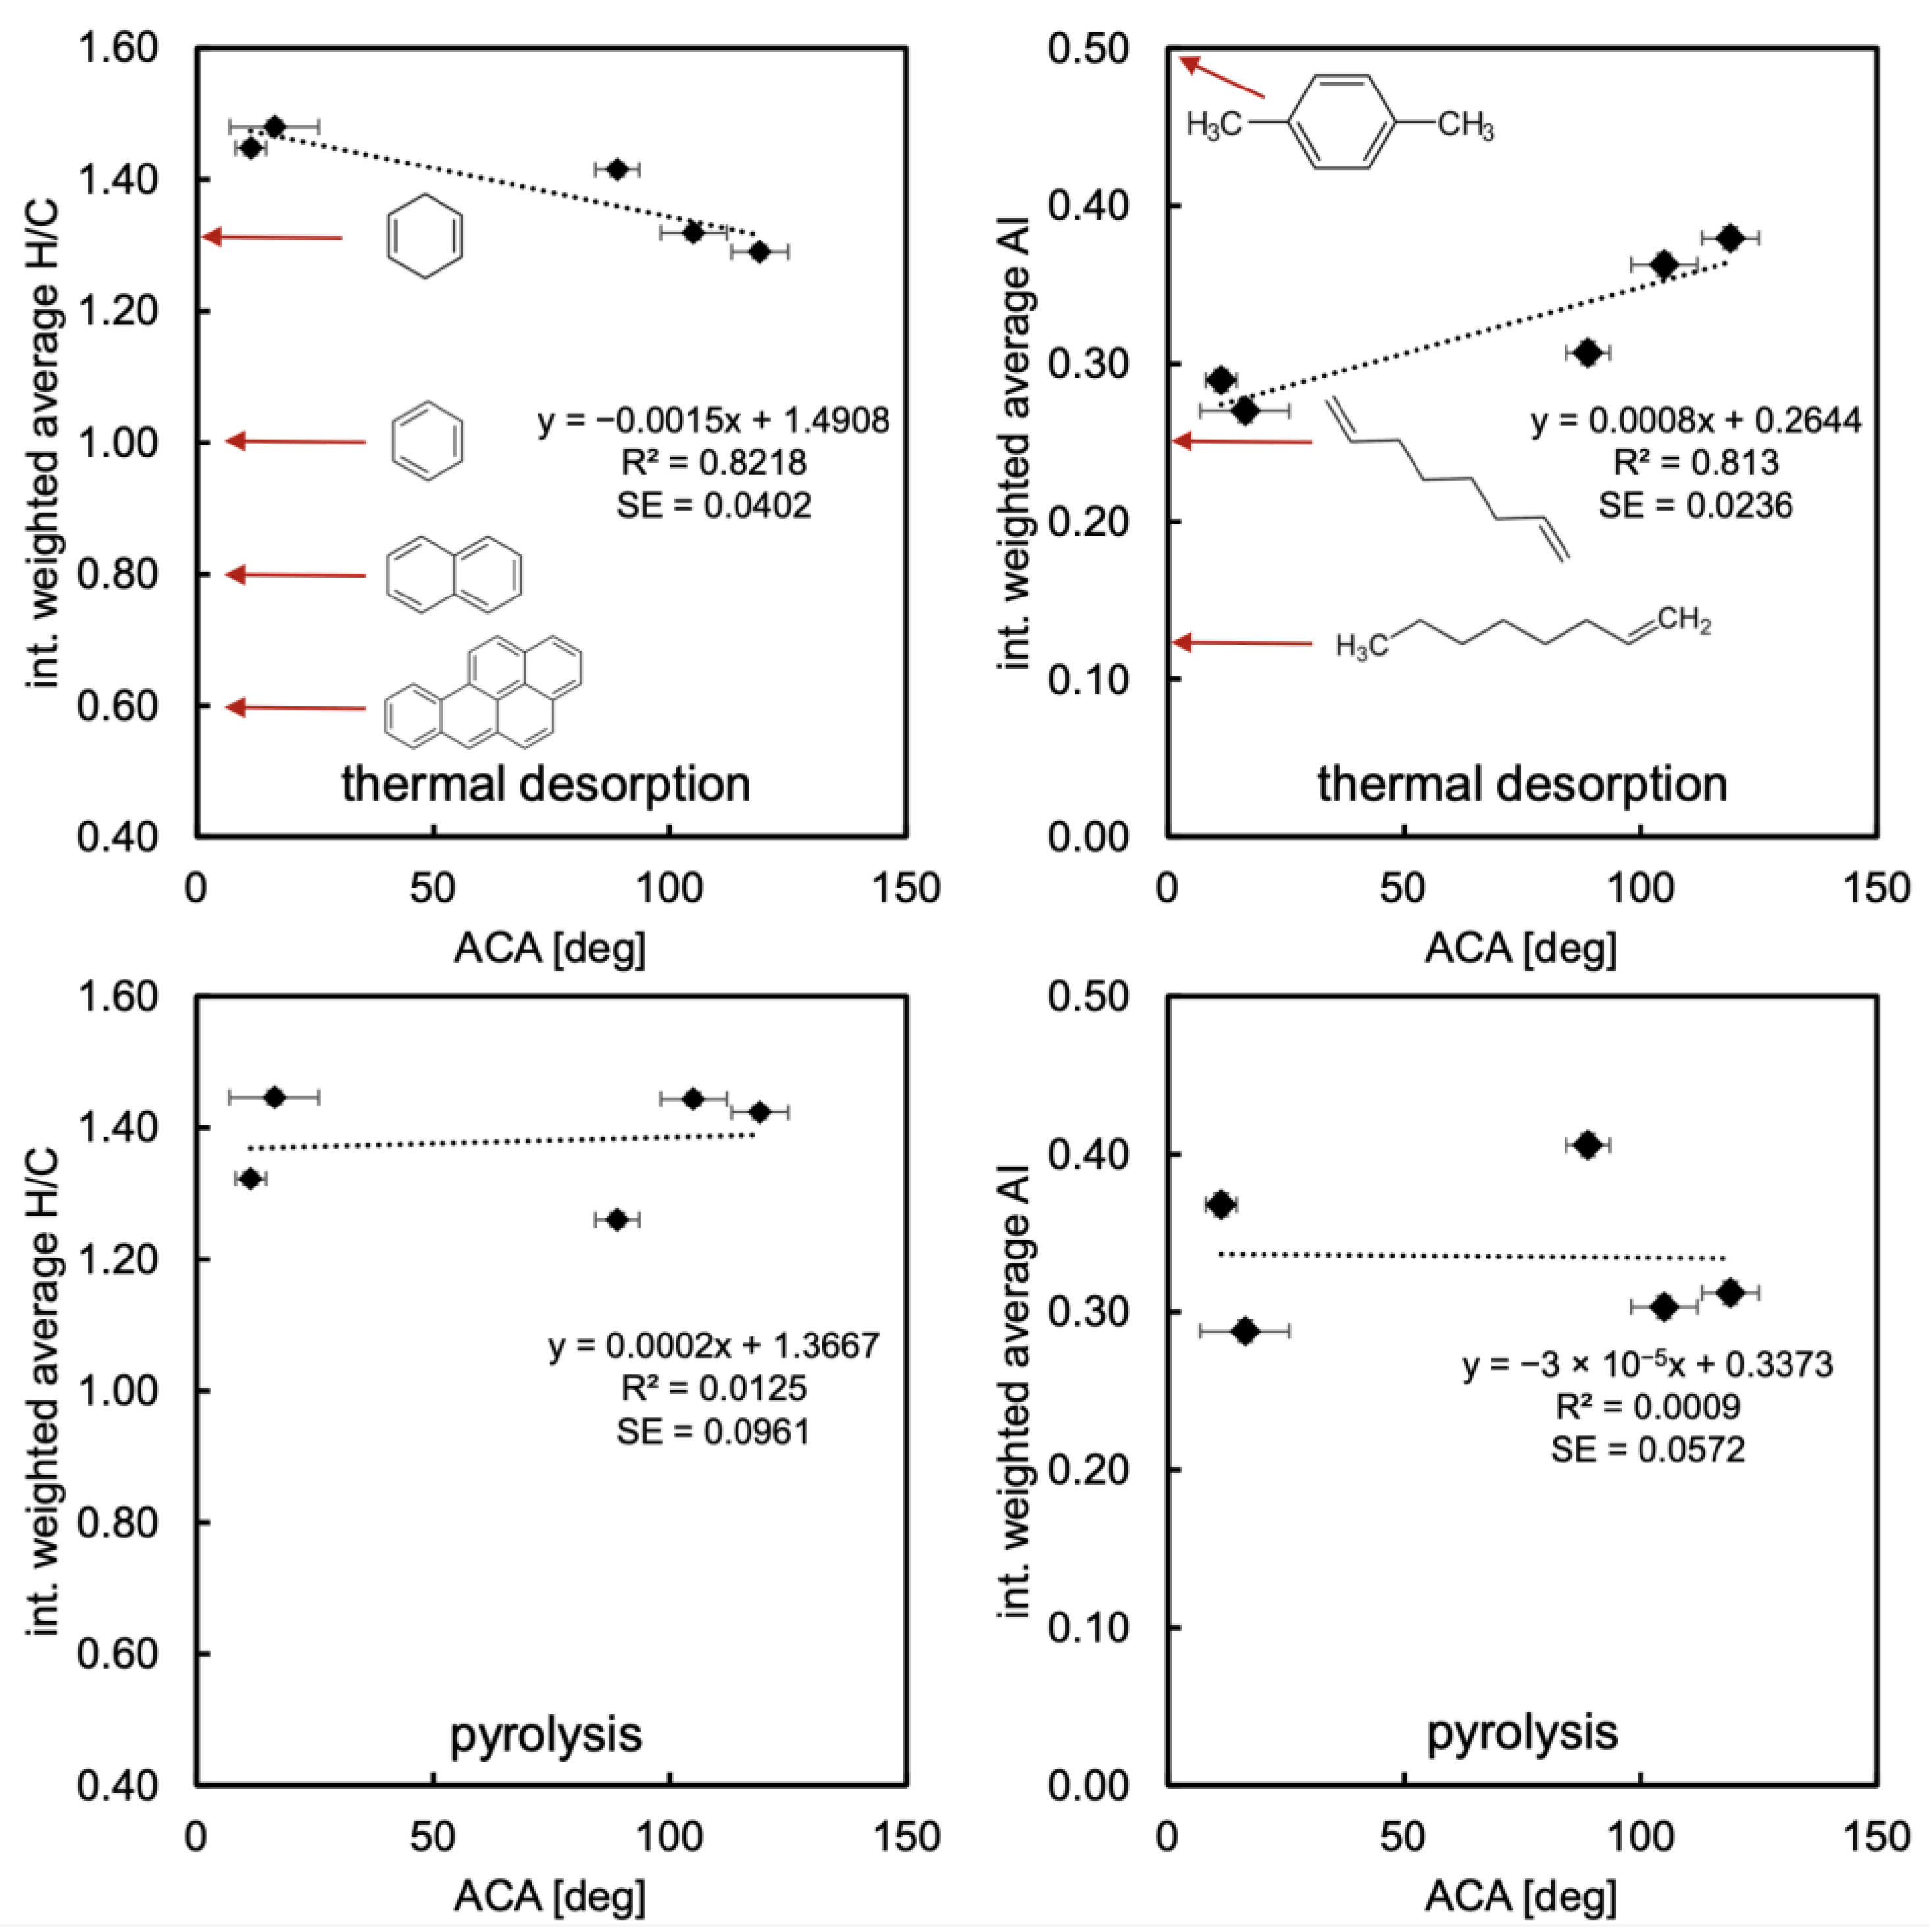
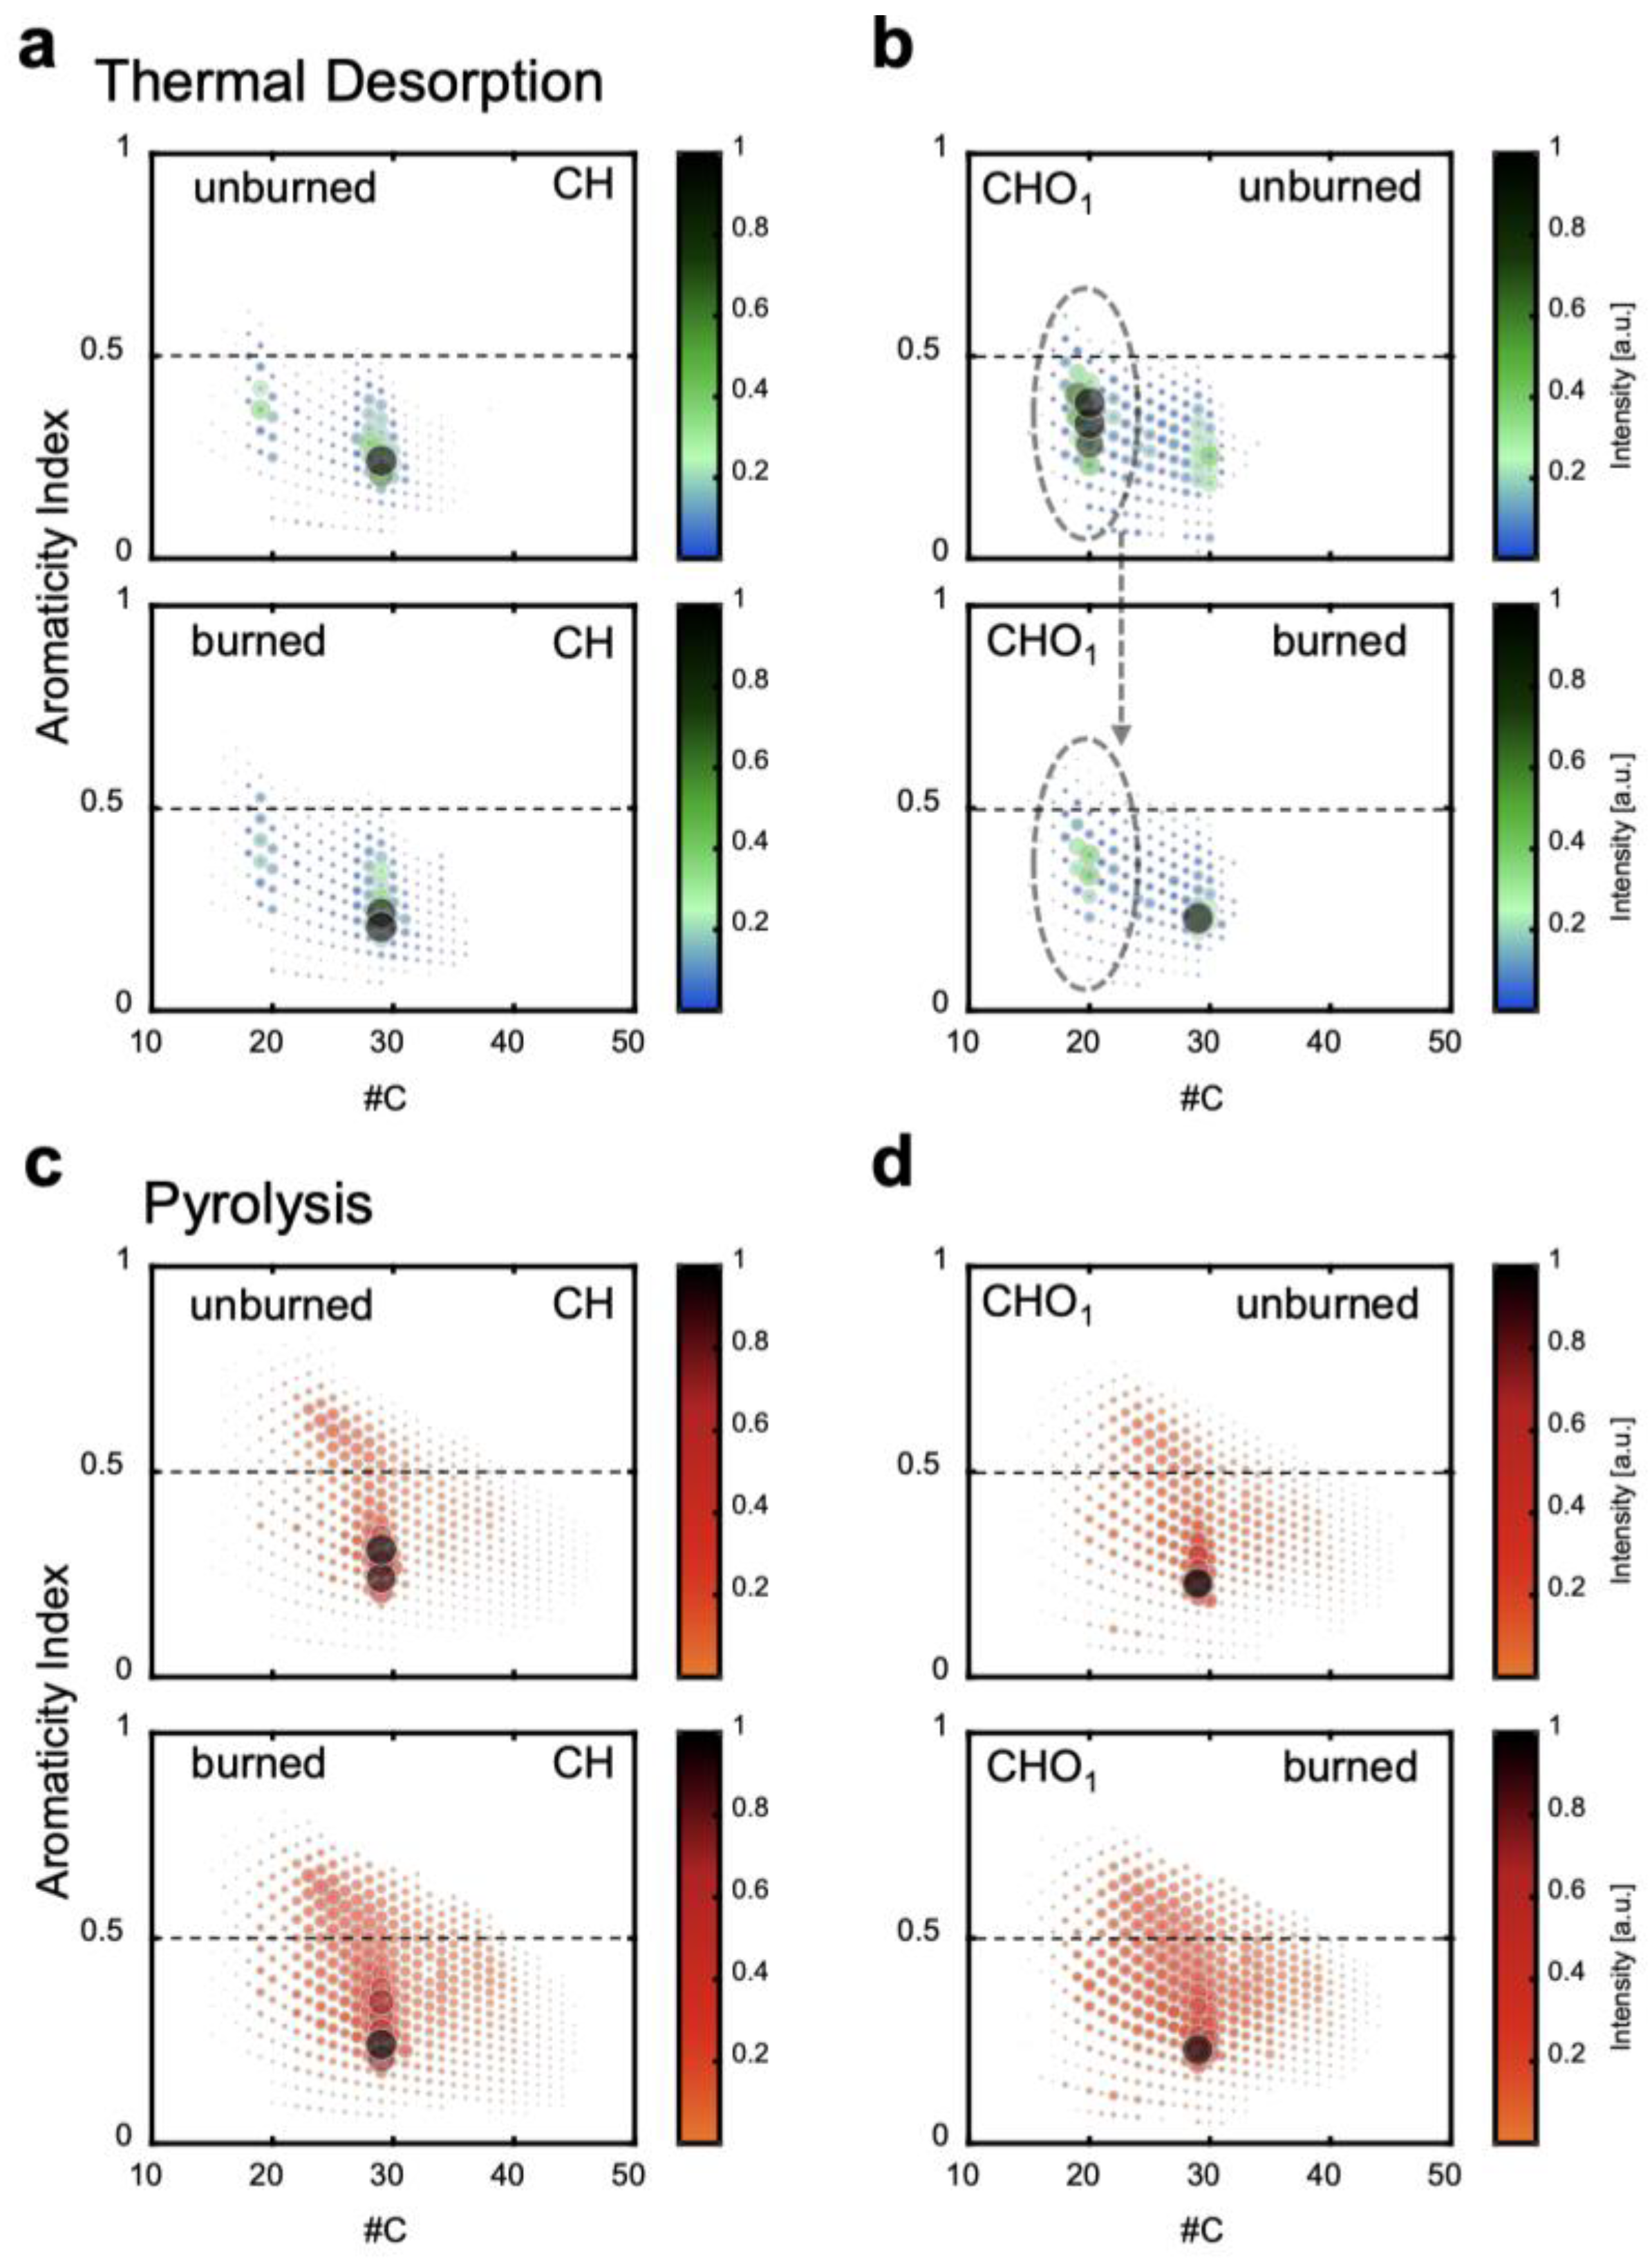
3.3. Chemical Characterization of Organic Constituents with TG APPI FT-ICR MS

3.3.1. Thermogravimetric Analysis

The results of our thermogravimetric analysis showed a distinct mass loss curve for the averaged triplicates of all three sample types (ash, unburned, and burned soil), with ash showing the lowest amount of mass loss (~7 w%) followed by burned soil and control soil with approx. 9 and 10 w% (Figure S4). During the equilibration phase (isothermal at 20 °C, 200 mL/min nitrogen), a small mass loss of volatile compounds adsorbed to the soil surface, such as small organics or residual water, was observed. The detected mass loss curves in the thermal desorption phase (~20–270 °C) were almost identical for the three sample types. This stage was followed by a larger thermal desorption step that transitioned into the pyrolysis phase at around 270 °C. During the pyrolysis phase (temperatures > 270 °C), the largest deviation in mass loss was observed, with ash showing only minor losses while both burned and control soil displayed the largest amount of mass loss. During the pyrolysis phase, organic constituents in the soil are decomposed and the dominating macromolecular humic structures are degraded [128]. The mass loss of the burned soil sample was lower than the mass loss of the unburned soil (by ~0.7 w%), which could be explained by the effect of the wildfire on the soil. High temperatures during the fire may have led to the thermal decomposition of soil organic constituents at the soil surface or the evaporation/degradation of lighter compounds, such as free fatty acids, which finally decreased the amount of vaporizable soil organic constituents.

3.3.2. Mass Spectrometric Evolved Gas Analysis

The evolved gas mixture from the thermal analysis was directly subjected to high resolution mass spectrometry equipped with APPI. For data analysis, mass spectrometric response below 270 °C is classified as thermal desorption, whereas constituents detected at temperatures above 270 °C are referred to as pyrolysis products. This temperature separator was based on the onset of the pyrolysis visible in the thermograms (Figure S4) and was similar for all sample types. The detection of the complex mixture via FT-ICR MS allowed for sub-ppm mass accuracy and the resolution of isobaric constituents. Consequently, chemical information was retrieved by the attribution of sum formulae to the mass spectrometric signals. Exemplarily, the normalized averaged mass spectra of these assigned elemental compositions for the Caldor burned and control soil are given in the supporting information (Figure S5), composed of several hundred up to thousands of sum formulae.
The direct comprehension of complex mass spectra is often difficult and demanding. For this purpose, specific chemical parameters can be accessed from the sum formulae directly, such as the oxygen-to-carbon ratio (O/C). As measures for aromaticity, commonly double bond equivalents (DBE), the aromaticity index (AI), or the hydrogen-to-carbon ratio (H/C) are used (Table S1). These sum parameters were chosen for testing the hypothesis of the particular importance of aromatic constituents for soil hydrophobicity after wildfire events [86,129]. To prove the importance of aromatics on these surface properties, measures for unsaturation (H/C) and aromaticity (AI) were correlated with ACA (Figure 6) and WDPT (Figure S6) values, based on data from five soil samples, revealing sufficient mass spectrometric response and data quality. Interestingly, a negative correlation was found for the ACA versus H/C (lower H/C indicates higher aromaticity), whereas a positive correlation was found for the ACA versus AI (Figure 7), for the desorption phase. This result shows that aromatic organic constituents, such as hydrophobic PAHs, do contribute to the SWR that caused large ACA values for the burned soils. Even though H/C and AI are both measures for unsaturation (when more double or triple bonds are present in organic molecules), H/C is not considering further heteroelements, whereas for calculation of the AI, oxygen and nitrogen atoms are considered [115]. Particularly for the soil organic constituents including the residual compounds of wildfire aerosol, oxygen as a heteroelement is substantial. Thus, correlation with AI reveals a higher slope than with H/C (or DBE, not visualized). For the WDPTs (Figure S6), only a slight correlation can be found for the desorption phase, which is mostly caused by higher error deviations for these field-testing data. No trend is apparent from the evolved gas mixture during pyrolysis, and within the error bars of the measurements neither the ACA nor the WDPT seem to be significantly correlated with unsaturation. However, the significance of these results is limited by the small sample set (N = 5) and further experiments are needed for statistical evaluation in the future.
Forest fires can affect the soil chemistry on different complex pathways, either through the thermal alteration of SOM [66,130] or/and, as was recently described in the literature [33], it could be via the deposition of smoke compounds on the soil surface. In contrast to gaseous wildfire emissions, the related aerosol particles are not migrating efficiently through the porous soil layers but could cause direct effects on top of the upper forest soil layer. Gaseous wildfire aerosol is dominated by smaller volatile products as well as larger lignocellulosic degradation products such as methoxyphenols, levoglucosan, mannosan, galactosan, terpenoids, and steroids. Here also, one- to four-ring aromatics, e.g., benzene, naphthalene, phenanthrene, pyrene, and oxygen-functionalized derivatives, can be found in high concentrations; these are classically referred to as “pyromolecules” [94].
The coating of the surfaces of soil particles and pores with smoke components may significantly alter soil surface properties as addressed by the ACA and WDPT measurements but might lead only to minor compositional changes for the bulk material as investigated via thermal analysis mass spectrometry. This might still be true despite the high surface area of soil due to its porosity. Volatile and semi-volatile species condense on these surfaces, altering physicochemical properties such as hydrophobicity. Consequently, volatile and semi-volatile compounds could be detected during the thermal desorption phase at lower temperatures where condensed surface coatings are desorbed. In contrast, the thermal alteration of SOM would affect not only the surface but also deeper layers for prolonged wildfire events, even the full bulk material, when the macromolecular humin structure is changed. Based on the cleavages of bridges and side chains, smaller aromatic compounds can be formed. These species would most likely be released during the thermal desorption phase. Nonetheless, a significant alteration of the macromolecular backbone would have happened, addressed at elevated temperatures during the pyrolysis phase in thermal analysis mass spectrometry. However, no correlation and no significant changes in the pyrolysis pattern were found, contradicting this pathway and hypothesis. The thermal alteration of the SOM seems less pronounced, which might be due to too low soil temperatures during the fire event, short reaction times, or the specifics of the SOM itself, such as soil or forest type. Based on these results, we can conclude that particulate matter and gaseous components stemming from the combustion of fuel at or above the soil surface by the fire may likely have caused the hydrophobicity found for the burned soils of the Caldor, Beckwourth Complex, and Dixie fires.
Apart from average metrics, such as O/C, H/C, DBE, and AI, sum formulae consisting of the same heteroatoms can be grouped into compound classes (Table S2). Figure 8 depicts the oxygen number distribution for the Caldor fire control and burned soils, divided into thermal desorption and pyrolysis phases. A clear trend towards lower oxygen numbers for the burned soil thermal desorption phase was found, whereas for the pyrolysis phase oxygen-number distribution seemed unaffected. This finding agrees with the low effects of wildfire on the macromolecular system and the higher impact of wildfire on the volatile and semi-volatile fraction addressed during the thermal desorption phase and linked to condensed aerosol compounds. Moreover, lower oxygen numbers in molecules for the burned soils relative to the unburned soils also explain high SWR in the burned soils, since smaller numbers of oxygen-containing functional groups (e.g., carboxylic, hydroxyl) make organic molecules less hydrophilic. Interestingly, for the Beckwourth Complex fire (Figure S7) this effect is less pronounced, and there seem to be some changes in the oxygen-number pattern for the macromolecular structure addressed by pyrolysis. This finding points out the strong heterogeneity and different nature of the investigated fire event as well as soils and of real wildfire-affected soils in general. Nonetheless, the mass spectrometric response was an order of magnitude lower for the Beckwourth fire data, limiting further insights on fire-affected soil organic chemistry in this study.
As a suitable approach for comparing the shared chemical space, the number of similar sum formulae between sample types has been established in the high-resolution mass spectrometry of complex mixtures of organic compounds [131]. In contrast to Venn diagrams, which can be unclear and hard to read for a higher number of sample types, an upset plot is an effective means to visualize the intersections between multiple data sets [132,133,134]. Generally, a higher diversity in heteroatom combination is found for the pyrolysis phase than for the desorption phase, indirectly reflecting the complex thermal degradation processes of humic species, peptides, and other polar low-volatile constituents. In comparison, the molecular-level analysis revealed that over 85% of the detected organic compounds from the desorption and pyrolysis phases were similar between the burned and unburned (control) soil (Figures S8 and S9). Thus, purely from an occurrence of compounds, pre- and post-wildfire samples were very similar. Interestingly, almost all the compounds detected for the ash sample were also found in the control and burned soil for both phases. Moreover, a large fraction of compounds unique to the burned soil and found in the pyrolysis phase was attributed to CHOS-class, likely a result of the degradation of peptides. However, from an abundance perspective, these species were close to the detection limit and, thus, for further discussion, an abundance-based perspective is needed in this application.
Ultimately, the complex sum formulae information is to be used and visualized on a molecular level. For this purpose, so-called finger-print plots are often used, such as DBE versus carbon number (#C) or the Van Krevelen diagram (H/C versus O/C), expressing each individual detected sum formula as a marker in a scatter-type visualization. Here, we used the representation of #C versus AI (Figure 9). As can be seen by the high number of similar sum formulae between unburned and burned soil, the same chemical space is covered. Nonetheless, distinct differences in the abundance profile can be depicted. A major change was found in the occurrence of CHO1-class compounds with C15–25. A substantial reduction of oxygen-containing molecules was found after the wildfire event or in the burned soils, which makes the burned soils overall less hydrophilic and agrees with the average trend correlated with ACA (Figure 7). In contrast, changes for the CH class were almost negligible. No significant changes in the intensity-weighted average metrics and class distribution were found for the pyrolysis phase. This finding became apparent when analyzing the AI versus #C plots for the pyrolysis phase. Here, no shift in the center of gravity was found, but overall high mass spectrometric response covers the same chemical space. The exact nature of this phenomenon cannot be explained by the given data yet. However, we hypothesize that these pure hydrocarbons and low oxidized species with lower polarity were released/formed to a greater extent by the first thermal alteration reactions of the macromolecular structure. This cracking of sidechains and bridges between the building blocks of the humic fraction may have allowed an easier discharge during thermal analysis. Previous studies on wildfire-affected soil utilizing extracts and electrospray high-resolution mass spectrometry may not have been able to address this low-polar chemical space, potentially overlooking certain effects. Consequently, future research is needed for deeper insights into the effects of wildfire events on larger SOM constituents.

4. Conclusions

We studied changes in the physical and chemical properties of mineral soil surfaces from the four megafires Dixie, Beckwourth Complex, Caldor, and Mosquito that occurred in 2021 and 2022 in the Sierra Nevada mountains of California (US). For all four fire sites, a significant increase in SWR was observed between unburned and burned soils with WDPT increased from <1 s up to 600 s (maximum measured value) and ACA values increased between 1.1 and 9 times. The pre-fire SWR levels were assessed by analyzing unburned soils near the fire sites. We found that even though the fire sites have similar climate and vegetation types, the SWR for unburned soils was noticeably elevated at the Caldor fire site (ACA: 105 ± 7°, WDPT 166 ± 93 s) compared to the Dixie, Beckwourth Complex, and Mosquito fire sites; pre-fire soils were characterized as wettable (ACA: 10°–16.4°, WDPT < 1–2.14 s), in contrast with previous studies on the natural high repellency of coniferous forest soils in the western USA. Six months and one year after the 2021 megafires (Dixie, Caldor, and Beckwourth Complex megafires), our WDPT and ACA measurements showed no significant changes in SWR for unburned and burned soils. For these three sites also, little to no vegetation recovery has occurred. This is most likely because fire sites with high burn severity were selected for the study, and for these conditions water repellency can be expected to remain for 2–6 years after the fire.
The comprehensive chemical characterization of organic constituents with TG APPI FT-ICR MS was performed to assess the chemical nature of organic constituents in the soil before and after the fires. As expected, the results from the TG analysis showed a higher mass loss for unburned than for burned soil samples and a lower mass loss for ash compared to soil samples. Most likely, the heat from the fires partly decomposed and/or evaporated organic constituents from the soil. The positive correlation (R2 = 0.813) between ACA values and aromaticity (AI), derived from the APPI FT-ICR MS spectra for the desorption (or pre-pyrolysis) phase (~20–270 °C temperature range), suggests that burned soils may become water repellent because of the formation and/or deposition of PAH-like organic species on the soil surface. Moreover, we found that organic molecules with a higher amount of oxygen in their structure are more common in unburned than in burned soil samples, which may also have contributed to the more hydrophobic (or more water-repellent) behavior of the burned compared to the unburned soils.
Overall, our research revealed that the chemical composition described by AI and H/C ratio for organic molecules in soils is closely correlated with fire-induced SWR determined by ACA, with ACA being a more sensitive parameter than WDPT to quantify fire-induced SWR. This is the first study to show that ~15% of organic constituents detected by TG APPI FT-ICR MS in burned soils are different from those in unburned soils. These changes in detected compounds were probably due to chemical changes in organic compounds at the soil surface during the fire in combination with the deposition of smoke compounds onto the soil surface. Our study has several limitations: (i) there was a small sample size of large fire areas, (ii) only the top layer of the soils was analyzed, and (iii) only moderate and severely burned areas were studied. However, the study confirms previous findings on the occurrence of fire-induced SWR in the Sierra Nevada mountains and sheds light on the chemical nature of the organic compounds in the soil that cause fire-induced SWR. The results of our project suggest the need for additional SWR research including: (i) quantifying the contribution of combustion smoke organics deposited onto soil surfaces to SWR and identifying the relative importance of this process compared to that of chemical changes of SOM due to fire heating; (ii) investigating temporal changes in the chemistry of fire-induced water-repellent soils and if and how they correlate with ACA changes; and (iii) studying how post-fire organics contribute to soil and water toxicity based on the knowledge of their PAH nature determined here.

Supplementary Materials

The following supporting information can be downloaded at: https://www.mdpi.com/article/10.3390/fire6050186/s1, Figure S1: Pictures of the four sites selected for the WDPT tests performed in the field and for sampling of ash and soil samples: (a) Dixie fire, (b) Beckwourth Complex fires, (c) Caldor fire, (d) Mosquito fire; Figure S2: Three types of the collected samples: (a) ash, (b) burned soil, (c) unburned (or control) soil. The samples in these pictures were collected right after the Dixie fire; Figure S3: Maps and sampling sites: (a) Dixie fire, (b) Beckwourth Complex fires, (c) Caldor fire, (d) Mosquito fire (maps adopted from Google Maps web and USA Forest Service); Figure S4: Thermogram (mass loss, left y-axis) of averaged triplicates for ash (orange dotted line), control soil (blue solid line), and burned soil (magenta dashed line) of the Caldor fire with temperature program indicated by red solid line (right y-axis). The ash revealed the lowest mass loss (~7 w%), whereas control and burned soil showed very similar maximum mass loss at around 9–10 w% with slightly higher evaporation for the control soil; Figure S5: Normalized average mass spectra of assigned elemental compositions for Caldor burned soil (left) and control soil (right) separated into thermal desorption (20–270 °C, top), pyrolysis phase (270–600 °C, middle) as well as an average over the whole temperature range (20–600 °C, bottom); Figure S6: Water drop penetration times (WDPT) [s] versus intensity weighted average hydrogen-to-carbon ratio (H/C) and aromaticity index (AI) for the thermal desorption (20–270 °C, top) and pyrolysis (270–600 °C, bottom) phases for five soil samples (Caldor, Beckwourth, Dixie). No trend is apparent from the evolved gas mixture during pyrolysis, whereas a slight correlation might be given for the constituents released during thermal desorption. Error bars indicate standard deviation; Figure S7: Oxygen number distribution (sum of intensity of every compound with the respective number of oxygen) of burned soil (left) and control soil (right) from Beckwourth fire divided into thermal desorption (TD, 20–270 °C, top) and pyrolysis phases (pyro, 270–600 °C bottom). Absolute intensities have been normalized by the deployed sample weight; Figure S8: Results of WDPT and ACA measurements for burned soil samples: 0 months (2 weeks), 6 months, and 1 year after fire containment; p-values were calculated using unpaired t-test (N = 5–15, α = 0.05); Table S1: Intensity weighted average sum parameter for the results of the TG APPI FT-ICR MS experiments. pyro—pyrolysis phase 270–600 °C, TD—thermal desorption phase 20–270 °C, DBE—double bond equivalents, AI—aromaticity index; Table S2: Compound class distribution with absolute intensities normalized to the sample mass. Herein, CHO refers to all compounds solely containing oxygen as heteroatom, likewise for the other heteroatom combinations. pyro—pyrolysis phase 270–600 °C, TD—thermal desorption phase 20–270 °C; Figure S9: Upset plot of the averaged thermal desorption phase (20–270 °C) from all three Caldor fire soil samples (control pre-fire soil, burned post-fire soil, and ash). The compound class distribution for the respective interest is indicated by a color-coded stacked bar plot; Figure S10: Upset plot of the averaged pyrolysis phase (270–600 °C) from all three Caldor fire soil samples (control pre-fire soil, burned post-fire soil, and ash). The compound class distribution for the respective interest is indicated by a color-coded stacked bar plot.

Author Contributions

Conceptualization, V.S., M.B., C.P.R., R.Z. and H.M.; methodology, V.S., M.B., C.P.R. and H.M.; validation, V.S., M.B., C.P.R., L.F., E.S. and H.M.; formal analysis, V.S., M.B., S.I., C.P.R., L.F., E.S. and H.M.; investigation, V.S., C.P.R., R.Z., H.M. and M.B; resources, V.S., M.B., R.Z., H.M. and B.S.; data curation, V.S., E.S., L.F. and S.I.; writing—original draft preparation, V.S., E.S. and C.P.R.; writing—review and editing, V.S., H.M., M.B., C.P.R., K.A., Y.R., P.B. and E.S.; visualization, V.S., E.S., C.P.R. and A.L.; supervision, V.S., M.B., R.Z., H.M. and C.P.R.; sampling and sample preparation, V.S., B.S., H.M., P.B., K.A. and Y.R. All authors have read and agreed to the published version of the manuscript.

Funding

The present research was supported in part by the National Science Foundation under Grant Nos. OIA-2148788 and EAR2154013. Funding by the Horizon 2020 program for the EU FT-ICR MS project (European Network of Fourier-Transform Ion-Cyclotron-Resonance Mass Spectrometry Centers, Grant agreement ID: 731077) is gratefully acknowledged. This work was supported by the DFG under grant ZI 764/24-1. The authors thank the German Research Foundation (DFG) for the funding of the Bruker FT-ICR MS (INST 264/56).

Institutional Review Board Statement

Not applicable.

Informed Consent Statement

Not applicable.

Data Availability Statement

The data presented in this study are available on request from the corresponding author.

Acknowledgments

The authors thank Jay Arnone for assistance with vegetation identification and classification.

Conflicts of Interest

The authors declare no conflict of interest.

References

  1. Halofsky, J.E.; Peterson, D.L.; Harvey, B.J. Changing wildfire, changing forests: The effects of climate change on fire regimes and vegetation in the Pacific Northwest, USA. Fire Ecol. 2020, 16, 4. [Google Scholar] [CrossRef]
  2. Stevens-Rumann, C.S.; Morgan, P. Tree regeneration following wildfires in the western US: A review. Fire Ecol. 2019, 15, 15. [Google Scholar] [CrossRef]
  3. Sanderfoot, O.; Bassing, S.; Brusa, J.; Emmet, R.; Gillman, S.; Swift, K.; Gardner, B. A review of the effects of wildfire smoke on the health and behavior of wildlife. Environ. Res. Lett. 2022, 16, 123003. [Google Scholar] [CrossRef]
  4. Parkins, K.; York, A.; Di Stefano, J. Edge effects in fire-prone landscapes: Ecological importance and implications for fauna. Ecol. Evol. 2018, 8, 5937–5948. [Google Scholar] [CrossRef]
  5. Nichols, L.; Shinneman, D.J.; McIlroy, S.K.; de Graaff, M.-A. Fire frequency impacts soil properties and processes in sagebrush steppe ecosystems of the Columbia Basin. Appl. Soil Ecol. 2021, 165, 103967. [Google Scholar] [CrossRef]
  6. Watts, A.C.; Samburova, V.; Moosmüller, H. Criteria-based identification of important fuels for Wildland fire emission research. Atmosphere 2020, 11, 640. [Google Scholar] [CrossRef]
  7. Lack, D.A.; Moosmüller, H.; McMeeking, G.R.; Chakrabarty, R.K.; Baumgardner, D. Characterizing elemental, equivalent black, and refractory black carbon aerosol particles: A review of techniques, their limitations and uncertainties. Anal. Bioanal. Chem. 2014, 406, 99–122. [Google Scholar] [CrossRef]
  8. Chakrabarty, R.; Moosmüller, H.; Chen, L.-W.; Lewis, K.; Arnott, W.; Mazzoleni, C.; Dubey, M.; Wold, C.; Hao, W.; Kreidenweis, S. Brown carbon in tar balls from smoldering biomass combustion. Atmos. Chem. Phys. 2010, 10, 6363–6370. [Google Scholar] [CrossRef]
  9. Moosmüller, H.; Chakrabarty, R.; Ehlers, K.; Arnott, W. Absorption Ångström coefficient, brown carbon, and aerosols: Basic concepts, bulk matter, and spherical particles. Atmos. Chem. Phys. 2011, 11, 1217–1225. [Google Scholar] [CrossRef]
  10. Rennie, M.; Samburova, V.; Sengupta, D.; Bhattarai, C.; Arnott, W.P.; Khlystov, A.; Moosmüller, H. Emissions from the open laboratory combustion of cheatgrass (Bromus Tectorum). Atmosphere 2020, 11, 406. [Google Scholar] [CrossRef]
  11. Sengupta, D.; Samburova, V.; Bhattarai, C.; Moosmüller, H.; Khlystov, A. Emission factors for polycyclic aromatic hydrocarbons from laboratory biomass-burning and their chemical transformations during aging in an oxidation flow reactor. Sci. Total Environ. 2023, 870, 161857. [Google Scholar] [CrossRef]
  12. Yatavelli, R.L.; Chen, L.-W.A.; Knue, J.; Samburova, V.; Gyawali, M.; Watts, A.C.; Chakrabarty, R.K.; Moosmüller, H.; Hodzic, A.; Wang, X. Emissions and Partitioning of Intermediate-Volatility and Semi-Volatile Polar Organic Compounds (I/SV-POCs) During Laboratory Combustion of Boreal and Sub-Tropical Peat. Aerosol Sci. Eng. 2017, 1, 25–32. [Google Scholar] [CrossRef]
  13. Lewis, K.; Arnott, W.; Moosmüller, H.; Chakrabarty, R.; Carrico, C.; Kreidenweis, S.; Day, D.; Malm, W.; Laskin, A.; Jimenez, J. Reduction in biomass burning aerosol light absorption upon humidification: Roles of inorganically-induced hygroscopicity, particle collapse, and photoacoustic heat and mass transfer. Atmos. Chem. Phys. 2009, 9, 8949–8966. [Google Scholar] [CrossRef]
  14. Bhattarai, C.; Samburova, V.; Sengupta, D.; Iaukea-Lum, M.; Watts, A.C.; Moosmüller, H.; Khlystov, A.Y. Physical and chemical characterization of aerosol in fresh and aged emissions from open combustion of biomass fuels. Aerosol Sci. Technol. 2018, 52, 1266–1282. [Google Scholar] [CrossRef]
  15. Sengupta, D.; Samburova, V.; Bhattarai, C.; Watts, A.C.; Moosmüller, H.; Khlystov, A.Y. Polar semivolatile organic compounds in biomass-burning emissions and their chemical transformations during aging in an oxidation flow reactor. Atmos. Chem. Phys. 2020, 20, 8227–8250. [Google Scholar] [CrossRef]
  16. Iaukea-Lum, M.; Bhattarai, C.; Sengupta, D.; Samburova, V.; Khlystov, A.Y.; Watts, A.C.; Arnott, W.P.; Moosmüller, H. Optical Characterization of Fresh and Photochemically Aged Aerosols Emitted from Laboratory Siberian Peat Burning. Atmosphere 2022, 13, 386. [Google Scholar] [CrossRef]
  17. Jaffe, D.A.; Wigder, N.L. Ozone production from wildfires: A critical review. Atmos. Environ. 2012, 51, 1–10. [Google Scholar] [CrossRef]
  18. Black, C.; Tesfaigzi, Y.; Bassein, J.A.; Miller, L.A. Wildfire smoke exposure and human health: Significant gaps in research for a growing public health issue. Environ. Toxicol. Pharmacol. 2017, 55, 186–195. [Google Scholar] [CrossRef] [PubMed]
  19. Schneider, S.R.; Abbatt, J.P. Wildfire atmospheric chemistry: Climate and air quality impacts. Trend. Chem. 2022, 4, 255–257. [Google Scholar] [CrossRef]
  20. Finlay, S.E.; Moffat, A.; Gazzard, R.; Baker, D.; Murray, V. Health impacts of wildfires. PLoS Curr. 2012, 4, e4f959951cce2c. [Google Scholar] [CrossRef]
  21. Liu, J.C.; Pereira, G.; Uhl, S.A.; Bravo, M.A.; Bell, M.L. A systematic review of the physical health impacts from non-occupational exposure to wildfire smoke. Environ. Res. 2015, 136, 120–132. [Google Scholar] [CrossRef] [PubMed]
  22. DeMott, P.J.; Petters, M.D.; Prenni, A.J.; Carrico, C.M.; Kreidenweis, S.M.; Collett, J.L., Jr.; Moosmüller, H. Ice nucleation behavior of biomass combustion particles at cirrus temperatures. J. Geophys. Res. Atmos. 2009, 114, D16. [Google Scholar] [CrossRef]
  23. Petters, M.D.; Parsons, M.T.; Prenni, A.J.; DeMott, P.J.; Kreidenweis, S.M.; Carrico, C.M.; Sullivan, A.P.; McMeeking, G.R.; Levin, E.; Wold, C.E. Ice nuclei emissions from biomass burning. J. Geophys. Res. Atmos. 2009, 114, D7. [Google Scholar] [CrossRef]
  24. Lewis, K.; Arnott, W.P.; Moosmüller, H.; Wold, C.E. Strong spectral variation of biomass smoke light absorption and single scattering albedo observed with a novel dual-wavelength photoacoustic instrument. J. Geophys. Res. Atmos. 2008, 113, D16. [Google Scholar] [CrossRef]
  25. Gyawali, M.; Arnott, W.; Lewis, K.; Moosmüller, H. In situ aerosol optics in Reno, NV, USA during and after the summer 2008 California wildfires and the influence of absorbing and non-absorbing organic coatings on spectral light absorption. Atmos. Chem. Phys. 2009, 9, 8007–8015. [Google Scholar] [CrossRef]
  26. Moosmüller, H.; Chakrabarty, R.; Arnott, W. Aerosol light absorption and its measurement: A review. J. Quant. Spectrosc. Radiat. Transfer. 2009, 110, 844–878. [Google Scholar] [CrossRef]
  27. Beres, N.D.; Sengupta, D.; Samburova, V.; Khlystov, A.Y.; Moosmüller, H. Deposition of brown carbon onto snow: Changes in snow optical and radiative properties. Atmos. Chem. Phys. 2020, 20, 6095–6114. [Google Scholar] [CrossRef]
  28. Lapuerta, M.; González-Correa, S.; Ballesteros, R.; Cereceda-Balic, F.; Moosmüller, H. Albedo reduction for snow surfaces contaminated with soot aerosols: Comparison of experimental results and models. Aerosol Sci. Technol. 2022, 56, 847–858. [Google Scholar] [CrossRef]
  29. Shakesby, R. Post-wildfire soil erosion in the Mediterranean: Review and future research directions. Earth-Sci. Rev. 2011, 105, 71–100. [Google Scholar] [CrossRef]
  30. DeBano, L.F. The role of fire and soil heating on water repellency in wildland environments: A review. J. Hydrol. 2000, 231, 195–206. [Google Scholar] [CrossRef]
  31. Letey, J. Causes and consequences of fire-induced soil water repellency. Hydrol. Process. 2001, 15, 2867–2875. [Google Scholar] [CrossRef]
  32. Lewis, S.A.; Wu, J.Q.; Robichaud, P.R. Assessing burn severity and comparing soil water repellency, Hayman Fire, Colorado. Hydrol. Process Int. J. 2006, 20, 1. [Google Scholar] [CrossRef]
  33. Samburova, V.; Shillito, R.M.; Berli, M.; Khlystov, A.Y.; Moosmüller, H. Effect of Biomass-Burning Emissions on Soil Water Repellency: A Pilot Laboratory Study. Fire 2021, 4, 24. [Google Scholar] [CrossRef]
  34. Robichaud, P.; Hungerford, R. Water repellency by laboratory burning of four northern Rocky Mountain forest soils. J. Hydrol. 2000, 231, 207–219. [Google Scholar] [CrossRef]
  35. Doerr, S.H.; Shakesby, R.A.; MacDonald, L.H. Soil water repellency: A key factor in post-fire erosion. In Fire Effects on Soils and Restoration Strategies; CRC Press: Enfield, NH, USA, 2009; pp. 213–240. [Google Scholar]
  36. Larsen, I.J.; MacDonald, L.H.; Brown, E.; Rough, D.; Welsh, M.J.; Pietraszek, J.H.; Libohova, Z.; de Dios Benavides-Solorio, J.; Schaffrath, K. Causes of post-fire runoff and erosion: Water repellency, cover, or soil sealing? Soil Sci. Soc. Am. J. 2009, 73, 1393–1407. [Google Scholar] [CrossRef]
  37. Butzen, V.; Seeger, M.; Marruedo, A.; de Jonge, L.; Wengel, R.; Ries, J.B.; Casper, M.C. Water repellency under coniferous and deciduous forest—Experimental assessment and impact on overland flow. Catena 2015, 133, 255–265. [Google Scholar] [CrossRef]
  38. DeBano, L.F. Water Repellent Soils: A State-of-the-Art; US Department of Agriculture, Forest Service, Pacific Southwest Forest and Range Experiment Station: Washington, DC, USA, 1981; Volume 46.
  39. DeBano, L.F.; Letey, J. Water-Repellent Soils. In Symposium of Water-Repellent Soils; DeBano, L.F., Letey, J., Eds.; University of California Riverside: Riverside, CA, USA, 1969; p. 354. [Google Scholar]
  40. Kean, J.W.; Staley, D.M. Forecasting the frequency and magnitude of postfire debris flows across southern California. Earth’s Future 2021, 9, e2020EF001735. [Google Scholar] [CrossRef]
  41. Oakley, N.S.; Cannon, F.; Munroe, R.; Lancaster, J.T.; Gomberg, D.; Ralph, F.M. Brief communication: Meteorological and climatological conditions associated with the 9 January 2018 post-fire debris flows in Montecito and Carpinteria, California, USA. Nat. Hazards Earth Syst. Sci. 2018, 18, 3037–3043. [Google Scholar] [CrossRef]
  42. Dennis, M.S.; Joseph, E.G.; Jason, W.K. Objective definition of rainfall intensity-duration thresholds for post-fire flash floods and debris flows in the area burned by the Waldo Canyon Fire, Colorado, USA. In Engineering Geology for Society and Territory-Volume 2; Springer International Publishing: Berlin/Heidelberg, Germany, 2015; pp. 621–624. [Google Scholar]
  43. Varga, K.; Jones, C.; Trugman, A.; Carvalho, L.M.; McLoughlin, N.; Seto, D.; Thompson, C.; Daum, K. Megafires in a Warming World: What Wildfire Risk Factors Led to California’s Largest Recorded Wildfire. Fire 2022, 5, 16. [Google Scholar] [CrossRef]
  44. Iglesias, V.; Balch, J.K.; Travis, W.R. US fires became larger, more frequent, and more widespread in the 2000s. Sci. Adv. 2022, 8, 11. [Google Scholar] [CrossRef]
  45. Shaw, D.C.; Beedlow, P.A.; Lee, E.H.; Woodruff, D.R.; Meigs, G.W.; Calkins, S.J.; Reilly, M.J.; Merschel, A.G.; Cline, S.P.; Comeleo, R.L. The complexity of biological disturbance agents, fuels heterogeneity, and fire in coniferous forests of the western United States. For. Ecol. Manag. 2022, 525, 120572. [Google Scholar] [CrossRef] [PubMed]
  46. Safford, H.D.; Stevens, J.T. Natural Range of Variation for Yellow Pine and Mixed-Conifer Forests in the Sierra Nevada, Southern Cascades, and Modoc and Inyo National Forests, California, USA; US Department of Agriculture, Forest Service, Pacific Southwest Research Station: Washington, DC, USA, 2017; Volume 229, p. 256.
  47. Heidari, H.; Arabi, M.; Warziniack, T. Effects of climate change on natural-caused fire activity in western US national forests. Atmosphere 2021, 12, 981. [Google Scholar] [CrossRef]
  48. Parks, S.; Abatzoglou, J. Warmer and drier fire seasons contribute to increases in area burned at high severity in western US forests from 1985 to 2017. Geophys. Res. Lett. 2020, 47, e2020GL089858. [Google Scholar] [CrossRef]
  49. Steel, Z.L.; Safford, H.D.; Viers, J.H. The fire frequency-severity relationship and the legacy of fire suppression in California forests. Ecosphere 2015, 6, 1. [Google Scholar] [CrossRef]
  50. Voelker, S.L.; Merschel, A.G.; Meinzer, F.C.; Ulrich, D.E.; Spies, T.A.; Still, C.J. Fire deficits have increased drought sensitivity in dry conifer forests: Fire frequency and tree-ring carbon isotope evidence from Central Oregon. Glob. Chang. Biol. 2019, 25, 1247–1262. [Google Scholar] [CrossRef] [PubMed]
  51. Abatzoglou, J.T.; Williams, A.P. Impact of anthropogenic climate change on wildfire across western US forests. Proc. Natl. Acad. Sci. USA 2016, 113, 11770–11775. [Google Scholar] [CrossRef] [PubMed]
  52. Touma, D.; Stevenson, S.; Swain, D.L.; Singh, D.; Kalashnikov, D.A.; Huang, X. Climate change increases risk of extreme rainfall following wildfire in the western United States. Sci. Adv. 2022, 8, 13. [Google Scholar] [CrossRef]
  53. Jones, M.W.; Smith, A.; Betts, R.; Canadell, J.G.; Prentice, I.C.; Le Quéré, C. Climate change increases the risk of wildfires. ScienceBrief Rev. 2020, 116, 117. [Google Scholar]
  54. Porter, T.W. Report: Wildfire Activity Statistics; California Department of Forestry and Fire Protection: Sacramento, CA, USA, 2020.
  55. CalFire. State of California. Available online: https://www.fire.ca.gov/incidents (accessed on 23 April 2023).
  56. Sion, B.; Samburova, V.; Berli, M.; Baish, C.; Bustarde, J.; Houseman, S. Assessment of the Effects of the 2021 Caldor Megafire on Soil Physical Properties, Eastern Sierra Nevada, USA. Fire 2023, 6, 66. [Google Scholar] [CrossRef]
  57. Bartlett, A. It changed in the blink of an eye: Smoke from California’s Mosquito Fire races over Nevada. SFGATE 2022. Available online: https://www.sfgate.com/california-wildfires/article/Mosquito-Fire-smoke-East-Coast-17434311.php (accessed on 26 March 2023).
  58. Arnott, W.P. Available online: https://www.patarnott.com/pas532/ (accessed on 23 April 2023).
  59. de Dios Benavides-Solorio, J.; MacDonald, L.H. Measurement and prediction of post-fire erosion at the hillslope scale, Colorado Front Range. Int. J. Wildland Fire 2005, 14, 457–474. [Google Scholar] [CrossRef]
  60. Zituni, R.; Wittenberg, L.; Malkinson, D. The effects of post-fire forest management on soil erosion rates 3 and 4 years after a wildfire, demonstrated on the 2010 Mount Carmel fire. Int. J. Wildland Fire 2019, 28, 377–385. [Google Scholar] [CrossRef]
  61. Prats, S.A.; González-Pelayo, Ó.; Silva, F.C.; Bokhorst, K.J.; Baartman, J.E.; Keizer, J.J. Post-fire soil erosion mitigation at the scale of swales using forest logging residues at a reduced application rate. Earth Surf. Process. Landf. 2019, 44, 2837–2848. [Google Scholar] [CrossRef]
  62. Beyers, J.L.; Neary, D.G.; Ryan, K.C.; DeBano, L.F. Wildland Fire in Ecosystems: Effects of Fire on Soil and Water; United States Department of Agriculture, Forest Service: Washington, DC, USA, 2005.
  63. DeBano, L.; Savage, S.; Hamilton, D. The transfer of heat and hydrophobic substances during burning. Soil Sci. Soc. Am. J. 1976, 40, 779–782. [Google Scholar] [CrossRef]
  64. Debano, L.F.; Krammes, J. Water repellent soils and their relation to wildfire temperatures. Hydrol. Sci. J. 1966, 11, 14–19. [Google Scholar] [CrossRef]
  65. Simkovic, I.; Dlapa, P.; Doerr, S.H.; Mataix-Solera, J.; Sasinkova, V. Thermal destruction of soil water repellency and associated changes to soil organic matter as observed by FTIR spectroscopy. Catena 2008, 74, 205–211. [Google Scholar] [CrossRef]
  66. Atanassova, I.; Doerr, S. Changes in soil organic compound composition associated with heat-induced increases in soil water repellency. Eur. J. Soil Sci. 2011, 62, 516–532. [Google Scholar] [CrossRef]
  67. Scholl, D.G. Soil wettability and fire in Arizona chaparral. Soil Sci. Soc. Am. J. 1975, 39, 356–361. [Google Scholar] [CrossRef]
  68. Shillito, R.; Berli, M.; Ghezzehei, T.A.; Kaminski, E. Effective Infiltration Measurements for Fire-Affected Water-Repellent Soils. In Proceedings of the AGU Fall Meeting, Washington, DC, USA, 9–14 December 2018; p. H23L-2113. [Google Scholar]
  69. Huffman, E.L.; MacDonald, L.H.; Stednick, J.D. Strength and persistence of fire-induced soil hydrophobicity under ponderosa and lodgepole pine, Colorado Front Range. Hydrol. Process. 2001, 15, 2877–2892. [Google Scholar] [CrossRef]
  70. Bisdom, E.; Dekker, L.; Schoute, J.T. Water repellency of sieve fractions from sandy soils and relationships with organic material and soil structure. In Soil Structure/Soil Biota Interrelationships; Elsevier Science Publishers: Amsterdam, The Netherlands, 1993; pp. 105–118. [Google Scholar]
  71. Doerr, S.H.; Shakesby, R.A. Soil water repellency. In Handbook of Soil Sciences; Huang, P.M., Li, Y., Sumner, M., Eds.; CRC Press: Boca Raton, FL, USA, 2012; pp. 1–11. [Google Scholar]
  72. Erbil, H.Y. The debate on the dependence of apparent contact angles on drop contact area or three-phase contact line: A review. Surf. Sci. Rep. 2014, 69, 325–365. [Google Scholar] [CrossRef]
  73. Yuan, Y.; Lee, T.R. Contact angle and wetting properties. In Surface Science Techniques; Springer: Berlin/Heidelberg, Germany, 2013; pp. 3–34. [Google Scholar]
  74. Bachmann, J.; Ellies, A.; Hartge, K. Development and application of a new sessile drop contact angle method to assess soil water repellency. J. Hydrol. 2000, 231, 66–75. [Google Scholar] [CrossRef]
  75. Beatty, S.M.; Smith, J.E. Fractional wettability and contact angle dynamics in burned water repellent soils. J. Hydrol. 2010, 391, 97–108. [Google Scholar] [CrossRef]
  76. Leelamanie, D.; Karube, J. Time dependence of contact angle and its relation to repellency persistence in hydrophobized sand. Soil Sci. Plant Nutr. 2009, 55, 457–461. [Google Scholar] [CrossRef]
  77. McHale, G.; Shirtcliffe, N.; Newton, M. Contact-angle hysteresis on super-hydrophobic surfaces. Langmuir 2004, 20, 10146–10149. [Google Scholar] [CrossRef] [PubMed]
  78. Letey, J.; Carrillo, M.; Pang, X. Characterizing the Degree of Repellency; Elsevier: Amsterdam, The Netherlands, 2003. [Google Scholar]
  79. Fox, D.; Darboux, F.; Carrega, P. Effects of fire-induced water repellency on soil aggregate stability, splash erosion, and saturated hydraulic conductivity for different size fractions. Hydrol. Process Int. J. 2007, 21, 2377–2384. [Google Scholar] [CrossRef]
  80. Chen, J.; Pangle, L.A.; Gannon, J.P.; Stewart, R.D. Soil water repellency after wildfires in the Blue Ridge Mountains, United States. Int. J. Wildland Fire 2020, 29, 1009–1020. [Google Scholar] [CrossRef]
  81. Garcia-Chevesich, P.; Pizarro, R.; Stropki, C.; Ramirez de Arellano, P.; Ffolliott, P.; DeBano, L.; Neary, D.; Slack, D. Formation of post-fire water-repellent layers in Monterrey pine (Pinus radiata D. DON) plantations in south-central Chile. Soil Sci. Plant Nutr. 2010, 10, 399–406. [Google Scholar] [CrossRef]
  82. Rodríguez-Alleres, M.; Varela, M.; Benito, E. Natural severity of water repellency in pine forest soils from NW Spain and influence of wildfire severity on its persistence. Geoderma 2012, 191, 125–131. [Google Scholar] [CrossRef]
  83. Dyrness, C. Effect of Wildfire on Soil Wettability in the High Cascades of Oregon; US Department of Agriculture, Forest Service, Pacific Northwest Forest and Range Experiment Station: Washington, DC, USA, 1976; Volume 202.
  84. Doerr, S.; Woods, S.; Martin, D.; Casimiro, M. Natural background’soil water repellency in conifer forests of the north-western USA: Its prediction and relationship to wildfire occurrence. J. Hydrol. 2009, 371, 12–21. [Google Scholar] [CrossRef]
  85. Leelamanie, D.; Nishiwaki, J. Water repellency in Japanese coniferous forest soils as affected by drying temperature and moisture. Biologia 2019, 74, 127–137. [Google Scholar] [CrossRef]
  86. Dymov, A.A.; Gabov, D.N.; Milanovskii, E.Y. 13C-NMR, PAHs, WSOC and water repellence of fire-affected soils (Albic Podzols) in lichen pine forests, Russia. Environ. Earth Sci. 2017, 76, 275. [Google Scholar] [CrossRef]
  87. Mainwaring, K.; Hallin, I.; Douglas, P.; Doerr, S.; Morley, C.P. The role of naturally occurring organic compounds in causing soil water repellency. Eur. J. Soil Sci. 2013, 64, 667–680. [Google Scholar] [CrossRef]
  88. Uddin, S.; Daniel, N.R.; Harper, R.J.; Henry, D.J. Why do biogenic volatile organic compounds (BVOCs) derived from vegetation fire not induce soil water repellency? Biogeochemistry 2017, 134, 147–161. [Google Scholar] [CrossRef]
  89. Doerr, S.; Llewellyn, C.; Douglas, P.; Morley, C.; Mainwaring, K.; Haskins, C.; Johnsey, L.; Ritsema, C.; Stagnitti, F.; Allinson, G. Extraction of compounds associated with water repellency in sandy soils of different origin. Soil Res. 2005, 43, 225–237. [Google Scholar] [CrossRef]
  90. Ma, S.; Chen, Y.; Lu, X.; Wang, X. Soil organic matter chemistry: Based on pyrolysis-gas chromatography-mass spectrometry (Py-GC/MS). Mini-Rev. Org. Chem. 2018, 15, 389–403. [Google Scholar] [CrossRef]
  91. Kiersch, K.; Kruse, J.; Regier, T.Z.; Leinweber, P. Temperature resolved alteration of soil organic matter composition during laboratory heating as revealed by C and N XANES spectroscopy and Py-FIMS. Thermochim. Acta 2012, 537, 36–43. [Google Scholar] [CrossRef]
  92. Kiersch, K.; Kruse, J.; Eckhardt, K.-U.; Fendt, A.; Streibel, T.; Zimmermann, R.; Broll, G.; Leinweber, P. Impact of grassland burning on soil organic matter as revealed by a synchrotron-and pyrolysis–mass spectrometry-based multi-methodological approach. Org. Geochem. 2012, 44, 8–20. [Google Scholar] [CrossRef]
  93. De la Rosa, J.M.; Faria, S.R.; Varela, M.E.; Knicker, H.; González-Vila, F.J.; González-Pérez, J.A.; Keizer, J. Characterization of wildfire effects on soil organic matter using analytical pyrolysis. Geoderma 2012, 191, 24–30. [Google Scholar] [CrossRef]
  94. Otto, A.; Gondokusumo, R.; Simpson, M.J. Characterization and quantification of biomarkers from biomass burning at a recent wildfire site in Northern Alberta, Canada. Appl. Geochem. 2006, 21, 166–183. [Google Scholar] [CrossRef]
  95. Woods, S.W.; Birkas, A.; Ahl, R. Spatial variability of soil hydrophobicity after wildfires in Montana and Colorado. Geomorphology 2007, 86, 465–479. [Google Scholar] [CrossRef]
  96. de Deus, M.; Miller, A.Z.; Jiménez-Morillo, N.T. Molecular Characterization of Burned Organic Matter at Different Soil Depths and Its Relationship with Soil Water Repellency: A Preliminary Result. Agronomy 2021, 11, 2560. [Google Scholar] [CrossRef]
  97. Jiménez-Morillo, N.T.; González-Pérez, J.A.; Almendros, G.; José, M.; Waggoner, D.C.; Jordán, A.; Zavala, L.M.; González-Vila, F.J.; Hatcher, P.G. Ultra-high resolution mass spectrometry of physical speciation patterns of organic matter in fire-affected soils. J. Environ. Manag. 2018, 225, 139–147. [Google Scholar] [CrossRef]
  98. Campo, J.; Nierop, K.G.; Cammeraat, E.; Andreu, V.; Rubio, J.L. Application of pyrolysis-gas chromatography/mass spectrometry to study changes in the organic matter of macro-and microaggregates of a Mediterranean soil upon heating. J. Chromatogr. A 2011, 1218, 4817–4827. [Google Scholar] [CrossRef] [PubMed]
  99. Wu, Y.; Zhang, N.; Slater, G.; Waddington, J.M.; de Lannoy, C.-F. Hydrophobicity of peat soils: Characterization of organic compound changes associated with heat-induced water repellency. Sci. Total Environ. 2020, 714, 136444. [Google Scholar] [CrossRef]
  100. Chen, H.; Wang, J.-J.; Ku, P.-J.; Tsui, M.T.-K.; Abney, R.B.; Berhe, A.A.; Zhang, Q.; Burton, S.D.; Dahlgren, R.A.; Chow, A.T. Burn Intensity Drives the Alteration of Phenolic Lignin to (Poly) Aromatic Hydrocarbons as Revealed by Pyrolysis Gas Chromatography–Mass Spectrometry (Py-GC/MS). Environ. Sci. Technol. 2022, 56, 12678–12687. [Google Scholar] [CrossRef]
  101. Roth, H.K.; Borch, T.; Young, R.B.; Bahureksa, W.; Blakney, G.T.; Nelson, A.R.; Wilkins, M.J.; McKenna, A.M. Enhanced speciation of pyrogenic organic matter from wildfires enabled by 21 T FT-ICR mass spectrometry. Anal. Chem. 2022, 94, 2973–2980. [Google Scholar] [CrossRef] [PubMed]
  102. Bahureksa, W.; Young, R.B.; McKenna, A.M.; Chen, H.; Thorn, K.A.; Rosario-Ortiz, F.L.; Borch, T. Nitrogen enrichment during soil organic matter burning and molecular evidence of Maillard reactions. Environ. Sci. Technol. 2022, 56, 4597–4609. [Google Scholar] [CrossRef] [PubMed]
  103. Hockaday, W.C.; Grannas, A.M.; Kim, S.; Hatcher, P.G. Direct molecular evidence for the degradation and mobility of black carbon in soils from ultrahigh-resolution mass spectral analysis of dissolved organic matter from a fire-impacted forest soil. Org. Geochem. 2006, 37, 501–510. [Google Scholar] [CrossRef]
  104. Rüger, C.P.; Miersch, T.; Schwemer, T.; Sklorz, M.; Zimmermann, R. Hyphenation of thermal analysis to ultrahigh-resolution mass spectrometry (Fourier transform ion cyclotron resonance mass spectrometry) using atmospheric pressure chemical ionization for studying composition and thermal degradation of complex materials. Anal. Chem. 2015, 87, 6493–6499. [Google Scholar] [CrossRef]
  105. Friederici, L.; Meščeriakovė, S.-M.; Neumann, A.; Sermyagina, E.; Meščeriakovas, A.; Lähde, A.; Grimmer, C.; Streibel, T.; Rüger, C.P.; Zimmermann, R. Effect of hydrothermal carbonization and eutectic salt mixture (KCl/LiCl) on the pyrolysis of Kraft lignin as revealed by thermal analysis coupled to advanced high-resolution mass spectrometry. J. Anal. Appl. Pyrolysis 2022, 166, 105604. [Google Scholar] [CrossRef]
  106. Friederici, L.; Schneider, E.; Burnens, G.; Streibel, T.; Giusti, P.; Rüger, C.P.; Zimmermann, R. Comprehensive Chemical Description of Pyrolysis Chars from Low-Density Polyethylene by Thermal Analysis Hyphenated to Different Mass Spectrometric Approaches. Energy Fuels 2021, 35, 18185–18193. [Google Scholar] [CrossRef]
  107. Rüger, C.P.; Neumann, A.; Sklorz, M.; Schwemer, T.; Zimmermann, R. Thermal analysis coupled to ultrahigh resolution mass spectrometry with collision induced dissociation for complex petroleum samples: Heavy oil composition and asphaltene precipitation effects. Energy Fuels 2017, 31, 13144–13158. [Google Scholar] [CrossRef]
  108. Neumann, A.; Chacon-Patino, M.L.; Rodgers, R.P.; Ruger, C.P.; Zimmermann, R. Investigation of Island/Single-Core-and Archipelago/Multicore-Enriched Asphaltenes and Their Solubility Fractions by Thermal Analysis Coupled with High-Resolution Fourier Transform Ion Cyclotron Resonance Mass Spectrometry. Energy Fuels 2020, 35, 3808–3824. [Google Scholar] [CrossRef]
  109. Zherebker, A.; Kostyukevich, Y.; Volkov, D.S.; Chumakov, R.G.; Friederici, L.; Rüger, C.P.; Kononikhin, A.; Kharybin, O.; Korochantsev, A.; Zimmermann, R. Speciation of organosulfur compounds in carbonaceous chondrites. Sci. Rep. 2021, 11, 7410. [Google Scholar] [CrossRef]
  110. USDA. Forest Service. Available online: https://www.fs.usda.gov/detail/lpnf/home/?cid=fseprd570093 (accessed on 23 April 2023).
  111. USDA. Available online: https://websoilsurvey.nrcs.usda.gov/app/ (accessed on 23 April 2023).
  112. Rüger, C.P.; Grimmer, C.; Sklorz, M.; Neumann, A.; Streibel, T.; Zimmermann, R. Combination of different thermal analysis methods coupled to mass spectrometry for the analysis of asphaltenes and their parent crude oils: Comprehensive characterization of the molecular pyrolysis pattern. Energy Fuels 2017, 32, 2699–2711. [Google Scholar] [CrossRef]
  113. Rüger, C.P.; Tiemann, O.; Neumann, A.; Streibel, T.; Zimmermann, R. Review on evolved gas analysis mass spectrometry with soft photoionization for the chemical description of petroleum, petroleum-derived materials, and alternative feedstocks. Energy Fuels 2021, 35, 18308–18332. [Google Scholar] [CrossRef]
  114. Rüger, C.P.; Schwemer, T.; Sklorz, M.; O’Connor, P.B.; Barrow, M.P.; Zimmermann, R. Comprehensive chemical comparison of fuel composition and aerosol particles emitted from a ship diesel engine by gas chromatography atmospheric pressure chemical ionisation ultra-high resolution mass spectrometry with improved data processing routines. Eur. J. Mass Spectrom. 2017, 23, 28–39. [Google Scholar] [CrossRef]
  115. Koch, B.P.; Dittmar, T. From mass to structure: An aromaticity index for high-resolution mass data of natural organic matter. Rapid Commun. Mass Spectrom. 2006, 20, 926–932. [Google Scholar] [CrossRef]
  116. Kainulainen, P.; Holopainen, J. Concentrations of secondary compounds in Scots pine needles at different stages of decomposition. Soil Biol. Biochem. 2002, 34, 37–42. [Google Scholar] [CrossRef]
  117. Kelleher, B.P.; Simpson, M.J.; Simpson, A.J. Assessing the fate and transformation of plant residues in the terrestrial environment using HR-MAS NMR spectroscopy. Geochim. Cosmochim. Acta 2006, 70, 4080–4094. [Google Scholar] [CrossRef]
  118. Bronick, C.J.; Lal, R. Soil structure and management: A review. Geoderma 2005, 124, 3–22. [Google Scholar] [CrossRef]
  119. Rodríguez-Alleres, M.; Benito, E.; de Blas, E. Extent and persistence of water repellency in north-western Spanish soils. Hydrol. Process Int. J. 2007, 21, 2291–2299. [Google Scholar] [CrossRef]
  120. Doerr, S.H.; Thomas, A.D. The role of soil moisture in controlling water repellency: New evidence from forest soils in Portugal. J. Hydrol. 2000, 231, 134–147. [Google Scholar] [CrossRef]
  121. Blumler, M.A. Three conflated definitions of Mediterranean climates. Middle States Geogr. 2005, 38, 52–60. [Google Scholar]
  122. Aschmann, H. Distribution and peculiarity of Mediterranean ecosystems. In Mediterranean Type Ecosystems; Springer: Berlin/Heidelberg, Germany, 1973; pp. 11–19. [Google Scholar]
  123. Cerdà, A.; Doerr, S.H. The effect of ash and needle cover on surface runoff and erosion in the immediate post-fire period. Catena 2008, 74, 256–263. [Google Scholar] [CrossRef]
  124. Dlapa, P.; Bodí, M.B.; Mataix-Solera, J.; Cerdà, A.; Doerr, S.H. FT-IR spectroscopy reveals that ash water repellency is highly dependent on ash chemical composition. Catena 2013, 108, 35–43. [Google Scholar] [CrossRef]
  125. Ellerbrock, R.; Gerke, H.; Bachmann, J.; Goebel, M.-O. Composition of organic matter fractions for explaining wettability of three forest soils. Soil Sci. Soc. Am. J. 2005, 69, 57–66. [Google Scholar] [CrossRef]
  126. González-Pérez, J.A.; González-Vila, F.J.; Almendros, G.; Knicker, H. The effect of fire on soil organic matter—A review. Environ. Int. 2004, 30, 855–870. [Google Scholar] [CrossRef]
  127. Doerr, S.H.; Shakesby, R.; Walsh, R. Soil water repellency: Its causes, characteristics and hydro-geomorphological significance. Earth-Sci. Rev. 2000, 51, 33–65. [Google Scholar] [CrossRef]
  128. Schulten, H.-R.; Schnitzer, M. A state of the art structural concept for humic substances. Naturwissenschaften 1993, 80, 29–30. [Google Scholar] [CrossRef]
  129. Fernandez-Marcos, M.L. Potentially Toxic Substances and Associated Risks in Soils Affected by Wildfires: A Review. Toxics 2022, 10, 31. [Google Scholar] [CrossRef] [PubMed]
  130. Hatten, J.A.; Zabowski, D. Fire severity effects on soil organic matter from a ponderosa pine forest: A laboratory study. Int. J. Wildland Fire 2010, 19, 613–623. [Google Scholar] [CrossRef]
  131. Gaspar, A.; Zellermann, E.; Lababidi, S.; Reece, J.; Schrader, W. Characterization of saturates, aromatics, resins, and asphaltenes heavy crude oil fractions by atmospheric pressure laser ionization Fourier transform ion cyclotron resonance mass spectrometry. Energy Fuels 2012, 26, 3481–3487. [Google Scholar] [CrossRef]
  132. Kew, W.; Mackay, C.L.; Goodall, I.; Clarke, D.J.; Uhrín, D.A. Complementary ionization techniques for the analysis of scotch whisky by high resolution mass spectrometry. Anal. Chem. 2018, 90, 11265–11272. [Google Scholar] [CrossRef]
  133. Mofikoya, O.O.; Mäkinen, M.; Jänis, J. Compositional analysis of essential oil and solvent extracts of Norway spruce sprouts by ultrahigh-resolution mass spectrometry. Phytochem. Anal. 2022, 33, 392–401. [Google Scholar] [CrossRef]
  134. Lex, A.; Gehlenborg, N.; Strobelt, H.; Vuillemot, R.; Pfister, H. UpSet: Visualization of intersecting sets. IEEE Trans. Vis. Comput. Graph. 2014, 20, 1983–1992. [Google Scholar] [CrossRef]
Figure 1. Map with red fire perimeter lines of the Dixie, Beckwourth Complex, Caldor, and Mosquito fires as well as the locations of the respective sampling sites; sample site locations are indicated by yellow triangles.
Fire 06 00186 g001
Figure 2. Water drop penetration time (WDPT) measurements in the field shortly after the Dixie fire was contained, showing water drops sitting on burned, water-repellent soil.
Fire 06 00186 g002
Figure 3. (a) Goniometer (FTÅ1000, First Ten Ångstroms Inc.) used for apparent contact angle (ACA) measurements using sample slides; (b) drops on a sample slide during goniometer test.
Fire 06 00186 g003
Figure 4. Results of WDPT measurements for unburned and burned soils shortly after the Dixie, Beckwourth Complex, Caldor, and Mosquito fires were contained; lines in the middle of boxes represent median values, blue dots represent mean values, and boxes represent third quartiles (Q3) and first quartiles (Q1); the whisker ends are 1.5 × IQR (interquartile range) above the third quartiles (Q3) and 1.5 × IQR below the first quartiles (Q1); red and pink asterisks are min and max outliers, respectively. p-values were calculated using unpaired t-test (N = 7–11, α = 0.05).
Fire 06 00186 g004
Figure 5. Apparent contact angles (ACA) for unburned and burned soils from the Dixie, Beckwourth Complex, Caldor, and Mosquito fires measured in the laboratory using a goniometer. Lines in the middle of boxes represent median values, blue dots represent mean values, and boxes represent third quartiles (Q3) and first quartiles (Q1); the whisker ends are 1.5 × IQR (interquartile range) above the third quartiles (Q3) and 1.5 × IQR below the first quartiles (Q1); red and pink asterisks are min and max outliers, respectively. Note that for the unburned soil from the Beckwourth Complex and the Mosquito fires the ACA values were at or below 10°, which corresponds to the detection limit for ACA of the goniometer; p-values were calculated using unpaired t-test (N = 5–15; α = 0.05).
Fire 06 00186 g005
Figure 6. Results of WDPT and ACA measurements for burned soil samples: 0 months (2 weeks), 6 months, and 1 year after fire containment; lines in the middle of boxes represent median values, blue dots represent mean values, and boxes represent third quartiles (Q3) and first quartiles (Q1); the whisker ends are 1.5 × IQR (interquartile range) above the third quartiles (Q3) and 1.5 × IQR below the first quartiles (Q1); red and pink asterisks are min and max outliers, respectively; p-values were calculated using unpaired t-test (N = 5–15, α = 0.05); subfigures (ac) represent WDPT (in s) for Dixie (a), Beckwourth Complex (b), and Caldor (c) fires; subfigures (df) represent ACA (in deg) for Dixie (d), Beckwourth Complex (e), and Caldor (f) fires.
Fire 06 00186 g006
Figure 7. Intensity weighted average hydrogen-to-carbon ratio (H/C) and aromaticity index (AI) for the thermal desorption (20–270°C, top) and pyrolysis (270–600°C, bottom) phase versus apparent contact angle (ACA, deg) for five soil samples from the Caldor, Beckwourth Complex, and Dixie fires. Linear regressions are inserted as black dotted lines. A clear correlation was found for the constituents released during thermal desorption, whereas no trend was apparent from the evolved gas mixture during pyrolysis. Error bars indicate standard deviation. Exemplary molecules with respective unsaturation/aromaticity measures are inserted for guidance.
Fire 06 00186 g007
Figure 8. Oxygen number distribution (sum of intensity of every compound with the respective number of oxygen) of burned soil (a,c) and unburned soil (b,d) from Caldor fire samples divided into thermal desorption (TD, 20–270 °C (a,b)) and pyrolysis phase (pyro, 270–600 °C (c,d)). Absolute intensities were normalized by the deployed sample weight.
Fire 06 00186 g008
Figure 9. Aromaticity index (AI) versus carbon number (#C) plots for Caldor fire unburned (top) and burned soil (bottom) samples. Assigned time-resolved TG APPI FT-ICR MS data were averaged for thermal desorption (20–270 °C, blue-green color bar, (a,b)) and pyrolysis phase (270–600 °C, orange-red color bar, (c,d)) and filtered for the CH (a,c) and CHO1 (b,d) compound classes. For guidance, black dotted line indicates AI limit for aromatic structures.
Fire 06 00186 g009
Table 1. Summary of fires and sampling locations; * source: CalFire webpage [55]; ** assessment published in BAER reports based on the rating of soil burn severity: Unburned and Very Low, Low, Moderate, High; *** assessment published in BAER reports based on the rating of soil erosion hazard: Low, Moderate, High, and Very high; **** dominant trees observed at the sampling sites highlighted in bold.
Fire NameStart Date–End Date* Fire Area (km2)** Total Fraction of Moderate and Severely Burned Soil Area*** Total Fraction of High and Very High Soil Erosion Hazard AreaGPS Coordinates of Sampling Sites**** Dominant Forest Type
Dixie13-Jul-21–25-Oct-21389854%2039°58′41.9″ N 120°21′24.8″ WSierran mixed conifer (Pinus contorta, Abies concolor)
Beckwourth Complex4-Jul-21–22-Sep-2142857%3839°53′21.1″ N 120°12′02.9″ WSierran mixed conifer and mixed pine (Pinus lambertiana, P. contorta, P. ponderosa, Pseudotsuga menziesii)
Caldor14-Aug-21–21-Oct-2189856%2838°50′37.0″ N 120°01′59.8″ WSierran mixed and Sierran Montane hardwood (Pinus jeffreyi, P. contorta, P. ponderosa, A. magnifica, A. concolor)
Mosquito6-Sep-22–27-Oct-2231134%N/A38°59′22.3″ N 120°44′21.1″ WSierran mixed conifer, Sierran Montane Hardwood; Sierran Montane Hardwood-Conifer (P. ponderosa, P. jeffreyi)
Table 2. Summary of the collected samples; * only zero-month samples (samples collected shortly after the fire) were analyzed; ** Soil classification is according to USDA-NRCS using the NRCS Web Soil Survey [111]; SOM—soil organic matter.
Fire NameSample TypeSampling and WDPT* ACA Analysis* TG FT-ICR MS Analysis** Soil Composition (% of Dry Soil Mass)
0 Month6 Months1 YearSandSiltClaySOM
DixieAsh----
Burned soil----
Unburned soil6619151.5
Beckwourth ComplexAsh----
Burned soil----
Unburned soil4238202
CaldorAsh----
Burned soil----
Unburned soil841155
MosquitoAsh-------
Burned soil-------
Unburned soil---4545106
Disclaimer/Publisher’s Note: The statements, opinions and data contained in all publications are solely those of the individual author(s) and contributor(s) and not of MDPI and/or the editor(s). MDPI and/or the editor(s) disclaim responsibility for any injury to people or property resulting from any ideas, methods, instructions or products referred to in the content.

