


The Power Grid/Wildfire Nexus: Using GIS and Satellite Remote Sensing to Identify Vulnerabilities

Abstract
1. Introduction
2. Materials and Methods
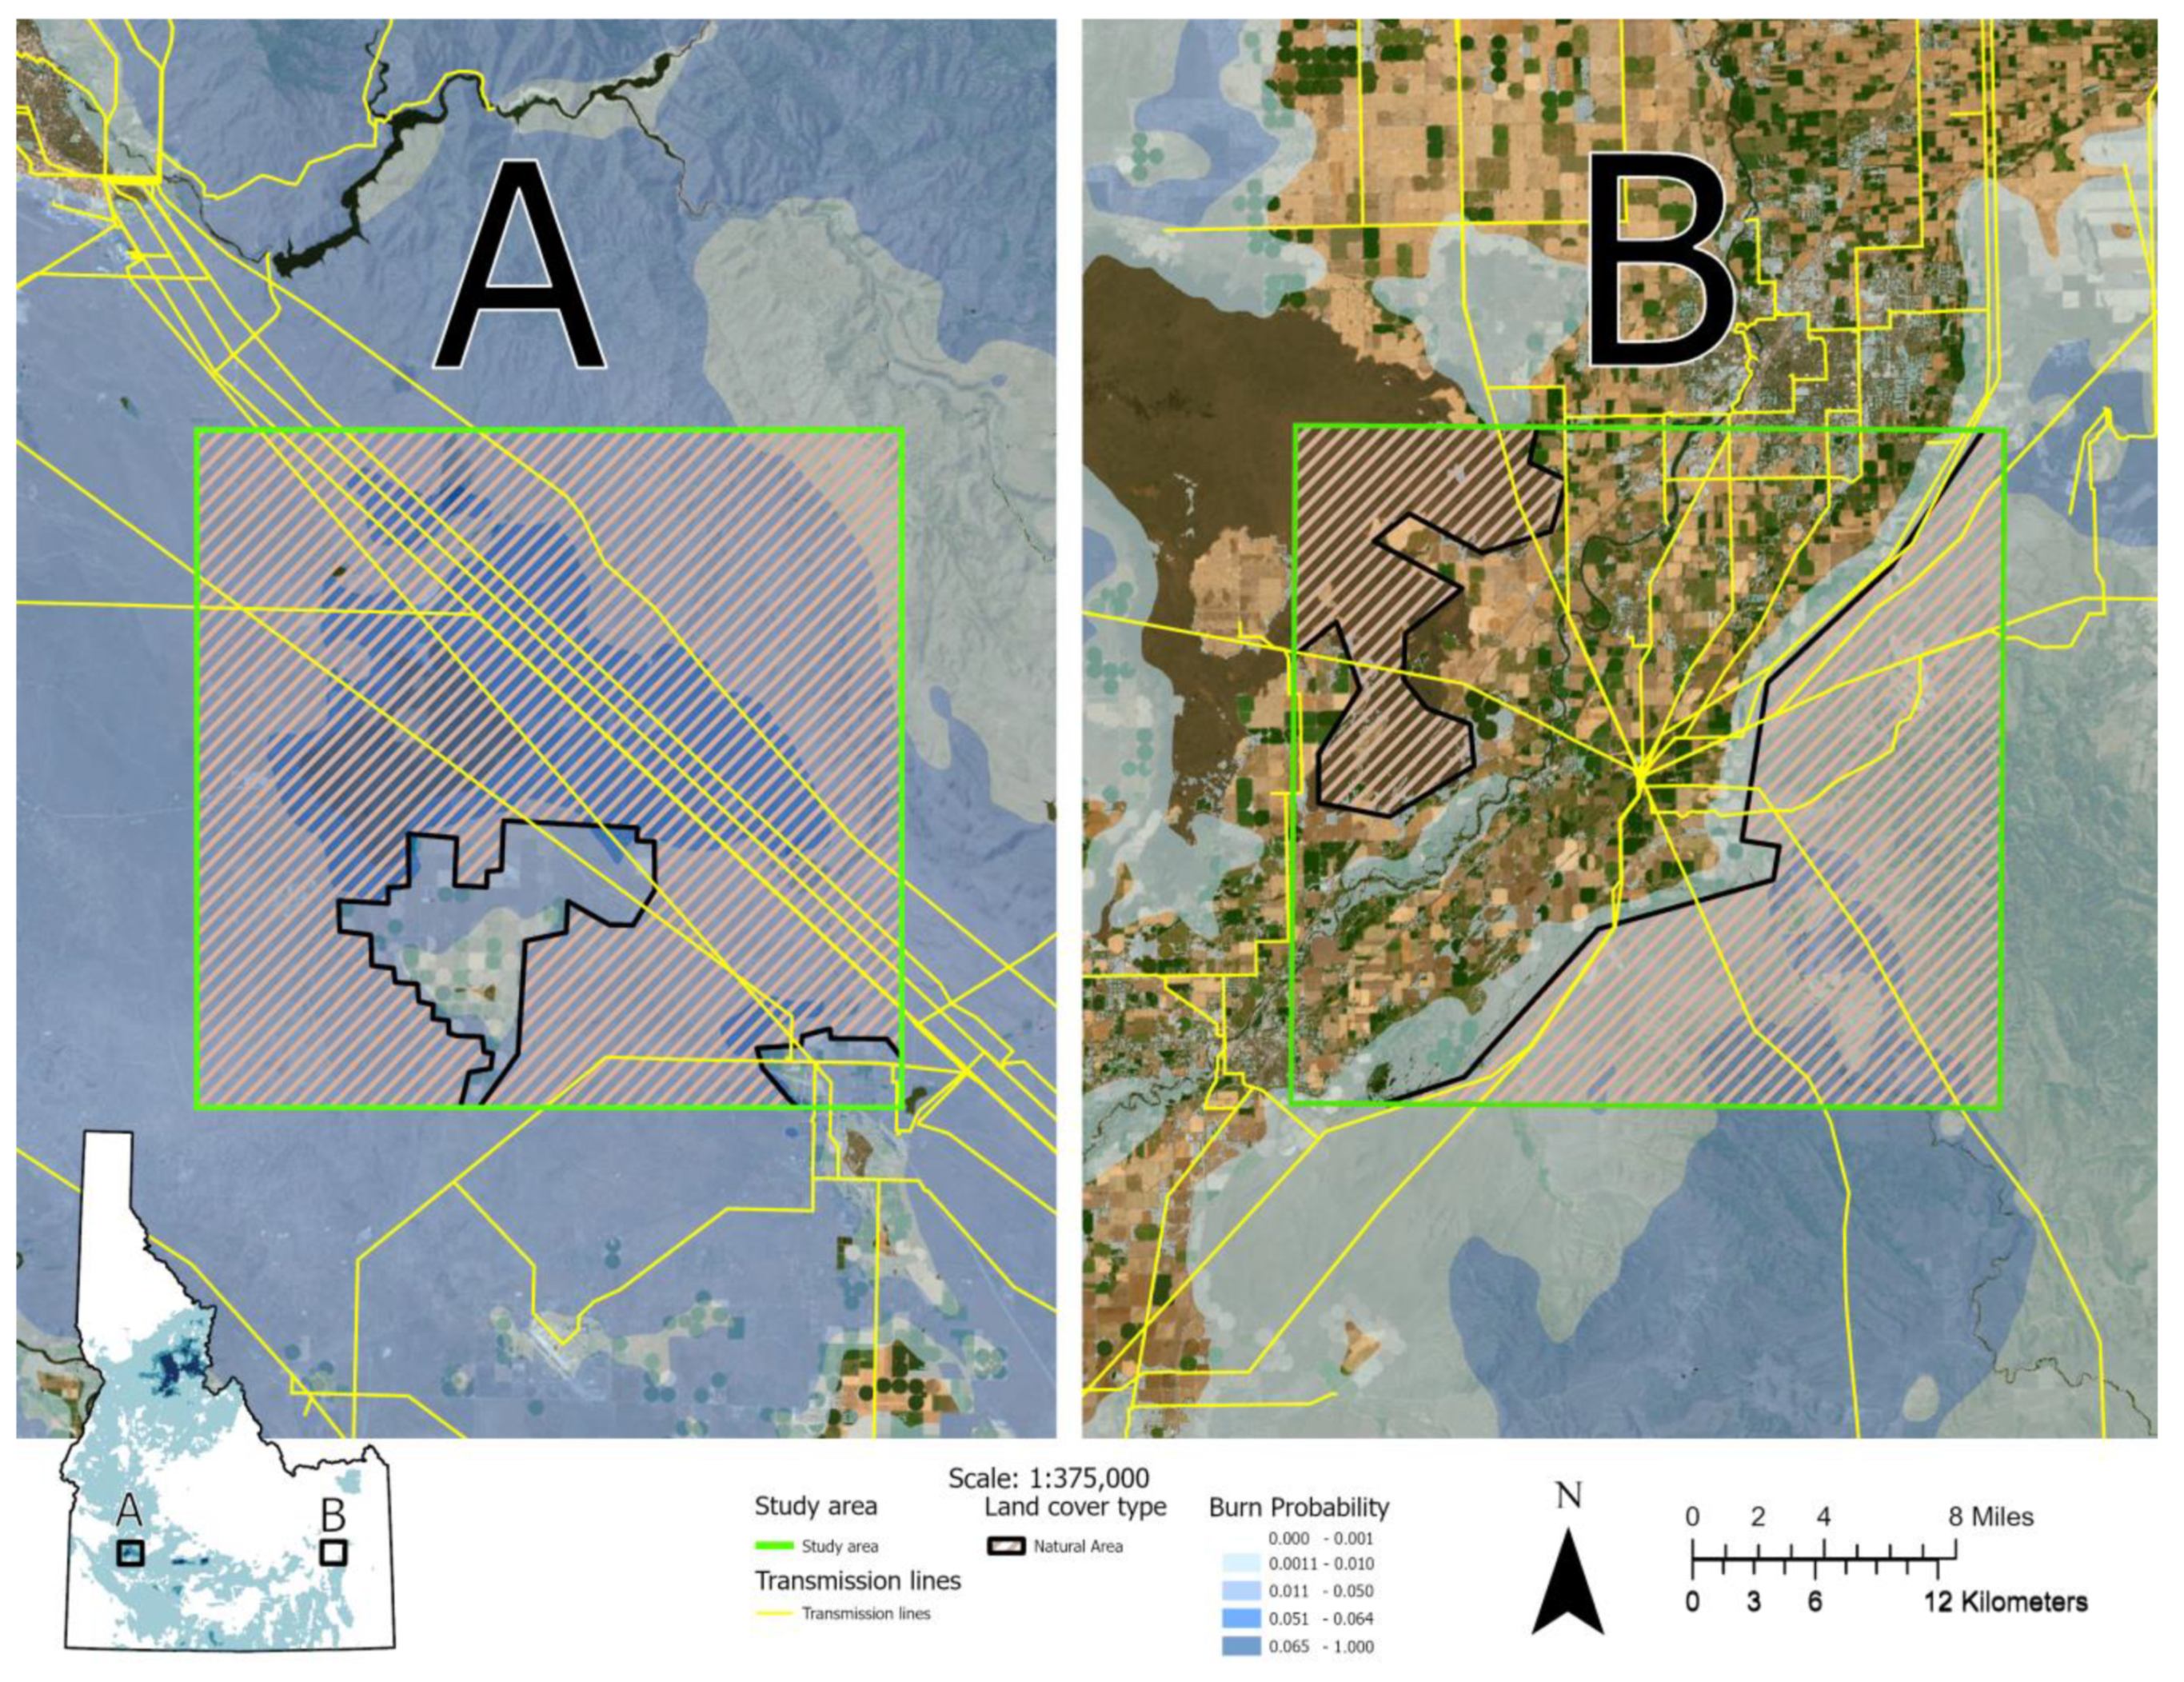
2.1. Study Area
2.2. Spatial Data
2.3. Statistical Analysis
3. Results and Discussion
4. Conclusions
Supplementary Materials
Author Contributions
Funding
Institutional Review Board Statement
Informed Consent Statement
Data Availability Statement
Acknowledgments
Conflicts of Interest
References
- Umunnakwe, A.; Parvania, M.; Nguyen, H.; Horel, J.D.; Davis, K.R. Data-Driven Spatiotemporal Analysis of Wildfire Risk to Power Systems Operation. IET Gener. Transm. Distrib. 2022, 16, 2531–2546. [Google Scholar] [CrossRef]
- Bade, G. In a First, PG&E Cuts Power to 60,000 to Prevent Wildfires during Wind Storm. Utility Dive. 15 October 2018. Available online: https://www.utilitydive.com/news/in-a-first-pge-cuts-power-to-60000-to-prevent-wildfires-during-wind-stor/539680/ (accessed on 1 January 2023).
- Bayani, R.; Manshadi, S.D. Resilient Expansion Planning of Electricity Grid under Prolonged Wildfire Risk. IEEE Trans. Smart Grid 2023. Early Access. [Google Scholar] [CrossRef]
- Murphy, P. Preventing Wildfires with Power Outages: The Growing Impacts of California’s Public Safety Power Shutoffs: PSE: Physicians, Scientists, and Engineers for Healthy Energy. PSE Healthy Energy. 19 March 2021. Available online: https://www.psehealthyenergy.org/news/blog/preventing-wildfires-with-power-outages-2/ (accessed on 1 January 2023).
- National Academies of Sciences Engineering and Medicine. Enhancing the Resilience of the Nation’s Electricity System; National Academies Press: Washington, DC, USA, 2017; ISBN 9780309463072. [Google Scholar]
- Koerner, C.; Araújo, K.; Muth, A.; Kharel, P.; Hampshire, J. U.S. Wildfire-Power Grid Risk: A Review of Policy & Practices in Ten Western States. (unpublished).
- Koerner, C. Wildfire and Electric Grid: Crisis Requires Long-Term Planning Rather than Rapid Response. The Hill. Available online: https://thehill.com/opinion/energy-environment/3594389-wildfire-and-electric-grid-crisis-requires-long-term-planning-rather-than-rapid-response/ (accessed on 11 August 2022).
- Araújo, K.; Banks, E. (in process). Wildfire Hazard and Regional Resilience Planning for Critical Infrastructure, Report Prepared for the U.S. Department of Homeland Security, Cybersecurity and Infrastructure Security Agency.
- Weber, K.T.; Yadav, R. Spatiotemporal Trends In wildfires across the western United States (1950–2019). Remote Sens. 2020, 12, 2959. [Google Scholar] [CrossRef]
- Weber, K.T. Historic Fires Database (HFD) Version 3.0; Idaho State University GIS Training and Research Center: Pocatello, ID, USA, 2020; Available online: https://Giscenter.Isu.Edu/Research/Techpg/HFD/ (accessed on 20 October 2022).
- Radeloff, V.C.; Hammer, R.B.; Stewart, S.I.; Fried, J.S.; Holcomb, S.S.; Mckeefry, J.F. The Wildland-Urban Interface in the United States. Ecol. Appl. 2005, 15, 799–805. [Google Scholar] [CrossRef]
- Scott, J.H.; Brough, A.M.; Gilbertson-Day, J.W.; Dillon, G.K.; Moran, C. Wildfire Risk to Communities: Spatial Datasets of Wildfire Risk for Populated Areas in the United States; Forest Service Research Data Archive: Fort Collins, CO, USA, 2020. [Google Scholar] [CrossRef]
- U.S. Department of Agriculture National Agriculture Imagery Program. Available online: https://naip-usdaonline.hub.arcgis.com/ (accessed on 2 April 2023).
- Grayson, R.; Western, A.; Walker, J.; Kandel, D.; Costelloe, J.; Wilson, D. Controls on Patterns of Soil Moisture in Arid and Semi-Arid Systems. In Dryland Ecohydrology; Springer: Dordrecht, The Netherlands, 2006; pp. 109–127. ISBN 1-4020-4259-0. [Google Scholar]
- Barros, A.M.G.; Day, M.A.; Preisler, H.K.; Abatzoglou, J.T.; Krawchuk, M.A.; Houtman, R.; Ager, A.A. Contrasting the Role of Human- And Lightning-Caused Wildfires on Future Fire Regimes on a Central Oregon Landscape. Environ. Res. Lett. 2021, 16, 064081. [Google Scholar] [CrossRef]
- Jahn, W.; Urban, J.L.; Rein, G. Powerlines and Wildfires: Overview, Perspectives, and Climate Change. IEEE Power Energy Mag. 2022, 20, 16–27. [Google Scholar] [CrossRef]


| Variable | Units | Spatial Resolution | Frequency | Data Source |
|---|---|---|---|---|
| Vegetation productivity (NDVI) | Index | 250-m | 16 days | NASA MODIS https://ladsweb.modaps.eosdis.nasa.gov/search/order/1/MOD13Q1--61 (accessed on 1 April 2023.) |
| Precipitation | Centimeters (cm) | Station | Hourly | BoR AgriMet https://www.usbr.gov/pn/agrimet/wxdata.html (accessed on 1 April 2023.) |
| Lightning | Count/frequency | 0.1-degree grid cell | Daily | NOAA NLDN https://www.nssl.noaa.gov/education/svrwx101/lightning/detection/, https://www1.ncdc.noaa.gov/pub/data/swdi/database-csv/v2/ (accessed on 1 April 2023.) |
| Wind Speed | Kilometers per hour (km/h) | Station | Hourly | Idaho Power Idaho Power data is specific to this study; alternative data source: https://www.weather.gov/, https://www.idahopower.com/ (accessed on 1 April 2023.) |
| Previous wildfires | Presence/absence | N/A | Daily | ISU GIS TReC Historic Fires Database https://giscenter.isu.edu/Research/Techpg/HFD/index.htm (accessed on 1 April 2023.) |
| Land cover | Categorical | 30-m | Biannual | LANDFIRE https://www.landfire.gov/data_overviews.php (accessed on 1 April 2023.) |
| Burn Probability | Annual likelihood | 30-m | Updated 2015 | Wildfire Risk to Communities spatial datasets https://www.fs.usda.gov/rds/archive/Catalog/RDS-2020-0016 (accessed on 1 April 2023.) |
| Transmission lines | Presence/absence | N/A | Updated 2022 | National Homeland Security Infrastructure Dataset https://hifld-geoplatform.opendata.arcgis.com/ (accessed on 1 April 2023.) |
| Variable | p-Value |
|---|---|
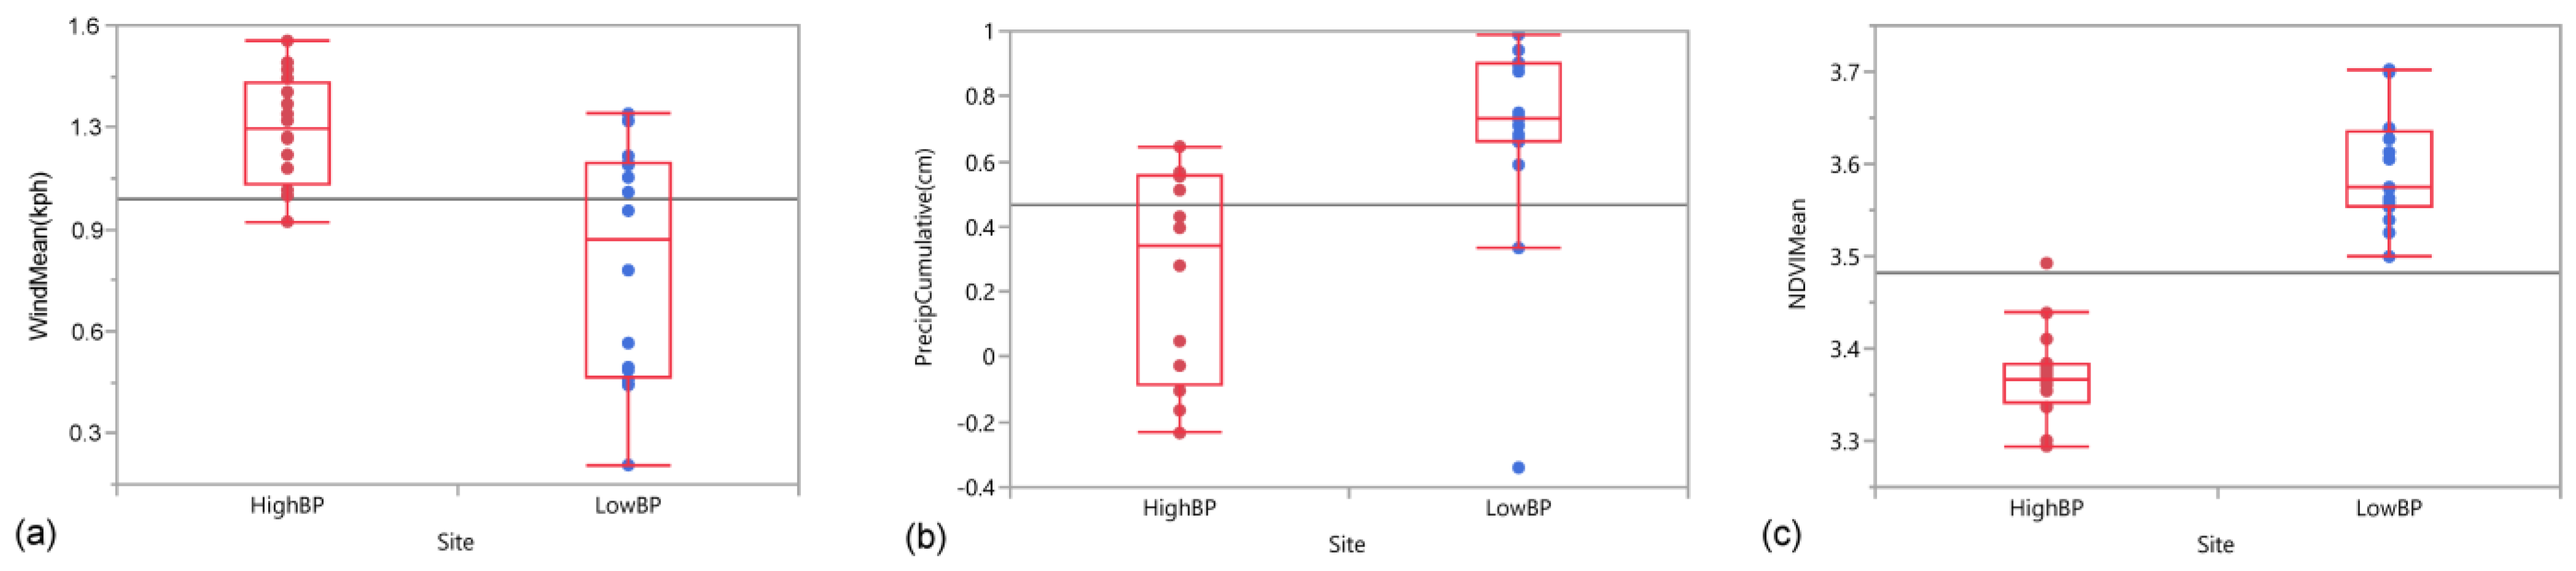
| Wind Mean (km/h) | <0.001 *** |
| Wind Median (km/h) | 0.007 *** |
| Total Monthly Precipitation (cm) | 0.293 |
| Cumulative Growing Season Precipitation (cm) | <0.001 *** |
| NDVI Mean | <0.001 *** |
| NDVI Median | <0.001 *** |
| Lightning Frequency | 0.054 |
Disclaimer/Publisher’s Note: The statements, opinions and data contained in all publications are solely those of the individual author(s) and contributor(s) and not of MDPI and/or the editor(s). MDPI and/or the editor(s) disclaim responsibility for any injury to people or property resulting from any ideas, methods, instructions or products referred to in the content. |
© 2023 by the authors. Licensee MDPI, Basel, Switzerland. This article is an open access article distributed under the terms and conditions of the Creative Commons Attribution (CC BY) license (https://creativecommons.org/licenses/by/4.0/).
Share and Cite
Farnes, A.; Weber, K.; Koerner, C.; Araújo, K.; Forsgren, C. The Power Grid/Wildfire Nexus: Using GIS and Satellite Remote Sensing to Identify Vulnerabilities. Fire 2023, 6, 187. https://doi.org/10.3390/fire6050187
Farnes A, Weber K, Koerner C, Araújo K, Forsgren C. The Power Grid/Wildfire Nexus: Using GIS and Satellite Remote Sensing to Identify Vulnerabilities. Fire. 2023; 6(5):187. https://doi.org/10.3390/fire6050187
Chicago/Turabian StyleFarnes, Alyssa, Keith Weber, Cassie Koerner, Kathy Araújo, and Christopher Forsgren. 2023. "The Power Grid/Wildfire Nexus: Using GIS and Satellite Remote Sensing to Identify Vulnerabilities" Fire 6, no. 5: 187. https://doi.org/10.3390/fire6050187
APA StyleFarnes, A., Weber, K., Koerner, C., Araújo, K., & Forsgren, C. (2023). The Power Grid/Wildfire Nexus: Using GIS and Satellite Remote Sensing to Identify Vulnerabilities. Fire, 6(5), 187. https://doi.org/10.3390/fire6050187