Abstract
The aim of this work is to provide an extensive experimental study of the performance of a novel magnetically and gas-flow-stabilized arc discharge for carbon dioxide (CO2) conversion and oxygen (O2) production on Mars. The proposed discharge provides an additional degree of freedom for easy scalability by adjusting its length. The discharge is examined at a pressure range of 200–612 mbar in order to optimize it for oxygen production on Mars, where low-pressure operation is preferable due to energy costs. Additionally, two quenching configurations with an actively cooled region are evaluated. They are compared to a benchmark configuration without additional cooling. Two high-voltage power supplies (PSs) are used, and the results are compared—a constant direct current (DC) and a pulsed unipolar current. The pulsed power supply offers better CO2 conversion performance at lower pressure due to stable operation in an arc regime. The energy cost for oxygen production on Mars is also presented, including a conservative estimation of the energy needed for compressing the Martian atmosphere at ambient pressure to the discharge operational pressure. It is discussed how this affects the energy cost of oxygen production.
1. Introduction
Plasma conversion of CO2 into value-added products on Earth is an active research area [1,2,3,4]. More recently, the same process is being applied in the context of human colonization on Mars [5,6,7,8,9,10,11], where the atmosphere comprises around 96% CO2. This gives the opportunity to produce O2 in situ on the Red Planet. The necessity of in situ production of oxygen on Mars becomes evident when one considers the amount of oxygen needed by future colonizers for breathing during the duration of the mission (a minimum estimate of 245 days), along with the cost to transport this amount from Earth to Mars. A conservative estimate gives us a cost of around USD 73,500,000 for three astronauts. That cost is without even considering the amount of oxygen needed for oxidizer for the return trip of the astronauts. This is why in situ oxygen production is a crucial part of human colonization on Mars. There are many different technologies being developed for this purpose, including, but not limited to, the following: using microorganisms that can convert CO2 into O2 via photosynthesis [12]; extracting the oxygen from Martian regolith via molten regolith electrolysis [13,14]; and using solid-oxide electrolysis cells to extract O2 from Mars’s atmosphere [15]. Each of these technologies is viable for different stages of the colonization of the Red Planet. Plasma conversion can be employed during the initial stages of Mars colonization and as an alternative to recycling the CO2 that the astronauts breathe out in manned missions. It can complement the aforementioned systems in that regard. The main advantages are that plasma technologies are more compact and do not need a lot of infrastructure. The only components that may suffer from the conditions in space (gravity, magnetic field, and radiation) are electronic components, which throughout the decades of space exploration and research have been developed to withstand the conditions in space. Using plasma to dissociate carbon dioxide into oxygen and carbon monoxide (CO) has other advantages. Apart from the oxygen, the carbon monoxide has several applications. The first is in situ production of plastics and other organic compounds by further reducing the carbon monoxide to carbon; the second is directly utilizing the carbon monoxide as rocket fuel, which has been shown to be a viable option [16].
Here, we consider a possible system based on plasma-assisted conversion of CO2 into O2 and CO, operating at elevated pressure compared to the Martian atmosphere. Such a system would consist of a compressor to increase the ambient Martian pressure to higher values, a gas discharge to convert CO2 into O2 and CO, a system to extract the produced oxygen from the gas mixture, and a final purification system. A block diagram of such a system is shown in Figure 1. The focus of this study is on the plasma conversion of CO2 based on an arc discharge. As utilizing this process in the context of human colonization of Mars is a novel concept, the available data is rather scarce. The discharges that are currently being investigated are mainly microwave (MW) discharges [9,10,17], dielectric barrier discharges (DBDs) [18,19], and low-pressure glow discharges (LPGDs) [7]. As far as the authors are aware, there are no studies considering arc discharges at reduced pressure for CO2 conversion. On the other hand, many studies have been carried out with arc discharges at atmospheric pressures, mainly using a gliding arc discharge (GAD) or gliding arc plasmatron (GAP), which give competitive results, reaching a conversion rate of up to 17–18% and energy efficiency of up to 65% [20,21,22,23,24,25,26,27]. Moreover, arc discharges are simple and compact. They require only a basic high-voltage power supply, which ensures reliability and low mass—both critical for Mars missions.
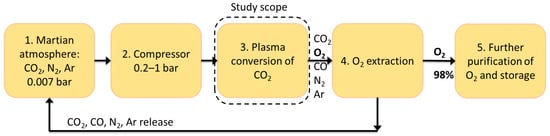
Figure 1.
Block diagram of a conceptual system, which utilizes a gas discharge to produce oxygen from the atmosphere of Mars.
Magnetically stabilized arc discharges, resembling our design, have been developed previously [23,28,29]; however, the design studied here has the important advantages of easy scalability and additional gas flow protection of the side walls from the arc column. The first advantage makes it very attractive from an industrial point of view, while the second provides stable long-term operation under high-gas-flow conditions.
We aim to fill the gap in the research of arc discharges for CO2 conversion at reduced pressure for applications on Mars. Instead of using a GAD or GAP, we will utilize a magnetically stabilized arc discharge with pin-to-pin electrodes, perpendicular to the gas flow, which will be presented in more detail in Section 2.3.
The most critical step of the conversion process is dissociating the CO2 molecule to CO and O. The direct dissociation is given by the following reaction:
where is the enthalpy of the reaction. It is known that, at high temperatures, the reverse reaction may occur after the gas passes through the discharge. This leads to a reduction in the final conversion rate as the valuable products are lost in the recombination reactions:
The rate coefficients for the reverse reactions increase with the gas temperature; therefore, fast quenching of the gas mixture produced from the discharge is needed to preserve the dissociation rates. The benefits of quenching the gas by using different techniques have been experimentally proven in numerous studies [24,26,30,31,32,33].
Our aim is to provide an extensive experimental study of the performance of the developed arc discharge under multiple operational parameters while also investigating the effects of different quenching configurations. As this would be part of a larger system for oxygen production on Mars, including an oxygen extraction mechanism, it is important to consider the interaction between these subsystems. For this reason, a wide range of operational parameters is explored to capture conditions that may balance both discharge performance and system integration. While certain operating conditions may be optimal for the operation of the discharge, they could be suboptimal when one incorporates the oxygen extraction system.
2. Materials and Methods
2.1. Experimental Setup
A schematic of the experimental setup used in this study is shown in Figure 2. The discharge device was installed in a vacuum-tight glass chamber, allowing for controlled pressure reduction and preventing gas leakage into the laboratory environment. The figure also presents a front view of the discharge reactor as situated in the vacuum chamber. The reactor itself will be described in detail in Section 2.3. The process gas was introduced through a nozzle positioned such that the gas flow was perpendicular to the discharge, with the mass flow rate regulated by an EL-FLOW F-201CM mass flow controller (MFC) (Bronkhorst, Ruurlo, the Netherlands). The gas flow rate was set and measured in normal liters per minute (further abbreviated as L/min), referenced to conditions of 1013.25 mbar and 273.15 K. A rotary vacuum pump Pfeiffer (Asslar, Germany) duo 012A was connected to the chamber to reduce the pressure. Using needle valves between the vacuum pump and vacuum chamber, the operating discharge pressure was set to a desired pressure in the range of 200–612 mbar. Operation at pressures above 612 mbar was impossible due to limitations in the voltage of the power supply.
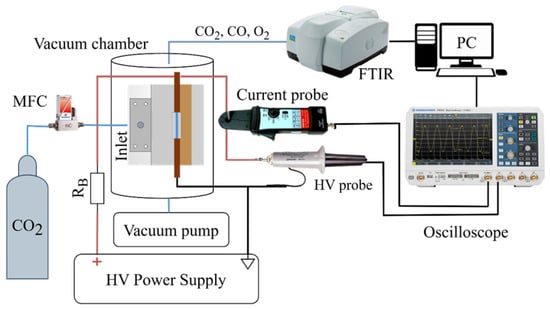
Figure 2.
Overall diagram of the experimental setup used.
The exhaust gas mixture was analyzed using a Fourier-transform infrared (FTIR) spectrometer (PerkinElmer, Shelton, CT, USA, Frontier MIR/NIR) equipped with a Specac (Orpington, UK) Storm 10 gas cell with a 10 cm optical path. The concentration of CO was determined by measuring the absorption line at 2209 cm−1 (4527 nm) and multiplying it by a coefficient . This coefficient was determined through multiple measurements using a calibration gas mixture with 15% CO and 85% CO2. Based on the measured CO concentration—and assuming negligible pure carbon quantities—the CO2 dissociation rate was calculated as described in Section 2.4. Two high-voltage power supplies were used throughout this study—a constant direct-current supply, and a pulsed unipolar one. They are presented in detail in Section 2.2. Electrical parameters were measured using a Tektronix (Beaverton, OR, USA) P6015A HV probe and a Pintek (New Taipei City, Taiwan) PA-699 clamp-on current probe. The voltage and current waveforms were recorded with a Rohde & Schwarz® (Munich, Germany) RTB2004 Digital Oscilloscope (200 MHz), connected to a PC. The pulsed power supply can operate in different regimes, changing the electrical parameters of the discharge. For this reason, a Python (version 3.11) script was developed to measure and calculate the power in real time throughout the measurement. At the end of the measurement, an average value for the power was calculated.
2.2. Power Supplies
In this work, we have used two high-voltage power supplies—a constant DC and a pulsed unipolar supply. Initial tests showed instabilities in the discharge regime while working with the DC at lower pressures; thus, the pulsed power supply was developed. These instabilities are explained in detail in Section 3.1.
A schematic of the pulsed power supply is presented in Figure 3.
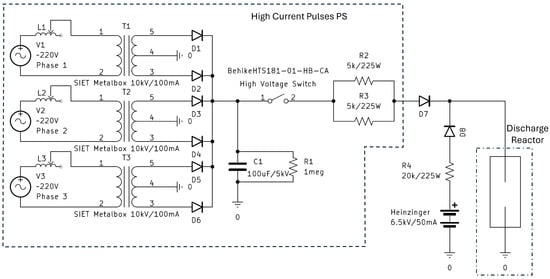
Figure 3.
Schematic of the developed high-voltage pulsed power supply.
The PS can be divided into two parts—a high-current pulsed power supply, and a low-current DC power supply. The pulsed PS provides high-current pulses of around 500 mA, while the DC supply sustains the discharge between pulses at a current of 50 mA. This avoids the need to reignite the arc after each high-current pulse. A separate schematic of the DC supply is not presented here, as it uses the same circuit as the high-current pulsed PS, without the capacitor and the high-voltage switch.
First, we will present the DC supply. The components used are the same as described in [27], except that it uses a positive polarity. Nevertheless, we will explain the principle of its operation here. It uses a 3-phase line supply, connected to three SIET (Rome, Italy) Metalbox 15 kV/60 mA high-voltage transformers through a variable series of inductors reaching up to 20 mH, which can be regulated synchronously. The inductors are used to control both the output voltage and the current. A magnetic shunt in the magnetic core of the transformers also limits the output current, which allows them to operate as a current source. The choice of 3-phase line is driven by the difficulty of adding a capacitor-based output filter to a single-phase full-bridge rectifier when working with high-voltage arc discharges. By connecting two rectifier diodes at the outputs of each transformer, even without an output filter, the PS provides close to a DC supply with a ripple at 300 Hz, insignificant to the discharge behavior. After the diodes, a series resistance of 2.5 k is added for stability and damping possible ringing. When the PS is used for a DC regime, the resistor acts as a ballast resistor and not a current-limiting one.
For the pulsed power supply, we used transformers with a higher maximum current output—SIET (Rome, Italy) Metalbox 10 kV/100 mA. We also added a large capacitor C1—100 F/5 kV. For safety, the capacitor was equipped with a resistor R1, which discharged the capacitor when the PS was switched off. The frequency and duty cycle of the pulses were controlled by a Tektronix (Beaverton, OR, USA) AFG1062 function generator, connected to a Behlke (Kronberg im Taunus, Germany) HTS 181-01-HB-CA high-voltage switch. For the pulsed circuit, the transformers were used as a voltage source, with the voltage controlled by the series inductors L1–L3. In pulsed regime, the series resistor, obtained by R2 and R3, was in this case used as the current limit resistor. When the high-voltage switch is open, the transformer charges the capacitors to around 2–3.5 kV, adjusted depending on the discharge voltage drop, so that the high-current pulse is at around 500 mA. When the switch is on, the capacitor provides a current of around 500 mA to the discharge.
For the low-current part of the circuit, we used a commercially available high-voltage PS—Heinzinger (Rosenheim, Germany) Evo 10000–300 (10 kV/300 mA)—with a voltage setpoint of 6.5 kV to ensure breakdown, and a current limit of 50 mA to maintain the discharge ignited. A large ballast resistor R4 was added after the low-current PS to ensure the stability of the Heinzinger PS, because its current control capabilities are too slow to control the current when directly powering arc discharges. Diodes D7 and D8 were used to prevent reverse voltage to both power supplies.
It is important to note that we ignited the discharge at a pressure of around 100 mbar by using the low-current Heinzinger PS. Only after the gas reached the desired pressure did we switch on the high-current pulses and begin our measurements.
2.3. Discharge Reactor and Quenching Configurations
A detailed cross-section of the discharge reactor is presented in Figure 4.
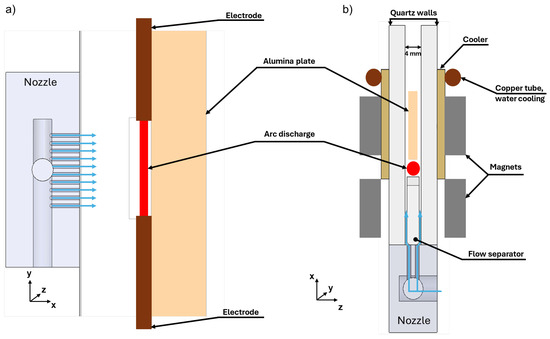
Figure 4.
Cross-section of the discharge: (a) front view; (b) top view.
The arc is sustained between two pin electrodes made of copper tubes with hafnium inserts. The electrodes are positioned on a 3 mm thick quartz plate that also acts as a gas flow separator. The role of the gas flow separator is to provide maximum gas velocity close to the wall such that a minimum of the gas velocity is formed in the middle between the side quartz walls. This prevents the attachment of part of the arc column to one of the side walls, although, as shown in Section 3.3, attachment can still occur at lower gas velocities. Note that when talking about “arc column attachment”, we exclude the arc regions near the electrodes, where obviously the arc is attached to the electrodes due to the necessity of current path closure. The side walls are made of quartz with a thickness of 4 mm. The spacing between them is 4 mm. Arc stabilization in the “x” direction (along the gas stream) is further enhanced by the J × B force, generated by the arc’s current and the magnetic field produced by two pairs of permanent magnets, positioned as shown in Figure 4. One pair is oriented such that the Lorentz force accelerates the arc downstream, while the other is oriented in the opposite way. This creates a magnetic “trap” region for the arc, which prevents it from passing both the quartz flow separator and the cooling alumina (Al2O3) ceramic plate. The magnetic field distribution was calculated using a 3D FEM model and is illustrated in Figure 5. The magnets are placed on water-cooled brass coolers that serve to cool down the side walls and the magnets themselves. The magnetic field is sustained by two pairs of permanent magnets spaced 5 mm apart. The size of the magnets that produce the Lorentz force, acting opposite to the gas flow, is 10 × 50 × 8 mm, while the size of the other magnets is 10 × 50 × 6 mm.
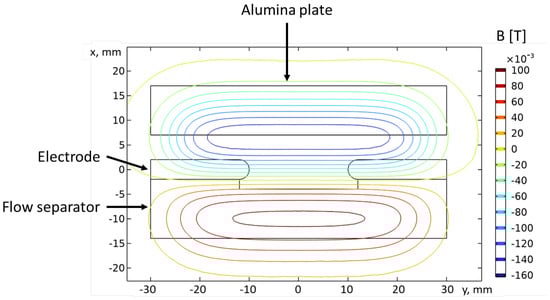
Figure 5.
Distribution of the magnetic field component at the xy plane.
Two main configurations of the discharge device are considered here—“Benchmark” and “Quenching”. In the quenching configuration, an alumina plate with a thickness of 2 mm, length (along “y”) of 80 mm, and height (along “x”) of 15 mm was introduced to quench the gas after it passed through the arc region. The thermal contact between the alumina plate and side walls was achieved through thermal pads. Two different quenching configurations were investigated by changing the distance between the electrodes and the lower edge of the alumina plate. In Section 3, these are referred to as “5 mm” and “0 mm” configurations. All configurations are shown in Figure 6. The 5 mm distance was achieved by placing small quartz plates between the electrodes and the alumina plate to prevent the gas from leaving the reactor without passing through the quenching region. For the 0 mm configuration, the lower edge of the alumina plate was in contact with the electrodes. The benchmark configuration (also stated as “None” in Section 3) did not include an alumina plate, allowing for direct comparison to evaluate the quenching effect.
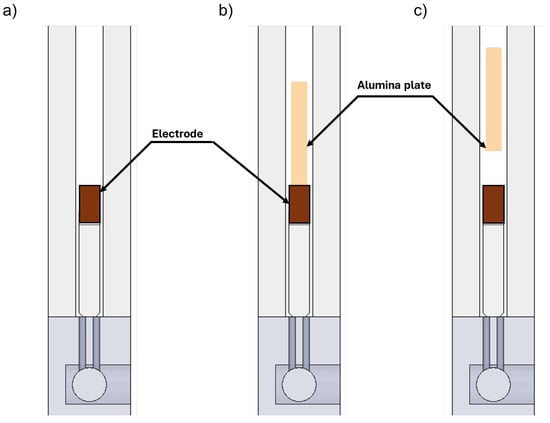
Figure 6.
Schematic of the different discharge configurations—(a) benchmark; (b) quenching—0 mm; (c) quenching—5 mm.
2.4. Quantities of Interest
The conversion rate is defined as the ratio between the converted gas and the input gas:
An important thing to note is that, in the reaction shown in Equation (1), 1 molecule of CO2 splits into 1.5 molecules of product. Therefore, there is an increase in the volumetric flow rate, which should be accounted for when calculating the conversion rate from the fraction of measured gas. For example, if one measures the concentration of CO, the following relation can be obtained by using the stoichiometry of the reaction [34]:
where is the output fraction of CO.
Therefore, the conversion rate can be expressed as follows:
The same process can be used to obtain the conversion rate from any other measured fraction.
The energy efficiency is defined as the ratio between the minimum energy needed to achieve a conversion rate of and the energy used by the system:
Here, [eV/molecule] is the specific energy input—the average energy per a molecule of gas. This parameter can be expressed in terms of the consumed power P and the gas flow Q:
where the unit L/s again is the normal mass flow rate, equal to a volumetric flow rate of 1 L under normal conditions (273.15 K, 1 atm), and 1/22.4 [mol/L] is the molar volume of a gas under normal conditions.
While for applications on Earth the desired product from the reaction is CO, in the context of in situ oxygen production from Mars’s atmosphere there are other values of interest, such as the oxygen production rate [g/h] and energy cost [kWh/g]. The oxygen production rate can be expressed in terms of the output fraction of O2 − and the flow rate:
where is the molar mass of oxygen. The output fraction of O2 can once again be expressed in terms of conversion rate by using the stoichiometric equations of the reaction [34]:
The energy cost is the energy needed to produce a single gram of O2. It can be expressed in terms of the production rate and input power P:
The relative uncertainty for the measured CO fraction is expressed by
where is the relative uncertainty in the measured by the FTIR absorbance, equal to around 4–5%, while is the relative uncertainty of the coefficient , described above. By using Equation (6), we can calculate the absolute uncertainty for the conversion rate:
The relative uncertainty in the energy efficiency is given by
where . Overall, the relative uncertainty in the conversion rate is around 5–6%, and for the energy efficiency it is around 12–13%.
3. Results and Discussion
In this work, we study multiple discharge geometries and multiple discharge operational parameters. If we study all of the combinations, the amount of data would become overwhelming. Therefore, to avoid collecting and presenting an excessive amount of data, we limit the studied parameter ranges. The selection was based on criteria such as discharge stability and the priority of specific operating conditions. This is discussed in every section where relevant. Moreover, not all of the measured results are presented here, but rather, a selected set that are important and worth showing.
3.1. DC and Pulsed Current Operation
Initially, the discharge was designed to operate with a DC power supply with fixed discharge current. However, during the DC operation of the discharge, we observed instabilities in the discharge regime at lower pressures (200 mbar) and currents (<200 mA), caused by stochastic transitions between glow and arc regimes. In this work, the terms “glow” and “arc” refer to different cathode-spot formation mechanisms. The glow regime is characterized by a large spot sustained by secondary electron emission, whereas the arc regime features a smaller, hotter spot sustained by thermo-field emission. We assume that the different regimes do not affect significantly the plasma column, as was shown in several studies for stabilized arc and glow discharge at atmospheric pressure [35,36]. The change in the discharge regime leads to a strong variation in the voltage drop at the cathode region—in the arc regime, the voltage drop is typically 10–15 V, while in the glow regime it is in the order of 300–500 V for CO2 gas [37]. This leads to a significant increase in the overall voltage drop between the electrodes for the same current in the glow regime, which leads to an increase in power without an increase in the conversion rate, therefore lowering the energy efficiency. The difference between the two regimes can be seen in the oscillograms (Figure 7). The oscillograms were taken at a pressure of 350 mbar, a current of 50 mA, and a gas flow rate of 4 L/min. In this case the voltage was around 1800 V in the glow regime and 1400 V in the arc regime, i.e., a 400 V difference and, thus, around 25% lower power for the arc regime. The different regimes were accompanied by different visual behavior observed during the experiments. A large dim cathode region (spot), covering the whole available cathode area, indicated the glow regime, while a highly localized cathode spot producing very bright light from a point light source indicated the arc regime. A photograph of the discharge while it was operating in the glow regime was also taken, where the glow cathode spot is clearly visible (Figure 8). At higher pressures and currents, the discharge was operating predominantly in the arc regime, albeit still having short transitions depending on the current value, the time of operation, and other unknown factors. The discharge voltage was lower at higher currents and dropped down to 500 V at 500 mA, even at higher pressure (612 mbar).
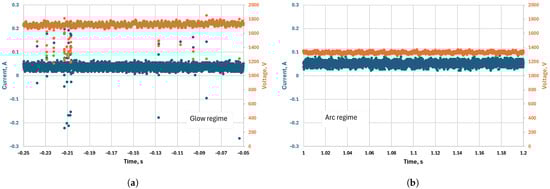
Figure 7.
Oscillograms of the discharge using the DC power supply, showing operation in (a) glow regime and (b) arc regime. Both oscillograms were taken during the same measurement, with a current of 50 mA, flow rate of 4 L/min, and pressure of 350 mbar.
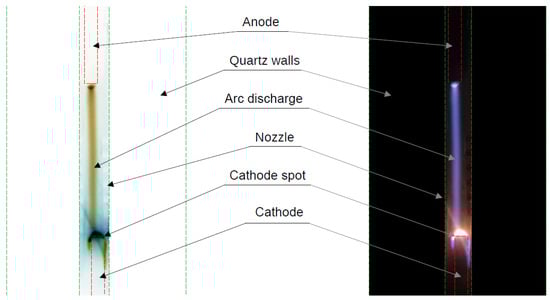
Figure 8.
Picture of the discharge while it is operating in glow regime (right), and a negative of the same photograph (left) (DC power supply at 190 mA, pressure 200 mbar).
Since the operation at lower pressures is crucial in the context of Mars applications due to the lower power consumption needed for compressing the Martian atmosphere, it is important for us to achieve stable and efficient operation at pressures as low as possible—not only at high pressures close to atmospheric. In order to enforce the arc regime, we can simply increase the discharge current to values higher than 300–400 mA, at which the discharge typically operates in arc regime even at 200 mbar.
However, this significantly increases the discharge power per unit length. As a result, the discharge may be destroyed due to overheating, or very large gas flow rates must be used to prevent damage. Such high flow rates limit the range of conditions available for optimizing CO2 conversion and can even break the stabilization of the discharge. A much more flexible way is to use pulsing at high current and to control the overall power by adjusting the duty cycle. With respect to discharge optimization, pulsing provides additional degrees of freedom, and the CO2 conversion can be optimized with respect to several parameters (gas flow, duty cycle, frequency, discharge current, etc.). This is why we developed a pulsed power supply that produces high-current pulses around 500 mA and maintains a current of 50 mA between the pulses. The sustained low current of 50 mA between the high-current pulses is necessary in order to preserve the plasma channel and, thus, to avoid the necessity of gas breakdown at every pulse, i.e., the necessity of very high voltage. This ensures operation of the discharge in the arc regime during the pulses and gives the experiment stability and reproducibility while maintaining similar discharge power. During the low-current period, the discharge is normally in the glow regime, although this is not guaranteed, since it is possible to operate in the arc regime if the cathode is hot enough.
A comparison between the obtained results for the CO2 conversion and efficiency with both pulsed and DC power supplies at pressures of 200, 350, and 612 mbar, with a mass flow rate of 4 L/min, is shown in Figure 9. In the experiment shown, the pulsed power supply was operated at a frequency of 5000 Hz and a duty cycle of = 0.25. The current values of the measurements made with the DC supply were chosen such that the power consumption of the DC discharge was similar to that obtained with the pulsed power supply. It can be seen that, at 200 mbar, the pulsed power supply performed much better than the DC power supply in terms of both energy efficiency and conversion rate for similar power and values. At higher pressures, the results obtained with the DC power supply were similar or even slightly better. We are not sure of the reason for the latter. Assuming that both discharges operate predominantly in the arc regime at high pressure, the slightly better performance of the DC operation is probably related to the suboptimal current value for the CO2 conversion, i.e., lower current values in the DC operation are more optimal compared to higher current values. We have seen previously in a gliding arc discharge that, under a certain range of conditions, the current value can have an optimal value producing the best energy efficiency at a significant conversion rate [27]. This effect is probably related to the stronger plasma column contraction at higher current and pressure and, thus, reduced gas treatment.
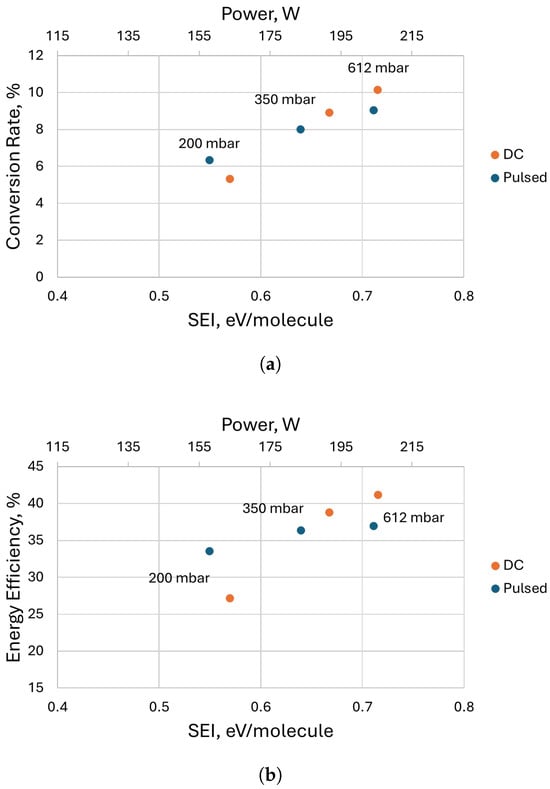
Figure 9.
Comparison of the performance of the discharge using both power supplies at different pressures and a flow rate of 4 L/min: (a) Conversion rate as a function of . (b) Energy efficiency as a function of .
As this study is a comprehensive examination of multiple parameters of a system, designed for the purpose of oxygen extraction on Mars, operation at lower pressures is critical and beneficial; therefore, the next results were obtained by using only a pulsed power supply.
3.2. Frequencies
As mentioned, using a pulsed power supply offers additional degrees of freedom in terms of input parameters. One of them is the frequency of the pulses. In this subsection, we present the results obtained with different frequencies (50, 500, and 5000 Hz) at different pressures (200, 350, and 612 mbar) and different mass flow rates (2 and 4 L/min). The results are shown in Figure 10. Apart from the results at 200 mbar and 4 L/min, where lower frequencies perform better, there is not a strong dependency of the conversion rate and energy efficiency on the frequency of the pulses. At 612 mbar, there are no results for 50 Hz because the discharge operation is not stable, as can be seen from the oscillogram (Figure 11a); thus, we omitted these points as unreliable. Figure 11a shows that many high-current pulses are not realized, and the discharge remains at low current for a long time. At high pressure, the discharge resistance is higher, and the voltage (∼2 kV) of capacitor C1 supplying the high current is not sufficient to sustain a stable transition to high current. The results obtained for 500 Hz are worse than those obtained at 5000 Hz, again for the same reason—some of the high-current pulses are not realized at high pressure (Figure 11b). At the highest frequency (5000 Hz), the discharge achieves stable operation, with consistent transition between low and high current. We suspect that this is due to a residual ionization from the high-current pulses.
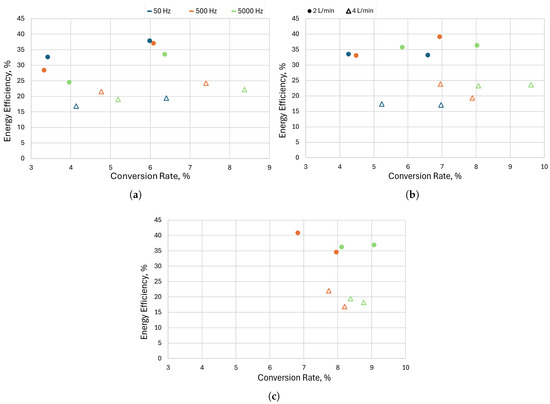
Figure 10.
Comparison of the performance between three frequencies of the high-current pulses—50, 500, and 5000 Hz—for flow rates of 2 and 4 L/min at a pressure of (a) 200 mbar, (b) 350 mbar, and (c) 612 mbar. The results were obtained for the benchmark configuration, without a cooling alumina.
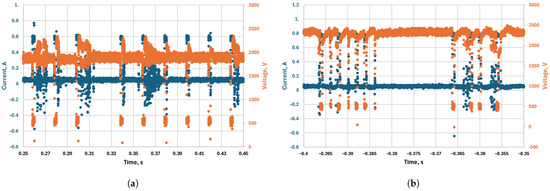
Figure 11.
Oscillograms of the discharge, showing intervals without high-current pulses at frequencies and duty cycles of (a) 50 Hz and 0.1, and (b) 500 Hz and 0.25. Both oscillograms were taken at a pressure of 612 mbar.
We prioritized stability of the discharge under all operating conditions (flow rate, pressure, duty cycle, etc.) and, thus, decided to continue with the next results only at 5000 Hz.
3.3. Quenching Configurations
In this section, a comparison between the different quenching configurations is presented. The configurations were as follows: “None” (without quenching alumina); “0 mm”, i.e., the alumina is in contact with the electrodes; and “5 mm”, i.e., the quenching alumina is placed at a distance of 5 mm from the electrodes. Figure 12 presents the results obtained for the three cooling configurations at different pressures (200, 350, and 612 mbar), a flow rate of 4 L/min, frequency of 5 kHz, and three different values of the duty cycle (0.1, 0.25, and 0.5).
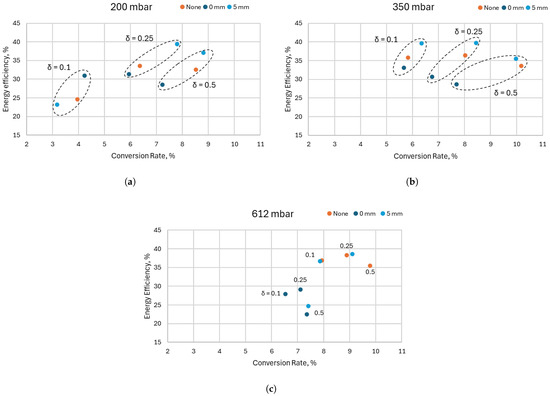
Figure 12.
Comparison between the cooling configurations at different duty cycles. The figures show the energy efficiency as a function of the conversion rate at a pressure of (a) 200 mbar, (b) 350 mbar, and (c) 612 mbar. The dashed contours indicate points with the same duty cycle. All results were obtained at a flow rate of 4 L/min and a high-current pulse frequency of 5 kHz.
Here, the best results for the conversion rate were achieved by both the “5 mm” and “None” configurations at a pressure of 350 mbar and duty cycle 0.5—around 10%—while still retaining a relatively high energy efficiency of 35%. The highest energy efficiency at this flow rate was around 40% at a conversion rate of slightly above 8%, achieved by the “5 mm” configuration at a pressure of 350 mbar and duty cycle 0.25.
Increasing the duty cycle (and therefore, the plasma power) in all configurations and at all pressures leads to an increase in the conversion rate, as expected. An exception to this trend is visible at the highest pressure in Figure 12c for the “5 mm” configuration at a duty cycle of 0.5, where the conversion rate is around 7.5%—lower than the conversion rate obtained with a duty cycle of 0.25 (around 9%). This is a result of the discharge arc column attaching to one of the quartz walls instead of remaining in the middle between both walls. Here, again, only a part of the arc column is attached to the wall, and the current path between the electrodes is not disconnected. We suspect that the reason for this attachment is the higher temperature of the gas and the quartz walls when working at higher power. Increasing the temperature at one wall more than the other, due to unavoidable asymmetric imperfections of the reactor’s construction, leads to the discharge attaching to the “hotter” wall, as this position is more energetically favorable, i.e., lower discharge power and probably also lower gas friction, as shown in [28]. As this effect was found to be critical, photographs of the discharge were taken during most of the measurements. In Figure 13, pictures of different possible situations are shown. The left picture shows a stabilized arc column in the middle of the gas channel in the case without quenching alumina. The middle picture shows a discharge with quenching alumina, where the arc column is attached to the left quartz glass. In the right picture, the arc column is behind the quenching alumina and is not visible.
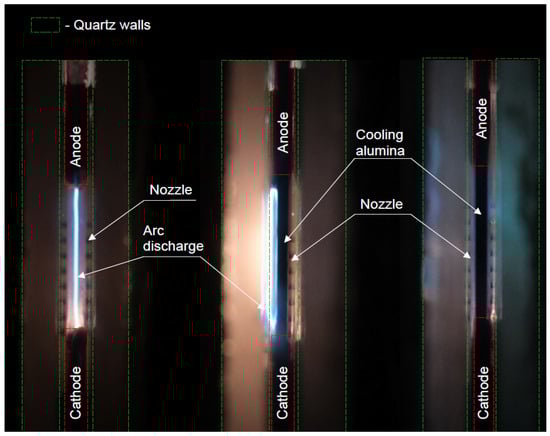
Figure 13.
Pictures showing the position of the arc relative to the quartz walls: (left) arc positioned in the middle between quartz walls without cooling alumina, pressure 612 mbar, = 0.25, configuration “None”, frequency 5 kHz, flow rate 4 L/min; (middle) attached to the left quartz wall with a quenching alumina, pressure 612 mbar, = 0.5, configuration “5 mm”, frequency 5 kHz, flow rate 4 slm; (right) in the middle between quartz walls with cooling alumina, pressure 612 mbar, = 0.5, configuration “5 mm”, frequency 5 kHz, flow rate 8 L/min.
This effect occurs mainly at low gas flow rates and high pressure, where the gas velocity is the lowest. At lower pressures, the attachment to the glass is prevented due to the higher gas velocity. For a given mass flow (for example 4 L/min), the decrease in the pressure (and thus, the gas density) leads to an increase in the volumetric flow and, thus, the gas velocity. For example, reducing the pressure from 600 mbar to 200 mbar would increase the gas velocity threefold.
An easier way to visualize the difference in the results between the configurations is to look at the relative change in the conversion rate and energy efficiency of the quenching configurations compared to the benchmark “None” configuration. We calculated the relative change in a quantity by using
where is the quantity achieved by one of the configurations with quenching alumina, and is the quantity achieved by the benchmark “None” configuration. The results are presented in Figure 14.
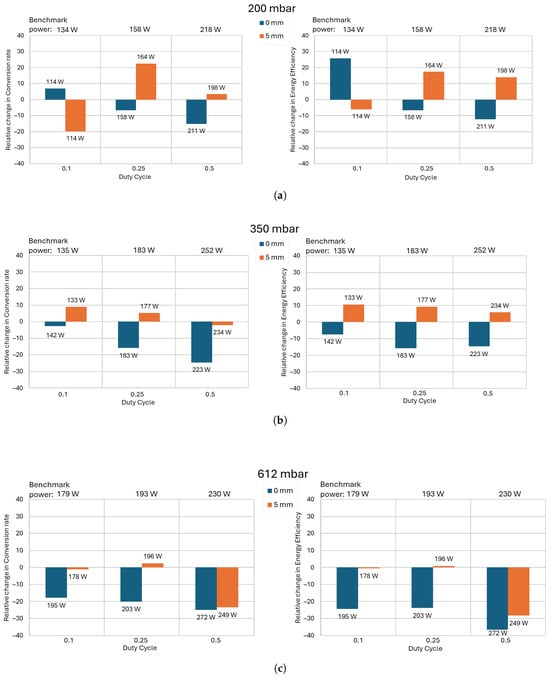
Figure 14.
Relative change in the conversion rate (left) and energy efficiency (right) between the cooling configurations as a function of the high-current pulses’ duty cycle at (a) 200 mbar, (b) 350 mbar, and (c) 612 mbar. Flow rate 4 L/min, frequency of high-current pulses = 5 kHz.
In addition to the change in the conversion rate and energy efficiency, this figure also provides data for the discharge power, which is proportional to the , since the gas mass flow rate is fixed (4 L/min). In Figure 14, the power values measured with the benchmark configuration are shown above each graph. The power measured under each cooling configuration is displayed above its corresponding column.
3.3.1. Detrimental Quenching
Figure 14 shows that, overall, the configuration “0 mm”, where the quenching region is closest to the discharge, performs the worst. It results in lower energy efficiencies and conversion rates, even compared to the “None” configuration with no quenching region. While quenching the gas after it passes through the discharge lowers the recombination reaction, it also lowers the thermal dissociation. If the cooling region is situated too close to the discharge, i.e., where dissociation is the dominant reaction (not recombination), it can decrease the overall conversion rate and energy efficiency. This effect of detrimental rapid cooling has been observed in other studies, including experimental and numerical studies [24,26]. This is why adding a certain amount of distance between the discharge and the cooling region is necessary—in our case, 5 mm from the electrodes. We suspect that for every discharge reactor, plasma power, and flow rate, there exists an optimal distance between the discharge and the cooling region. Finding that distance would require numerical simulations and/or in situ measurements of the spatial evolution of CO concentration, both of which are outside the scope of this paper and may be objects of future studies.
3.3.2. The Effect of Gas Velocity on Quenching
The benefit of the cooling alumina, placed at a distance of 5 mm from the electrodes (the “5 mm” configuration), is more prominent at lower pressures. The relative improvement reaches a maximum at 200 mbar (Figure 14a) and a duty cycle of = 0.25, where the conversion rate increases by 22% and the energy efficiency by 17%. At 350 mbar (Figure 14b), the highest improvements in terms of conversion rate and energy efficiency are achieved at = 0.1 duty cycle, and both are around 10%. At 612 mbar (Figure 14c), the relative change is insignificant and is in the order of the uncertainty. The exception is the relative change at a duty cycle of = 0.5, where the discharge is attached to one of the quartz walls (as explained in Section 3.3 and shown in Figure 13) for both configurations.
The most probable explanation for the decrease in improvement with the increase in pressure is the decrease in gas velocity. As mentioned in Section 3.3, the increase in pressure for the same mass flow rate leads to a decrease in gas velocity. This means that the molecules travel further before reaching the cooling region, which can significantly reduce the quenching rate and, therefore, the benefits of quenching. This hypothesis was further confirmed when, instead of using a mass flow rate of 4 L/min, we used 2 L/min. At this flow rate, at all pressures and duty cycles, the relative change is in the order of the uncertainty.
3.4. Oxygen Production Rate and Energy Cost
In this section, we present the results, in the context of oxygen production on Mars, achieved by the “5 mm” configuration for mass flow rates of 2, 4, and 8 L/min; pressures of 200, 350, and 612 mbar; and duty cycles of 0.1, 0.25, and 0.5. The frequency of the high-current pulses was again 5 kHz. First, we present Figure 15 for the traditional CO2 conversion results’ dependence— energy efficiency as a function of conversion rate. Then, we show the same data, but in terms of energy cost as a function of oxygen production rate. Finally, we add a presentation of the overall energy cost for oxygen production, including a conservative estimation of the energy required for compressing the Martian atmosphere at ambient pressure (7 mbar) to the discharge operational pressure, and we discuss how it affects the energy cost for the same oxygen production rate.
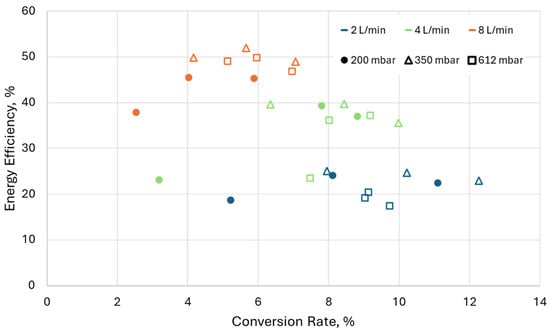
Figure 15.
Energy efficiency as a function of conversion rate for all flow rates, pressures, and duty cycles. Configuration “5 mm”; frequency of high-current pulses = 5 kHz.
Figure 15 shows the energy efficiency as a function of the CO2 conversion rate. A maximum conversion rate of slightly above 12% at a corresponding energy efficiency of 23% is achieved at a pressure of 350 mbar, a flow rate of 2 L/min, and a duty cycle of 0.5. On the other hand, a maximum energy efficiency of around 50% is achieved at a flow rate of 8 L/min and a maximum conversion rate of 7%. Overall, the results show the expected dependencies—an increase in mass flow rate increases the energy efficiency but lowers the conversion rate. The lowering of the conversion rate is due to the decrease in the residence time of the gas in the discharge. An interesting result is the overlap of the conversion rates between different flow rates, especially when comparing 2, 4, and 8 L/min, where for the same conversion rate we achieved higher energy efficiency at higher mass flow rates. For example, at 2 L/min and a conversion rate of around 8%, we achieved an energy efficiency of 25%, while for the same conversion rate we achieved an energy efficiency of around 35–40% when using 4 L/min. This is most probably a result of the quenching, which allows for increasing the thermal dissociation without sacrificing the conversion rate via the recombination reaction. Another observation is the lack of strong dependency of the results on the pressure part of the result, where the arc is attached to the quartz wall.
Figure 16a presents the energy cost and oxygen production for all the aforementioned conditions. In terms of oxygen production rate and energy cost, the highest values were obtained at a mass flow rate of 8 L/min for all studied pressure values. The maximum oxygen production rate was around 23 g/h, while the energy cost was around 0.01 kWh/g (duty cycle 0.5). Looking at these results without adding an energy cost for compression of the Martian atmosphere, it would seem that higher mass flow rates increase the production of oxygen while also lowering the energy cost. Thus, it seems that, for the best results, the energy efficiency is a more important parameter than the CO2 conversion rate (at 8 L/min the conversion is lower but energy efficiency is higher). For comparison, the case with the highest conversion rate of 12% and energy efficiency of 22%, achieved at 2 L/min and 350 mbar, corresponds to an oxygen production rate of around 10 g/h at an energy cost of 0.022 kWh/g. This is a direct consequence of the abovementioned observation that, at the same conversion rate, higher efficiency is achieved at a higher mass flow rate.
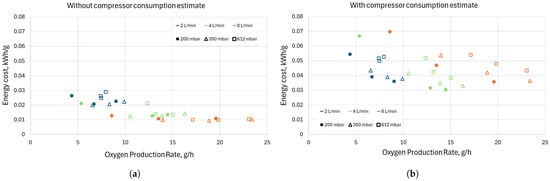
Figure 16.
Energy cost and oxygen production rate (a) without compressor consumption estimate and (b) with compressor consumption estimate. Results shown are for all flow rates, pressures, and duty cycles. Configuration “5 mm”; frequency of high-current pulses = 5 kHz.
If we look at the problem on a system level and consider the energy cost for sustaining a particular operational pressure, one should in some way account for the energy cost of compressing the Martian atmosphere and achieving a certain mass flow rate. In this paper, we make a conservative estimate of this cost. The baseline is the power required for an adiabatic gas compression process. We then multiply this value by an efficiency coefficient derived from the performance of an industrial vacuum pump (Leybold Varodry VD65, operating between 1 atm and 7 mbar [38]). The added power is then
Here, = 7 mbar is the Martian ambient pressure, is the initial volumetric flow of the gas, is the volumetric flow of the gas after the compression, is the heat capacity ratio, and is the coefficient of efficiency. The coefficient was calculated by taking the ratio between the power consumed by the pump to reduce the pressure from 1 atm to 7 mbar and the power calculated by using the adiabatic process approximation.
This is a conservative estimate, as there are multiple different compressors and ways of decreasing the overall power consumption (e.g., a two-stage compression). Nevertheless, even when using this conservative estimate, the overall conclusion is not entirely reversed. Figure 16b shows the energy cost and oxygen production rate of our discharge when using the compressor power consumption estimates mentioned above. The maximum oxygen production rate of 23 g/h achieved with a mass flow rate of 8 L/min and at 350 mbar now comes at a cost of 0.036 kWh/g—a 360% increase. Even with that increase, the 10 g/h achieved at 2 L/min and 350 mbar comes at a similar if not higher energy cost of 0.038 kWh/g. The lowest energy cost was achieved operating at 4 L/min and pressures of 200 and 350 mbar at the highest duty cycle and, thus, the highest conversion rate. Under these conditions the energy cost is around 0.030 kWh/g, while the oxygen production rate is around 14–17 g/h. Thus, for the discharge studied here and a system for oxygen production on Mars, operation at higher flow rates is beneficial and optimal even when taking into account the energy cost for compression. Of course, there is still the need to extract the oxygen from the gas mixture of CO2, CO, and O2 by means of extraction methods like fuel cells and membranes. The extraction system’s energy requirements and dependencies on the mass flow rate and the conversion rate may further change the overall energy cost at a system level, but this is outside the scope of this paper and will be topic for further investigation.
3.5. Comparison with the Literature
In this section, we present a brief comparison with other works in the context of plasma oxygen production on Mars. Due to the lack of studies directly focused on oxygen production on Mars, we have included other results for plasma conversion of CO2 at reduced pressure and/or that also use an oxygen extraction system, both of which are relevant for a system that would be used on Mars. The results are presented in Table 1.

Table 1.
Comparison of different discharges considered for oxygen production on Mars, without the addition of compression consumption.
For most of the results, we used Equations (9)–(11) to calculate the oxygen production rate and energy cost, as the authors did not include the values. Apart from this work, Kelly et al.’s [9,10] are the only values obtained directly by the authors. Overall, the results obtained here are among the best in the literature.
Mori et al. [18,19] utilized a DBD combined with an oxygen extraction system—in this case, a solid-oxide electrolyzer cell (SOEC)—at three different pressures (10, 100, and 1000 mbar). The best performance was achieved at 1000 mbar, where the conversion rate reached the full 100% with a power consumption of 30 W. On the other hand, the mass flow rate was several orders of magnitude lower than the one that we studied, resulting in a lower oxygen production rate—0.017 g/h at an energy cost of 1.75 kWh/g. Nevertheless, the results show the potential benefits of combining gas discharges and oxygen separation systems to increase the overall conversion rate by reducing the recombination reaction.
Kelly et al. [9,10] studied an MW discharge at two different pressures—340 and 25 mbar. With a power consumption of 1000 W and a mass flow rate of 10 L/min, they achieved conversion rates of 9.4% (at 340 mbar) and 15.9% (at 25 mbar), resulting in an oxygen production rate of 47 and 75.7 g/h at an energy cost of 0.021 and 0.013 kWh/g, respectively. These studies further reaffirm the hypothesis that a higher mass flow rate at the cost of a reduced conversion rate results in better performance in terms of oxygen production rate and energy cost.
Chen et al. [17] combined an MW discharge and an oxygen extraction membrane—mixed ion-electron conductor (MIEC)—at atmospheric pressure. At a power of 1000 W and a mass flow rate of 6 L/min, they achieved a conversion rate of 13%, resulting in an oxygen production rate of 31.4 g/h at an energy cost of 0.032 kWh/g. The lower conversion rate compared to the MW discharge mentioned above was most probably due to the operation at higher pressure, where it is well known that MW discharge operates in a contracted regime, resulting in a lower conversion rate and energy efficiency [1]. The work of Chen et al. proves that oxygen extraction systems can be incorporated even in warm discharges, like MW and arcs, where the temperature can reach several thousand Kelvin.
Ogloblina et al. [7] explored a glow discharge operating at Martian ambient pressure. With a discharge power of 100 W at a flow rate of ∼0.02 L/min, they obtained a 35% conversion rate, resulting in an oxygen production rate of 0.245 g/h at an energy cost of 0.407 kWh/g. The authors mentioned that this discharge is not optimized for industrial application but for fundamental research of the processes inside the plasma. They showed that the addition of N2 and Ar (both present in the Martian atmosphere) to the inlet gas can improve the conversion rate and energy efficiency.
All of the above results demonstrate that plasma technologies can be effectively utilized for oxygen production on Mars under a wide range of operating parameters, including pressure, flow rate, and power consumption. The optimal operating conditions will ultimately be decided by different mission parameters, such as available power, size, and weight constraints. The results presented for the arc discharge developed in this study show that this type of discharge is a competitive option for oxygen production. Furthermore, additional investigations, such as integrating an oxygen extraction system (e.g., SOEC or MIEC) downstream of the discharge, are warranted.
4. Conclusions
A novel magnetically and gas-flow-stabilized arc discharge has been developed and partially characterized here. The discharge offers easy scalability, expected to be achievable without significant changes in operational conditions or performance, except for the expected increase in operating voltage and power. This scalability would be achieved by simply increasing the discharge length. The discharge was investigated across a wide range of operational parameters, including gas pressure, mass flow rate, power, current waveform (DC and pulsed unipolar with various duty cycles and frequencies of the pulses), and gas quenching geometries.
The present study focuses on the application of this discharge for CO2 conversion and oxygen generation on Mars, where low-pressure operation is advantageous for minimizing the energy costs associated with compressing the low-pressure Martian atmosphere. At pressures below 300 mbar and discharge currents under 300 mA, the system exhibits instability and transitions between glow and arc regimes, which reduces its energy efficiency due to the high cathode voltage drop in the glow regime. To overcome this limitation, a pulsed operation mode was developed to maintain the discharge in the arc regime and increase CO2 conversion efficiency at low pressure. This is achieved by supplying a large current (∼500 mA) during the pulses, while maintaining a current of 50 mA between the high-current pulses to sustain the discharge and avoid the need for gas breakdowns at every pulse. The highest frequency studied here (5 kHz) provides stable operation for all examined conditions, although lower frequencies might also be an option if consistent high-current pulses are maintained. Based on the experience obtained here, DC operation at low pressure may also be viable if the discharge can sustain a higher current (≥500 mA) and the corresponding power levels at high gas flow rates. However, the current discharge reactor is limited by thermal constraints, leading to overheating and melting of the quartz walls, which prevents operation under such conditions.
Overall, the results obtained here are among the best achieved in the literature. The values obtained here are around 0.01 kWh/g for the energy cost and 23 g/h for the oxygen production. Even if we take into account the energy cost for the gas compression from the Martian atmosphere (7 mbar) to the operational pressure values (200, 350, and 612 mbar), the higher gas flow rates of 4 and 8 L/min are preferable with respect to high oxygen production and lower energy cost for that production. It is important to note that these results are solely for the compressor and plasma conversion system and do not take into account the possible limitations of maximum flow in the oxygen separation system. The effect of the oxygen extraction unit on the overall production rate and energy cost can be determined by combining both the plasma and extraction devices, which is planned for a future study.
Author Contributions
Conceptualization, V.V., N.L. and S.K.; methodology, V.V., N.L., S.L. and S.K.; software, V.V.; validation, V.V., S.L., T.P. and S.K.; formal analysis, V.V., S.L., T.P. and S.K.; investigation, V.V., N.L. and S.K.; resources, S.K.; data curation, V.V., N.L. and S.K.; writing—original draft preparation, V.V., S.L. and S.K.; writing—review and editing, N.L., S.L., T.P. and S.K.; visualization, V.V., N.L. and S.L.; supervision, S.K.; project administration, S.K.; funding acquisition, S.K. All authors have read and agreed to the published version of the manuscript.
Funding
This research was funded by the Bulgarian National Science Fund, Ministry of Education and Science, research grant KP-06-N78/1 from 05.12.2023, and partially by the European Space Agency grant number 4000146712/24/NL/MH/mp.
Data Availability Statement
The raw data supporting the conclusions of this article will be made available by the authors on request.
Conflicts of Interest
The authors declare no conflicts of interest. The funders had no role in the design of the study; in the collection, analyses, or interpretation of data; in the writing of the manuscript; or in the decision to publish the results.
Abbreviations
The following abbreviations are used in this manuscript:
| CO2 | Carbon dioxide |
| O2 | Oxygen |
| PS | Power supply |
| DC | Direct current |
| CO | Carbon monoxide |
| MW | Microwave |
| DBD | Dielectric barrier discharge |
| LPGD | Low-pressure glow discharge |
| GAD | Gliding arc discharge |
| GAP | Gliding arc plasmatron |
| MFC | Mass flow controller |
| FTIR | Fourier-transform infrared |
| SOEC | Solid-oxide electrolyzer cell |
| MIEC | Mixed ion-electron conductor |
References
- Snoeckx, R.; Bogaerts, A. Plasma technology—A novel solution for CO2 conversion? Chem. Soc. Rev. 2017, 46, 5805–5863. [Google Scholar] [CrossRef]
- Centi, G.; Perathoner, S.; Papanikolaou, G. Plasma assisted CO2 splitting to carbon and oxygen: A concept review analysis. J. CO2 Util. 2021, 54, 101775. [Google Scholar] [CrossRef]
- Luo, Y.; Yue, X.; Zhang, H.; Liu, X.; Wu, Z. Recent advances in energy efficiency optimization methods for plasma CO2 conversion. Sci. Total Environ. 2024, 906, 167486. [Google Scholar] [CrossRef]
- Yin, Y.; Yang, T.; Li, Z.; Devid, E.J.; Auerbach, D.J.; Kleyn, A. CO2 conversion by plasma: How to get efficient CO2 conversion and high energy efficiency. Phys. Chem. Chem. Phys. 2021, 23, 7974–7987. [Google Scholar] [CrossRef]
- Guerra, V.; Silva, T.; Ogloblina, P.; Grofulović, M.; Terraz, L.; da Silva, M.L.; Pintassilgo, C.D.; Alves, L.L.; Guaitella, O. The case for in situ resource utilisation for oxygen production on Mars by non-equilibrium plasmas. Plasma Sources Sci. Technol. 2017, 26, 11LT01. [Google Scholar] [CrossRef]
- Guerra, V.; Silva, T.; Pinhão, N.; Guaitella, O.; Guerra-Garcia, C.; Peeters, F.J.J.; Tsampas, M.; van de Sanden, M. Plasmas for in situ resource utilization on Mars: Fuels, life support, and agriculture. J. Appl. Phys. 2022, 132, 070902. [Google Scholar] [CrossRef]
- Ogloblina, P.; Morillo-Candas, A.S.; Silva, A.F.; Silva, T.; Tejero-del Caz, A.; Alves, L.L.; Guaitella, O.; Guerra, V. Mars in situ oxygen and propellant production by non-equilibrium plasmas. Plasma Sources Sci. Technol. 2021, 30, 065005. [Google Scholar] [CrossRef]
- Fu, Q.; Wang, Y.; Chang, Z. Study on the conversion mechanism of CO2 to O2 in pulse voltage dielectric barrier discharge at Martian pressure. J. CO2 Util. 2023, 70, 102430. [Google Scholar] [CrossRef]
- Kelly, S.; Verheyen, C.; Cowley, A.; Bogaerts, A. Producing oxygen and fertilizer with the Martian atmosphere by using microwave plasma. Chem 2022, 8, 2797–2816. [Google Scholar] [CrossRef]
- Kelly, S.; Mercer, E.; Gorbanev, Y.; Fedirchyk, I.; Verheyen, C.; Werner, K.; Pullumbi, P.; Cowley, A.; Bogaerts, A. Plasma-based conversion of martian atmosphere into life-sustaining chemicals: The benefits of utilizing martian ambient pressure. J. CO2 Util. 2024, 80, 102668. [Google Scholar] [CrossRef]
- Wang, X.; Gao, S.; Zhang, Y. Influence of Gap Width on Temporal Nonlinear Behaviors in CO2 Dielectric Barrier Discharges under Martian Conditions. Appl. Sci. 2022, 12, 10990. [Google Scholar] [CrossRef]
- Farges, B.; Poughon, L.; Creuly, C.; Cornet, J.F.; Dussap, C.G.; Lasseur, C. Dynamic aspects and controllability of the MELiSSA project: A bioregenerative system to provide life support in space. Appl. Biochem. Biotechnol. 2008, 151, 686–699. [Google Scholar] [CrossRef]
- Schreiner, S.S.; Sibille, L.; Dominguez, J.A.; Hoffman, J.A. A parametric sizing model for Molten Regolith Electrolysis reactors to produce oxygen on the Moon. Adv. Space Res. 2016, 57, 1585–1603. [Google Scholar] [CrossRef]
- Guan, J.; Lin, M.; Tan, Z.; Li, Y.J.; Duan, X.; Ma, S.; Wang, Y.; Shi, Z.; Dong, H. Separation of oxygen and metals from Mars soil simulant via molten salt electrolysis. Sep. Purif. Technol. 2025, 361, 131431. [Google Scholar] [CrossRef]
- Hecht, M.; Hoffman, J.; Rapp, D.; McClean, J.; SooHoo, J.; Schaefer, R.; Aboobaker, A.; Mellstrom, J.; Hartvigsen, J.; Meyen, F.; et al. Mars oxygen ISRU experiment (MOXIE). Space Sci. Rev. 2021, 217, 9. [Google Scholar] [CrossRef]
- Linne, D.L. Carbon monoxide and oxygen combustion experiments: A demonstration of Mars in situ propellants. In Proceedings of the Joint Propulsion Conference, Sacramento, CA, USA, 24–27 June 1991. Number AIAA PAPER 91-2443. [Google Scholar]
- Chen, G.; Buck, F.; Kistner, I.; Widenmeyer, M.; Schiestel, T.; Schulz, A.; Walker, M.; Weidenkaff, A. A novel plasma-assisted hollow fiber membrane concept for efficiently separating oxygen from CO in a CO2 plasma. Chem. Eng. J. 2020, 392, 123699. [Google Scholar] [CrossRef]
- Mori, S.; Matsuura, N.; Tun, L.L.; Suzuki, M. Direct synthesis of carbon nanotubes from only CO2 by a hybrid reactor of dielectric barrier discharge and solid oxide electrolyser cell. Plasma Chem. Plasma Process. 2016, 36, 231–239. [Google Scholar] [CrossRef]
- Mori, S.; Tun, L.L. Synergistic CO2 conversion by hybridization of dielectric barrier discharge and solid oxide electrolyser cell. Plasma Processes Polym. 2017, 14, 1600153. [Google Scholar] [CrossRef]
- Wang, W.; Mei, D.; Tu, X.; Bogaerts, A. Gliding arc plasma for CO2 conversion: Better insights by a combined experimental and modelling approach. Chem. Eng. J. 2017, 330, 11–25. [Google Scholar] [CrossRef]
- Li, L.; Zhang, H.; Li, X.; Kong, X.; Xu, R.; Tay, K.; Tu, X. Plasma-assisted CO2 conversion in a gliding arc discharge: Improving performance by optimizing the reactor design. J. CO2 Util. 2019, 29, 296–303. [Google Scholar] [CrossRef]
- Li, L.; Zhang, H.; Li, X.; Huang, J.; Kong, X.; Xu, R.; Tu, X. Magnetically enhanced gliding arc discharge for CO2 activation. J. CO2 Util. 2020, 35, 28–37. [Google Scholar] [CrossRef]
- Ivanov, V.; Paunska, T.; Lazarova, S.; Bogaerts, A.; Kolev, S. Gliding arc/glow discharge for CO2 conversion: Comparing the performance of different discharge configurations. J. CO2 Util. 2023, 67, 102300. [Google Scholar] [CrossRef]
- Wang, K.; Ceulemans, S.; Zhang, H.; Tsonev, I.; Zhang, Y.; Long, Y.; Fang, M.; Li, X.; Yan, J.; Bogaerts, A. Inhibiting recombination to improve the performance of plasma-based CO2 conversion. Chem. Eng. J. 2024, 481, 148684. [Google Scholar] [CrossRef]
- Lazarova, S.; Paunska, T.; Vasilev, V.; Tarnev, K.; Iordanova, S.; Kolev, S. Gliding Arc/Glow Discharge for CO2 Conversion: The Role of Discharge Configuration and Gas Channel Thickness. Plasma 2024, 7, 877–890. [Google Scholar] [CrossRef]
- Vertongen, R.; Tsonev, I.; Bogaerts, A. Enhancing CO2 conversion with gas quenching in arc plasma. Chem. Eng. J. 2025, 505, 159487. [Google Scholar] [CrossRef]
- Lazarova, S.; Iordanova, S.; Kolev, S.; Vasilev, V.; Paunska, T. Energy-Efficient CO2 Conversion for Carbon Utilization Using a Gliding Arc/Glow Discharge with Magnetic Field Acceleration—Optimization and Characterization. Energies 2025, 18, 3816. [Google Scholar] [CrossRef]
- Ivanov, V.; Paunska, T.; Tarnev, K.; Kolev, S. Magnetic field stabilization of low current DC arc discharge in cross flow in argon gas at atmospheric pressure—a numerical modelling study. Plasma Sources Sci. Technol. 2021, 30, 085007. [Google Scholar] [CrossRef]
- Li, Z.; Wu, E.; Nie, L.; Liu, D.; Lu, X. Magnetic field stabilized atmospheric pressure plasma nitrogen fixation: Effect of electric field and gas temperature. Phys. Plasmas 2023, 30, 083502. [Google Scholar] [CrossRef]
- Bongers, W.; Bouwmeester, H.; Wolf, B.; Peeters, F.; Welzel, S.; van den Bekerom, D.; den Harder, N.; Goede, A.; Graswinckel, M.; Groen, P.W.; et al. Plasma-driven dissociation of CO2 for fuel synthesis. Plasma Processes Polym. 2017, 14, 1600126. [Google Scholar] [CrossRef]
- Chekmarev, N.; Mansfeld, D.; Vodopyanov, A.; Sintsov, S.; Preobrazhensky, E.; Remez, M. Enhancement of CO2 conversion by counterflow gas quenching of the post-discharge region in microwave plasma sustained by gyrotron radiation. J. CO2 Util. 2024, 82, 102759. [Google Scholar] [CrossRef]
- Kim, H.; Song, S.; Tom, C.P.; Xie, F. Carbon dioxide conversion in an atmospheric pressure microwave plasma reactor: Improving efficiencies by enhancing afterglow quenching. J. CO2 Util. 2020, 37, 240–247. [Google Scholar] [CrossRef]
- Hecimovic, A.; Kiefer, C.; Meindl, A.; Antunes, R.; Fantz, U. Fast gas quenching of microwave plasma effluent for enhanced CO2 conversion. J. CO2 Util. 2023, 71, 102473. [Google Scholar] [CrossRef]
- Wanten, B.; Vertongen, R.; De Meyer, R.; Bogaerts, A. Plasma-based CO2 conversion: How to correctly analyze the performance? J. Energy Chem. 2023, 86, 180–196. [Google Scholar] [CrossRef]
- Kolev, S.; Bogaerts, A. Similarities and differences between gliding glow and gliding arc discharges. Plasma Sources Sci. Technol. 2015, 24, 065023. [Google Scholar] [CrossRef]
- Tsonev, I.; Boothroyd, J.; Kolev, S.; Bogaerts, A. Simulation of glow and arc discharges in nitrogen: Effects of the cathode emission mechanisms. Plasma Sources Sci. Technol. 2023, 32, 054002. [Google Scholar] [CrossRef]
- Raizer, Y.P.; Allen, J.E. Gas Discharge Physics; Springer: Heidelberg, Germany, 1997; Volume 2. [Google Scholar]
- Available online: https://www.leyboldproducts.com/products/dry-compressing-vacuum-pumps/varodry/pumps/3020/varodry-vd65 (accessed on 14 October 2025).
Disclaimer/Publisher’s Note: The statements, opinions and data contained in all publications are solely those of the individual author(s) and contributor(s) and not of MDPI and/or the editor(s). MDPI and/or the editor(s) disclaim responsibility for any injury to people or property resulting from any ideas, methods, instructions or products referred to in the content. |
© 2025 by the authors. Licensee MDPI, Basel, Switzerland. This article is an open access article distributed under the terms and conditions of the Creative Commons Attribution (CC BY) license (https://creativecommons.org/licenses/by/4.0/).