Abstract
In this article, we present an overview of our investigations on the formation and behavior of space charge structures in an argon discharge plasma on gridded and smooth spherical hollow electrodes with and without orifices. Four experiments are described, in which we have used the following: (1) one spherical gridded sphere with one orifice, (2) one hollow smooth stainless steel sphere with two opposing orifices, (3) two smooth polished stainless steel spherical electrodes without orifices, (4) two smooth polished stainless steel spherical electrodes with opposing orifices. The experiments were conducted at the University of Innsbruck in a stainless steel cylindrical chamber (the former Innsbruck DP machine—IDP), and at the Alexandru Ioan Cuza University of Iaşi (Romania) in a Pyrex Vacuum Chamber (PCH). As diagnostics, we have used mainly optical emission spectroscopy to determine electron temperature and density.
1. Introduction
Space charge structures are deviations from the usual quasi-neutrality of a plasma on a scale larger than about 10 times the Debye length [1]. They frequently form plasma in the presence of currents and/or particle beams. Such structures have long been fascinating subjects of research in various plasmas and have numerous applications, either currently under investigation or anticipated in the foreseeable future [2,3,4,5,6,7]. In particular, the so-called double layers [8,9] are still hot topics of plasma research, see for instance [10,11,12,13,14,15,16].
The present extensive investigation constitutes a consistent continuation of our previous studies of plasma space charge structures generated around hollow spherical and cylindrical electrodes (usually of gridded and smooth stainless steel [17,18]), acting as cathodes. In these previous investigations, we had observed that the plasma discharges were perturbed by imperfections of the electrodes due to their shapes (slightly deformed spheres or cylinders, made of stainless steel mesh), small size plasma (hard to analyze) because of miniaturized cathodes, and small distances between the cathodes and the walls of the vacuum chamber, which created chaotic arc discharges.
While gridded electrodes made it possible to observe the formation and behavior of discharge structures also inside the hollow electrodes [17,18,19,20], for reasons of comparison and higher precision in the present investigations, we also have used hollow stainless steel cathodes with very smooth polished surfaces. These cathodes were also larger (up to 13 cm in diameter) and were partly inserted in a grounded, more spacious vacuum chamber with a length of 92 cm and an inner diameter of 53.5 cm (the former Innsbruck DP machine [21,22,23,24,25,26], henceforth referred to as “IDP”), which has strong permanent magnets mounted to its inner wall, thereby not only increasing the plasma density and its homogeneity, but also reducing chaotic arc discharges to the chamber walls. For literature concerning DP machines, see [27].
Comparative investigations were carried out in a Pyrex Vacuum Chamber (PCH) at the Alexandru Ioan Cuza University of Iaşi, Romania, with a height of 60 cm and a diameter of 40 cm at the stainless steel base that also acted as an anode [28].
In former experiments, arc discharges between the cathodes and the inner wall of the chamber appeared and frequently disrupted the stability of the plasma, making it harder to analyze. Pulsed regimes also made spectroscopic investigations futile or impossible due to rapid plasma variations. Later, the imperfection and ruggedness of a cathode of steel mesh created small pockets of plasma on top of the main one, interfering with it, as observed for instance in [29].
Having carried out several experiments inside spherical gridded cathodes, to circumvent these problems, and for comparative purposes, we proceeded with experiments in hollow spherical cathodes of smooth stainless steel spheres with one or two orifices, as well as in double cathodes consisting of two smooth spherical stainless steel electrodes without and with opposite orifices. In these investigations, we mainly focused on the behavior of the plasma, in particular the creation, evolution, and dissolution of hyperboloid structures inside and in front of the cathode orifice(s). The experimental arrangement producing hyperboloidal plasma structures offers particularly interesting and useful applications, such as to spray heavy ions and create films on a substrate, or to produce thrust (ionic or Hall thrusters).
We would like to emphasize that, since in the described experiments the gridded sphere and the smooth spheres, respectively, are always to be acting as cathodes, we consequently and correctly use the expression “to decrease” their bias V when we want to state that we make V more negative with respect to ground. In turn “to increase” V means that we make the cathodes more positive until again V = 0 V is attained.
2. Materials and Methods
Most of the spectroscopic measurements were carried out in the former Innsbruck DP machine [21] (IDP), which consists of a cylindrical stainless steel chamber of 92 cm inner length and 53.5 cm inner diameter (Figure 1). This vacuum chamber was also used in previous studies, partly as Double Plasma (DP) machine. The electrodes were usually biased negatively and were interchanged for various investigations.
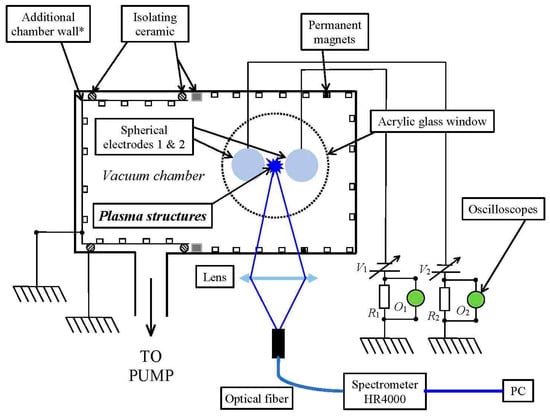
Figure 1.
Schematic of the experimental setup for experiments with two hollow spherical electrodes. In the case of a single spherical electrode, one was made of stainless steel mesh, the other one also of stainless steel with a smooth surface. The space charge produced between cathodes (or inside and in front of a single cathode) is shown schematically in deep blue, as well as the light path and lens, etc., for emission spectroscopy. This device was formerly used as DP machine [21]. * The “additional chamber wall” was used during the former double plasma experiments, where there was also a circular fine mesh expanding across the entire cross section of the IDP.
Emission spectra of the “Plasma structures” (see Figure 1) were recorded using an Ocean Optics HR4000 spectrometer (produced by HALMA, Ostfildern, Germany) focused through a lens onto an optical fiber, a cubic plasma volume of about 7.8 mm3 could then be scanned spectroscopically in front (on the RHS) of the spherical electrode, or right in the center between the two electrodes, for optical emission, aimed at generating the plasma’s spectral diagram during discharges (Figure 2).
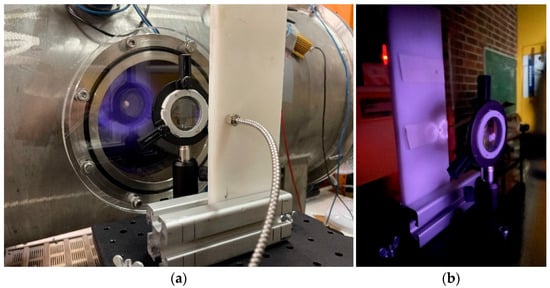
Figure 2.
Spectral acquisition installation, (a) the IDP vacuum chamber: plasma light emission passes through a lens with focal length of 5 cm, (b) the image of the plasma is projected onto a screen where an optical fiber is inserted through a hole, the screen is moveable on OX and OY.
Two types of cathodes were used in the experiments, namely single and double cathodes. In the case of single cathode, two types of spherical electrodes (as mentioned above) were introduced through the acrylic glass window and negatively biased by an isolated copper wire, which also functioned as a mechanical support of the cathode/s. One cathode was made of stainless steel mesh of 5.5 cm diameter (1 mm × 1 mm mesh width). The sphere had an orifice of 17 mm diameter on its horizontal axis on the RHS (see Figure 3).
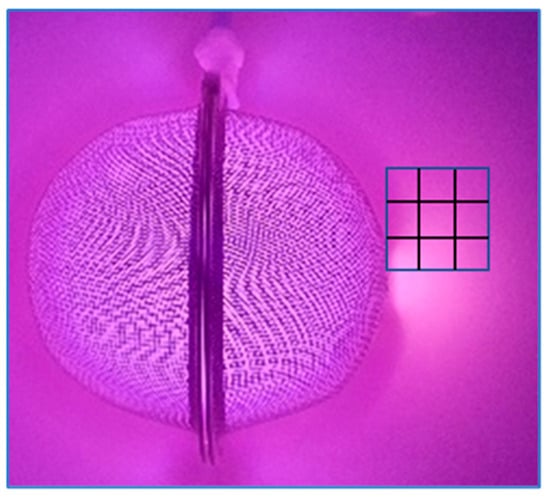
Figure 3.
Schematic of the spherical hollow electrode of stainless steel mesh for the first experiment (see Section 3.1) and the investigated quadratic area from which spectra were collected (each on the center of one of the smaller squares, thus nine positions in total). The same schematic was used for the spectroscopic measurements with the smooth stainless steel sphere (see Section 3.2) and the analogous scheme also for the spectroscopic measurements.
The other one consisted of a smooth hollow stainless steel sphere of 13 cm diameter and two opposing orifices of 34 mm diameter each (see below).
As double cathodes, two smooth spherical stainless steel electrodes of 9.6 cm diameter were used, without and with opposing orifices of 10 mm diameter each one. The two spherical electrodes were biased in parallel from the same power supply.
The second used setup is the Pyrex Vacuum Chamber of Iași (PCH). It consists of a Pyrex bell-shaped vacuum chamber with a height of 60 cm, a diameter of 40 cm at the base, with the thickness of the Pyrex being 8 mm. The bell is placed on a stainless steel plate sealed by a rubber gasket. Near its edge, this plate is provided with several feedthroughs for gas and electricity, while in the central part it connects with the pumping system (preliminary rotative pump and diffusion pump), which assures the lowest pressure of about 10−6 mbar. Argon was introduced as a working gas through a needle valve up to 0.1 mbar. The stainless steel plate serves also as the electric ground (see Figure 4).
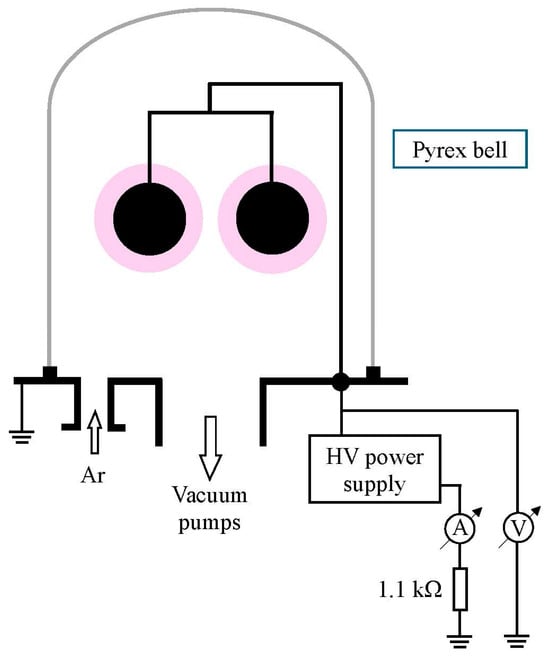
Figure 4.
Schematic of the second experimental setup for the experiments with two smooth hollow spherical stainless steel electrodes of 9.6 cm diameter each and with orifices of 10 mm facing each other. The distance between the spheres (facing surface to surface) is 5 cm. This setup was operated at the Alexandru Ioan Cuza University in Iaşi, Romania, in the Pyrex CHamber (PCH).
Electron temperatures were obtained from the Boltzmann plot slope considering Equation (1):
Under the assumption that the density of the ion species n+ was approximately the same as that of the neutral species n*, the electron density ne was derived by means of the Saha–Eggert equation, as shown in Equation (2):
If there is a low temperature plasma with only first-degree ionization, then ne would be equal to n+, as the plasma would be neutral. Also, if there is an equilibrium of equal concentrations of n* and n+, the formula assumes a simplified form, delivering ne directly.
The symbols and their meaning are listed below:
- Iki—intensity of line for electronic transition between the levels k and I;
- gkAki (s−1)—transition probability;
- λ (nm)—wavelength;
- Z—partition function;
- Ei,k (cm−1)—energy of lower and upper level, respectively;
- kBTe (J)—thermal energy;
- ne (m−3)—electron density;
- +,*—refers to ion and neutral species, respectively;
- me (kg)—mass of electron;
- N0—total number of atoms.
3. Results and Discussion
3.1. Experiment #1—Plasma Evolution Around and Inside a Gridded Sphere in the IDP
3.1.1. Visual Observations
Argon plasma was produced at p = 0.1 mbar gas pressure by a spherical stainless steel mesh cathode of 55 mm diameter (1 mm × 1 mm mesh width). The sphere had an orifice of 17 mm diameter on its horizontal axis on its RHS (see Figure 5).

Figure 5.
Plasma structures for four different biases V of the spherical stainless steel mesh (1 mm × 1 mm mesh) cathode of 55 mm diameter in the IDP: V = −280 V, all three below-mentioned plasma structures are present (a); lowest bias of V = −630 V, extended plasma formation (b); V = −270 V, the inner plasma sphere moves towards the hyperboloid plasma inside the orifice (c); V = −252 V, the inner plasma spheroid merges with the hyperboloid plasma just before the plasma disappears (d).
To elucidate which plasma structures appear and which seem to be most interesting and meaningful, see the following schematic figures (Figure 6).
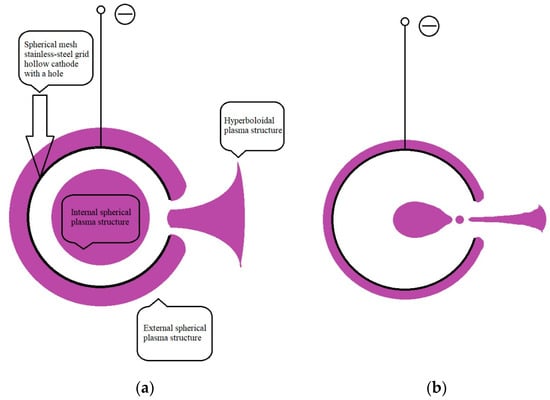
Figure 6.
Schematic presentation of the plasma structures inside and around a hollow cathode of spherical stainless steel mesh (1 mm × 1 mm mesh), cathode diameter 55 mm, and 17 mm diameter orifice in the IDP: internal spherical plasma structure, external spherical plasma structure, and hyperboloidal plasma structure in front of the orifice (cf. Figure 5c) (a); variation and of these structures when the (negative) potential V goes up again, near extinction of the hyperboloid structure (cf. Figure 5d) (b).
3.1.2. Spectroscopy
A typical light spectrum, for instance registered in the center of the spherical electrode, is shown in Figure 7.
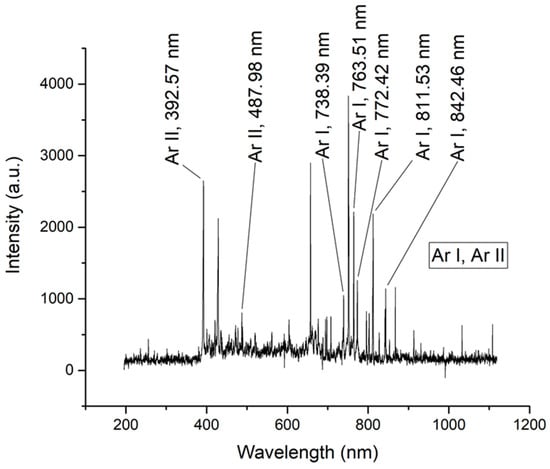
Figure 7.
Ar I and Ar II lines spectrum of plasma emission.
The emission lines were selected for analysis of neutrals (Ar I) and first ionized (Ar II), their selection was based on intensity (avoiding resonant lines), and separation (Table 1).

Table 1.
Selected lines of Ar I, II [30].
Optical emission spectroscopy was performed at the center of the gridded sphere and at the orifice level for V = −461 V and a pressure of p = 0.1 mbar, and the electron temperature was derived therefrom (cf. Equation (1)). We noticed similar temperatures in the center of the plasma and in the orifice, whereas the electron density in the orifice was about three times higher than in the center (Table 2).
Table 2.
Electron temperatures and plasma densities in gridded sphere (Figure 6) calculated from Boltzmann plot and Saha equation, respectively.
3.2. Experiment #2—Single Sphere with Two Opposing Orifices
In this experiment, there is one smooth sphere of stainless steel with a diameter of 13 cm, and two opposing orifices having diameters of 34 mm each.
3.2.1. Current-Voltage Characteristic and Visual Observations
Figure 8 shows the current-voltage characteristic of the above-described cathode in a smooth stainless steel sphere form of 13 cm diameters, having two diametrically opposite orifices of 34 mm in diameter each. The characteristic was obtained by decreasing (black line in Figure 8) and subsequently increasing the potential on the cathode (red line in Figure 8) with respect to the ground and simultaneously recording the discharge current.
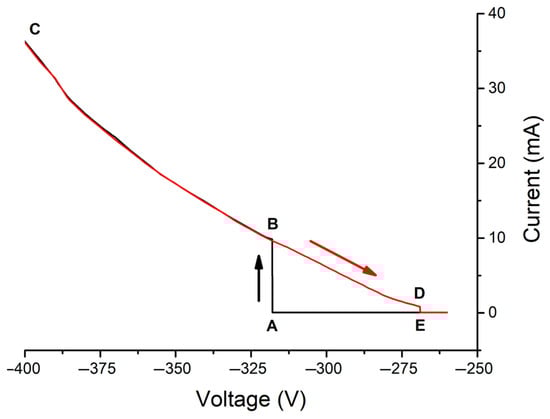
Figure 8.
Current-voltage characteristic of the cathode (smooth sphere with two diametrically opposite orifices). The black branch of the graph shows the increase in the current when the voltage V, applied to the sphere, is made more negative, i.e., the absolute value of the potential difference between ground and the sphere is increased. The red branch shows the current when the voltage V is made less negative, thereby returning towards the case when V = 0 V. The arrows show the evolution of the process from A to B, C, D, and E.
The discharge breakdown takes place at the critical value VA = −318 V, when the discharge current suddenly jumps from point A to B on the I–V characteristic (Figure 8A,B). A luminous plasma surrounds the cathode, presenting an orange structure in front of each of the orifices (see Figure 9(a1,a2)). Noisy low-frequency and low-amplitude oscillations of the discharge current were recorded after this current jump (see the time series of the current oscillations in Figure 10(a1) and their corresponding FFT in Figure 10(a2)).
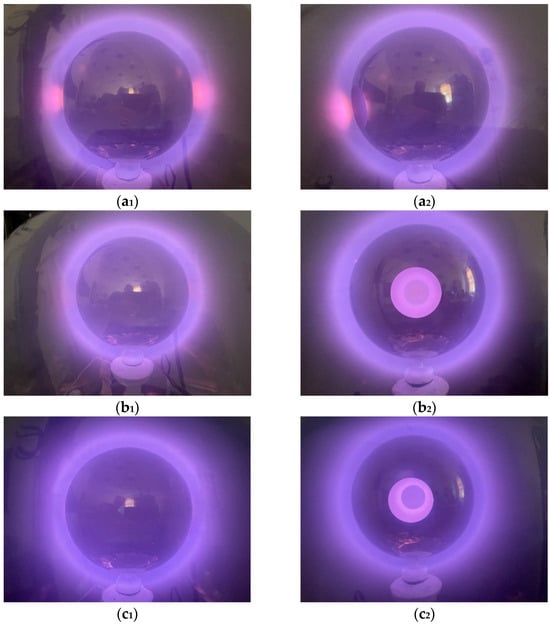
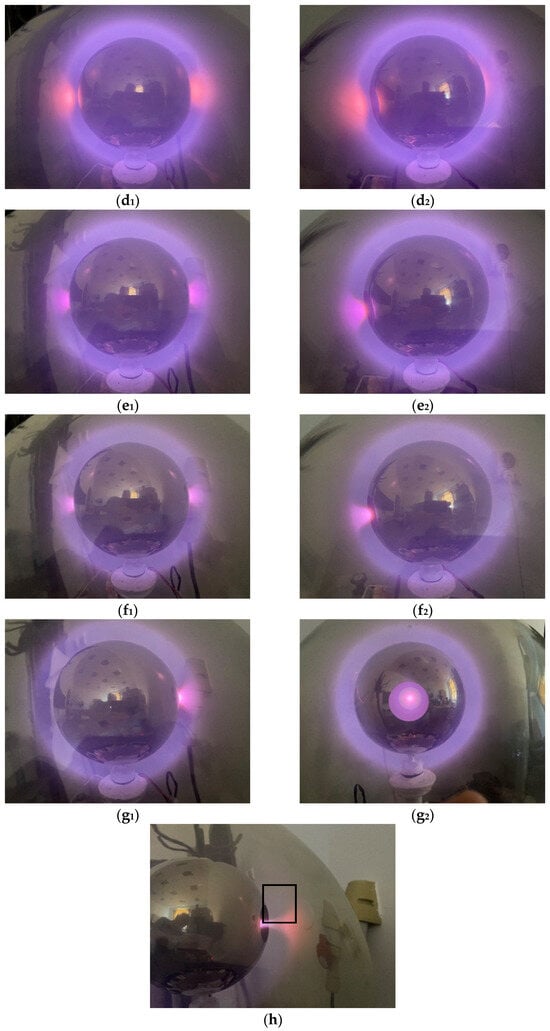
Figure 9.
Different stages of the glow discharge, corresponding to the indicated values of the potential V applied on the cathode (with respect to ground). For each value of V, two photographs of the discharge have been made under different angles: V = −318 V downward (a1,a2); V = −330 V downward (b1,b2); V = −400 V downward (c1,c2); V = −350 V upward (d1,d2); V = −325 V upward (e1,e2); V = −287 V upward (f1,f2); V = −283 V upward (g1,g2); V = −275 V upward (h). The rectangle in (h) indicates the area (25 mm × 30 mm) from which the 21 spectroscopic data were taken to determine the electron temperature map shown in Figure 11 below.
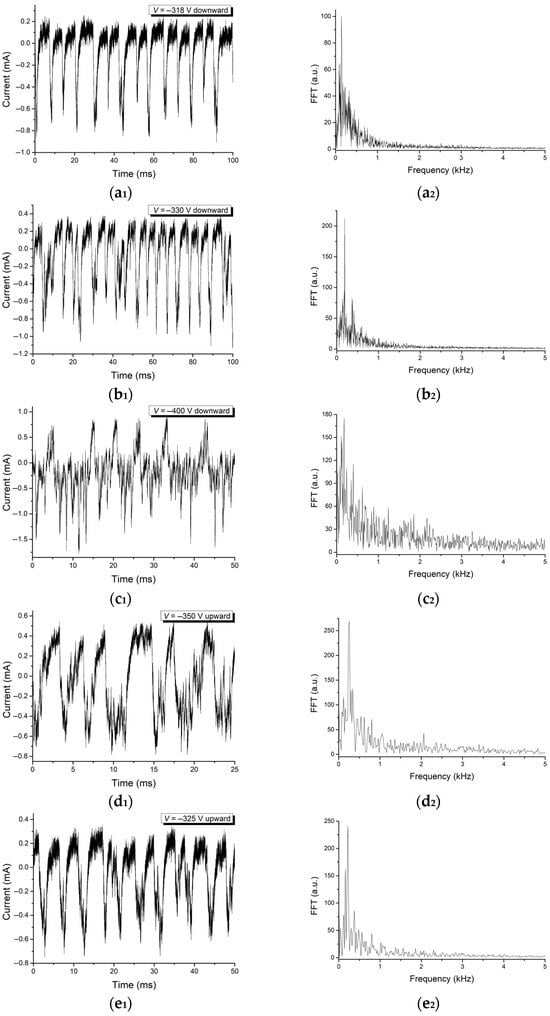
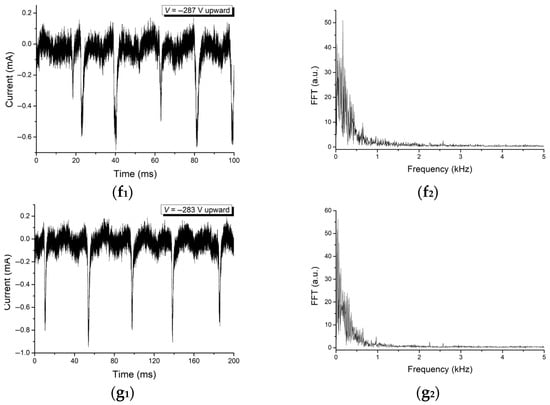
Figure 10.
Time series of the discharge current oscillations (LHS column) and their FFTs (RHS column) for different values of the potential V applied to the cathode with respect to ground, specified in the LHS column figures. The numbering of the figures corresponds to the numbering of the photographs in Figure 9. V = −318 V downward (a1,a2); V = −330 V downward (b1,b2); V = −400 V downward (c1,c2); V = −350 V upward (d1,d2); V = −325 V upward (e1,e2); V = −287 V upward (f1,f2); V = −283 V upward (g1,g2).
By further decreasing the voltage, the orange luminous structures in front of the orifices disappear at around V = −330 V (Figure 9(b1,b2)). The oscillations of the current (Figure 10(b1)) become more regular, this phenomenon being more obvious in their FFT spectrum (Figure 10(b2)), where the peak corresponding to 190 Hz strongly increases, as well as its second harmonic.
Further decreasing the voltage to V = −400 V gives rise to an increase in the discharge luminosity (Figure 9(c1,c2)), while the discharge current oscillations become more and more chaotic (Figure 10(c1,c2)).
When re-increasing the potential on the cathode, the two orange structures in front of the orifices reappear at V = −350 V (Figure 9(d1,d2)). The discharge current oscillations become more regular (Figure 10(d1,d2)).
Further increase in the potential to V = −325 V and V = −287 V leads to an elongation of the structures towards the orifices, while their color changes from orange to blue with an orange front towards the orifices (Figure 9(e1,2,f1,2)). The oscillations of the discharge current become more and more chaotic (Figure 10(e1,2,f1,2)).
For V = −283 V, the structure in front of the left orifice disappears (Figure 9(g1,g2)), without any qualitative change in the behavior of the discharge current oscillations (Figure 10(g1,g2)). For V = −275 V, the discharge quenching takes place, but before this, the structure in front of the right orifices changes its shape and color and penetrates through the orifice inside the cathode (Figure 9h). No oscillations of the discharge current were observed in this stage.
As usual, the breakdown and quenching of the glow discharge emphasizes a strong hysteresis (ABDE in Figure 8) of about 50 V.
3.2.2. Spectroscopy
The area analyzed was a rectangle of 25 mm × 30 mm, resulting in 21 points where the spectra were collected to calculate the electron temperature in Kelvin (see Figure 9h). The resulting electron temperature map is shown in Figure 11. The results are in good agreement with our previous results [25] obtained by cold Langmuir probes and using a spherical grid electrode with hole in similar experimental conditions.
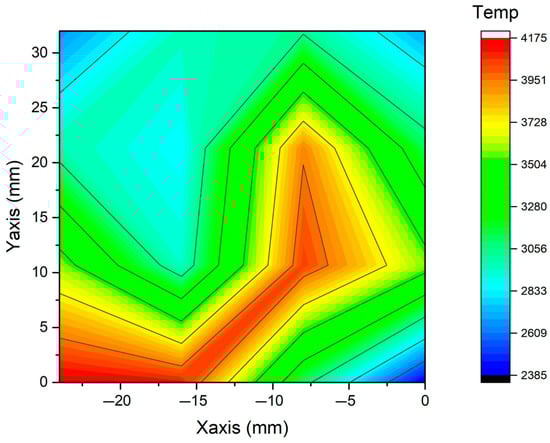
Figure 11.
Electron temperature map (in Kelvin) for the upper left portion of the plasma (see Figure 9h) in which the dimension and the position of the measured area for the electron temperature map (25 mm × 30 mm) is indicated.
3.3. Reproducibility of the Experiments
The IDP (Innsbruck DP machine, Figure 1) vacuum chamber, in which Experiment #1 (Section 3.1, and Figure 5) was conducted, was equipped with small magnets with the purpose of limiting the chaotic arc discharges between the cathode and the interior walls of the chamber [21]. But there was a question whether the hyperboloid shape of the plasma, obtained on the gridded cathodes (Figure 5) would still exist, or whether this geometrical hyperboloid structure is only due to the IDP magnets.
To assess the possible influence of the permanent magnets, we took the gridded sphere from Experiment #1 (Section 3.1) and placed it inside a different chamber at the Plasma Physics Lab of the University of Innsbruck; it was smaller in size and without permanent magnets on the internal wall. The Ar pressure was the same (i.e., 0.1 mbar), the electrical setup was the same, including the power source which biased the cathode at V –500 V, the same resistor, and wires. As can be seen in Figure 12, the plasma structure looks the same as in Experiment #1, i.e., a spheroidal plasma structure inside the spherical grid and a hyperboloid of rotation plasma structure outside of the hole. The only difference was that a lot of chaotic arc discharges occurred, sooner encountered while decreasing the potential towards lower voltage (increasing the potential difference up to 500 V) in comparison with the experiments inside the IDP vacuum chamber with permanent magnets.
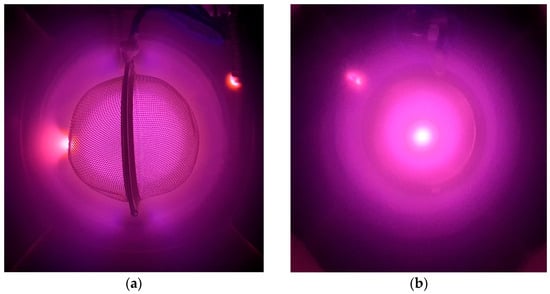
Figure 12.
Plasma structures obtained with the same gridded sphere as in Experiment #1 in a smaller vacuum chamber without permanent magnets: front view (a); lateral view (b). This was a brief experiment to test where the results of Experiment #1 can be reproduced in a smaller plasma chamber without magnets on the internal walls.
So, our conclusion was that the formation of the hyperboloid structure is more or less independent on the chamber and its size and whether there are permanent magnets or not on the inner walls. Thus, the reproducibility was sufficiently granted.
3.4. Experiment #3—Spectral Investigations in a Cathode Discharge Between Two Smooth Polished Stainless Steel Spheres Without Orifices in the IDP
3.4.1. Visual Observations
In this case, cathodic discharges were created in a system of two smooth, polished, hollow stainless steel spheres with 9.6 cm diameter each (wall thickness 1 mm), placed at 5 cm distance from each other (facing surface to surface). Both spheres were electrically coupled in parallel and simultaneously biased negatively in argon at a pressure of 0.1 mbar. The best conditions for obtaining a symmetrical and intense (but stable) discharge were found for biases around V = −500 V for both spheres.
Various spatial structures were observed around the spheres (see Figure 13):
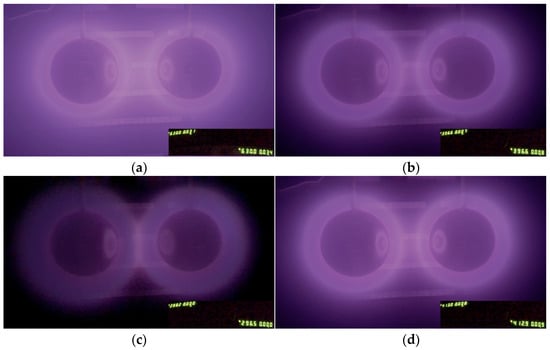
Figure 13.
Separated discharges around each sphere for V = −630 V (a), V = −396 V (b), V = −290 V (c) and V = −413 V (d), respectively. In the inserts, the upper left (yellow) value represents the bias for the left cathode and the lower right (yellow) value represents the bias of the right cathode.
- For V = −630 V (Figure 13a), strongly glowing and distinct spheroids of plasma appear around each of the spherical electrodes. However, these structures do not follow exactly the spherical metal surfaces of the cathodes. Having the same potential, they repel each other, resulting in some eccentricity of the plasma structures with respect to the shape of the spheres.
- If the bias is increased to V = −396 V, we observe that the structures tend to approach each other (Figure 13b).
- Then, we see plasma overlapping for V ≅ –290 V (Figure 13c).
3.4.2. Spectroscopy
Spectral measurements of the optical emission from the glowing plasma in between the two spheres were taken at a bias of V ≅ –500 V. Both spheres were electrically coupled in parallel with a total current of 17 mA in the circuit at an Ar pressure p = 0.1 mbar. Seventeen points near the LHS sphere are shown in Figure 14a,b (close up). From these points, spectral data were obtained which made it possible to construct the plasma’s two-dimensional temperature profiles (Figure 14d,e) and density profiles (Figure 15a,b), respectively.
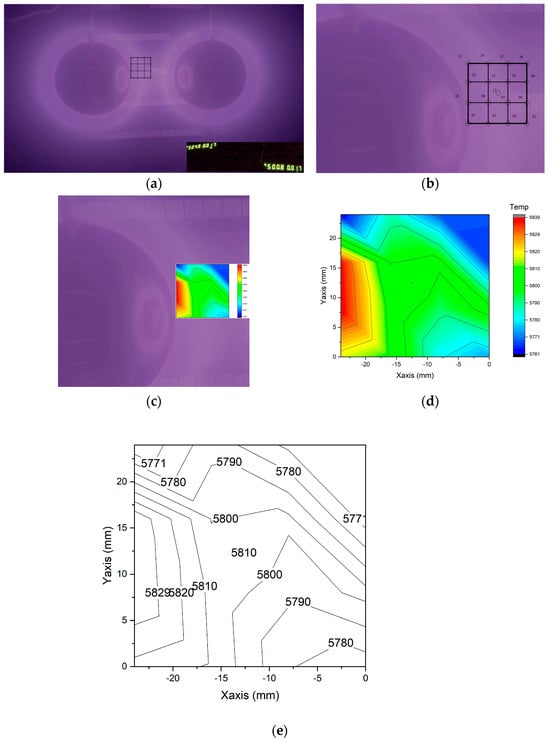
Figure 14.
Discharge for V = −500 V with the approximate quadratic zone indicated from which spectroscopic data were obtained (a); close up of this zone showing the seventeen points (marked with small circles) where the measurements were carried out (b); map of the electron temperatures Te (in K) calculated by the method, described in part I (Equation (1)) (c); zoomed-in Te-map (d); isothermal lines inside the evaluated square (e).
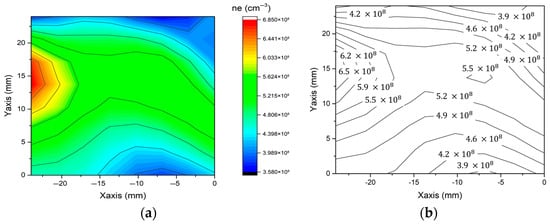
Figure 15.
Electron density map for the area investigated (see Figure 14b) (a); equidensities of ne in cm−3 (b).
The highest electron temperature Te was found in an area near the surface of the spheres (Figure 14d, red zone, for around –24 ≤ X ≤ –22 mm and 5 ≤ Y ≤ 17 mm). There, the electron temperature reached values up to Te ≅ 5840 K). However, for the region around Y ≅ 0, which was actually the region of closest approach between the two spheres, the electron temperature was again lower, even almost on the surface of the (in this case the LHS-) sphere (Te ≅ 5820 K). This was probably because of the mutual influence of the plasma coming from the neighboring sphere, generally reducing the temperature along the horizontal axis. We have to be aware that the observed electron temperature range was very small, so we probably measured just a group of electrons, while more energetic electrons were also present. The previous results obtained by cold Langmuir probe measurements [17,18], but using two concentric grid cathodes, indicate similar values for the electron temperature outside the external electrode hole. Thus, in [17], for a low value of the potential applied on the outer grid (−11 V), the electron temperature was found in the range 0.3–0.55 eV, while for a higher value of the potential applied on the outer grid (−350 V), the electron temperature near the hole is around 5 eV, but rapidly decreases to about 1 eV with the distance to the hole. In reference [18], for a low value of the voltage applied to both grids (this time −350 V), the electron temperature was found in the range 0.2–0.3 eV, while for a higher value (−500 V, the same as it was applied in the present investigation), the electron temperature is 0.5 eV near the hole, increases to 1.2 eV at about 20 mm to the hole and further decreases to about 0.8 eV at higher distance to the hole. Please note that 1 eV corresponds to 11,606 K.
In the same quadratic zone, as indicated in Figure 14b, from the same spectroscopic data, also the electron densities ne have been determined using Equation (2). The results are shown in Figure 15. Also in this case, the highest values of the electron density are not found on the surface of the spheres where they are closest to each other (i.e., for Y ≅ 0) but for Y ≅ 15 mm (ne ≅ 6.5 × 108 cm−3).
3.5. Experiment #4—Electrical and Spectral Investigation on Two Spherical Cathode Discharges with Opposing Orifices in the Pyrex Vacuum CHamber of Iași (PCH)
3.5.1. Visual Observations
In this experiment, the same hollow spheres of smooth stainless steel, used in experiment #3 in the IDP (see previous subsection), with outer diameters of 9.6 cm and orifices of 10 mm diameter each, were used in the PCH. The spheres were mounted, as indicated schematically in Figure 4, and biased in parallel from the same power supply. The orifices were facing each other. The argon gas pressure was 0.1 mbar.
Reducing the bias V of the two spheres to about V = −290 V, a very thin discharge plasma structure appears, encasing both spheres together (see Figure 16). Further decreasing the bias on both spheres to V = −384 V, the structure splits into two distinct concentric structures encasing each sphere separately. Further on, the structures become eccentric with respect to their spheres, as if repelling each other, similar to the effect observed in the IDP (see the previous Section 3.4, Figure 13a). However, eccentricity could also be attributed to the presence of the hyperboloidal structure that appears near the orifice, which interferes with the exterior plasma structure (as experiments in which a single sphere with an orifice also showed the presence of an eccentricity).
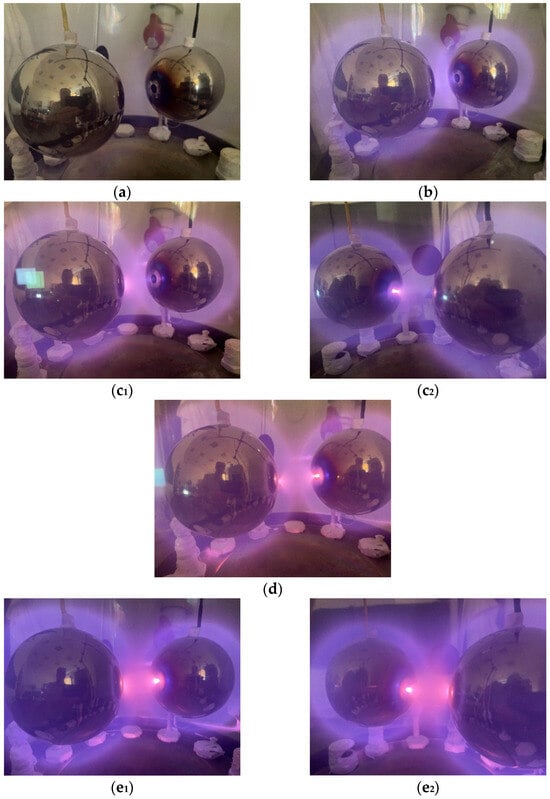
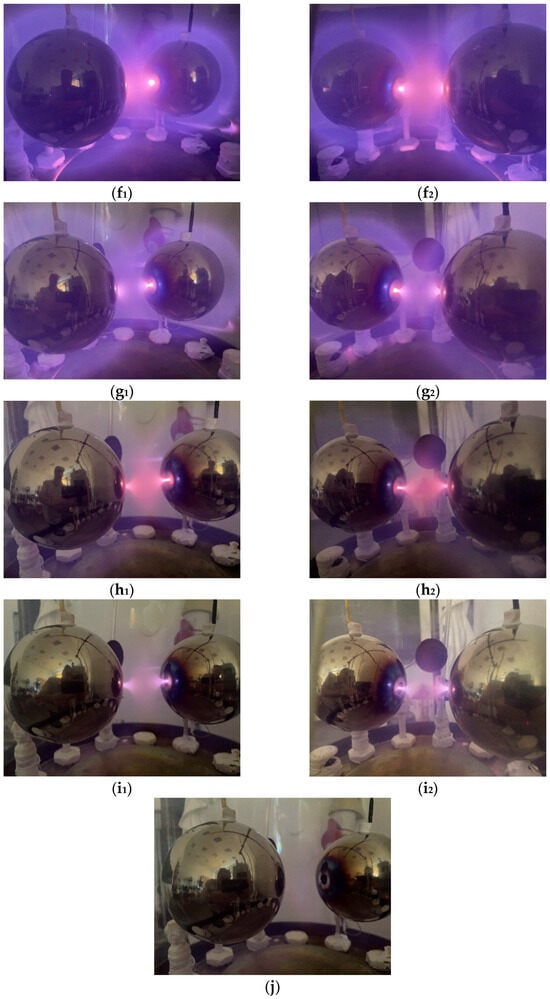
Figure 16.
Photos of different stages of the glow discharge, corresponding to the indicated values of the potential applied on the cathode (with respect to ground—see also the following Figure 17 which shows the respective current-voltage characteristic): V = −276 V downward (a); V = −330 V downward (b); V = −365 V downward (c1,c2); V = −374 V downward (d); V = −400 V downward (e1,e2); V = −500 V downward (f1,f2); V = −400 V upward (g1,g2); V = −325 V upward (h1,h2); V = −305 V upward (i1,i2); V = −285 V upward (j). In the subfigures (a–f1,2), “downward” means for decreasing (more negative) values of the bias V on the spheres, whereas “upwards” means re-increasing the voltage towards zero (subfigures (g1,2–j)). See also the following figure (Figure 17) which shows the corresponding current-voltage characteristic of the two spheres. For a part of the values of V two photos have been made from two different angles.
For V = −530 V, hyperboloidal plasma structures appear inside each orifice. Increasing the voltage again from V = −630 V to zero, a strong hysteretic behavior is seen (see Figure 17), as the plasma structures “struggle to survive”. At about V = −300 V, the hyperboloids retract inside of each own sphere until all structures disappear at V = −289 V.
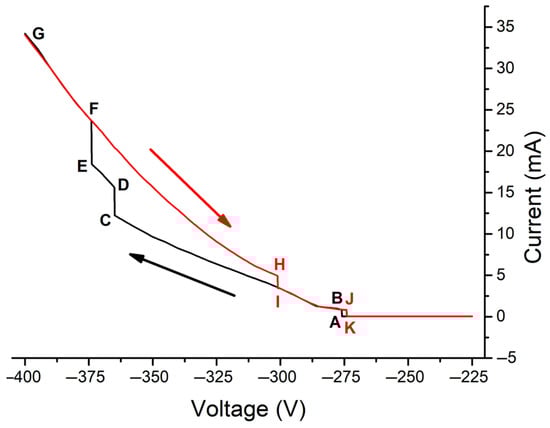
Figure 17.
Current-voltage characteristic of the cathode (two metallic spheres, electrically connected, with face-to-face orifices in the PCH). The black branch of the graph shows the increase in the current when the voltage V, applied to the two spheres in parallel, is made more negative, i.e., the absolute value of the potential difference between ground and the two spheres is increased. The red branch shows the current when the voltage V is made less negative, thereby returning towards the case when V = 0 V. The arrows show the evolution of the process from A to B, C, D, E, F, G, H, I, J, and K.
The discharge breakdown takes place at the critical value VA = −276 V, when the discharge current makes a sudden, but relatively small jump from point A to B on the (black branch) I–V characteristic (Figure 17). A very diffuse plasma appears between the two spheres, in the region between the orifices (see Figure 16a). Complex modulated oscillations of the discharge current were recorded after this current jump (see the time series of the current oscillations in Figure 18(a1) and their corresponding FFTs in Figure 18(a2)).
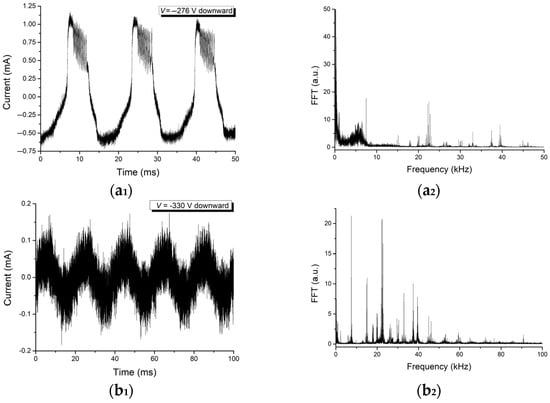
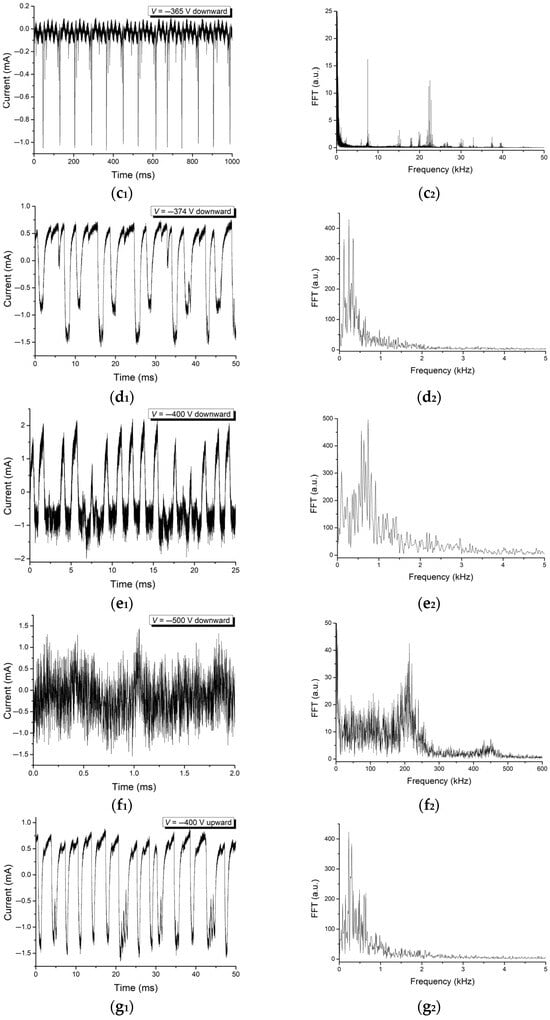
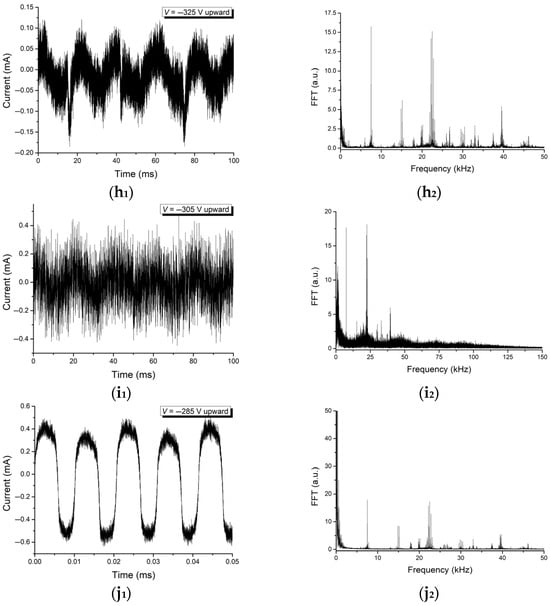
Figure 18.
Time series of the discharge current oscillations (LHS column: a1–j1) and their FFTs (RHS column: a2–j2) for different values of the potential applied on the cathode with respect to the ground, specified on the LHS column figures.
By further decrease in the voltage V (i.e., the absolute value of the potential difference is increased), the plasma density increases, together with its luminosity, with the plasma surrounding both spheres (Figure 16b). The shape of the oscillations slightly changes, while the low-frequency noise decreases (Figure 18(b1,b2)). At the critical value VC = −365 V, an intense luminous structure appears in front of the left sphere’s orifice (Figure 16(c1,c2)), together with a current jump in the I–V characteristic of the cathode (C,D in Figure 17). Regarding the oscillations of the discharge current (Figure 18(c1,c2)), besides some high amplitude oscillations triggered by the 50 Hz noise, several peaks are present in the FFT spectrum at 7.5 kHz and around 22.5 kHz.
A second jump of the current (E,F in Figure 17) occurs in the I–V characteristic at the critical value VE = −374 V. Simultaneously, a second intense luminous structure appears in the front of the right sphere orifice (Figure 16d). A period-doubling bifurcation of the plasma system dynamics is recorded, which affects the high-amplitude low-frequency oscillations (Figure 18(d1,d2)). Further decreasing the bias to VG = −400 V (Figure 16(e1,e2)) and –500 V (Figure 16(f1,f2)), respectively, determines a further increase in the discharge and the structures’ luminosities while the discharge current oscillations become more and more chaotic, both in the range of low and high frequencies (Figure 18e1, Figure 18e2, Figure 18f1 and Figure 18f2, respectively).
When re-increasing the potential V on the cathode towards point H (red branch of the characteristic in Figure 17, again reaching V = −400 V and then V = −325 V), the luminosity of the two structures in front of the orifices, as well as of the plasma around the two spheres, decreases (Figure 16g1, Figure 16g2, Figure 16h1 and Figure 16h2, respectively). The structures start to penetrate towards the orifices inside the spheres and again low-frequency oscillations of the discharge current are recorded (Figure 18g1, Figure 18g2, Figure 18h1 and Figure 18h2, respectively). By further increasing the voltage (around V = −325 V and then −305 V), the plasma around the spheres becomes diffuse, concentrating in the region between the orifices and changing the color from blue to orange (Figure 16(h1,h2)). Modulated oscillations of the discharge current are present, with several peaks in the region 5–50 kHz of the FFT spectrum (Figure 18(i1,i2)). For V = −305 V, the plasma between the holes becomes very diffuse, and only the structures in the discharge gap are still clearly visible (see again Figure 16(i1,i2)). The oscillations of the discharge current become more and more chaotic, which is obvious in the FFT spectrum (see again Figure 18(i1,i2)). At a critical value of VH = −301 V, the structures in front of the holes suddenly disappear, simultaneously with a downward jump of the discharge current (H,I in Figure 17). From now until the complete quenching of the plasma, which occurs at the critical value of the potential VJ = −276 V simultaneously with a second downward jump of the current (J,K in Figure 17), just a very diffuse plasma can be observed between the spheres, in the region of the holes (Figure 16j). Low-frequency oscillations of the discharge current are dominant, but small amplitude peaks in the region 5–50 kHz are still present in the FFT spectrum (Figure 18(j1,j2)). The breakdown-quenching of the glow discharge emphasizes a small hysteresis (ABJK in Figure 17), but a strong hysteresis is present in the current-voltage characteristics related to the appearance-disappearance of the intense luminous structures in the region of the holes (CDEFHI in Figure 17).
3.5.2. Spectroscopy
Optical spectroscopy was performed on the intersection plasma volume (see Figure 1). The spectroscopic data were used to determine the electron temperature of the plasma. The area investigated was roughly the same as in the previous experiment, a rectangle of 25 mm × 25 mm, and its location is on the upper left quadrant (Figure 19a). The resulting electron heat map is shown in Figure 19b.
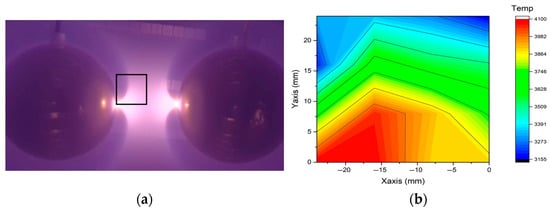
Figure 19.
Spectral measurements of the plasma temperature between the two spheres (a), the square showing the investigated area (similar to Figure 14b); electron temperature map (b).
The electron heat map is different from the one of the previous experiment, as a structure resembling a hyperboloid of rotation appears, so along the horizontal axis the temperature is higher, but there is a repelling effect translated into a diminished gradient of electron temperature due to the presence of the other sphere.
4. Conclusions
Four experiments were carried out with hollow cathodes shaped like spheres.
Experiment #1 (Section 3.1) used a gridded sphere of stainless steel mesh showing the presence of two distinct plasma structures, one spheroidal inside the physical stainless steel mesh, the other hyperboloidal outside of the hole. Both structures moved towards each other at low biases of the cathodes (V ≅ −250 V) and tended to merge before disappearing. At very negative biases (V ≅ −500 V) the hyperboloidal plasma structure tended to expand and encase the physical grid to become a spheroid.
Experiment #2 (Section 3.2) used one smooth stainless steel sphere with a diameter of 13 cm with two opposing orifices, each 34 mm in diameter. The discharge breakdown took place at V = −318 V, when a luminous plasma surrounded the cathode, with orange structures in front of each of the orifices. By further decreasing the voltage, the orange luminous structures in front of the orifices disappeared. Further on, the oscillations of the current became very regular while the luminosity of the discharge increased. Re-increasing the voltage, the two orange structures in front of the orifices reappeared and became longer, changing their color and penetrating through the orifice into the cathode.
In Experiment #3, the absence of any orifices in two smooth spherical stainless steel cathodes showed spheroidal plasma structures encasing each sphere. However, both spheroidal plasma structures showed a slight eccentricity due to the repelling force of the “sister” structure from the other sphere and the hyperboloidal structures. The maps of the electron temperature and density, respectively, in the region between the two spheres showed that the maximum temperature was found near the surface of the spheres but not on the common axis of the two spheres. Also, the density showed its maximum outside the axis.
In Experiment #4, the two smooth spheres were equipped with opposing orifices, showing the most interesting effects as follows: the hyperboloidal plasma structures repelled each other, while their bases tended to enlarge and flatten. Strong nonlinear phenomena were highlighted in connection with the appearance and dynamics of the space-charge structures, like current jumps, hysteresis, period-doubling bifurcation, or chaotic states of the plasma system dynamics. The current-voltage characteristic shows several hysteretic jumps.
Spectral diagnosis was performed, providing an estimation of the electrons’ temperature and density in the regions from the front of the hole (in the case of single cathode), as well as right in the center between the two spherical electrodes, without and with opposite orifices.
These experiments are useful for understanding the fundamental physical processes responsible for the plasma ignition and behavior of cathode systems. One application will be film deposition, and here the two-sphere system could be used to “spray” ions from both sides. Another application can be propulsion/thrust, as a sphere can accommodate inside of it an electric or electromagnetic field as in ion or Hall thrusters.
Author Contributions
Conceptualization, F.E., C.I. and R.S.; methodology, F.E., C.I., D.G.D. and R.S.; software, F.E. and D.G.D.; validation, F.E., C.I., D.G.D. and R.S.; formal analysis, F.E. and C.I.; investigation, F.E. and D.G.D.; resources, F.E., C.I., D.G.D. and R.S.; data curation, F.E. and D.G.D.; writing—original draft preparation, F.E. and D.G.D.; writing—review and editing, F.E., C.I., D.G.D. and R.S.; visualization, F.E. and D.G.D.; supervision, C.I. and R.S.; project administration, C.I. and R.S.; funding acquisition, C.I. All authors have read and agreed to the published version of the manuscript.
Funding
This work was supported strongly by the University of Innsbruck and by the CEEPUS (Central European Exchange Program for University Studies) Exchange Network AT-0063, for which we are very grateful. The CEEPUS Exchange Network AT-0063 and its Precursor CEEPUS Exchange Network A-0103 have been extremely valuable for our collaboration since 1999. In context with the above-mentioned 50-year-long collaboration between the two Plasma Physics Groups, we would also like to point out that before the founding of CEEPUS, our collaboration was strongly supported also by the Exchange Program between the Romanian Academy of Sciences and the Austrian Academy of Sciences.
Institutional Review Board Statement
Not applicable.
Informed Consent Statement
Not applicable.
Data Availability Statement
The data presented in this study are available on reasonable request from the corresponding author.
Acknowledgments
In the first place, we would like to thank Tilmann Märk, to whom we dedicate this work, for his more than 50-year-long support of the Innsbruck Experimental Plasma Physics Group, as Head of the Institute for Ion Physics and Applied Physics, and later on as distinguished long-standing Rector of the University of Innsbruck. Tilmann Märk also strongly supported the close and extraordinarily fruitful scientific and human relations between the Plasma Physics Departments of the Alexandru Ioan Cuza University of Iaşi and the University of Innsbruck.
Conflicts of Interest
The authors declare no conflicts of interest.
References
- Piel, A. Plasma Boundaries. In Plasma Physics. An Introduction to Laboratory, Space, and Fusion Plasma, 2nd ed.; Springer International Publishing: Cham, Switzerland, 2017; Chapter 7; pp. 175–209. [Google Scholar] [CrossRef]
- Fukuyama, T.; Hagimine, K.; Miyazaki, R. Improvement of phase synchronization between chaotic oscillators with external force in a laboratory plasma. J. Phys. Soc. Jpn. 2017, 86, 095003. [Google Scholar] [CrossRef]
- Irimiciuc, S.A.; Chertopalov, S.; Bulíř, J.; Fekete, L.; Vondráček, M.; Novotný, M.; Craciun, V.; Lancok, J. In situ optical and electrical analysis of transient plasmas generated by ns-laser ablation of Ag nanostructured film production. Vacuum 2021, 193, 110528. [Google Scholar] [CrossRef]
- Liu, Y.; Shi, P.; Zhang, X.; Lei, J.; Ding, W. Laboratory plasma devices for space physics investigation. Rev. Sci. Instrum. 2021, 92, 071101. [Google Scholar] [CrossRef] [PubMed]
- Ren, L.; Wang, Y.; Ding, W.; Sun, A.; Karadag, B.; Deng, Z.; Geng, J. Discharge characteristics and mode transition of a ring-cusp magnetically confined plasma bridge neutralizer. J. Appl. Phys. 2022, 132, 083301. [Google Scholar] [CrossRef]
- Joseph, R.; Impey, C.; Planchon, O.; del Gaudio, R.; Abu Safa, M.; Sumanarathna, A.R.; Ansbro, E.; Duvall, D.; Bianciardi, G.; Gibson, C.H.; et al. Extraterrestrial life in the thermosphere: Plasmas, UAP, pre-life, fourth state of matter. J. Mod. Phys. 2024, 15, 322–374. [Google Scholar] [CrossRef]
- Lin, C.-Y. Evaluation of adequate type of non-thermal plasma for treating oil sludge to produce refined fuel. Processes 2025, 13, 1822. [Google Scholar] [CrossRef]
- Schrittwieser, R.; Eder, G. (Eds.) Proceedings of the Second Symposium on Plasma Double Layers and Related Topics, Innsbruck, Austria, 5–6 July 1984; Institute for Theoretical Physics, University of Innsbruck: Innsbruck, Austria, 1984. [Google Scholar]
- Schrittwieser, R. (Ed.) Proceedings of the Fourth Symposium on Double Layers and Other Nonlinear Potential Structures in Plasmas, Innsbruck, Austria, 6–8 July, 1992; World Scientific: Singapore, 1993. [Google Scholar]
- Song, B.; D’Angelo, N.; Merlino, R.L. On anode spots, double layers and plasma contactors. J. Phys. D Appl. Phys. 1991, 24, 1789–1795. [Google Scholar] [CrossRef]
- Conde, L.; León, L. Multiple double layers in a glow discharge. Phys. Plasmas 1994, 1, 2441–2447. [Google Scholar] [CrossRef]
- Hassall, G.; Allen, J.E. Space charge layers in a double plasma machine. J. Phys. D Appl. Phys. 1997, 30, 381–399. [Google Scholar] [CrossRef]
- Baalrud, S.D.; Longmier, B.; Hershkowitz, N. Equilibrium states of anodic double layers. Plasma Sources Sci. Technol. 2009, 18, 035002. [Google Scholar] [CrossRef]
- Chen, F.F. Physical mechanism of current-free double layers. Phys. Plasmas 2006, 13, 034502. [Google Scholar] [CrossRef]
- Charles, C. A review of recent laboratory double layer experiments. Plasma Sources Sci. Technol. 2007, 16, R1–R25. [Google Scholar] [CrossRef]
- Sut, P.; Gogoi, P.; Borgohain, B.; Adhikary, N.C.; Bailung, H. Investigation of fireball assisted double layer produced in a DC discharge plasma. Phys. Lett. A 2024, 498, 129335. [Google Scholar] [CrossRef]
- Teodorescu-Soare, C.T.; Irimiciuc, S.A.; Ionita, C.; Dimitriu, D.G.; Hodoroaba, B.; O’Hara, T.; Vasilovici, O.; Amarandi, L.; Schrittwieser, R.W. Concentric double hollow grid cathode discharges. Int. J. Mass Spectrom. 2019, 436, 83–90. [Google Scholar] [CrossRef]
- Konrad-Soare, C.T.; Enescu, F.; Dimitriu, D.G.; Dobromir, M.; Teodorescu-Soare, E.G.; Mazzanti, F.; Irimiciuc, S.A.; Ionita, C.; Schrittwieser, R. Concentric double hollow grid cathode discharges. Spectral investigations and phenomenological approach. Plasma Sources Sci. Technol. 2021, 30, 085006. [Google Scholar] [CrossRef]
- Hardiment, T.; Bowden, M.D. Influence of cathode grid geometry upon mode structure of a transparent cathode discharge. Phys. Plasmas 2020, 27, 043506. [Google Scholar] [CrossRef]
- Bose, S.; Paul, M.K. Study of self-organized criticality in a coaxial plasma source with gridded cathode. Contrib. Plasma Phys. 2022, 62, e202100173. [Google Scholar] [CrossRef]
- Oertl, M.; Popa, G. Single and multiple reflection of ion-acoustic waves and solitons from a bipolar wall. Plasma Phys. Control. Fusion 1988, 30, 529–536. [Google Scholar] [CrossRef]
- Ignatescu, V.; Dimitriu, D.G.; Ionita, C.; Lozneanu, E.; Sanduloviciu, M.; Schrittwieser, R. The influence of the background plasma density on the dynamics of a fireball in a DP-machine. Rom. Rep. Phys. 2002, 54, 177–184. [Google Scholar]
- Agheorghiesei, C.; Chiorescu, C.; Popa, G.; Ionita, C.; Schrittwieser, R. Ion beam generation in a DP system. Rom. Rep. Phys. 2002, 54, 229–234. [Google Scholar]
- Teodorescu-Soare, C.T.; Dimitriu, D.G.; Ionita, C.; Schrittwieser, R.W. Experimental investigations of the nonlinear dynamics of a complex space-charge configuration inside and around a grid cathode with hole. Phys. Scr. 2016, 91, 034002. [Google Scholar] [CrossRef]
- Schrittwieser, R.; Ionita, C.; Teodorescu-Soare, C.T.; Vasilovici, O.; Gurlui, S.; Irimiciuc, S.A.; Dimitriu, D.G. Spectral and electrical diagnosis of complex space-charge structures excited by a spherical grid cathode with orifice. Phys. Scr. 2017, 92, 044001. [Google Scholar] [CrossRef]
- Irimiciuc, S.A.; Konrad-Soare, C.T.; Dimitriu, D.G.; Ionita, C.; Schrittwieser, R.W. On the interactions between three fireballs in low-temperature plasma. Plasma Sources Sci. Technol. 2022, 31, 084005. [Google Scholar] [CrossRef]
- Taylor, R.J.; MacKenzie, K.R.; Ikezi, H. A large double plasma device for plasma beam and wave studies. Rev. Sci. Instrum. 1972, 43, 1675–1678. [Google Scholar] [CrossRef]
- Niculescu, O.; Dimitriu, D.G. On the generation of stable complex oscillations in low temperature plasma. Rom. J. Phys. 2009, 54, 577–584. [Google Scholar]
- Enescu, F.; Cucu, R.G.; Dimitriu, D.G.; Ionita, C.; Schrittwieser, R.W. Space charge structures on gridded coaxial cylinders. In Proceedings of the XXXVth International Conference on Phenomena in Ionized Gases (ICPIG), Egmond aan Zee, The Netherlands, 9–14 July 2023. [Google Scholar]
- NIST Atomic Spectra Database (Version 5.12). Available online: https://www.nist.gov/pml/atomic-spectra-database (accessed on 28 April 2025).
Disclaimer/Publisher’s Note: The statements, opinions and data contained in all publications are solely those of the individual author(s) and contributor(s) and not of MDPI and/or the editor(s). MDPI and/or the editor(s) disclaim responsibility for any injury to people or property resulting from any ideas, methods, instructions or products referred to in the content. |
© 2025 by the authors. Licensee MDPI, Basel, Switzerland. This article is an open access article distributed under the terms and conditions of the Creative Commons Attribution (CC BY) license (https://creativecommons.org/licenses/by/4.0/).