Abstract
A large-scale validation exercise was conducted to assess the multi-mode model (MMM) anomalous transport model in the integrated modeling code TRANSP. The validation included 6 EAST discharges, 17 KSTAR discharges, 72 JET ITER-like wall D-D discharges, and 4 DIII-D fusion plasma discharges. Using the MMM, the study computed anomalous thermal, particle, impurity, and momentum transport within TRANSP. Simulations for EAST, KSTAR, and JET focused on electron and ion temperatures and safety factor profiles, while DIII-D simulations also considered electron density, toroidal rotation frequency, and flow shear. The predicted profiles were compared to experimental data at the diagnostic time, quantifying the comparison using root-mean-square (RMS) deviation and relative offsets. The study found an average RMS deviation of 9.3% for predicted electron temperature and 10.5% for ion temperature, falling within the experimental measurement error range 20%. The MMM model demonstrated computational efficiency and the ability to accurately reproduce a wide range of discharges, including various scenarios and plasma parameters, such as plasma density, gyroradius, collisionality, beta, safety factor and heating method variations.
Keywords:
EAST; KSTAR; JET; MMM; anomalous transport; fusion; simulation; magnetic confinement; tokamak 1. Introduction
The objective of fusion experiments is to confine a plasma at high enough densities and temperatures for a sufficient duration to make fusion power viable. However, the primary challenge is the short confinement time resulting from various plasma losses associated with energy, particle, and momentum transport through the confining magnetic field of tokamak plasmas. Transport pertains to the movement of heat, momentum, or particles across the plasma, and it is driven by various mechanisms. Neoclassical transport arises from charged particle collisions and drifts but not turbulence, whereas anomalous transport refers to transport beyond neoclassical transport. It is overwhelmingly established that turbulence drives the majority of transport in tokamaks. To model turbulence in tokamak plasmas, the particle distribution functions are typically tracked in five-dimensional phase space. However, gyrokinetic simulations are often limited to a few tens of microseconds of plasma time, requiring tens to hundreds of hours of computer simulation time before turbulence settles down to a quasi-steady state. Therefore, it is not feasible to calculate transport directly from gyrokinetic simulations throughout each step of an integrated modeling simulation lasting tens to hundreds of seconds, which is the typical duration of an advanced superconducting tokamak discharge. To overcome this limitation, fluid description physics-based transport models need to be developed that can predict anomalous transport driven by turbulence and can run for a tokamak discharge time. There is an ongoing effort to use this strategy to develop and refine transport models.
The physics-based multi-mode model (MMM) [1,2] is a multi-species multi-fluid multi-mode anomalous transport model. MMM is used in integrated modeling code TRANSP [3] to carry out predictive time-dependent transport simulations in order to compute the temperature, density, current density, and rotation profiles for comparison against measurements from existing experiments. Simulations are also used to supplement missing experimental information, such as ion temperature, for the EAST discharges considered.
Theoretical models for neoclassical and anomalous transport, heating and current drive, and sources and sinks that encapsulate our knowledge of fusion plasmas are tested and validated through integrated modeling. Comparisons with time-dependent experimental data of tens of seconds of discharge duration are used to validate transport models, such as MMM, demonstrating the power of modern computer simulations. It is critical to validate the model using a broader range of experimental data, including different sorts of discharges and tokamaks. In this study, MMM is validated against six EAST discharges, seventeen KSTAR discharges, seventy-two JET ITER-like wall D-D discharges, and four DIII-D discharges. Ohmic, L-mode, and hybrid discharges; high- poloidal (); high- normalized (); internal transport barrier (ITB) long-pulse scenarios; low, intermediate, and high gyroradii; collisionality and density plasmas; plasmas with independent and simultaneous lower hybrid (LH) heating; and plasmas with a combination of neutral beam injection (NBI) and LH heating are all represented. A comparison of plasma profiles from time-dependent integrated modeling simulation and corresponding experimental data, along with root-mean-square (RMS) deviation and offsets, will be shown to validate the computational models and demonstrate the strength of modern computer simulations. The goal of these studies is to demonstrate that the high mode number magnetohydrodynamic (MHD) and electron- and ion-scale drift instabilities and associated energy, particle, and momentum transport in MMM can be used to predict plasma profiles in existing high aspect ratio fusion devices, such as EAST, KSTAR, JET, and DIII-D.
This paper’s structure is as follows. Section 2 provides a concise description of physics basis of the components of multi-mode anomalous transport module that is primarily based on fluid description. TRANSP code is briefly described in Section 3. Section 4 describes the data and simulation results of the EAST, KSTAR, JET, and DIII D tokamaks. Section 5 is dedicated to the summary and discussion of the results.
2. Multi-Mode Anomalous Transport Module
To simulate anomalous transport generated by turbulence on a discharge time scale, an anomalous transport model must be developed. The model for anomalous transport must be physics based and not include arbitrarily adjustable coefficients. The MMM anomalous transport module has four components. The Weiland drift model has modes for the ion temperature gradient (ITG), trapped electrons, peeling, kinetic ballooning, and ideal and collisional high mode number MHD [4]; the ETG model has modes for the electron temperature gradient [5]; the MTM model has microtearing modes [6,7,8]; and the DRIBM model has drift-resistive inertial ballooning modes [9]. MMM includes four species: main ions, impurity, electrons, and fast ions. The contribution of fast ions is only represented by dilution effects, whereas the other species include perturbation effects. These simulations employ the Horton model to capture ETG mode turbulence, complemented by an ETG transport threshold [5]. The ETG transport threshold is further refined through the utilization of the Jenko model threshold, derived from toroidal gyrokinetic ETG turbulence simulations [10]. The ETG model incorporated in these simulations encompasses both electromagnetic and electrostatic contributions [1].
Given a small toroidal rotation near the plasma’s edge, the Weiland model has been demonstrated to be able to predict the observed intrinsic angular rotation of the plasma [11]. The drift model calculates finite effects and transport suppression at low magnetic shear precisely. The Weiland model is constructed from kinetic theory [12]. The nonlinear Dimits upshift, particle and heat pinches, and poloidal spin up may all be simulated using this model. Another notable feature of the model is that it accurately replicates the experimental power scaling of the energy confinement time [12]. It is worth noting that the Weiland model (the primary component of MMM) is treated as an exact theory rather than an approximation theory [4,12,13,14]. It is an exact theory because drift wave frequencies are only about 1% of the frequencies related to fast particles and heating. Thus, these high-frequency phenomena are averaged out. In this situation, resonance broadening will cancel wave–particle resonances [15], showing that we have a reactive fluid closure. Then what remains is the fluid transport of moments with sources in the experiment. Resonance broadening is a kinetic nonlinearity. In kinetic theory, nonlinearities are often important. Then, a reactive fluid closure emerges. In fluid theory, nonlinear terms are typically only about 1% of the linear terms. Thus, here, nonlinearities can usually be ignored, except for quasilinear transport, as found also in Ref. [16]. Thus, we can use quasilinear theory for fluid dynamics.
Several DIII-D, ohmic, L-mode, and H-mode discharges, JET L-mode discharges, and TFTR L-mode discharges were utilized to compare the simulation results with and without the DRIBM component of the MMM module [17]. The comparisons between model and measurements include temperature profiles from the magnetic axis to the plasma edge. When the DRIBM model is introduced to the MMM transport module, the model and experimental data agree well. Understanding the lack of L-mode transport near the boundary of tokamak plasmas is made much easier by the development of the DRIBM model. Multi-scale simulations have been shown to resolve the L-mode transport shortfall in the edge region [18]. MMM does not include any multi-scale interaction physics; hence, it cannot reliably predict plasma profiles for discharges where multi-scale interaction physics is relevant. It has recently been demonstrated that the dependence of the newly developed MTM model’s [6] real frequency, growth rate on NSTX plasma parameters and MTM’s saturated magnetic fluctuation strength, and corresponding electron thermal diffusivity can reproduce the trends predicted by the gyrokinetic simulations [8].
The transport process in tokamaks occurs in physical space, where the scale length of turbulence is determined by the correlation length. Through numerical exploration, it has been found that in drift wave turbulence, this correlation length exhibits an inverse relationship with the normalized mode number of the most rapidly growing mode relative to the drift frequency. Notably, in instances of transport, the spatial variability of the drift plays a crucial role. The fastest-growing mode, normalized by drift frequency peaks at the inverse gyroradius, was previously observed in mode coupling simulations and was analytically motivated [19]. The procedure used to compute the correlation length in MMM begins with the linear eigenfunction documented in Ref. [20]. By analyzing the structure of the eigenfunction, it becomes evident that, when the magnetic shear is small [21], a large is required to maintain a robust instability drive. Consequently, it is anticipated that a shortened correlation length will be observed when magnetic shear is less. Nevertheless, decreases toward the edge because magnetic shear typically increases toward the edge. Near the edge, MHD modes, such as peeling modes and kinetic ballooning modes, typically exhibit smaller values. It is known that these modes become active during the L–H transition. The changes in shear and magnetic values are monitored as a function of radius in our code. Additionally, the effects of elongation and triangularity are incorporated in the current version of MMM.
The MMM authors employ the approach of integrating the physics-based models and continuously comparing the resulting simulations with experimental data to produce a succession of improved models. In addition, we intend to use the same MMM for validation studies involving different types of discharges for different tokamaks without modifying the model’s components. MMM can be used to compute anomalous electron and ion thermal, electron particle, impurity, toroidal and poloidal momentum transport. However, it does not provide ion particle transport currently. Therefore, quasi-neutrality is enforced when calculating the ion density profile.
MMM is implemented as a component of large, full-featured, integrated predictive modeling codes TRANSP [3] to compute the temperature, density, current, momentum, and other profiles that are measured in existing experiments, and it then can be used to extrapolate to future planned devices. Earlier, ITER modeling was carried out using MMM for steady state [22], baseline H-mode [23], and hybrid scenarios [24]. The EPED1 model [25] is used to compute the baseline value of the H-mode pedestal height, and the pedestal width is assumed to be 5% of the normalized plasma radius. Nevertheless, self-consistent core-pedestal ITER scenario modeling was recently conducted to identify dependencies that could potentially impact ITER performance [26]. It is worth noting that these self-consistent ITER simulations were performed across the entire radial profile using the same model and gridsize, and the quasilinear model employed in the simulations is within of the accuracy of a fully nonlinear approach [26]. is the ratio of wave frequency to cyclotron frequency as well as the ratio of potential to thermal energies. The simulations commence by incorporating specified sources and assuming an L-mode profile, subsequently progressing towards the temperature and density characteristic of the L–H transition and pedestal. In these simulations, no assumptions are made concerning the presence of an L–H transition or the placement of temperature and density barriers [26]. Nevertheless, the L–H transitions consume simulation time, and their duration would be further prolonged in a kinetic simulation.
The fluid technique underlying the derivation of MMM is anticipated to be able to adequately predict the evolution of plasma profiles in discharges for a variety of plasma conditions on an energy-transport time scale [17]. In addition to the drift modes, the presence of only high mode number (MHD) modes, where ballooning mode formalism is applicable, characterizes MMM, whereas low MHD mode numbers are missing. Additionally, MMM does not currently take into account fast particle-induced transport and multi-scale interaction physics. As a consequence, tokamak discharges with low mode number MHD activity, significant fast particle transport, and multi-scale interaction physics may not have their plasma profiles accurately predicted by MMM. The fast particle model is being developed and will be included in the MMM for future simulations [14]. The newly developed ETG model [27], which includes more physics than the current version of the ETG model [5] in MMM, is under testing phase and will be part of MMM after rigorous verification and validation against spherical and conventional tokamak discharges.
The integrated modeling simulation’s goal is to develop reliable, validated, and self-consistent predictions of the evolution of plasma profiles from the magnetic axis to the plasma edge. Reliable scenario modeling from discharge startup to shutdown necessitates a robust interaction between various physical phenomena and different regions of the plasma. This cannot be addressed by concentrating on a single or few physical processes or a single part of the plasma. It is required to bridge the gap between the microsecond time scale of basic physics events and the second or minute time scale of the plasma discharge duration. The section that follows provides an overview of the integrated modeling code TRANSP that was used in this study.
3. TRANSP
TRANSP is a suite of numerical codes for the interpretative and predictive simulation of tokamak discharges [3]. In interpretative or analysis mode, it takes various experimental data (electron density, electron temperature, ion temperature, total plasma current, loop voltage, confinement time, radiation power, etc.) as inputs or constraints to solve equations of magnetic field diffusion, particle balance, energy balance, and momentum balance. In predictive mode, the user specifies the thermal, particle, and momentum diffusivity models to use, as well as the boundary conditions for the magnetic equilibrium. All the heating, momentum, and particle source routines are identical for the analysis and predictive modes of operation. Both MMM and the Chang–Hinton or NCLASS neoclassical module [28,29] are used to compute the transport of heat and particles and momentum, which are used to predict temperatures, densities, and rotation profiles. However, MMM does not provide ion particle transport currently. Therefore, TRANSP enforces quasi-neutrality when calculating the ion density profile. The TRANSP code includes a wide variety of models for sources, sinks, transport, equilibrium, macroscopic instabilities, and boundary conditions. Sources of heat, particles, momentum, and current drive associated with neutral beam injection are described using the NUBEAM module [30]. For lower hybrid deposition of power and current drive, GENRAY [31] and CQL3D [32] modules are used. For electron cyclotron resonance frequency heating and current drive, the TORAY module [33] is used. There are many ways to figure out the equilibrium of plasma, but the TEQ [34] and equilibrium fitting (EFIT) [35] modules are used in this study. The toroidal equilibrium code TEQ [34] is used to compute the self-consistent evolution of the equilibrium. The TEQ code utilizes a self-consistent approach to solve for the equilibrium state of the plasma, taking into account various factors, such as the plasma current, magnetic field, and pressure profiles. It considers constraints such as the Grad–Shafranov equation, which describes the balance between magnetic forces and plasma pressure. By solving the Grad–Shafranov equation and incorporating numerical models and/or experimental data and constraints, the TEQ code determines the equilibrium profiles of quantities such as the magnetic field, temperature, and current density. The magnetic diffusion equation is used to evolve the q profile (and, by extension, the current profile and poloidal field). It is unnecessary to provide time-dependent q profile data in this case. This equation enables TRANSP to advance in time the q profile as a function of the toroidal flux using the current equilibrium. This is then used in conjunction with the pressure to determine the new equilibrium.
4. Simulation Results
The data and predictive results for EAST, KSTAR, JET, and DIII-D are described in Section 4.1, Section 4.2, Section 4.3 and Section 4.4 below. In prior studies, the TGLF model was utilized to simulate JET discharges [36]. In the current research, simulations are conducted using the MMM model by leveraging available TRANSP data for the same JET discharges. The Lehigh group took part directly or indirectly in conducting experiments for the East and KSTAR discharges examined in the manuscript, while DIII-D discharges are considered at random. The boundary condition for MMM predictive simulations for L-mode discharges is set to , while for H-mode discharges, it is set to , where is the square root of the normalized toroidal flux, 0 at the magnetic axis and 1 at the last closed flux surface. There were no MMM-related convergence challenges in the runs examined in this study. At the diagnostic time, the prediction results are compared to the corresponding experimental profiles. The simulated profiles (), are compared to the experimentally measured profiles (), by calculating the RMS and the relative offset between the calculated profile and the experimental data. The RMS and offset are computed as follows [37]:
The electron temperature, ion temperature, electron density, -profile, or toroidal rotation profile are represented by the variable Y in the formula. The offset measures the degree to which the simulated profile over- or under-predicts the experimental data. The calculation of RMS deviation and offset serves as a quantitative means to assess the agreement between predicted and experimental data, evaluate model accuracy, and guide model improvement. These metrics provide valuable insights into understanding the performance and limitations of the model.
4.1. EAST
Among the discharges simulated are experimental data from 6 EAST discharges with ohmic and L-mode plasmas: plasmas with low, intermediate, and high density; plasmas with independent and simultaneous LH heating; and plasmas with a combination of NBI and LH heating [38,39,40]. Table 1 lists the primary parameters of the EAST discharges. High-density discharge (85126), low-density discharge (85610), and intermediate-density discharge (80208) simulated profiles are provided. The TRANSP code or the EFIT code [35] are used to process the data. The table includes some of the significant experimental parameters for the six EAST discharges: the major radius R (m); minor radius a (m); elongation ; triangularity ; vacuum toroidal magnetic field (T); toroidal plasma current (MA); line-averaged electron density in units of m−3; average ; lower hybrid power (MW), and neutral beam injection (NBI) power (MW). The final item in the table is the diagnostic time (s), at which the simulated profiles are compared to the experimentally measured TRANSP or EFIT processed profiles. MMM is used to predict the time-evolved electron temperature, ion temperature, flow shear, and current density profiles. The toroidal equilibrium code TEQ [34] is used to compute the self-consistent evolution of the equilibrium. The Chang–Hinton model [28] is used to compute neoclassical transport. The LH and NBI heating and current drive are obtained using the GENRAY/CQL3D [41] and NUBEAM modules [30], respectively.

Table 1.
Plasma parameters for the EAST tokamak.
Total plasma current and current components, as well as the radial and time dependence of ion and electron power deposition, are computed. It is shown that different heating and current density components are driven in different plasma regions. The contributions of LH, NBI, ohmic and other sources to the total current are quantified.
Figure 1 shows the LH and ohmic predicted current as a function of radial label and time for high-density (85126) and low-density (85610) EAST discharges. The high- and low-density cases have roughly line-averaged densities of 3.05 and , respectively. The density profile is experimentally measured via a combination of Thomson scattering (TS) [42,43] and the reflectometer [44,45]. The density profiles are first measured by a reflectometer at 2 s, and then by TS at around 2.5 s. Although the reflectometer has a reasonable time resolution, it is constrained in terms of the maximum density it can measure. In the case of low density, reflectometry data are only used to determine density up to . At higher densities, the reflectometer measures density data for , which can be supplemented with core TS measurements. EAST is a one-of-a-kind device with two LH antennas operating at 2.45 GHz and 4.6 GHz. Both antennas can be utilized simultaneously or independently; however, in the discharges shown in Figure 1, LH is injected simultaneously. The total input heating power of around 1.0 MW is injected. The LH and ohmic currents are driven primarily near the center of the plasma, particularly in the high-density discharge. More LH current is obtained in the low-density discharge as compared to the high-density discharge. The reduced LH current in the high-density discharge must be made up for by increasing the ohmic current in order to reach the total current. The smaller volume within the flux surfaces near the plasma center reduces the apparent effect of LH and ohmic current localization. Electron cyclotron emission (ECE) [46] and TS are used to infer the electron temperature. When LH is on, the electron temperature profiles calculated by the ECE almost always have a tail that curves up outside of , even though the core electron temperature between the two diagnostics is comparable. Generally, that part of the ECE data is neglected, and the profile relies on TS measurements instead. The is inferred via magnetic measurements and polarimeter/interferometer (POINT) constrained equilibrium reconstruction [47,48,49,50]. The POINT system measures the line-integrated electron density and Faraday rotation angle, providing magnetic field information within the plasma [50]. By incorporating these data into the equilibrium constraints, the fitting results using POINT system exhibit noticeable deviations from the initial equilibrium. These deviations gradually increase from the plasma boundary towards the core. This POINT system effectively addresses disparities between the EFIT results and external magnetic measurements, resulting in significant improvements in the q profile, particularly in the core plasma.
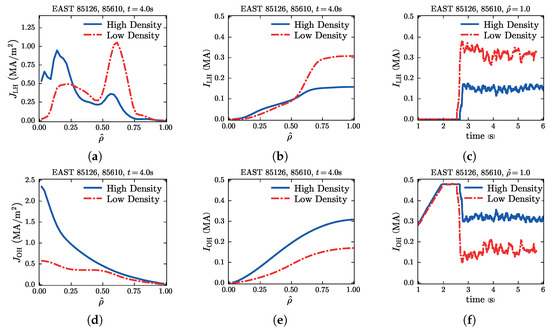
Figure 1.
The current components for high-density (85126) and low-density (85610) EAST discharges are calculated. (a) LH current density (), (b) LH current within a plasma radius as a function of radius at time s, (c) LH current as function of time (d) ohmic current density, (e) ohmic current within a plasma radius as function of radius at time s, and (f) ohmic current as function of time are shown.
Simulations of EAST tokamak discharges are carried out to show how various components of heating, transport, and current drive models influence the evolution of the tokamak discharges and to fill in missing experimental data that are not measured. Predicted electron temperature and profiles are compared to EAST experimental data at the diagnostic time in the radial range from the magnetic axis to the flux surface.
The predicted and experimental electron temperatures, predicted ion temperatures, and predicted, interpretive (analysis), and experimental profiles, as well as electron and ion thermal diffusivities, are depicted in Figure 2 for the high-density EAST discharge 85126. The electron temperature and -profile are compared with experimental data. TRANSP predicts the profile using the magnetic diffusion equation based on the predicted electron temperature, whereas in analysis mode, the experimental electron temperature is used. The predicted and measured profiles show good agreement. While the predicted profile’s RMS deviation from the experimental profile is 8.4% and the offset is −0.7%, the predicted electron temperature profile’s RMS deviation from the experimental profile is 6.9%, and the offset is 2.2%. The ion temperature has not been experimentally measured, so it cannot be compared to what is predicted. It should be noted that the electron thermal diffusivity () is discovered to be higher than the ion thermal diffusivity () and is increasing towards the edge.
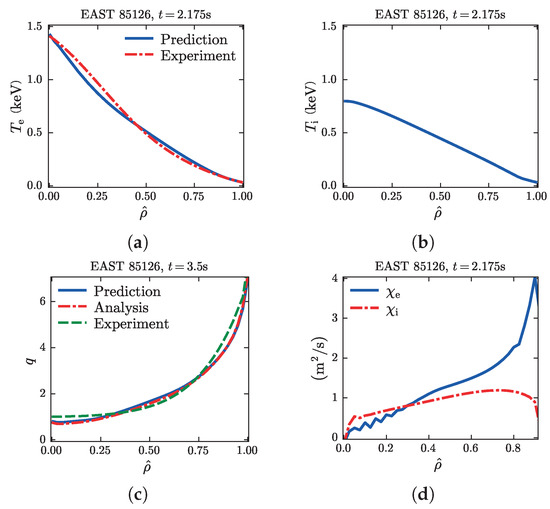
Figure 2.
(a) Predicted and experimental electron temperature, (b) predicted ion temperature, (c) predicted, analysis, and experimental POINT constrained profiles, (d) electron and ion thermal diffusivities from the MMM module for the high-density EAST discharge 85126. The measured ion temperature is unavailable, so only the predicted ion temperature is shown.
In Figure 3, the predicted and experimental profiles for low-density discharge 85610 are displayed. Good agreement is also discovered for low-density discharge, much as for the results for high-density discharge. The RMS deviation of the predicted electron temperature profile from the experimental profile is 8.8%, whilst the predicted profile’s RMS deviation from the experimental profile is 11.3% and the offset is −3.5%. The electron temperature is a little lower in the low-density discharge because it has a higher electron thermal diffusivity than the high-density discharge 85126. Ion energy transfer in ohmically heated tokamaks is typically only a fraction of neoclassical transport, whereas electron thermal transport predominates. ETG modes, also known as electron temperature gradient-driven lower hybrid drift modes [51], are responsible for the majority of electron thermal transport.
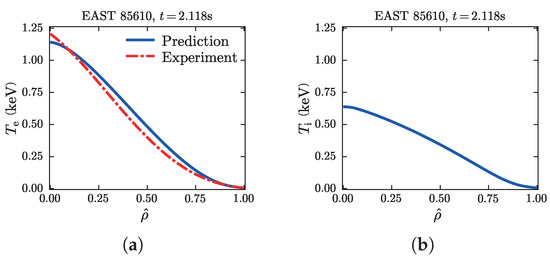
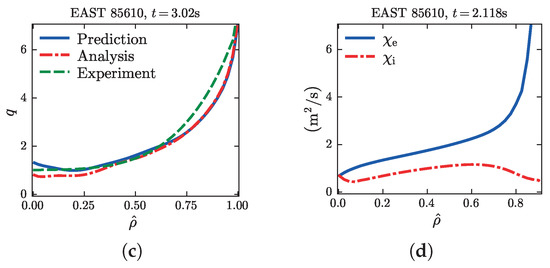
Figure 3.
(a) Predicted and experimental electron temperature, (b) predicted ion temperature, (c) predicted, analysis, and experimental POINT-constrained profiles, (d) electron and ion thermal
diffusivities from the MMM module for the low-density EAST discharge 85610. The measured ion
temperature is unavailable, so only the predicted ion temperature is shown.
In summary, a validation study was carried out with the MMM transport module in TRANSP for 6 EAST discharges: ohmic and L-mode plasmas; plasmas with low-, intermediate-, and high-density plasmas with independent and simultaneous LH heating; and plasmas with a combination of NBI and LH heating are among the discharges simulated. Predicted electron temperature and -profiles were compared to EAST experimental data at the diagnostic time in the radial range from the magnetic axis to the flux surface. There is no experimental measurement of ion temperature to compare with the predicted ion temperature. The RMS deviation and offset for each discharge studied are shown in Table 2. The statistics for discharge number 80208 are not displayed since the experimental data are not smooth. The average standard deviation for the profile is 11% with a range of 6.9% to 14.0%, and the average offset is −3.0% with a range of −8.6% to 6.4%; the average standard deviation for the -profile is 10% with a range of 6.6% to 15.9%, and the average offset is −4.8% with a range of −0.7% to 12.6%. The electron thermal transport () is found to be larger than the ion thermal transport in all of the discharges studied. is found to be larger in low-density discharges than in high-density discharges. The dominant instability in the drift model giving electron transport is, for high-density discharges, the collision-dominated trapped electron mode. The growth rate of this mode is inversely proportional to the collision frequency and thus the density. This leads to neo-Alcator scaling, where the confinement time is proportional to the density. Due to LH heating and current drive computation, simulations are computationally intensive and take about h for s. MMM and other modules used in the TRANSP take only h out of h with 1 CPU for the solver using MMM and 32 CPUs for GENRAY/CQL3D.

Table 2.
and RMS Deviation % and Offset % for low- and high-density EAST discharges.
4.2. KSTAR
Simulations of 17 KSTAR NBI and ECH heated discharges were carried out. The major discharge parameters are presented in Table 3. Discharges represent an internal transport barrier, high normalized (), high , high poloidal (), and moderate toroidal and long-pulse scenarios. The discharges include 5 ITB discharges [52,53]; 4 high normalized discharges [54]— and thermal , ; 6 high discharges [55]; 1 high discharge [56,57]; and 1 moderate discharges [58]— and thermal , . Simulations of plasma discharges utilize experimental boundary and experimental initial conditions. The boundary conditions for simulations are set at . Simulation and experimental electron and ion temperature profiles of the 17 KSTAR discharges are compared in the radial range: . The data in the deep center are not measured and therefore are excluded from the comparison.

Table 3.
Plasma parameters for the KSTAR tokamak.
The total normalized (), and thermal normalized () as a function of time are plotted in Figure 4 for high KSTAR discharges (16295, 16296 and 16297). and are found. In the discharges, the maximum available NBI power (4.5 MW) is utilized, and improved plasma control considerably increases the pulse duration. The onset of the 2/1 tearing mode in the high discharge is discovered to occur, resulting in a 35% reduction in and stored energy. Because MMM does not include low-n MHD modes, the discharges are only predicted in the tearing-mode-free duration. The predicted electron and ion temperatures and corresponding experimental temperatures of these three high- discharges are shown as a function of time for in Figure 5. The experimental temperatures change over time and the predicted temperatures fairly capture that change over time for these high- KSTAR discharges.

Figure 4.
(a–c) Total normalized (), and thermal normalized () as a function of time are plotted for high- KSTAR discharges (16295, 16296 and 16297).
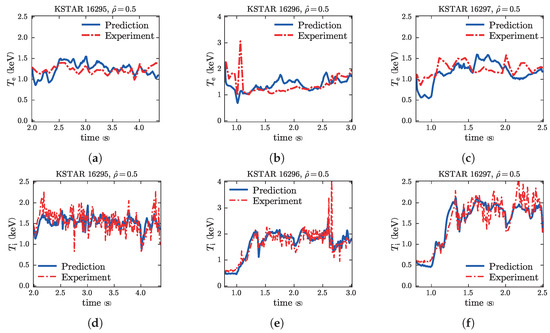
Figure 5.
Electron temperature and ion temperature for high- KSTAR discharge (a,d) 16295, (b,e) 16296, and (c,f) 16297, based on predictions and measurements as a function of time for .
The experimental data of the moderate ( and ) discharge 16901 are compared with the simulated electron and ion temperature as a function of position and time in Figure 6. The computed thermal diffusivities of electrons and ions from MMM and their total values, which include neoclassical transport, are also displayed. Neoclassical transport is significant in the center for ion transport and negligible for electron neoclassical transport. It is the result of increased ion–ion collisions. In addition, the radial drift of ions from banana orbits facilitates neoclassical thermal transport. The lower gyroradius of lighter electrons confines their motion, reducing radial transport. In turn, we may state that the MMM-calculated electron thermal transport is the only basis for the prediction of the electron temperature profile because electron neoclassical transport is negligible.
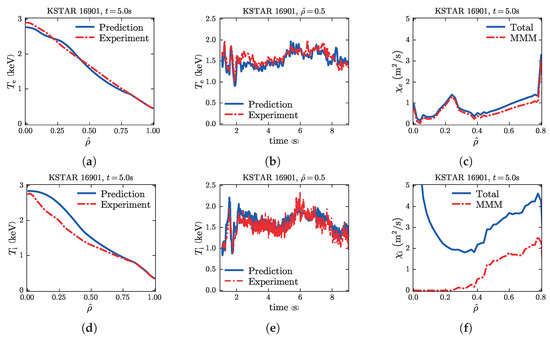
Figure 6.
Predicted and measured electron and ion temperatures as a function of position (a,d) and time (b,e) as well as (c) and (f) versus for KSTAR discharge 16901 with and .
The predicted and measured temperature profiles for high discharge 18402 are compared in Figure 7. At the end of the discharge time s and as a function of time for , the profiles are compared. Both the electron and ion thermal anomalous diffusivities are found to be comparable for this discharge, except in the center, where ion neoclassical transport is larger than the electron thermal transport. In high discharges, the magnetic shear is typically weaker compared to low discharges. Weaker magnetic shear can lead to a reduction in the suppression of ion-scale instabilities, such as ITG modes, which can enhance ion thermal transport. This reduced suppression allows ions to experience increased radial transport, making their thermal transport comparable to that of electrons.
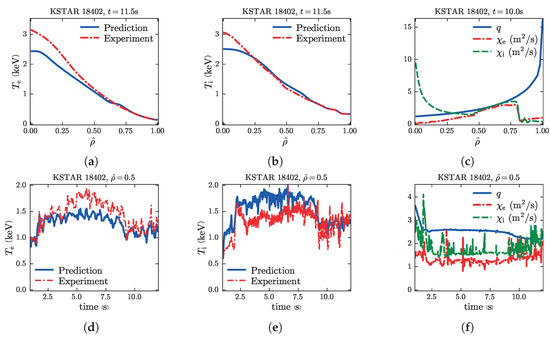
Figure 7.
Predicted and measured electron temperature, ion temperature, as well as , , and versus (a–c) at time s and (d–f) versus time for for high KSTAR discharge 18402.
Predicted electron temperature, ion temperature, and toroidal rotation profiles are shown in Figure 8a–c for KSTAR ITB discharge 18476. The simulated and experimental temperature profiles are compared at the end of the s discharge time simulations. The ion temperature’s weak ITB is recovered in the predicted ion temperature around . The ITB in ion temperature is found due to the sharp gradient in the predicted toroidal rotation profile around . The measured toroidal rotation is not available and therefore is not shown for comparison purposes. Moreover, weak magnetic shear in the center region due to the monotonically increasing q profile shape is also found to be stabilizing. The drift wave instability arises from the interaction between the plasma density gradient and the curvature of the magnetic field lines. When the magnetic shear is weak, it means that the magnetic field lines have a relatively uniform and straight configuration. In this case, the drift waves experience weaker curvature effects, reducing the destabilizing influence of the plasma density gradient. Moreover, when the q decreases at the center, it means an increase in current density, which consequently widens the mode width. This effect reduces drift wave transport due to the mode’s sensitivity to the average curvature. As a result, we anticipate a more advantageous scaling of the current.
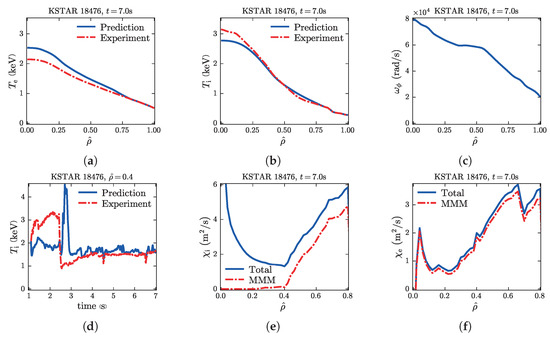
Figure 8.
Predicted and experimental (a) electron temperature profile, (b) ion temperature profiles versus at time s, (c) predicted toroidal rotation profile, (d) ion temperature profiles versus time at , (e) total ion thermal and ion anomalous thermal diffusivities, and (f) total electron and ion anomalous thermal diffusivities. The difference between total and anomalous thermal diffusivities is the neoclassical thermal diffusivity.
The simulated and experimental ion temperatures as a function of time for , which is the ITB location, are also plotted in Figure 8d. The MMM prediction misses exhibiting an experimental trend in the early phase of the discharge, especially around t = 3.0 s, where beam heating is decreased, while it catches an experimental trend later on (see Figure 8d). MMM calculates a lower ion thermal diffusivity when NBI heating is lowered, leading to a higher ion temperature than the experimental temperature. The total and anomalous thermal electron and ion diffusivities are plotted in Figure 8e. The difference between the anomalous and total diffusivities is neoclassical transport, which is almost negligible for the electron case. However, ion neoclassical transport is found to be dominant in the center of the plasmas, while ion drift mode transport is suppressed by flow shear stabilization and small q and weak magnetic shear as explained above.
The predicted temperature profiles are compared with the corresponding experimental profiles as a function of space and time for high- KSTAR discharge 18602 in Figure 9. By adjusting the aiming of ECCD injection location, toroidal Alfvén eignmodes are mitigated, leading to increased stored energy and high . When these profiles are analyzed as a function of space and time, there is a remarkable degree of consistency between the predicted and experimental profiles (see Table 4).
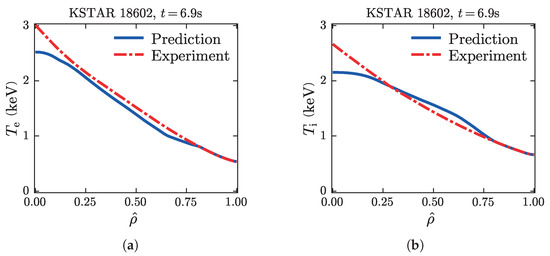
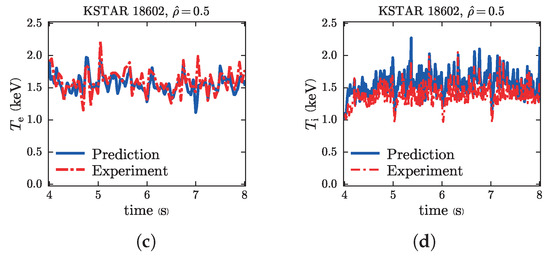
Figure 9.
Predicted and measured electron temperature and ion temperature for KSTAR high-βp
discharge 18602 as a function of (a,b) and time (c,d) are shown.

Table 4.
and average RMS deviation %, RMS range %, average offset %, and offset range % for five ITB discharges, four high normalized discharges, six high discharges, one high discharge, and one moderate KSTAR discharge.
The RMS deviations and offsets vary from discharge to discharge. The RMS deviations, RMS deviations range, offsets, and offset range are shown for 5 ITB discharges, 4 high discharges, 6 high discharges, a high , and a moderate discharge as shown in Table 4. It is discovered that the RMS deviation falls within the margin of error associated with the experimental measurement. The average RMS deviations for electron and ion temperature profiles for 17 KSTAR discharges are 7.4% for electron temperature and 13.0% for ion temperature, and the average offsets of −1.8% for electron temperature and 9.4% for ion temperature.
In summary, a comparison between simulated electron and ion temperature profiles and corresponding KSTAR experimental data is shown. The experimental data for 17 NBI and ECH heated KSTAR tokamak discharges represent a ITB, high , moderate , high and high long-pulse scenarios. Validation is carried out using TRANSP–MMM simulations. Thermal transport is calculated using a combination of MMM and Chang–Hinton neoclassical transport models [28]. Note that these discharges are difficult to predict, correspond to extreme conditions, and differ significantly from conventional discharges. The comparison is quantified by calculating the RMS deviations and offsets in Table 4. Reasonable agreement is found between experimental data and simulation results, and ITBs are recovered. The MMM model is found to be quite efficient in terms of computational resource use. The s KSTAR discharge simulations at PPPL cluster take h with 1 CPU for MMM and 8 CPUs for NBI. The majority of the h are spent simulating the NBI heating, current drive, and torque.
4.3. JET
Simulations of 72 baseline JET ITER-like wall D-D discharges are carried out using the TRANSP integrated modeling code. Discharges involve a broad range of conditions, including scans over gyroradius, collisionality, and values of . There are 42 discharges with low discharges [59], which range from = 2.7–3.3. Other plasma parameter ranges for low discharges include plasma current, = (2–3.5) MA; toroidal magnetic field, = (1.9–3.2) T; auxiliary heating power, = (10.8–27.7) MW; central electron temperature, = (2.2–6) keV; normalized , = (1–2); and line-averaged density = (4–10.2) . There are 7 discharges from with a range between 0.04 and 0.15 at , and 13 discharges from the scan with a range of 0.003 to 0.006 [60]. Eight discharges with the following plasma properties are obtained from the database for comparative confinement study [61]: MA; T; = (14–17) MW; and = (7.1–10.2) . Also included are two D-D discharges (87215 and 87412) that are used for D-T scenario development before the real D-T experiment campaign at JET. Diagnostic yielding profile data used in validating the transport models include: high-resolution Thomson scattering (HRTS) [62] for and ; charge exchange (CX) spectroscopy [63] for and rotation; bolometry (BOLO) measurement for the uniform radiation profile [64]; the Bremsstrahlung measurement for the uniform Z-effective [65] profile assuming that beryllium is the only impurity.
The predicted and measured JET discharge results are displayed below. Note that the experimental electron temperature data from and experimental ion temperature data from are not available to compare with the corresponding predicted profiles. Despite the fact that all 79 discharges are simulated, the results are illustrated using only one example of each type of discharge. The important parameters of these discharges are provided in Table 5.

Table 5.
Plasma parameters for the JET tokamak.
The experimental measurement of HRTS at specifies the electron temperature boundary condition, whereas the ion temperature boundary is supposed to have . The neoclassical transport is calculated using the NCLASS module [29]. NBI heating, current, and toroidal rotation are calculated using NUBEAM [30], and ICRH is calculated using the TORIC module [66].
Figure 10, Figure 11, Figure 12 and Figure 13 show the predicted and measured electron and ion temperatures as a function of for JET discharge 84599, low discharge 86911, discharge 87261 and discharge 87215. The predicted profiles are compared with the experimental profiles at the diagnostic time. The RMS deviation and offset for electron and ion temperature profiles of 70 baseline H-mode JET ITER-like wall D-D discharges are found to be and , respectively. The details of RMS deviation, range of RMS deviation, offset, and range of offset for seventy discharges are shown in Table 6. The RMS deviation and offset for two D-D discharges 87215 and 87412 are not estimated due to the lack of smoothness in the data. Nonetheless, we discover a strong agreement between the predicted and experimental data for these discharges.
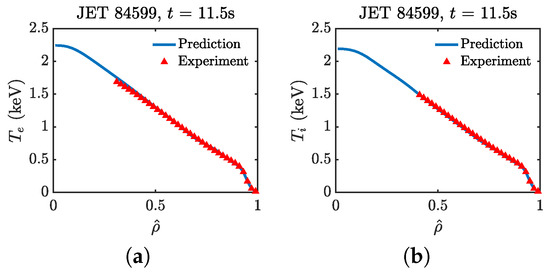
Figure 10.
Predicted and measured electron (a) and ion (b) temperatures as a function of for JET discharge 84599 at time s. It should be noted that there is an absence of experimental data to compare with the predicted profiles of electron temperatures from = 0–0.3 and ion temperatures from = 0–0.4.
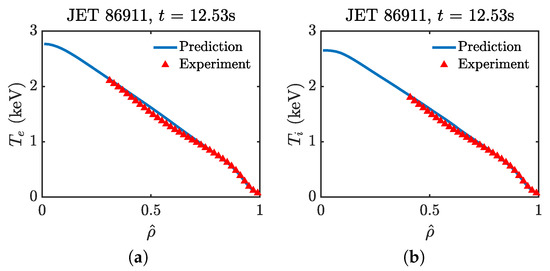
Figure 11.
Predicted and measured electron (a) and ion (b) temperatures as a function of for JET low discharge 86911 at time s.
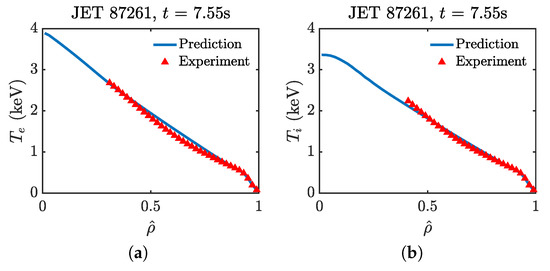
Figure 12.
Predicted and measured electron (a) and ion (b) temperatures as a function of for JET discharge 87261 at time s.
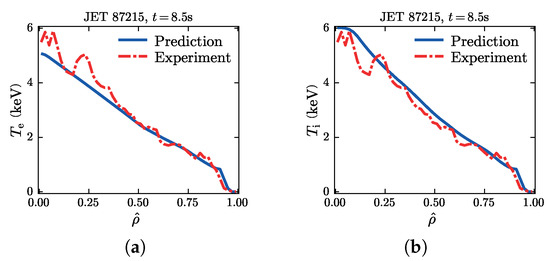
Figure 13.
Predicted and measured electron (a) temperature as a function of for JET discharge 87215 at time s. The ion temperature (b) is considered to be the same as the electron-measured temperature for this discharge.

Table 6.
and average RMS deviation %, RMS range %, average offset %, and offset range % for forty two low , seven , thirteen , and eight comparative confinement study JET discharges.
The TGLF anomalous transport module [67] is also used to predict these 72 D-D JET discharges [36]. In JET plasmas, it is generally observed that ion thermal transport plays a dominant role compared to electron thermal transport. The ITG modes tend to be more unstable than the TEM and ETG modes. This trend holds true for both the computed thermal diffusivities obtained from the MMM and the TGLF models. The analysis of thermal diffusivities reveals that the ion thermal diffusivity exhibits a notably similar trend and magnitude between the MMM and TGLF models. On the other hand, the electron thermal diffusivity shows a slightly different magnitude in the TGLF compared to the MMM. Since ion thermal transport dominates, the prediction of the electron temperature profile is unaffected by small changes in the electron thermal transport. The average RMS deviation for electron and ion temperature profiles predicted by the MMM model is comparable to what the TGLF model predicts. It is anticipated that the MMM and TGLF models will produce different results in discharges where electron thermal transport dominates, such as in the low aspect ratio and high beta tokamaks.
The TGLF and Qualikiz models were utilized in another similar validation investigation [68]. An important issue associated with the use of physics-based models in whole device modeling simulations is the computational efficiency of the models. A significant difference between the TGLF and the MMM models is their computational efficiency. Simulations using the TGLF module and the PPPL cluster for a 1.5 s JET discharge with 256 CPUs (192 CPUs for PT-Solver, 32 CPU NBI, 32 CPU TORIC) take 193 h, while for MMM 65 CPUs (1 CPU for PT-Solver, 32 CPU NBI, 32 CPU TORIC) take only 0.84 h. The 72 JET H-mode simulations using TGLF require 3.55 million CPU hours compared to the 3965 CPU hours used in the MMM simulations.
In summary, simulations of 72 baseline H-mode JET ITER-like wall D-D discharges are carried out using the TRANSP predictive integrated modeling code. The time-evolved temperature and rotation profiles are computed utilizing the MMM and TGLF modules. The JET discharges involve a broad range of conditions, including scans over gyroradius, collisionality, and values of . The simulated temperature and rotation profiles are compared with the corresponding experimental profiles in the different radial ranges from the magnetic axis to the flux surface. The comparison is quantified by calculating the RMS deviations and offsets as shown in Table 6. Overall, good agreement is found between the profiles produced in the simulations and the experimental data. Although the results predicted by TGLF and MMM are similar, it takes 8 days to run a 1.5 s JET H-mode TGLF simulation as opposed to less than an hour when using MMM.
4.4. DIII-D
MMM is used to conduct predicted simulations for four DIII-D discharges. In contrast to the previous simulations, where electron and ion temperature, profile and, in some cases, toroidal rotation profiles are evolved, in these DIII-D simulations, additional profiles including the density and/or toroidal rotation frequency, and shear are also evolved. The four DIII-D discharges consist of 144449 time-dependent rotation ramp-down discharge [69], 118341 stationary hybrid discharge [21], and 153283 [70] and 150840 [71] stationary discharges. Table 7 displays the critical parameters for these DIII-D discharges. Electron and ion temperatures, electron density, and toroidal rotation velocity profiles are simulated and plotted in Figure 14, Figure 15, Figure 16 and Figure 17, enabling comparison with experimental profiles. The predicted simulations’ boundary conditions for all four of these shots are set at . Rotation is not predicted for discharge 144449 because of the difficulties introduced by ramping down the torque in the shot. Note that the temperatures and density profiles continue to change in the 144449 discharge as shear decreases due to rotation ramp-down, and the electron and ion temperature profiles are not predicted as well as the other DIII-D discharges. This discharge was intended to investigate the behavior and dynamics of plasma rotation during a controlled decrease or “ramp-down” over a specific period of time. This reduction in plasma rotation was accomplished by modifying the NBI orientation. This effort can aid in the understanding and optimization of ITER scenarios with low toroidal rotation. Hybrid discharge 118341 ramps density slightly up throughout the discharge time, and the density prediction is very good for this shot as shown in Figure 15. Density ramps are used to optimize the plasma scenario and achieve the desired plasma states. By systematically ramping the density, it is possible to find the optimal operating conditions for specific scenarios, improving plasma performance and achieving the desired plasma parameters. ITER may be able to access a broader variety of high-performance scenarios than was previously anticipated, according to projections of the hybrid mode of operation [21].

Table 7.
Plasma parameters for the DIII-D tokamak.

Figure 14.
Predicted and measured electron temperature (a), ion temperature (b) and electron density (c) as a function of at time s for DIII-D time-dependent rotation ramp-down discharge 144449.
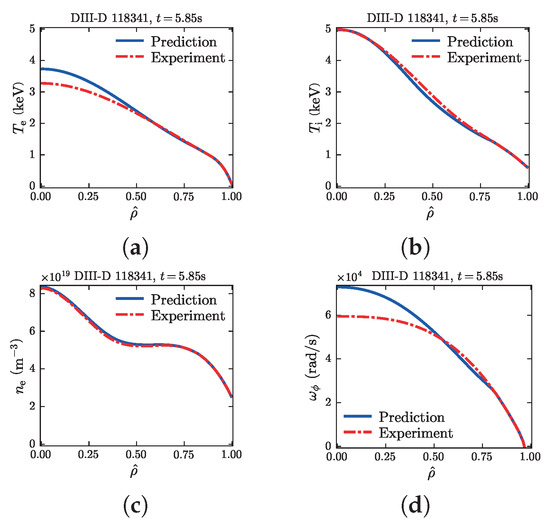
Figure 15.
Electron temperature (a), ion temperature (b), electron density (c), and toroidal rotation (d) as a function of at time s for DIII-D discharge 118341, including both predicted and measured profiles.
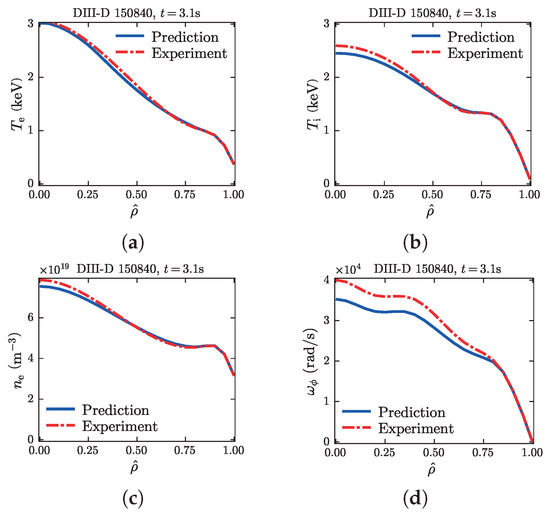
Figure 16.
Electron temperature (a), ion temperature (b), electron density (c), and toroidal rotation (d) as a function of at time s for DIII-D discharge 150840, including both predicted and measured values.
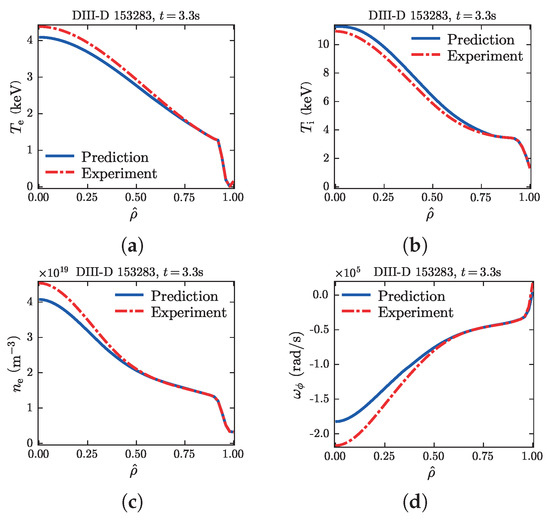
Figure 17.
Electron temperature (a), ion temperature (b), electron density (c), and toroidal rotation (d) as a function of at time s for DIII-D discharge 153283, including both predicted and measured values.
Shot 150840, shown in Figure 16, is run in an ITER-similar shape, while shot 153283, shown in Figure 17, is run in an upper biased double null shape. Shot 150840 can provide valuable insight into the behavior and performance of plasmas under conditions that closely resemble those anticipated at ITER. Long-duration plasmas, with m/n = 2/1 tearing mode stability, is demonstrated [71]. Shot 153283 upper biased double null shape configurations experimentation is conducted to achieve maximize plasma performance as well as better control and management of plasma and impurity flows in the divertor region. The RMS deviations and offsets for electron and ion temperature, electron density, and toroidal rotation frequency are shown for 4 DIII-D discharges in Figure 18 in the bar graphs. A lower RMS deviation for the profiles indicates a closer match between the predicted and experimental values, with the exception of the ion temperature profile of rotation ramp down discharge 144449, which is around 22.0% outside the range of experimental measurement error, necessitating further investigation of these types of discharges. The ion and electron drift direction modes with varying correlation lengths are subjected to the drift wave model component of MMM in the current application. According to our most recent derivation, it is determined that both types of modes share the same correlation length. The intention is to utilize this identical correlation length in the drift wave model of the MMM component and conduct subsequent simulations to observe the effects on the predicted profile.
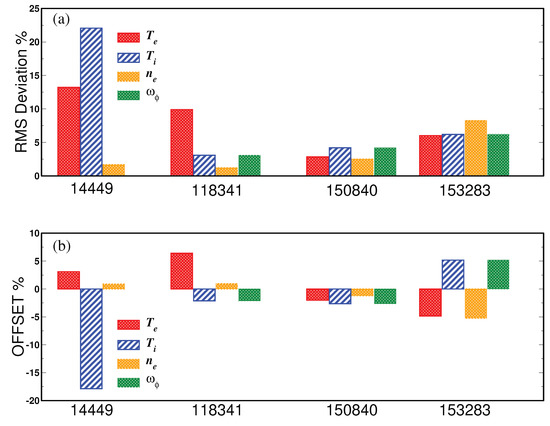
Figure 18.
The RMS deviations (a) and offsets (b) for 4 DIII-D discharges are calculated using predicted and experimental data.
5. Summary and Discussion
Comprehensive predictive models, encompassing all essential interactive physics, are needed to develop the understanding of transport processes in fusion plasmas. The simulations must be run for the length of the plasma’s existence, i.e., over time periods ranging from seconds to hundreds of seconds. A few-microsecond simulation of plasma turbulence necessitates tens of thousands of processors operating for days. As a result, kinetic models cannot be used to perform the needed integrated simulations. Unlike kinetic models, the multi-fluid anomalous transport model can simulate for the length of the plasma’s existence.
TRANSP predictive code is used to simulate 6 EAST discharges, 17 KSTAR discharges, 72 JET ITER-like wall D-D discharges, and 4 DIII-D discharges. The MMM, which is a multi-fluid anomalous transport model, is used to compute anomalous thermal, particle, and momentum transport driven by the electron and ion temperature gradient modes, microtearing modes, trapped electron mode, kinetic and resistive ballooning modes, and collisionless and collision dominated high-n MHD modes. The Chang–Hinton or NCLASS neoclassical model is used to calculate neoclassical transport. The equilibrium data are interpolated from EFIT reconstruction, or equilibrium code TEQ is used to compute the self-consistent evolution of the equilibrium. The LH and NBI heating and current drive are obtained using the GERAY/CQL3D and NUBEAM modules, respectively.
The MMM is used to predict the time-evolved electron temperature, ion temperature, and current density profiles. In contrast to the EAST, KSTAR, and JET simulations, where only electron, ion temperature, and q-profiles are evolved, in DIII-D simulations, the density, toroidal rotation frequency, and flow shear are also evolved. The comparison is quantified by calculating the RMS deviations and Offsets. Predicted profiles are compared to corresponding experimental data at the diagnostic time. RMS and offset are typically found to be within the experimental measurement error range. The simulations are sometimes used to fill in gaps in experimental data that are not measured. In EAST discharges, for example, there is no experimental measurement of the ion temperature, and in JET discharges, there are no experimental data of the electron temperature from = 0–0.3 and ion temperatures from = 0–0.4.
Among the EAST discharges simulated are ohmic and L-mode plasmas, plasmas with low, intermediate, and high density, plasmas with independent and simultaneous LH heating, and plasmas with a combination of NBI and LH heating. Simulations of KSTAR NBI heated tokamak discharges representing high poloidal, high normalized, and ITB long-pulse scenarios are performed. The JET discharges involve a broad range of conditions, including scans over gyroradius, collisionality, and values of . The DIII-D hybrid discharges are also considered.
The predictive simulations for JET, DIII-D, and KSTAR are carried out by excluding the pedestal region. Subsequent work aims to reproduce these simulations by extending them from the separatrix to the magnetic axis, enabling predictions for the pedestal region. Additionally, the simulations do not incorporate transport related to fast ions, and in this study, the MMM is validated specifically for high-aspect-ratio tokamaks. Future plans involve incorporating the missing fast ion transport into the MMM framework and validating it for both high- and low-aspect-ratio tokamaks.
Author Contributions
T.R.: conceptualization, writing—original draft; Z.W., S.M., E.S., J.W., W.C. and H.-T.K.: writing—review and editing (equal). All authors have read and agreed to the published version of the manuscript.
Funding
This work is supported by the U.S. Department of Energy, Office of Science, under Award Nos. DE-SC0013977, DE-SC0010537, DE-SC0010661 and has been partly carried out within the framework of the EUROfusion Consortium, funded by the European Union via the Euratom Research and Training Programme (Grant Agreement No 101052200—EUROfusion). Views and opinions expressed are, however, those of the author(s) only and do not necessarily reflect those of the European Union or the European Commission. Neither the European Union nor the European Commission can be held responsible for them.
Institutional Review Board Statement
Not applicable.
Informed Consent Statement
Not applicable.
Data Availability Statement
This task is performed with TRANSP code (https://transp.pppl.gov/, accessed on 9 May 2023). The data that support the findings of this study are available from the corresponding author upon reasonable request.
Conflicts of Interest
The authors declare no conflict of interest.
References
- Rafiq, T.; Kritz, A.H.; Weiland, J.; Pankin, A.Y.; Luo, L. Physics basis of Multi-Mode anomalous transport module. Phys. Plasmas 2013, 20, 032506. [Google Scholar] [CrossRef]
- Luo, L.; Rafiq, T.; Kritz, A. Improved Multi-Mode anomalous transport module for tokamak plasmas. Comput. Phys. Commun. 2013, 184, 2267–2276. [Google Scholar] [CrossRef]
- Hawryluk, R. An empirical approach to tokamak transport. In Physics of Plasmas Close to Thermonuclear Conditions; Coppi, B., Leotta, G., Pfirsch, D., Pozzoli, R., Sindoni, E., Eds.; Pergamon: Oxford, UK, 1981; pp. 19–46. [Google Scholar] [CrossRef]
- Weiland, J. Stability and Transport in Magnetic Confinement Systems; Springer: New York, NY, USA; Berlin/Heidelberg, Germany, 2012. [Google Scholar]
- Horton, W.; Hong, B.G.; Tang, W.M. Toroidal electron temperature gradient driven drift modes. Phys. Fluids 1988, 31, 2971–2983. [Google Scholar] [CrossRef]
- Rafiq, T.; Weiland, J.; Kritz, A.H.; Luo, L.; Pankin, A.Y. Microtearing modes in tokamak discharges. Phys. Plasmas 2016, 23, 062507. [Google Scholar] [CrossRef]
- Rafiq, T.; Kritz, A.H.; Weiland, J.; Luo, L.; Schuster, E. Study of the parametric dependence of linear and nonlinear microtearing modes in conventional tokamak discharges. Phys. Plasmas 2018, 25, 012504. [Google Scholar] [CrossRef]
- Rafiq, T.; Kaye, S.; Guttenfelder, W.; Weiland, J.; Schuster, E.; Anderson, J.; Luo, L. Microtearing instabilities and electron thermal transport in low and high collisionality NSTX discharges. Phys. Plasmas 2021, 28, 022504. [Google Scholar] [CrossRef]
- Rafiq, T.; Bateman, G.; Kritz, A.H.; Pankin, A.Y. Development of drift-resistive-inertial ballooning transport model for tokamak edge plasmas. Phys. Plasmas 2010, 17, 082511. [Google Scholar] [CrossRef]
- Jenko, F.; Dorland, W.; Hammett, G.W. Critical gradient formula for toroidal electron temperature gradient modes. Phys. Plasmas 2001, 8, 4096–4104. [Google Scholar] [CrossRef]
- Bateman, G.; Halpern, F.; Kritz, A.; Pankin, A.; Rafiq, T.; Budny, R.; McCune, D.; Kinsey, J.; Voitsekhovitch, I.; Weiland, J. Integrated modeling simulations of toroidal momentum transport in tokamaks. In Proceedings of the 2008 IAEA Fusion Energy Conference, Geneva, Switzerland, 13–18 October 2008. [Google Scholar]
- Weiland, J.; Zagorodny, A.; Rafiq, T. Theory for transport in magnetized plasmas. Phys. Scr. 2020, 95, 105607. [Google Scholar] [CrossRef]
- Weiland, J.; Zagorodny, J. Drift wave theory for transport in tokamaks. Rev. Mod. Plasma Phys. 2019, 3, 8. [Google Scholar] [CrossRef]
- Weiland, J.; Rafiq, T.; Schuster, E. Fast particles in drift wave turbulence. Phys. Plasmas 2023, 30, 042517. [Google Scholar] [CrossRef]
- Zagorodny, A.; Weiland, J. Statistical theory of turbulent transport (non-Markovian effects). Phys. Plasmas 1999, 6, 2359–2372. [Google Scholar] [CrossRef]
- Connor, J.W.; Pogutse, O.P. On the relationship between mixing length and strong turbulence estimates for transport due to drift turbulence. Plasma Phys. Control. Fusion 2001, 43, 155. [Google Scholar] [CrossRef]
- Rafiq, T.; Kritz, A.H.; Tangri, V.; Pankin, A.Y.; Voitsekhovitch, I.; Budny, R.V. Integrated modeling of temperature profiles in L-mode tokamak discharges. Phys. Plasmas 2014, 21, 122505. [Google Scholar] [CrossRef]
- Howard, N.T.; White, A.E.; Greenwald, M.; Holland, C.; Candy, J. Multi-scale gyrokinetic simulation of Alcator C-Mod tokamak discharges. Phys. Plasmas 2014, 21, 032308. [Google Scholar] [CrossRef]
- Weiland, J. Review of mixing length estimates and effects of toroidicity in a fluid model for turbulent transport in tokamaks. Plasma Phys. Rep. 2016, 42, 502. [Google Scholar] [CrossRef]
- Weiland, J. Analytical eigenvalue solution for ηi modes of general mode width. Phys. Plasmas 2004, 11, 3238–3241. [Google Scholar] [CrossRef]
- Wade, M.; Luce, T.; Jayakumar, R.; Politzer, P.; Hyatt, A.; Ferron, J.; Greenfield, C.; Murakami, M.; Petty, C.; Prater, R.; et al. Development, physics basis and performance projections for hybrid scenario operation in ITER on DIII-D. Nucl. Fusion 2005, 45, 407. [Google Scholar] [CrossRef]
- Rafiq, T.; Kritz, A.H.; Bateman, G.; Kessel, C.; McCune, D.C.; Budny, R.V. Effect of pedestal height and internal transport barriers on International Thermonuclear Experimental Reactor target steady state simulations. Phys. Plasmas 2011, 18, 112508. [Google Scholar] [CrossRef]
- Rafiq, T.; Kritz, A.H.; Kessel, C.E.; Pankin, A.Y. Fusion power production in International Thermonuclear Experimental Reactor baseline H-mode scenarios. Phys. Plasmas 2015, 22, 042511. [Google Scholar] [CrossRef]
- Kritz, A.; Rafiq, T.; Kessel, C.; Bateman, G.; McCune, D.; Budny, R.; Pankin, A. Integrated modelling for prediction of optimized ITER performance. Nucl. Fusion 2011, 51, 123009. [Google Scholar] [CrossRef]
- Snyder, P.B.; Groebner, R.J.; Leonard, A.W.; Osborne, T.H.; Wilson, H.R. Development and validation of a predictive model for the pedestal height. Phys. Plasmas 2009, 16, 056118. [Google Scholar] [CrossRef]
- Rafiq, T.; Weiland, J. Self-consistent core-pedestal ITER scenario modeling. Nucl. Fusion 2021, 61, 116005. [Google Scholar] [CrossRef]
- Rafiq, T.; Wilson, C.; Luo, L.; Weiland, J.; Schuster, E.; Pankin, A.Y.; Guttenfelder, W.; Kaye, S. Electron temperature gradient driven transport model for tokamak plasmas. Phys. Plasmas 2022, 29, 092503. [Google Scholar] [CrossRef]
- Chang, C.S.; Hinton, F.L. Effect of impurity particles on the finite-aspect ratio neoclassical ion thermal conductivity in a tokamak. Phys. Fluids 1986, 29, 3314–3316. [Google Scholar] [CrossRef]
- Houlberg, W.A.; Shaing, K.C.; Hirshman, S.P.; Zarnstorff, M.C. Bootstrap current and neoclassical transport in tokamaks of arbitrary collisionality and aspect ratio. Phys. Plasmas 1997, 4, 3230–3242. [Google Scholar] [CrossRef]
- Pankin, A.; McCune, D.; Andre, R.; Bateman, G.; Kritz, A. The tokamak Monte Carlo fast ion module NUBEAM in the National Transport Code Collaboration library. Comput. Phys. Commun. 2004, 159, 157–184. [Google Scholar] [CrossRef]
- Smirnov, A.P.; Harvey, R.W.; Kupfer, K. A general ray tracing code GENRAY. Bull. Am. Phys. Soc. 1994, 39, 1626. [Google Scholar]
- Harvey, R.W.; McCoy, M.G. The CQL3D Code. In Proceedings of the IAEA Technical Committee on Advances in Simulation and Modelling of Thermonuclear Plasmas, Montreal, QC, Canada, 15–17 June 1992; IAEA: Vienna, Austria, 1992. [Google Scholar]
- Kritz, A.; Hsuan, H.; Goldfinger, R.; Batchelor, D. Ray Tracing Study of Electron Cyclotron Heating in Toroidal Geometry. In Proceedings of the 3rd Joint Varenna-Grenoble International Symposium on Heating in Toroidal Plasmas, Commission of the European Communities, Grenoble, France, 22–26 March 1982; Volume 2, pp. 707–723. [Google Scholar]
- LoDestro, L.L.; Pearlstein, L.D. On the Grad–Shafranov equation as an eigenvalue problem, with implications for q solvers. Phys. Plasmas 1994, 1, 90–95. [Google Scholar] [CrossRef]
- Lao, L.; John, H.S.; Stambaugh, R.; Kellman, A.; Pfeiffer, W. Reconstruction of current profile parameters and plasma shapes in tokamaks. Nucl. Fusion 1985, 25, 1611–1622. [Google Scholar] [CrossRef]
- Kim, H.T.; Romanelli, M.; Yuan, X.; Kaye, S.; Sips, A.; Frassinetti, L.; Buchanan, J.; JET Contributors. Statistical validation of predictive TRANSP simulations of baseline discharges in preparation for extrapolation to JET D–T. Nucl. Fusion 2017, 57, 066032. [Google Scholar] [CrossRef]
- ITER Physics Expert Group on Confinement and Transport; ITER Physics Expert Group on Confinement Modelling and Database; ITER Physics Basis Editors. Chapter 2: Plasma confinement and transport. Nucl. Fusion 1999, 39, 2175. [Google Scholar] [CrossRef]
- Wan, B.; Liang, Y.; Gong, X.; Li, J.; Xiang, N.; Xu, G.; Sun, Y.; Wang, L.; Qian, J.; Liu, H.; et al. Overview of EAST experiments on the development of high-performance steady-state scenario. Nucl. Fusion 2017, 57, 102019. [Google Scholar] [CrossRef]
- Huang, J.; Qian, J.; Garofalo, A.; Gong, X.; Wu, C.; Chang, J.; Zhang, J.; Du, H.; Wu, M.; Hao, B.; et al. Improved high-performance fully non-inductive discharge by optimizing the fast-ion confinement on EAST. Nucl. Fusion 2019, 60, 016002. [Google Scholar] [CrossRef]
- Choi, W.; Poli, F.; Li, M.; Baek, S.; Gorenlenkova, M.; Ding, B.; Gong, X.; Chan, A.; Duan, Y.; Hu, J.; et al. Observation of synergy between lower hybrid waves at two frequencies in EAST. Phys. Plasmas 2021, 28, 072506. [Google Scholar] [CrossRef]
- Poli, F.M.; Bonoli, P.T.; Chilenski, M.; Mumgaard, R.; Shiraiwa, S.; Wallace, G.M.; Andre, R.; Delgado-Aparicio, L.; Scott, S.; Wilson, J.R.; et al. Experimental and modeling uncertainties in the validation of lower hybrid current drive. Plasma Phys. Control. Fusion 2016, 58, 095001. [Google Scholar] [CrossRef]
- Zang, Q.; Zhao, J.; Yang, L.; Hu, Q.; Xi, X.; Dai, X.; Yang, J.; Han, X.; Li, M.; Hsieh, C. Upgraded multipulse laser and multipoint Thomson scattering diagnostics on EAST. Rev. Sci. Instrum. 2011, 82, 063502. [Google Scholar] [CrossRef]
- Han, X.; Hu, A.; Li, D.; Xiao, S.; Tian, B.; Zang, Q.; Zhao, J.; Hsieh, C.; Gong, X.; Hu, L.; et al. Multiple laser system for high-resolution thomson scattering diagnostics on the EAST tokamak. IEEE Trans. Plasma Sci. 2018, 46, 406–409. [Google Scholar] [CrossRef]
- Zhang, S.; Gao, X.; Ling, B.; Wang, Y.; Zhang, T.; Han, X.; Liu, Z.; Bu, J.; Li, J. Density profile and fluctuation measurements by microwave reflectometry on EAST. Plasma Sci. Technol. 2014, 16, 311. [Google Scholar] [CrossRef]
- Zhen, Z.; Zhang, T.; Mingfu, W.; Kaixuan, Y.; Zhong, F.; Huang, J.; Kangning, G.; Yukai, L.; Gongshun, L.; Xiang, H.; et al. Experimental study of core and edge fluctuations by reflectometry on EAST tokamak. Plasma Sci. Technol. 2021, 23, 075101. [Google Scholar]
- Xu, M.; Xu, X.; Wen, Y.; Ma, J.; Xie, J.; Gao, B.; Lan, T.; Liu, A.; Yu, Y.; He, Y.; et al. Electron cyclotron emission imaging on the EAST tokamak. Plasma Sci. Technol. 2011, 13, 167. [Google Scholar] [CrossRef]
- Liu, H.; Qian, J.; Jie, Y.; Ding, W.; Brower, D.; Zou, Z.; Li, W.; Lian, H.; Wang, S.; Yang, Y.; et al. Initial measurements of plasma current and electron density profiles using a polarimeter/interferometer (POINT) for long pulse operation in EAST. Rev. Sci. Instrum. 2016, 87, 11D903. [Google Scholar] [CrossRef]
- Zou, Z.; Liu, H.; Li, W.; Lian, H.; Wang, S.; Yao, Y.; Lan, T.; Zeng, L.; Jie, Y. Optical configuration optimization and calibration for the POINT system on EAST. Rev. Sci. Instrum. 2016, 87, 11E121. [Google Scholar] [CrossRef]
- Huang, Y.; Xiao, B.; Luo, Z.; Qian, J.; Li, S.; Chen, Y.; Liu, H.; Xu, L.; Yuan, Y.; Yuan, Q. Development of real-time plasma current profile reconstruction with POINT diagnostic for EAST plasma control. Fusion Eng. Des. 2017, 120, 1–8. [Google Scholar] [CrossRef]
- Zhu, X.; Zeng, L.; Liu, H.; Qian, J.; Zang, Q.; Jie, Y.; Zou, Z.; Li, W.; Yao, Y.; Gao, X. Improvement of q profile by the polarimeter/interferometer system on EAST tokamak. J. Instrum. 2017, 12, C12060. [Google Scholar] [CrossRef]
- Singh, R.; Tangri, V.; Nordman, H.; Weiland, J. Fluid description of electron temperature gradient driven drift modes. Phys. Plasmas 2001, 8, 4340–4350. [Google Scholar] [CrossRef]
- Chung, J.; Kim, H.; Jeon, Y.; Kim, J.; Choi, M.; Ko, J.; Lee, K.; Lee, H.; Yi, S.; Kwon, J.; et al. Formation of the internal transport barrier in KSTAR. Nucl. Fusion 2017, 58, 016019. [Google Scholar] [CrossRef]
- Kim, J.; Choi, M.; Lee, J. Reversed Ip operation with counter neutral beam injection in KSTAR. In Proceedings of the 27th IAEA Fusion Energy Conference (FEC 2018), Gandhinagar, India, 22–27 October 2018. [Google Scholar]
- Park, Y.; Sabbagh, S.; Ko, W.; Bak, J.; Berkery, J.; Bialek, J.; Choi, M.; Hahn, S.; In, Y.; Jardin, S.; et al. Investigation of instabilities and rotation alteration in high beta KSTAR plasmas. Phys. Plasmas 2017, 24, 012512. [Google Scholar] [CrossRef]
- Na, D.; Yang, S.; Shi, Y.; Hahm, T.; Na, Y.; Lee, S.; Kwon, J.; Jhang, H.; Ko, W.; Angioni, C.; et al. Rotation Reversal in KSTAR and its Turbulence and Transport Characteristics. In Proceedings of the 26th IAEA Fusion Energy Conference (FEC 2016), Kyoto, Japan, 17–22 October 2016. [Google Scholar]
- Yoon, S.; Jeon, Y.; Kim, H.; Kang, J.; Rhee, T.; Oh, Y.; Park, J. The effect of electron cyclotron heating on thermal and fast-ions transport in high beta-poloidal discharges at KSTAR. In Proceedings of the IAEA Fusion Energy Conference, Gandhinagar, India, 22–27 October 2018. [Google Scholar]
- Kwak, J.G.; Rhee, T.; Han, H.; Kang, J.; Bak, J.; Ahn, H.; Nam, Y.; Kim, H.; Kim, M.; Ko, W.; et al. KSTAR status and upgrade plan toward fusion reactor. IEEE Trans. Plasma Sci. 2020, 48, 1388–1395. [Google Scholar] [CrossRef]
- Park, H.K.; Choi, M.; Hong, S.; In, Y.; Jeon, Y.; Ko, J.; Ko, W.; Kwak, J.; Kwon, J.; Lee, J.; et al. Overview of KSTAR research progress and future plans toward ITER and K-DEMO. Nucl. Fusion 2019, 59, 112020. [Google Scholar] [CrossRef]
- Sips, A.; Kessel, C.; Joffrin, E.; Rimini, F.; Jackson, G.; Urano, H.; Nunes, I.; Hobirk, J.; Stober, J.; Schweinzer, J.; et al. Assessment of the baseline scenario at q95∼3 for ITER Preprint. In Proceedings of the 2016 IAEA Fusion Energy Conference, Kyoto, Japan, 17–22 October 2016. [Google Scholar]
- Frassinetti, L.; Saarelma, S.; Lomas, P.; Nunes, I.; Rimini, F.; Beurskens, M.N.A.; Bilkova, P.; Boom, J.E.; de la Luna, E.; Delabie, E.; et al. Dimensionless scalings of confinement, heat transport and pedestal stability in JET-ILW and comparison with JET-C. Plasma Phys. Control. Fusion 2016, 59, 014014. [Google Scholar] [CrossRef]
- Kim, H.T.; Romanelli, M.; Voitsekhovitch, I.; Koskela, T.; Conboy, J.; Giroud, C.; Maddison, G.; Joffrin, E. Comparative analysis of core heat transport of JET high density H-mode plasmas in carbon wall and ITER-like wall. Plasma Phys. Control. Fusion 2015, 57, 065002. [Google Scholar] [CrossRef]
- Pasqualotto, R.; Nielsen, P.; Gowers, C.; Beurskens, M.; Kempenaars, M.; Carlstrom, T.; Johnson, D. High resolution Thomson scattering for Joint European Torus (JET). Rev. Sci. Instrum. 2004, 75, 3891–3893. [Google Scholar] [CrossRef]
- Giroud, C.; Meigs, A.G.; Negus, C.R.; Zastrow, K.D.; Biewer, T.M.; Versloot, T.W. Impact of calibration technique on measurement accuracy for the JET core charge-exchange system. Rev. Sci. Instrum. 2008, 79, 10F525. [Google Scholar] [CrossRef] [PubMed]
- Mast, K.F.; Krause, H.; Behringer, K.; Bulliard, A.; Magyar, G. Bolometric diagnostics in JET. Rev. Sci. Instrum. 1985, 56, 969–971. [Google Scholar] [CrossRef]
- Meister, H.; Fischer, R.; Horton, L.D.; Maggi, C.F.; Nishijima, D.; Giroud, C.; Zastrow, K.D.; Zaniol, B. Zeff from spectroscopic bremsstrahlung measurements at ASDEX Upgrade and JET. Rev. Sci. Instrum. 2004, 75, 4097–4099. [Google Scholar] [CrossRef]
- Brambilla, M. ‘Quasi-local’ wave equations in toroidal geometry with applications to fast wave propagation and absorption at high harmonics of the ion cyclotron frequency. Plasma Phys. Control. Fusion 2002, 44, 2423–2443. [Google Scholar] [CrossRef]
- Staebler, G.M.; Kinsey, J.E.; Waltz, R.E. A theory-based transport model with comprehensive physics. Phys. Plasmas 2007, 14, 055909. [Google Scholar] [CrossRef]
- Kiefer, C.; Angioni, C.; Tardini, G.; Bonanomi, N.; Geiger, B.; Mantica, P.; Pütterich, T.; Fable, E.; Schneider, P.; Team, A.U.; et al. Validation of quasi-linear turbulent transport models against plasmas with dominant electron heating for the prediction of ITER PFPO-1 plasmas. Nucl. Fusion 2021, 61, 066035. [Google Scholar] [CrossRef]
- Solomon, W.; Politzer, P.; Buttery, R.; Holcomb, C.; Ferron, J.; Garofalo, A.; Grierson, B.; Hanson, J.; In, Y.; Jackson, G.; et al. Access to high beta advanced inductive plasmas at low injected torque. Nucl. Fusion 2013, 53, 093033. [Google Scholar] [CrossRef]
- Grierson, B.; Burrell, K.; Garofalo, A.; Solomon, W.; Diallo, A.; O’Mullane, M. Response of impurity particle confinement time to external actuators in QH-mode plasmas on DIII-D. Nucl. Fusion 2014, 54, 114011. [Google Scholar] [CrossRef]
- Jackson, G.; Luce, T.; Solomon, W.; Turco, F.; Buttery, R.; Hyatt, A.; deGrassie, J.; Doyle, E.; Ferron, J.; Haye, R.L.; et al. Long-pulse stability limits of the ITER baseline scenario. Nucl. Fusion 2015, 55, 023004. [Google Scholar] [CrossRef]
Disclaimer/Publisher’s Note: The statements, opinions and data contained in all publications are solely those of the individual author(s) and contributor(s) and not of MDPI and/or the editor(s). MDPI and/or the editor(s) disclaim responsibility for any injury to people or property resulting from any ideas, methods, instructions or products referred to in the content. |
© 2023 by the authors. Licensee MDPI, Basel, Switzerland. This article is an open access article distributed under the terms and conditions of the Creative Commons Attribution (CC BY) license (https://creativecommons.org/licenses/by/4.0/).