Article

Investigation of Power Transmission of a Helium Plasma Jet to Different Dielectric Targets Considering Operating Modes

by
Tilman Teschner
1,2,3,
Robert Bansemer
1,
Klaus-Dieter Weltmann
1 and
Torsten Gerling
1,2,3,*
1
Leibniz Institute for Plasma Science and Technology (INP Greifswald), Felix-Hausdorff-Str. 2, 17489 Greifswald, Germany
2
Centre for Innovation Competence (ZIK plasmatis), Felix-Hausdorff-Str. 2, 17489 Greifswald, Germany
3
Competency Center Diabetes Karlsburg (KDK), Greifswalder Str. 11, 17495 Karlsburg, Germany
*
Author to whom correspondence should be addressed.
Plasma 2019, 2(3), 348-359; https://doi.org/10.3390/plasma2030027
Submission received: 12 April 2019 / Revised: 30 July 2019 / Accepted: 12 August 2019 / Published: 22 August 2019
(This article belongs to the Special Issue Low Temperature Plasma Jets: Physics, Diagnostics and Applications)

Abstract

:
The interaction of an atmospheric pressure plasma jet with different dielectric surfaces is investigated using a setup of two ring electrodes around a ceramic capillary. In this study, in addition to electrical measurement methods such as the determination of voltage and current, special emphasis was placed on the power measurements at the electrodes and the effluent. The power dissipation is correlated with Fourier-transform infrared (FTIR) absorption spectroscopy measurements of O3 and NO2 densities. The results show the correlation between the dielectric constant and the dissipated power at the target. The ratio between power dissipation at the grounded ring electrode and the grounded surface shows an increase with increasing dielectric constant of the target. A correlation of the results with bacteria, tissue and water as envisaged dielectric targets shows four times the power dissipation at the treatment spot between bacteria and tissue.

1. Introduction

Plasma devices operating at atmospheric pressure are a useful tool for many applications, from exhaust treatment to medical use [1,2,3]. The unique properties of the devices arise from the local generation of multiple reactive species on the spot [4]. A broad range of investigations consider the application of plasma treatment of surfaces aiming to coat, decontaminate or heal specific surfaces. However, the diagnostics of the devices were performed while operating without a target in front [5,6,7].
One major application for plasma being researched is the field of plasma medicine. In plasma medicine, cold atmospheric pressure plasma is found to inactivate a broad spectrum of microorganisms in wounds and to stimulate cell proliferation and tissue regeneration mediated by direct treatment via ultraviolet radiation and creation of reactive species or by indirect effects through excitation of the liquid phase of the cell or wound [8].
For plasma setups, the characteristics like emission, species generation, electrical field strength amplitude and even stability are impacted when a surface is put in close vicinity [9,10,11,12,13,14]. Thus, an increased interest has arisen in recent years in the investigation of interaction with a target made of liquid, dielectric or metal resembling specific application conditions [15,16,17,18,19]. The range of dielectric constants varies considerably ranging from low values in alumina to virtually infinity for metals.
The present contribution provides a systematic investigation on the effect of dielectric properties of different surfaces in front of a plasma jet on the discharge stability and power distribution. A plasma jet with a dielectric capillary and two ring electrodes (high voltage and grounded) as well as a grounded electrode behind the dielectric surface is investigated with power measurements at both electrodes for a variety of six different dielectric surfaces ( ϵ r = 2.25 160 ). The power consumption at the ring electrode and the surface electrode is measured for all six dielectrics as well as for different applied voltages. The distribution of power is derived from these measurements. Density measurements of O3 and NO2 by Fourier-transform infrared absorption spectroscopy allow an insight of the target permittivity on species production efficiency. Finally, the influence of permittivity on power and species development in plasma is used to get qualitative predictions on medically relevant targets such as E . c o l i , tissue or water.

2. Materials and Methods

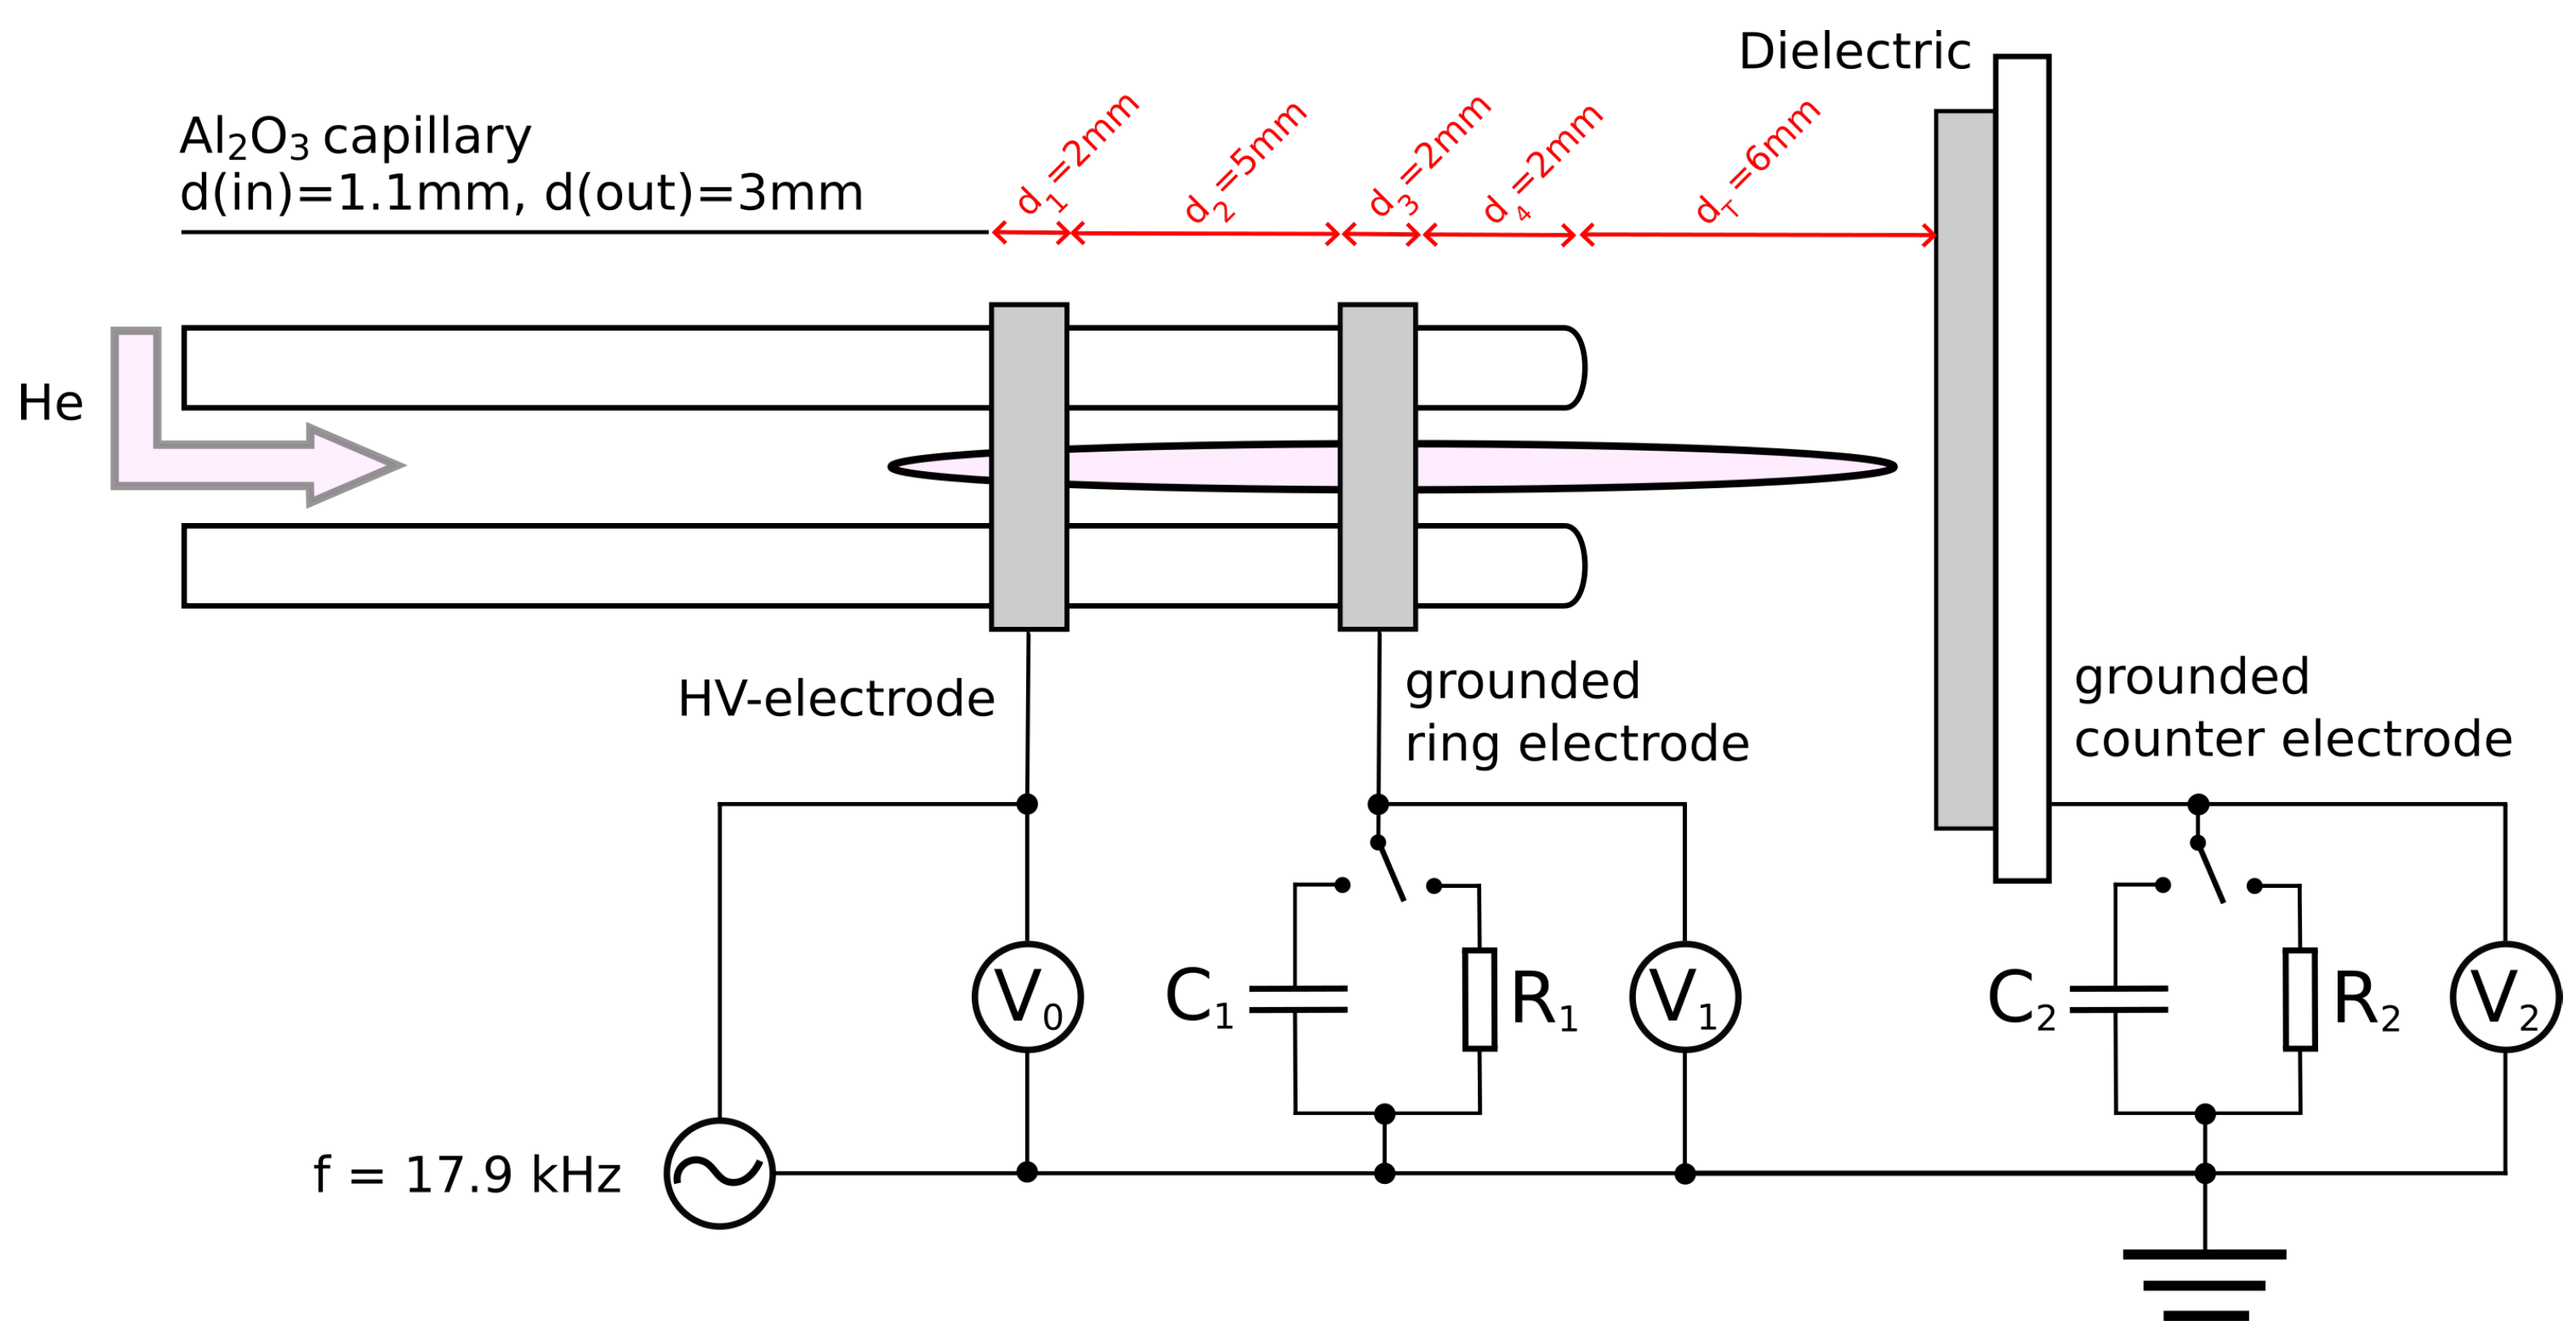
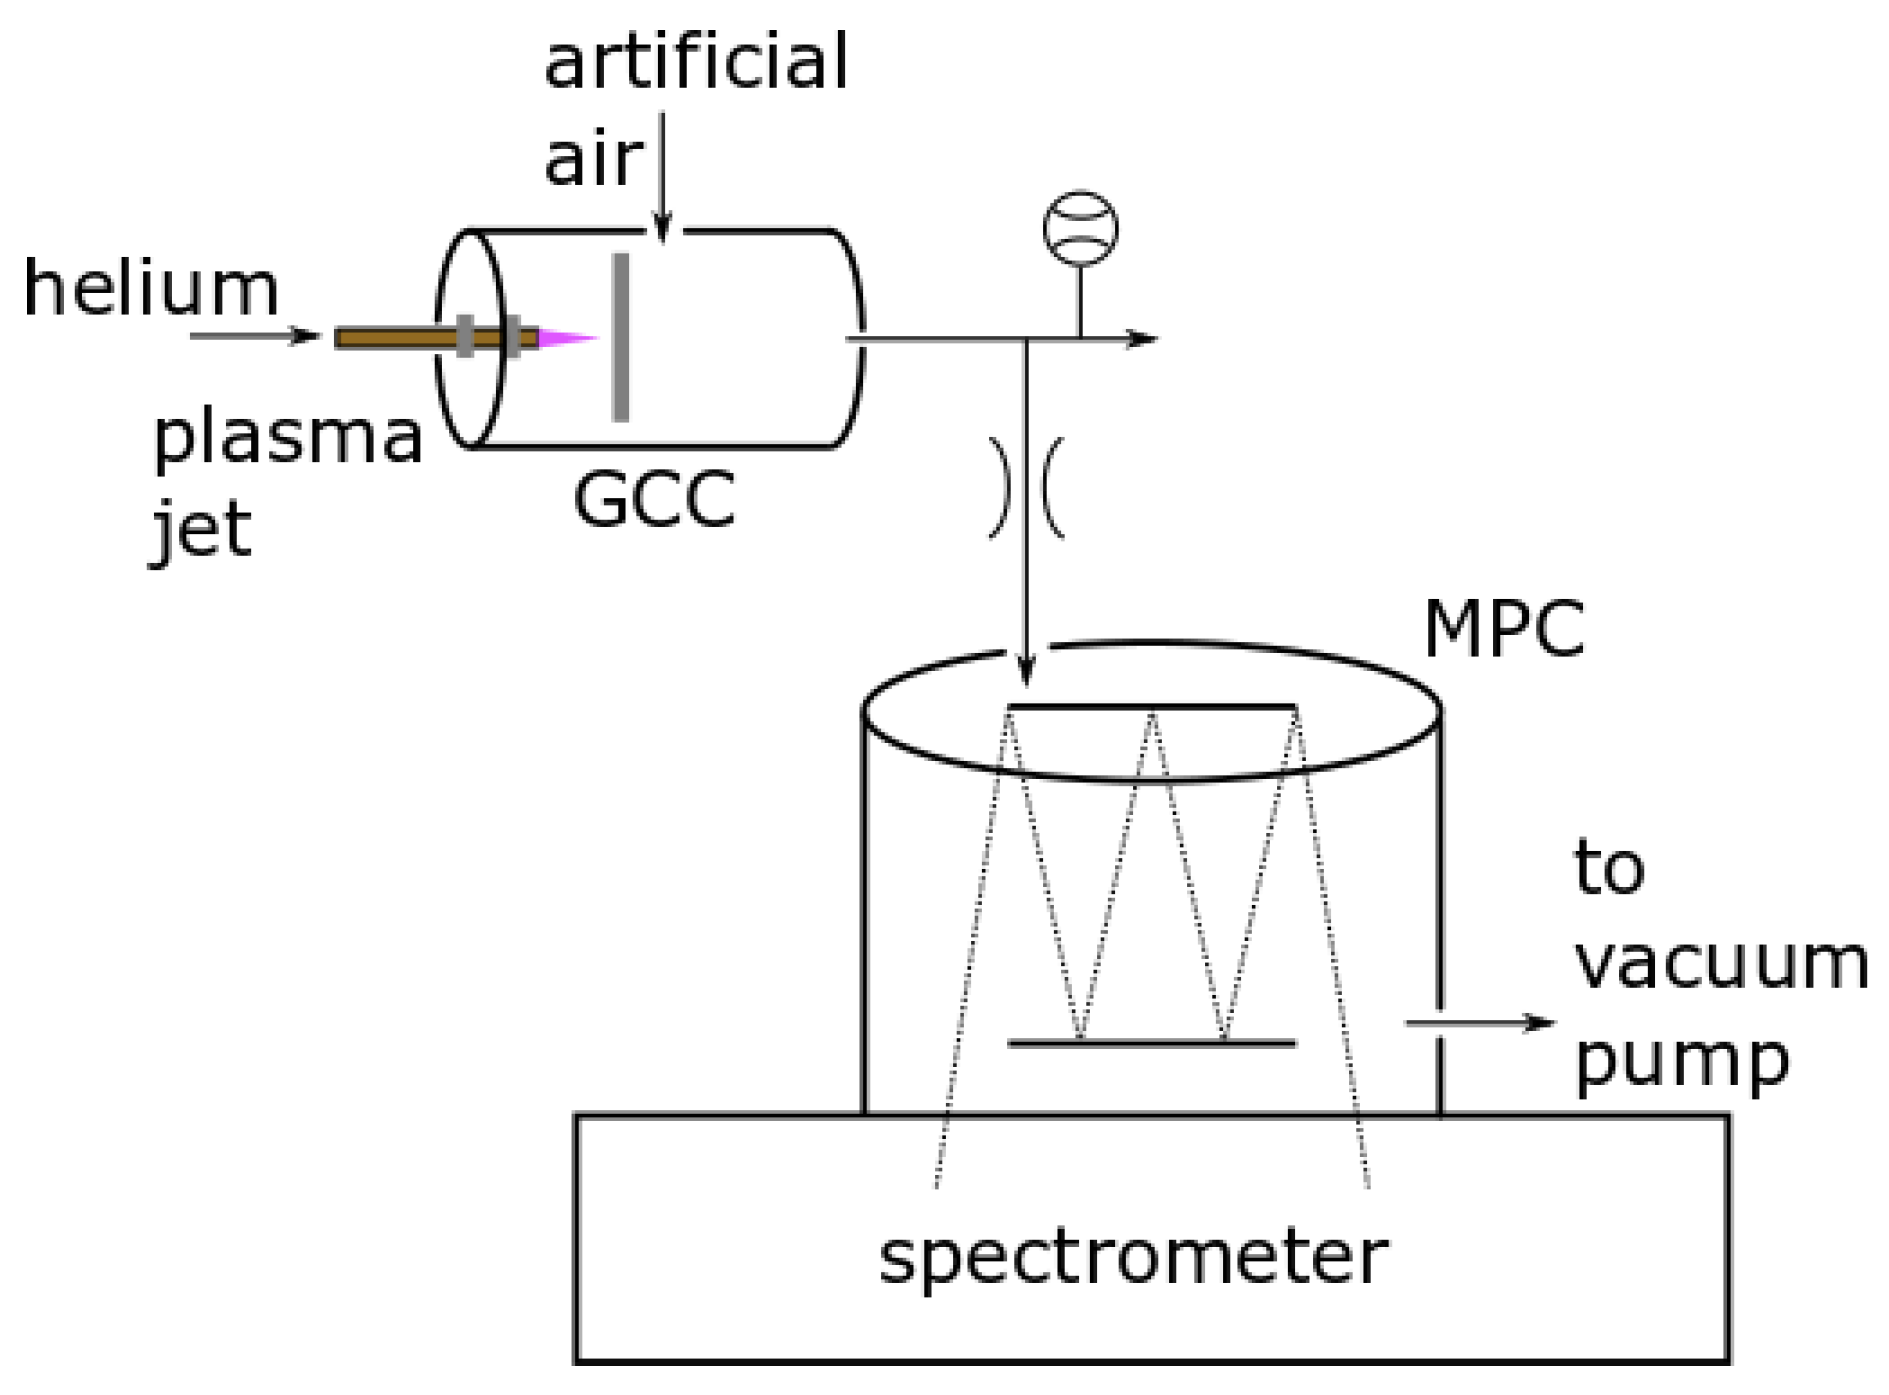
2.1. Experimental Setup

Figure 1 shows a schematic of the experimental setup. The plasma source consisted of an alumina capillary with a 3 mm outer and a 1.1 mm inner diameter. A gas flow of 2 slm helium was introduced through the capillary. A sinusoidal voltage U app was applied on the first copper electrode (high voltage (HV) electrode in Figure 1). To create a high voltage, a sinusoidal signal generated by a waveform generator (f = 17.9 kHz, PicoScope 3460B, Pico Technology, St Neots, UK) was amplified by a power amplifier (AG 1021, T&C Power, Rochester, NY, USA) in series with a high-voltage transformer. The second copper electrode was grounded. The dielectric surface had a distance d T to the opposing capillary orifice and was grounded via an attached copper plate. A high voltage probe V 0 (P6015A, Tektronix, Inc. Beaverton, OR, USA) was connected to the first ring electrode for high voltage measurements. To measure the input power, a current monitor (6585 Pearson Electronics, Palo Alto, CA, USA) was placed around the input HV line. Optionally, the current over R i = 100 Ω resistors or the voltage drop over Styroflex capacitors C i = 220 pF was measured with voltage probes V i (TA131, Pico Technology, St Neots, UK), where i represents the grounded ring electrode (1) and the grounded counter electrode (2).
The dielectrics used in this experiment with their relative permittivity and their major associated polarization mechanisms are shown in Table 1. Values for water, tissue and E . c o l i are added as reference [20,21,22] due to their relevance in plasma medicine.

2.2. Power Determination

The transferred charges could be determined from the measured charging curves of the capacitors. Relating these charges with the input voltages, one received Lissajous figures. The power dissipation could be determined from the area of these figures. Due to the setup with three electrodes, nonlinear plasma dynamics arose, so that the classical power determination via the Manley equation [23] was not possible. Charge transfer and discharges between the electrodes caused the Lissajous figure to fold, which could result in intersections of the curve. Using the Gauss’s area formula, the enclosed area A P of the resulting figure can be calculated with the vertices ( x j , y j ) [24]:
A P = 1 2 | j = 0 n 1 ( y j + y j + 1 mod n ) ( x j x j + 1 mod n ) | .
This area corresponded to the dissipated energy E dis of the discharges. By including the frequency, the mean dissipated power P i could be determined with
P i = 1 T 0 T U app ( t ) · C i d U i ( t ) d t = f one cycle U app d Q i = E dis = A P
for one of the electrodes i = 1 , 2 considering the applied voltage U app [25]. In this geometry, P i describes the power dissipated at the respective electrode.
The input power P i n was acquired by measuring U app and the input current I 0 . To consider power losses, the power measurement was performed also without plasma ignition P 0 by switching off the helium flow. The calculations were comparable with [6]:
P i n / 0 = 1 T 0 T U app ( t ) · I 0 ( t ) d t ( plasma on / off ) ,
P plasma = P in P 0 .
Finally, the power dissipated into the effluent was described as the loss into emission and species production and was determined by
P effluent = P plasma P 1 P 2 .

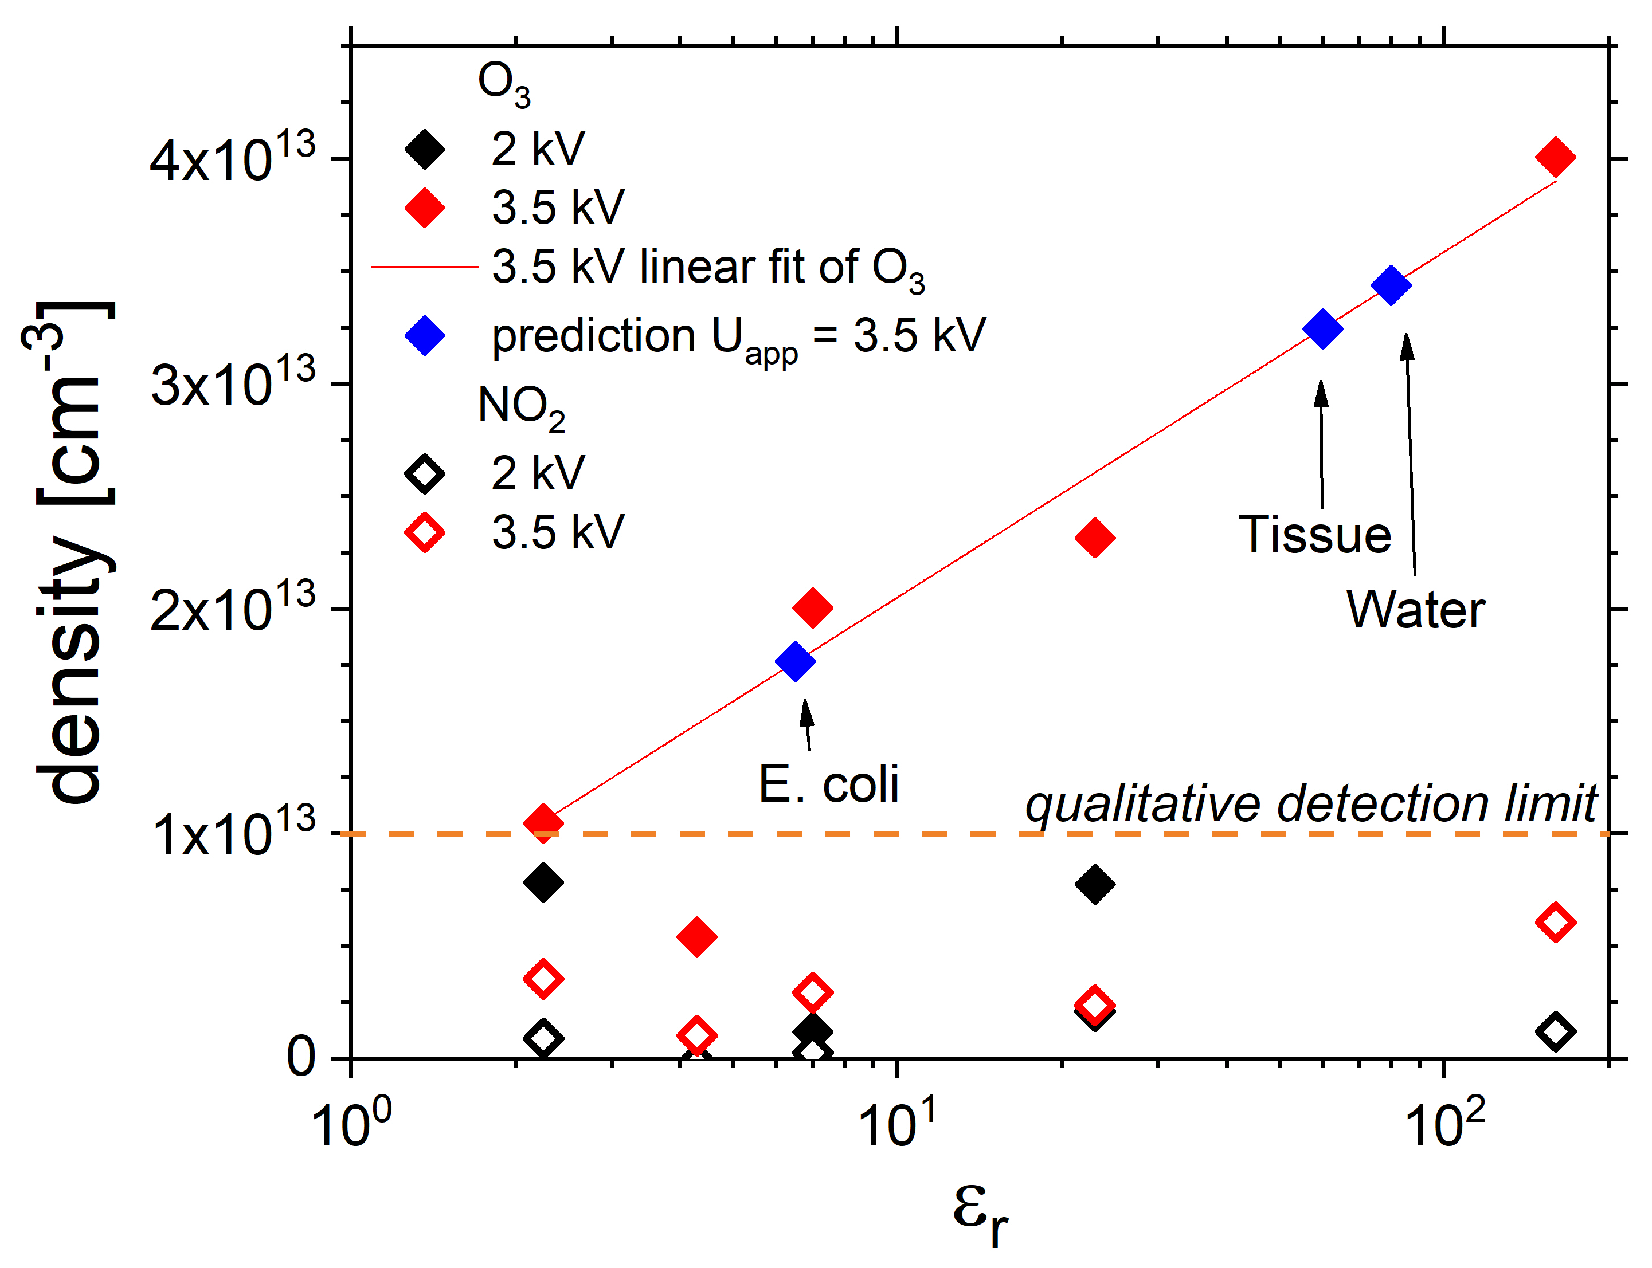
2.3. Determination of Produced Species Densities
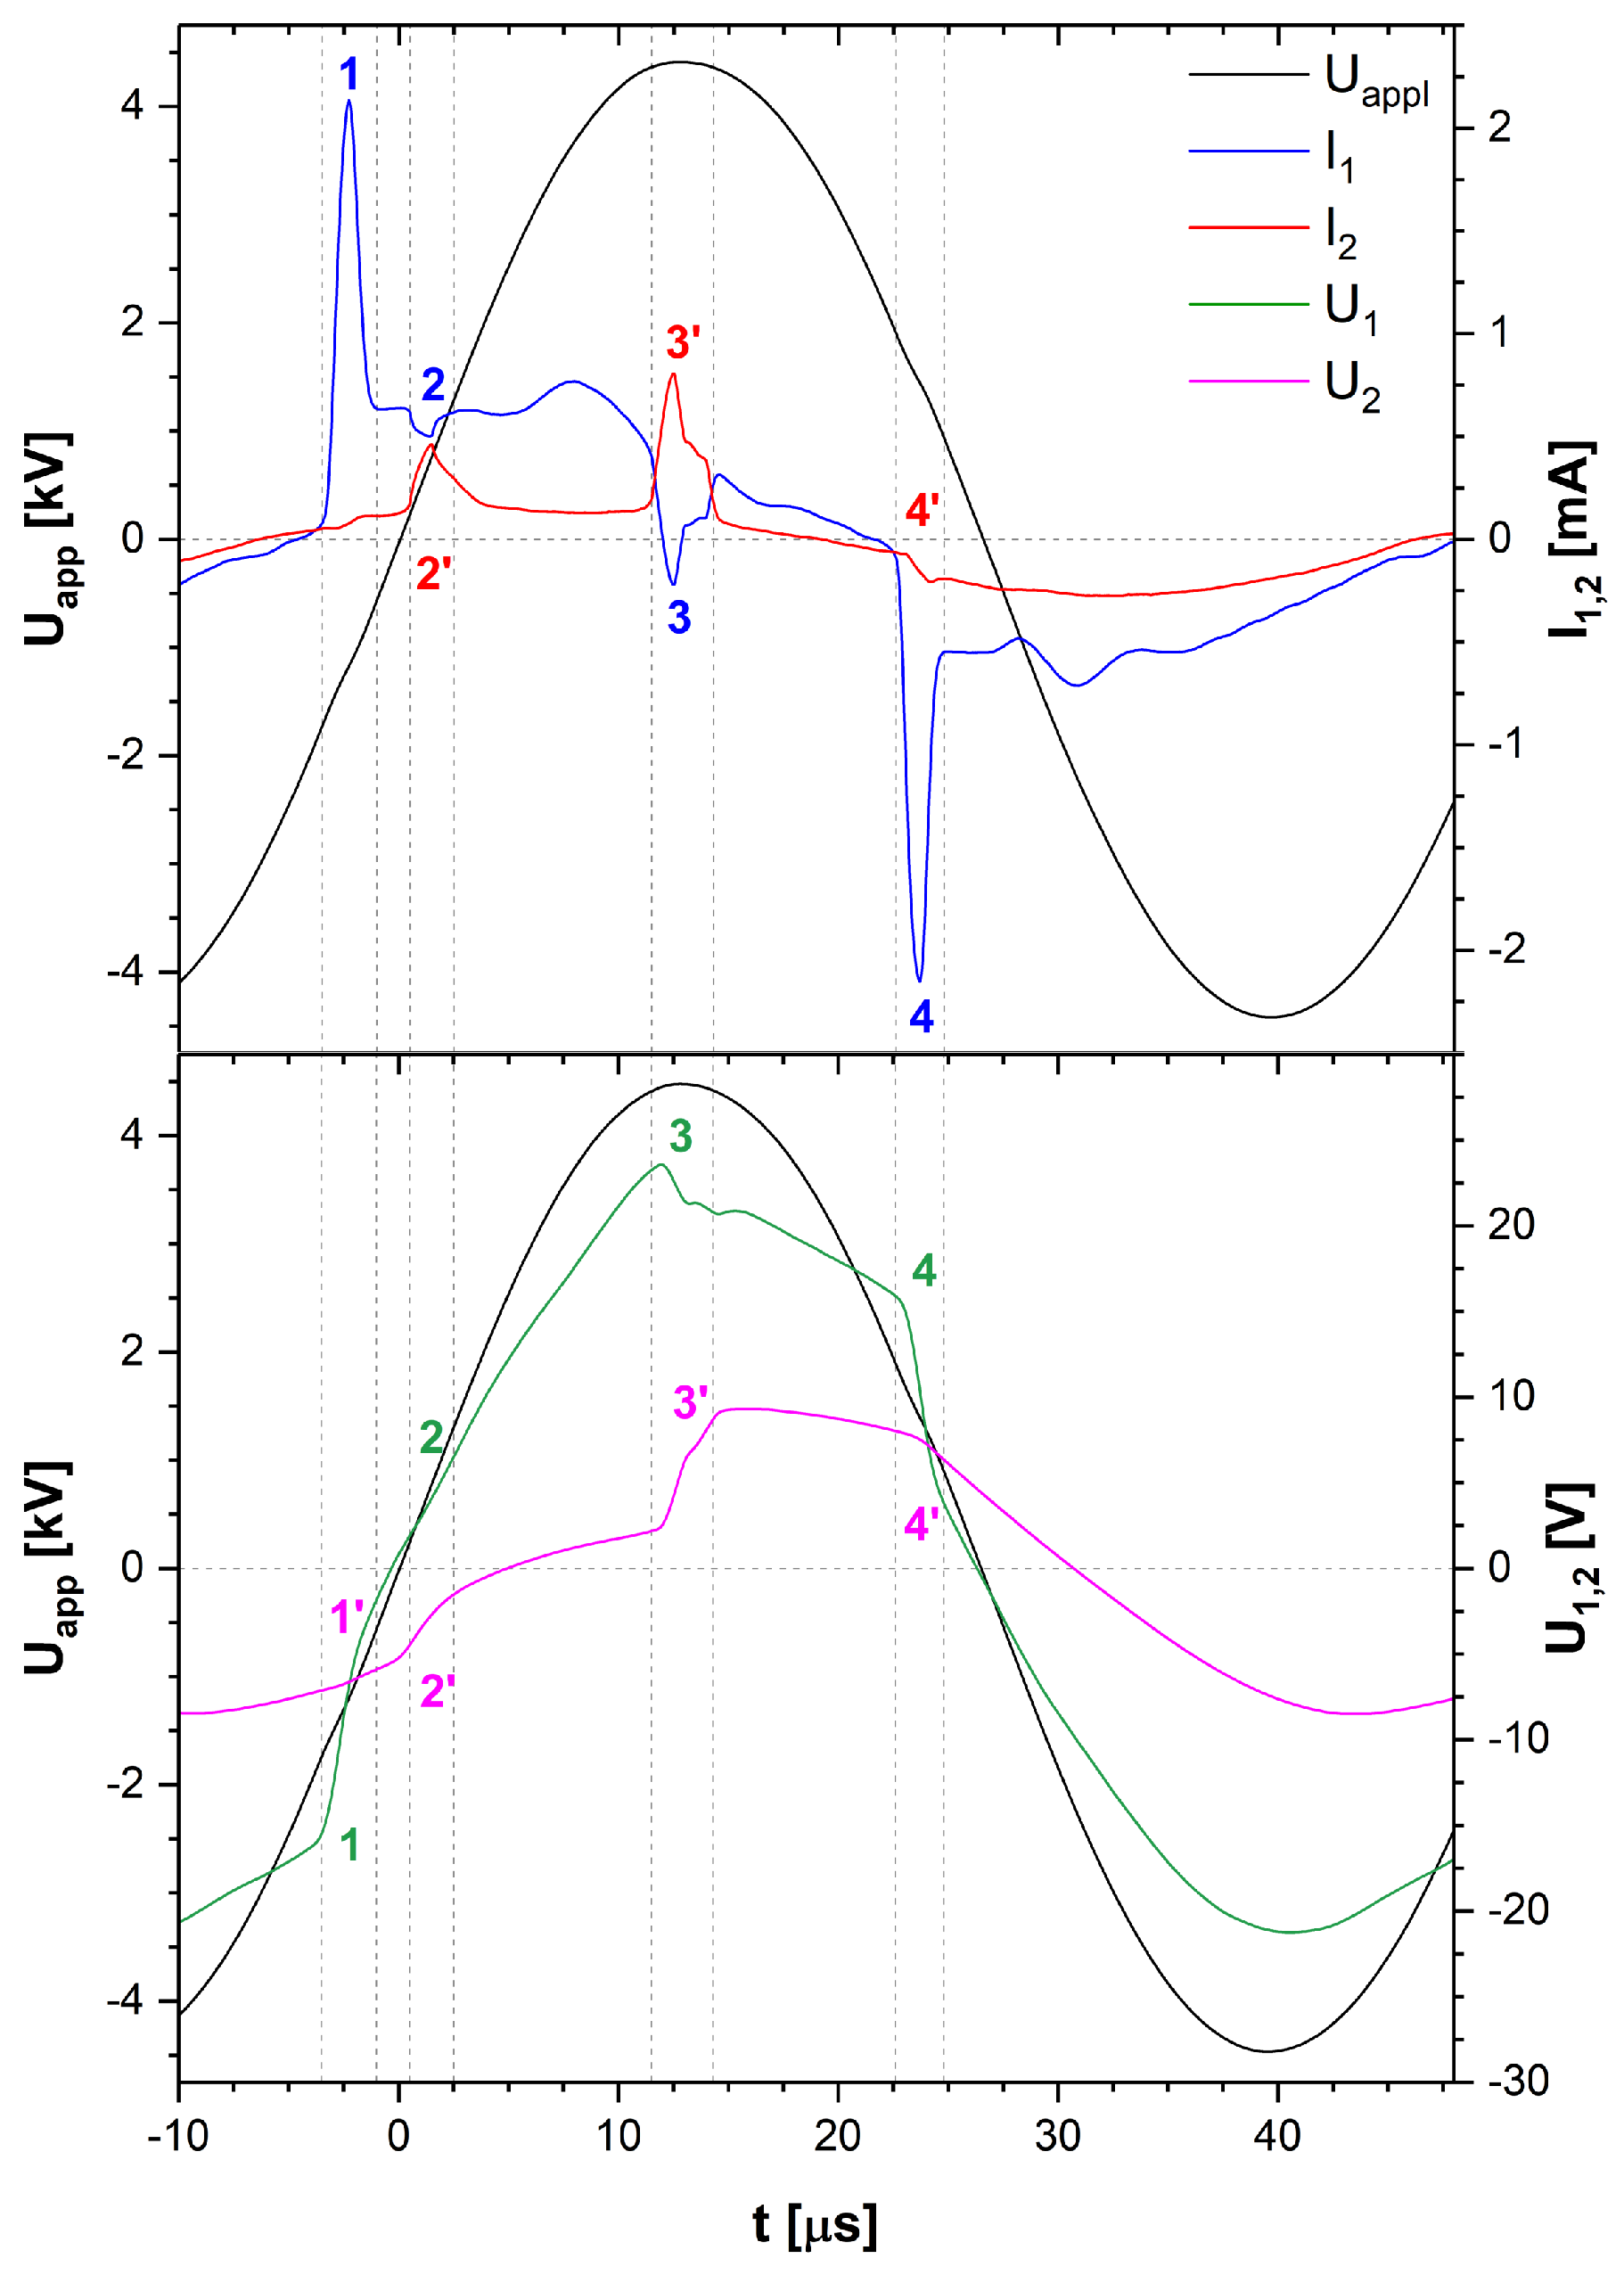
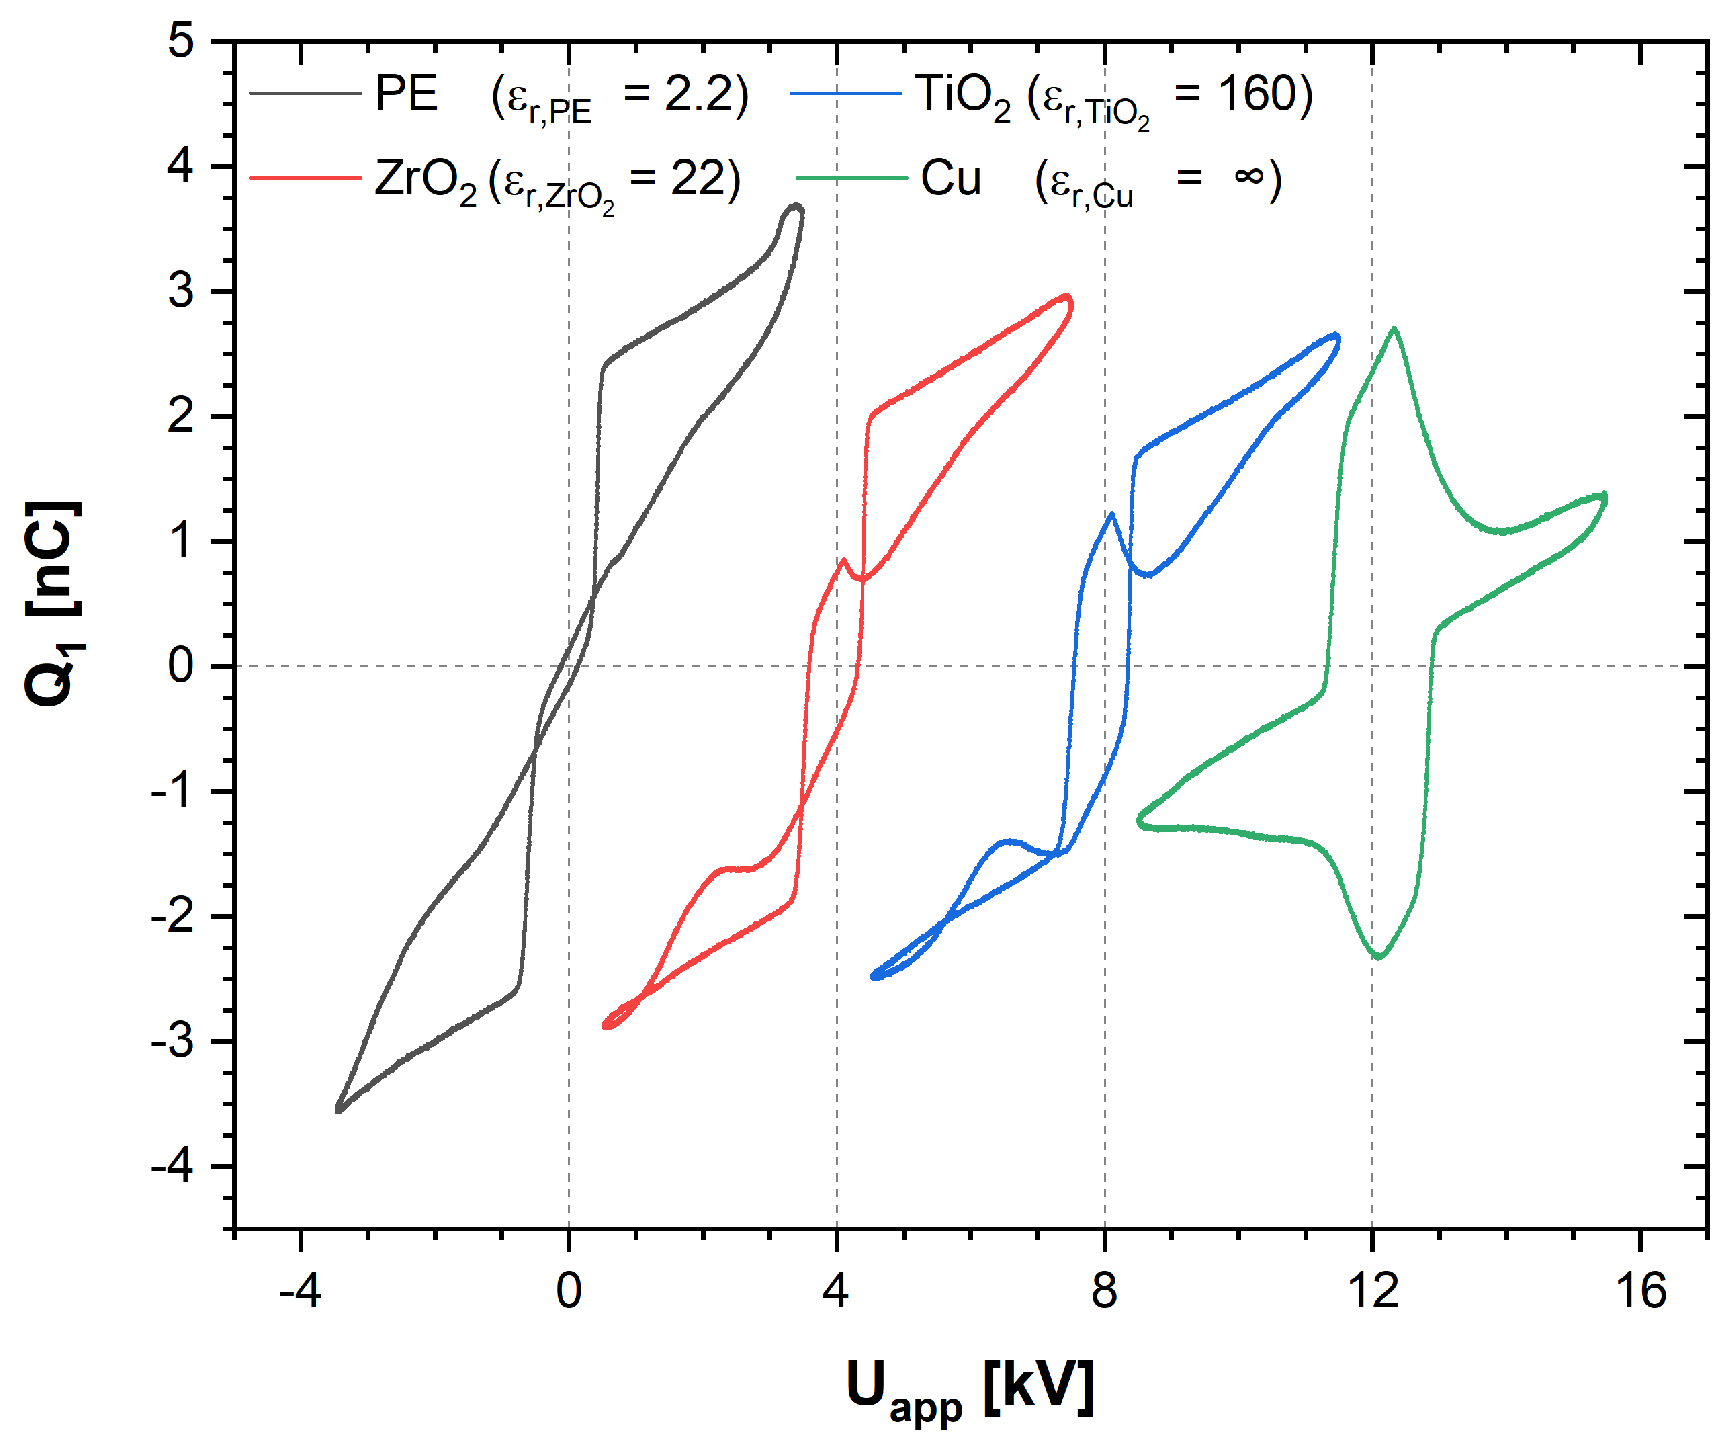
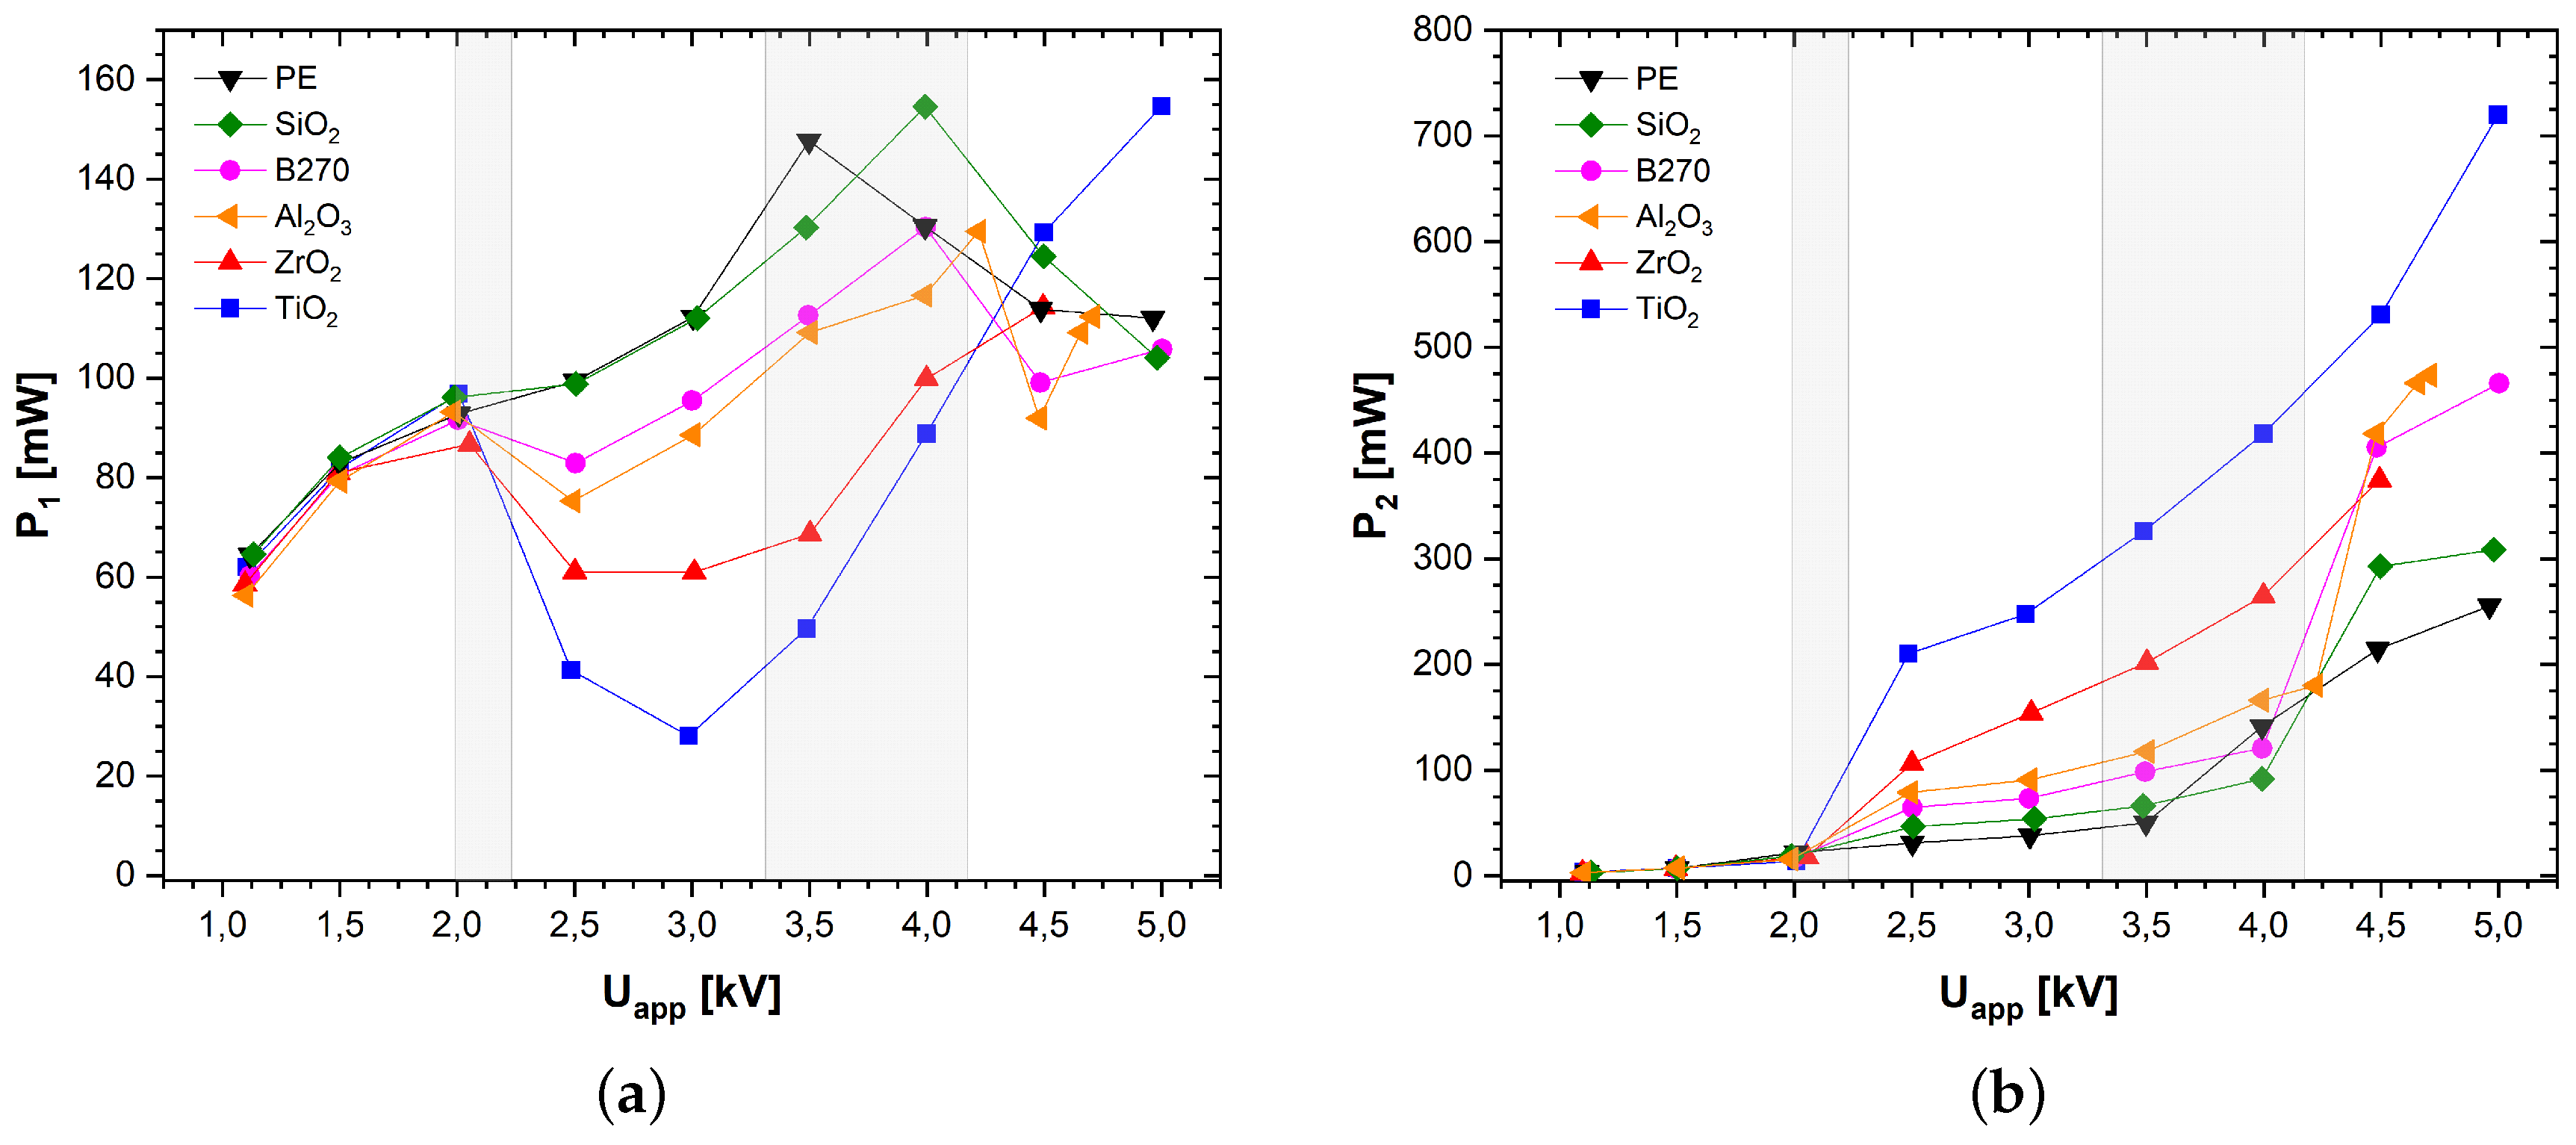
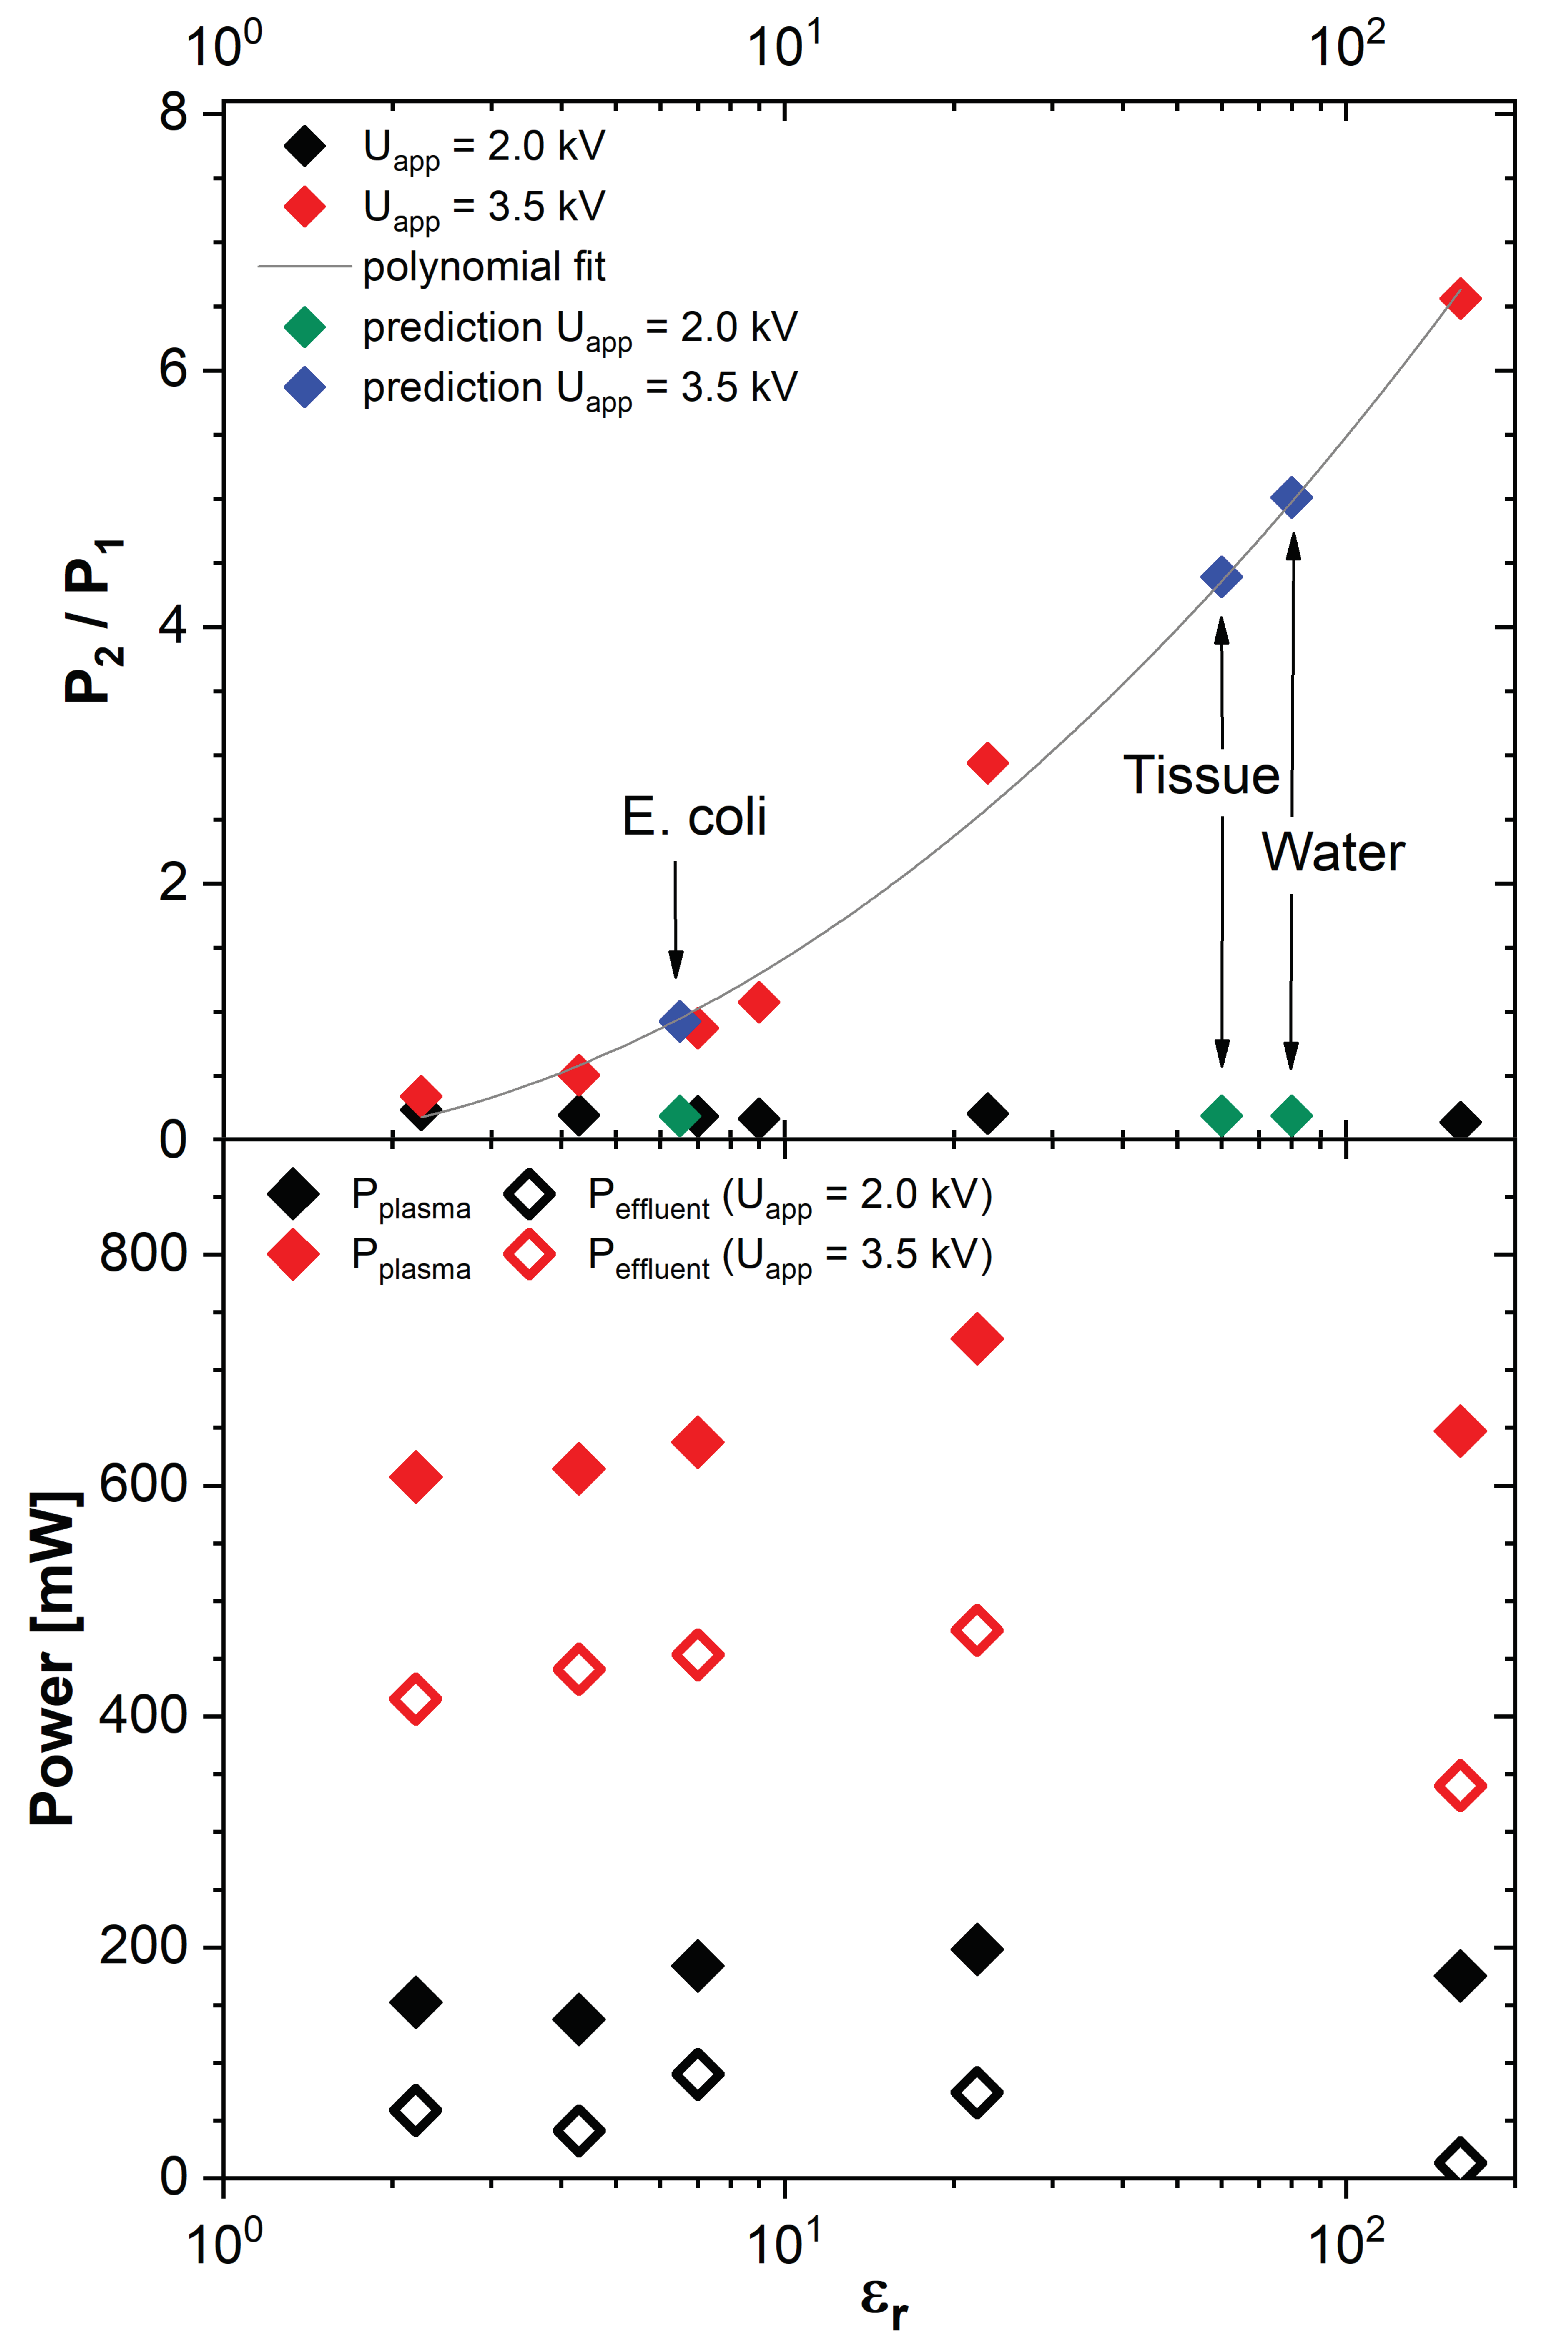
In order to obtain an insight into the plasma chemical effects triggered by exchanging the treated dielectric and by the concomitant change in electrical power dissipation, absolute densities of ozone (O3) and nitrogen dioxide (NO2) were measured using Fourier-transform infrared (FTIR) absorption spectroscopy. A sufficient sensitivity for far-field measurements was provided by attaching a 32 m multi-pass cell to the spectrometer in use (Vertex 80v, Bruker Corporation, Billerica, MA, USA). The desired species were expected to be produced in reactions with the surrounding atmosphere. Therefore, a reproducible environment needed to be created. This is realized by operating the plasma source in a glass cell that was flushed with 5 slm of dry, artificial air (80% N2, 20% O2). A vacuum pump at the multi-pass cell outlet and a throttle valve at its inlet led to a pressure of 280 mbar in the cell. Over the throttle valve, the gas produced by the plasma source in its controlled atmosphere was aspirated into the multi-pass cell. Figure 2 depicts the overall setup that has previously been used e.g., in [26].
The measurement captured a wavenumber range of 700 to 4000 cm−1, which allowed the detection of several nitrogen compounds such as nitric oxide (NO) and nitrous oxide (N2O) in addition to the expected most abundant species O3 and NO2 in the far-field. Consequently, an unexpected generation of byproducts in concentrations above the qualitative detection limit around 5 × 10 12 cm 3 can be detected as well. The limit for a sound quantitative analysis in the measurement system is in the range of 1 × 10 13 cm 3 . Density values were calculated by fitting reference spectra from the HITRAN database [27] using the absorbance function
A F T I R = ln I ( ν ) I 0 ( ν ) = i n i σ i ( ν ) L .

3. Results

The discharge dynamics are examined by electrical characterization in the following section. Basic electrical characteristics of the setup shown in Figure 1 are presented in Figure 3. The observed current pulses show an asymmetric current signal that is typical for this measurement setup consisting of three electrodes [11]. Due to the applied sinusoidal voltage ( U app = 9.0 kV pp ), the generated charge carriers are separated. The ions accumulate on the surface of the cathode, the electrons on surface of the anode. As a result, an electric field is generated that counteracts the external field generated by the voltage (up to #1 in Figure 3). As the external applied voltage decreases, the internal electric field causes the discharge in the capillary. A fast current peak of I 1 = 2.1 mA and a duration of 1.5 μ s is observed at the grounded ring electrode (#1 in Figure 3). This leads to further ionization of the helium gas, which flows through the capillary. The resulting ions partially recombine with surface charge carriers on the inner surface of the capillary. Another part of the ions is accelerated by the internal electric field towards the grounded ring electrode. These ions accumulate on the capillary inside of the grounded ring electrode and partly diffuse to the capillary edge, which results in the formation of a plasma bullet. The bullet is accelerated by the electric field of the surface charge carriers towards the grounded counter electrode and impinge on the surface of the dielectric target. A current pulse of inverse polarity with a peak value of I 1 = 0.25 mA and a duration of 1 μ s is measured (#2 in Figure 3). A fast ’return stroke’, consisting of electrons, leads from the surface of the counter electrode to the capillary edge, leaving behind a charge channel for further ions [28,29].
Due to the steadily increasing input voltage and the resulting electric field, additional ions are deposited at the capillary edge, which initiates a further discharge to the dielectric. The discharge leads to a current drop of 0.7 mA with a duration of 3 μ s at the ring electrode (#3 in Figure 3). Similar to the previous discharge, a ’return stroke’ leads to compensation of ions and electrons between the capillary and the dielectric. As soon as the input voltage drops, the external electric field decreases. The electric field induced by the surface charge carriers leads to the acceleration of the electrons from the HV-electrode towards the ring electrode. A negative current peak of I 1 = 2.25 mA and a duration of 1.5 μ s is observed at the grounded ring electrode (#4 in Figure 3). The ions accelerate in the opposite direction. The electrons are further accelerated to the counter electrode leaving a charge channel, so that a backward bullet can be formed. Due to the negative current signal between 25 μ s and 45 μ s electrons diffuse to the counter electrode and restore the starting conditions [30].
The comparison of the discharge curves of the capacitors shows the charge transport across the plasma column (see Figure 3). The discharges within the capillary cause a change in the slope of the measured voltage U 1 (#1, #4 in Figure 3). A major change in voltage U 2 is observed when the bullet strikes the dielectric (#2’, #3’ in Figure 3). The charge transport is the key parameter for the power dissipated in the plasma P 1 and the power transmission to the counter electrode P 2 .
The power is determined by the enclosed area of the Lissajous figures calculated with the Gauss’s area formula (see Equation (1)). Examples of Lissajous figures for the grounded ring electrode using different dielectrics are shown in Figure 4. Lissajous figures on the counter electrode have a rounded rectangular shape (not shown here). Similar to the current signal, the voltage value is asymmetric due to the setup with three electrodes, which results in charge interaction between the dielectric and the capillary of the plasma source. As a result, nodal points can occur in the Lissajous figures for our setup. Therefore, the relative permittivity is a decisive influencing factor. While one obtains a continuous area for the Lissajous figure when applying the plasma to PE ( ϵ r , PE = 2.25 ), the number of nodes increases with increasing dielectric constant ( ϵ r , ZrO 2 = 22 , ϵ r , TiO 2 = 160 ). Each node correlates with a charge exchange process taking place and charges that are stored on the capillary being delivered to the counter electrode. With the increased number of nodes for increasing ϵ r , a decrease of the encircled area is observed, indicating a reduction in power at the ring electrode. When evaluating the curves in Figure 4 that contain nodes, one has to consider that automated routines as in Origin (Origin2018b, OriginLab Corporation, Northampton, MA, USA) generate negative area values that would stand for negative powers. To avoid these errors, the Gauss’s area formula was implemented to calculate the area under the curves.
In Figure 5, the measured dissipated power at the ring electrode and the counter electrode is shown for different applied voltages. Each curve represents one dielectric target at the counter electrode. With increasing voltage, the dissipated power at the ring electrode starts to rise until it reaches 2 kV (first grey bar). Above 2 kV, a drop in dissipated power is observed for each dielectric material followed by a rise up to 4 kV (second grey bar). Around a voltage of 4 kV, most dielectrics show a second drop in dissipated power at the ring electrode that correlates with a second inverse current pulse. Only for TiO 2 , which has the the highest ϵ r , this second drop was not observed within the operated voltage range.
Considering the dissipated power at the counter electrode shown in Figure 5, a weak increase is observed until 2 kV. Above 2 kV, correlating with the drop of the power at the ring electrode P 1 , a first strong increase in dissipated power at the counter electrode P 2 is observed. While the power at the ring electrode drops about 80 mW, the increase at the counter electrodes rises above 200 mW. With a further rise in voltage, the dissipated power increases nearly linearly again until around 4 kV; a second strong increase is observed for most dielectrics except for TiO 2 . One further observation is the increase of U app required for the second strong increase when increasing the dielectric permittivity.
A surface with a lower permittivity resembles a lower capacity and is charged within a shorter time frame compared to higher ϵ r . Once charged until a certain point, the local electrical field of the surface charges generate a counteracting electrical field negating the external electrical field from the setup. By further increasing the applied voltage U app , the external field is increased again until a further ignition is enabled considering memory effects and hence reduced ignition requirements (see #3 and #3’ in Figure 3). For higher ϵ r , a higher capacity has to be charged and the additional charges are distributed through surface ionization waves (SIWs) [10]. As a result of the longer charging time and increased spatial distribution through SIWs, the countering of the external electrical field requires a longer time frame and ultimately a higher U app for the second discharge signal.
While the dissipated power at the counter electrode seems to rise constantly, a saturation or limitation seems to occur at the discharge inside the capillary. Our previous investigation showed a similar saturation in the ‘core’ discharge in a different geometry at about 1 W [6]. In the present setup, the limit is between 130 mW and 160 mW depending on the dielectric target. One interpretation is a saturation of the charge accumulation on the dielectric capillary resembling a geometrical limitation [6]. Another reason for the limitation could be the additional induced electric field by the deposited charged that generates a second discharge channel (#3’ in Figure 3). As a result, a second conductive channel for charge exchange is formed, which has been previously measured [11,30].
Now, correlating the dissipated power with the species production by measuring the far-field densities shows a clear tendency towards an increased density by up to one order of magnitude for an applied voltage of 3.5 kV compared to 2 kV (Figure 6). For U app , off = 2 kV , species densities of O3 and NO2 do not exceed the quantitative detection limit of about 1 × 10 13 cm 3 , yet qualitative detection was possible in all cases (low densities). For U app , off = 3.5 kV , the O3 density increases with the increasing permittivity from 1 × 10 13 cm 3 up to 4 × 10 13 cm 3 while NO2 does not reach a quantitative detection limit of 1 × 10 13 cm 3 but was observed qualitatively again. Other species absorbing in the considered wavenumber range of 700 to 4000 cm−1 could not be detected.
Since the measurement is performed in the far-field post reactions of the produced species by e.g., working gas humidity, chamber humidity or flushing gas have to be considered when discussing the total densities. This humidity is a function of time and hence not fully negligible [31]. In the present setup, it was shown previously that humidity has a negligible effect on ozone densities in the FTIR measurements while NO2 densities might even increase with higher humidity [32].
Switching between a discharge with and without contact to the dielectric surface resembles the observation described for a different setup, where the two options are called low-power mode and high-power mode [33]. In our setup, the high-power mode seems stable and reproducible for an applied voltage of 2 kV and the low-power mode for values below 2 kV. Just above 2 kV, a phase transition occurs with a discharge towards the surface electrode in successive every fourth, third and second period before stabilizing for a discharge in every period. Another study called these modes bullet mode for in our case below 2 kV and continuous mode above 2 kV [34]. The chaotic mode was not observed in the present setup under our operating conditions despite similarities to literature [35]. However, initial indications of this mode were observed for lower helium supply quality, especially at higher voltages.

4. Discussion

In Figure 7, the power ratio of P 2 to P 1 is plotted against the dielectric permittivity of the surface for the two grey areas shown in Figure 5. The black triangles show the ratio for an applied voltage of 2 kV and the red triangles for 3.5 kV. From the power ratio with increasing permittivity, a clear tendency is observed for U app = 3.5 kV, while, at U app = 2 kV, the ratio stays constantly below 0.5; it increases steadily for U app = 3.5 kV with increasing ϵ r . The highest measured ratio is around 6.5 for TiO 2 , hence over six times more power is dissipated outside the capillary then inside.
The different ratios show the influence of the dielectric permittivity of the target on the distribution of power between the inside and outside of the capillary. For any application, this could impact the effectivity of the device, since an increase or decrease in power dissipation scales with the production of e.g., ions, emission or reactive species (see Figure 6) and thereby the impact on a surface. The effect of this feature on plasma parameters like electron temperature is an exciting topic for future investigations with this setup. First, results on fundamental plasma parameters show no significant impact in the gap but rather near and on the surface [15]. In addition, modeling results indicate an order of magnitude increase in reactive species densities in the gap [10]. In the far-field, however, we measured an increase of half an order of magnitude O3 density.
While the overall ratio of dissipated power at the grounded counter electrode P 2 to the grounded ring electrode, P 1 grows for increasing dielectric constant of the surface (Figure 7), the input plasma power P plasma remains roughly constant for the investigated range of dielectric materials. However, the effluent power P effluent drops visibly for TiO 2 . If the identical setup is operated with a blank copper electrode as grounded counter electrode P plasma is doubled, a similar P 2 / P 1 ratio for TiO 2 is recorded. The power dissipation onto a copper target should be most efficient ( ϵ r = ), while the dissipation into the effluent is still within the range of all investigated dielectric targets.
In Table 1, we noted the values for the dielectric permittivity. Considering Figure 7 and the impact of the permittivity, the value itself has to be questioned. For lower permittivities, the values differ only slightly in literature (e.g., quartz from 3 to 6), while, for ZrO 2 , values from distributors already vary between 20 and 29. For TiO 2 , the permittivity strongly depends on the orientation and can vary from 90 up to 180. For our investigations, the exact properties of the dielectrics could not be provided by the manufacturer. Therefore, the fit presents a first interpretation to the best of our knowledge. Nonetheless, the overall tendency of an increased ratio P 2 / P 1 with increasing permittivity prevails.
In addition to the investigated dielectrics, an interpolation fit was performed to pinpoint targets of high importance for the exemplary field of plasma medicine and also for coatings of different dielectric samples. By including E . c o l i , tissue and water in the graph different power ratios should be expected from 1.0 for E . c o l i ( P 2 = 75 mW) up to 4.5 for tissue ( P 2 = 250 mW) and 5.0 for water ( P 2 = 275 mW). In addition, the interpolation for the O3 densities shows an increase from E . c o l i with n O 3 = 1.8 × 10 13 cm 3 to water and tissue around n O 3 = 3.5 × 10 13 cm 3 . Hence, the application of a plasma device on a Petri dish with E . c o l i might differ from the application on a tissue sample. How much the humid surrounding of E . c o l i within a Petri dish will impact this ratio is another topic to consider in this context. The operation of the device in the low power mode will prevent this influence while reducing the performance. Standardization and comparability are topics for advancing research and application for plasma devices of the same or even different types [36,37]. At this point, the effect of a surface on a plasma device is far from understood or even controlled.
Although an extrapolation could provide values for e.g., E . c o l i , tissue and water, it has to be taken into account that this investigation has a set of parameters such as the distance between device and surface predetermined. The distance, however, is subject to constant change under application conditions, which can lead to changes between low power mode and high power mode. An increase in distance requires an adaptation of applied voltage to lock an operation mode. We hope to raise awareness in the scientific community for the impact of the surface positioning and properties on a plasma device.

5. Conclusions

The interaction of an atmospheric pressure plasma jet with different dielectric surfaces is investigated in this study. By evaluating discharge characteristics and dissipated power inside the jet P 1 and between the jet and the surface P 2 , the effect of the dielectric permittivity on the plasma performance is observed for different applied voltages at a fixed distance. The evaluated voltage-charge plots revealed several nodal points unknown in literature. Measuring the power P 1 and P 2 while increasing the voltage revealed two different operation modes described in the literature as
  • low power mode—the discharge ignites mainly inside the capillary not touching the surface
  • high power mode—the discharge reaches the surface, a return stroke and a secondary channel are created.
While the low power mode has no power dissipation at the surface ( P 2 around zero), the high power mode dissipates power at the dielectric surface ( P 2 = 50 mW to 300 mW). It was observed that the amplitude of P 2 rises with the applied voltage U app and the permittivity ϵ r , while P 1 increases as well but not as intensely as P 2 . The increase of power dissipation indicates an increase of energy, since the time characteristics stay constant. For the dissipated power P 1 , a saturation at 160 mW is indicated, which is interpreted as a geometrical dissipation restriction. In addition, O3 and NO2 were qualitatively observed for both modes, while only O3 was quantitatively measured for the high power mode ( n O 3 = 1 × 10 13 cm 3 to 4 × 10 13 cm 3 ).
For each mode, the power ratio of P 2 to P 1 is evaluated for different ϵ r , revealing a more efficient power dissipation at the target surface with increasing permittivity and a constant plasma power P plasma . This correlates with an increase of O3 densities from 1 × 10 13 cm 3 up to 4 × 10 13 cm 3 . In addition, the implication for medical application is stated by interpolating the expected power input onto a target surface consisting of either E . c o l i , tissue or water. In an application case, a target change from E . c o l i to tissue would result in an increase in power dissipation of four times when operating the device in the high power mode.

Author Contributions

Conceptualization, T.T. and T.G.; methodology, T.T. and R.B.; software, T.T. and R.B.; validation, T.T. and T.G.; formal analysis, T.T.; investigation, T.T. and T.G.; resources, T.G. and K.-D.W.; data curation, T.T.; writing—original draft preparation, T.T. and T.G.; writing—review and editing, T.T. and T.G.; visualization, T.G. and K.-D.W.; supervision, K.-D.W.; project administration, K.-D.W.; funding acquisition, T.G. and K.-D.W.

Funding

The authors acknowledge the funding from the Ministry of Education, Science and Culture of the State of Mecklenburg-Western Pomerania and European Union, European Social Fund, Grant Nos. AU 11 038; ESF/IV-BM-B35-0010/13; AU 15 001.

Acknowledgments

The authors acknowledge the technical assistance from Peter Holtz and Christiane Meyer as well as Ronny Brandenburg for fruitful discussions.

Conflicts of Interest

The authors declare no conflict of interest. The funders had no role in the design of the study; in the collection, analyses, or interpretation of data; in the writing of the manuscript, or in the decision to publish the results.

References

  1. Bruggeman, P.; Brandenburg, R. Atmospheric pressure discharge filaments and microplasmas: Physics, chemistry and diagnostics. J. Phys. D Appl. Phys. 2013, 46, 464001. [Google Scholar] [CrossRef]
  2. Winter, J.; Brandenburg, R.; Weltmann, K.D. Atmospheric pressure plasma jets: An overview of devices and new directions. Plasma Sources Sci. Technol. 2015, 24, 064001. [Google Scholar] [CrossRef]
  3. Setsuhara, Y. Low-temperature atmospheric-pressure plasma sources for plasma medicine. Arch. Biochem. Biophys. 2016, 605, 3–10. [Google Scholar] [CrossRef] [PubMed]
  4. Lu, X.; Naidis, G.; Laroussi, M.; Reuter, S.; Graves, D.; Ostrikov, K. Reactive species in non-equilibrium atmospheric-pressure plasmas: Generation, transport, and biological effects. Phys. Rep. 2016, 630, 1–84. [Google Scholar] [CrossRef] [Green Version]
  5. Lu, X.; Laroussi, M.; Puech, V. On atmospheric-pressure non-equilibrium plasma jets and plasma bullets. Plasma Sources Sci. Technol. 2012, 21, 034005. [Google Scholar] [CrossRef]
  6. Gerling, T.; Brandenburg, R.; Wilke, C.; Weltmann, K.D. Power measurement for an atmospheric pressure plasma jet at different frequencies: Distribution in the core plasma and the effluent. Eur. Phys. J. Appl. Phys. 2017, 78, 10801. [Google Scholar] [CrossRef]
  7. Reuter, S.; von Woedtke, T.; Weltmann, K.D. The kINPen—A review on physics and chemistry of the atmospheric pressure plasma jet and its applications. J. Phys. D Appl. Phys. 2018, 51, 233001. [Google Scholar] [CrossRef]
  8. Weltmann, K.D.; von Woedtke, T. Plasma medicine current state of research and medical application. Plasma Phys. Control. Fusion 2017, 59, 014031. [Google Scholar] [CrossRef]
  9. Sretenović, G.B.; Krstić, I.B.; Kovačević, V.V.; Obradović, B.M.; Kuraica, M.M. Spatio-temporally resolved electric field measurements in helium plasma jet. J. Phys. D Appl. Phys. 2014, 47, 102001. [Google Scholar] [CrossRef]
  10. Norberg, S.A.; Johnsen, E.; Kushner, M.J. Helium atmospheric pressure plasma jets touching dielectric and metal surfaces. J. Appl. Phys. 2015, 118, 013301. [Google Scholar] [CrossRef]
  11. Gerling, T.; Wild, R.; Nastuta, A.V.; Wilke, C.; Weltmann, K.D.; Stollenwerk, L. Correlation of phase resolved current, emission and surface charge measurements in an atmospheric pressure helium jet. Eur. Phys. J. Appl. Phys. 2015, 71, 20808. [Google Scholar] [CrossRef]
  12. Guaitella, O.; Sobota, A. The impingement of a kHz helium atmospheric pressure plasma jet on a dielectric surface. J. Phys. D Appl. Phys. 2015, 48, 255202. [Google Scholar] [CrossRef]
  13. Kone, A.; Sainct, F.P.; Muja, C.; Caillier, B.; Guillot, P. Investigation of the Interaction between a Helium Plasma Jet and Conductive (Metal)/Non-Conductive (Dielectric) Targets. Plasma Med. 2017, 7, 333–346. [Google Scholar] [CrossRef]
  14. Wang, R.; Xu, H.; Zhao, Y.; Zhu, W.; Ostrikov, K.K.; Shao, T. Effect of dielectric and conductive targets on plasma jet behaviour and thin film properties. J. Phys. D Appl. Phys. 2019, 52, 074002. [Google Scholar] [CrossRef]
  15. Klarenaar, B.L.M.; Guaitella, O.; Engeln, R.; Sobota, A. How dielectric, metallic and liquid targets influence the evolution of electron properties in a pulsed He jet measured by Thomson and Raman scattering. Plasma Sources Sci. Technol. 2018, 27, 085004. [Google Scholar] [CrossRef]
  16. Kovačević, V.V.; Sretenović, G.B.; Slikboer, E.; Guaitella, O.; Sobota, A.; Kuraica, M.M. The effect of liquid target on a nonthermal plasma jet—Imaging, electric fields, visualization of gas flow and optical emission spectroscopy. J. Phys. D Appl. Phys. 2018, 51, 065202. [Google Scholar] [CrossRef]
  17. Slikboer, E.; Sobota, A.; Guaitella, O.; Garcia-Caurel, E. Imaging axial and radial electric field components in dielectric targets under plasma exposure. J. Phys. D Appl. Phys. 2018, 51, 115203. [Google Scholar] [CrossRef]
  18. Norberg, S.A.; Parsey, G.M.; Lietz, A.M.; Johnsen, E.; Kushner, M.J. Atmospheric pressure plasma jets onto a reactive water layer over tissue: Pulse repetition rate as a control mechanism. J. Phys. D Appl. Phys. 2019, 52, 015201. [Google Scholar] [CrossRef]
  19. Sobota, A.; Guaitella, O.; Sretenović, G.B.; Kovačević, V.V.; Slikboer, E.; Krstić, I.B.; Obradović, B.M.; Kuraica, M.M. Plasma-surface interaction: Dielectric and metallic targets and their influence on the electric field profile in a kHz AC-driven He plasma jet. Plasma Sources Sci. Technol. 2019, 28, 045003. [Google Scholar] [CrossRef]
  20. Ivers-Tiffée, E.; von Münch, W. Werkstoffe der Elektrotechnik; Springer: Berlin, Germany, 2007. [Google Scholar]
  21. Gabriel, S.; Lau, R.W.; Gabriel, C. The dielectric properties of biological tissues: III. Parametric models for the dielectric spectrum of tissues. Phys. Med. Biol. 1996, 41, 2271–2293. [Google Scholar] [CrossRef] [PubMed] [Green Version]
  22. Esteban-Ferrer, D.; Edwards, M.A.; Fumagalli, L.; Juárez, A.; Gomila, G. Electric Polarization Properties of Single Bacteria Measured with Electrostatic Force Microscopy. ACS Nano 2014, 8, 9843–9849. [Google Scholar] [CrossRef] [PubMed]
  23. Manley, T.C. The Electric Characteristics of the Ozonator Discharge. Trans. Electrochem. Soc. 1943, 84, 83–96. [Google Scholar] [CrossRef]
  24. Braden, B. The Surveyor’s Area Formula. Coll. Math. J. 1986, 17, 326–337. [Google Scholar] [CrossRef]
  25. Ashpis, D.; Laun, M.; Griebeler, E. Progress toward Accurate Measurements of Power Consumption of DBD Plasma Actuators. In Proceedings of the 50th AIAA Aerospace Sciences Meeting Including the New Horizons Forum and Aerospace Exposition, Nashville, TN, USA, 9–12 January 2012. [Google Scholar]
  26. Schmidt-Bleker, A.; Bansemer, R.; Reuter, S.; Weltmann, K.D. How to produce an NOx- instead of Ox-based chemistry with a cold atmospheric plasma jet. Plasma Process. Polym. 2016, 13, 1120–1127. [Google Scholar] [CrossRef]
  27. Gordon, I.E.; Rothman, L.S.; Hill, C.; Kochanov, R.V.; Tan, Y.; Bernath, P.F.; Birk, M.; Boudon, V.; Campargue, A.; Chance, K.V.; et al. The HITRAN2016 molecular spectroscopic database. J. Quant. Spectrosc. Radiat. Transf. 2017, 203, 3–69. [Google Scholar] [CrossRef]
  28. Sigmond, R.S. The residual streamer channel: Return strokes and secondary streamers. J. Appl. Phys. 1984, 56, 1355–1370. [Google Scholar] [CrossRef]
  29. Gerling, T.; Nastuta, A.V.; Bussiahn, R.; Kindel, E.; Weltmann, K.D. Back and forth directed plasma bullets in a helium atmospheric pressure needle-to-plane discharge with oxygen admixtures. Plasma Sources Sci. Technol. 2012, 21, 034012. [Google Scholar] [CrossRef]
  30. Wild, R.; Gerling, T.; Bussiahn, R.; Weltmann, K.D.; Stollenwerk, L. Phase-resolved measurement of electric charge deposited by an atmospheric pressure plasma jet on a dielectric surface. J. Phys. D Appl. Phys. 2014, 47, 042001. [Google Scholar] [CrossRef]
  31. Winter, J.; Wende, K.; Masur, K.; Iseni, S.; Dünnbier, M.; Hammer, M.U.; Tresp, H.; Weltmann, K.D.; Reuter, S. Feed gas humidity: A vital parameter affecting a cold atmospheric-pressure plasma jet and plasma-treated human skin cells. J. Phys. D Appl. Phys. 2013, 46, 295401. [Google Scholar] [CrossRef]
  32. Hansen, L.; Schmidt-Bleker, A.; Bansemer, R.; Kersten, H.; Weltmann, K.D.; Reuter, S. Influence of a liquid surface on the NOx production of a cold atmospheric pressure plasma jet. J. Phys. D Appl. Phys. 2018, 51, 474002. [Google Scholar] [CrossRef]
  33. Sobota, A.; Guaitella, O.; Rousseau, A. The influence of the geometry and electrical characteristics on the formation of the atmospheric pressure plasma jet. Plasma Sources Sci. Technol. 2014, 23, 025016. [Google Scholar] [CrossRef]
  34. Walsh, J.L.; Iza, F.; Janson, N.B.; Law, V.J.; Kong, M.G. Three distinct modes in a cold atmospheric pressure plasma jet. J. Phys. D Appl. Phys. 2010, 43, 075201. [Google Scholar] [CrossRef]
  35. Walsh, J.L.; Iza, F.; Janson, N.B.; Kong, M.G. Chaos in atmospheric-pressure plasma jets. Plasma Sources Sci. Technol. 2012, 21, 034008. [Google Scholar] [CrossRef]
  36. Golda, J.; Held, J.; Redeker, B.; Konkowski, M.; Beijer, P.; Sobota, A.; Kroesen, G.; Braithwaite, N.S.J.; Reuter, S.; Turner, M.M.; et al. Concepts and characteristics of the COST Reference Microplasma Jet. J. Phys. D Appl. Phys. 2016, 49, 084003. [Google Scholar] [CrossRef]
  37. Mann, M.S.; Tiede, R.; Gavenis, K.; Daeschlein, G.; Bussiahn, R.; Weltmann, K.D.; Emmert, S.; von Woedtke, T.; Ahmed, R. Introduction to DIN-specification 91315 based on the characterization of the plasma jet kINPen® MED. Clin. Plasma Med. 2016, 4, 35–45. [Google Scholar] [CrossRef]
Figure 1. Experimental setup of the discharge device, including the electrical circuit and the dimensions of the electrode placement. The variables in this study are the applied voltage U app and the dielectric constant ϵ r of the external dielectric surface.
Plasma 02 00027 g001
Figure 2. Fourier-transform infrared spectroscopy setup used to measure absolute densities of O 3 and NO 2 . GCC is the gas collector cell and MPC is the multi-pass cell.
Plasma 02 00027 g002
Figure 3. Current and voltage characteristics of the discharge in helium with SiO 2 as dielectric target ( U appl = 9.0 kV pp , d T = 6 mm). 1–4 and 1’–4’ mark characteristic events.
Plasma 02 00027 g003
Figure 4. Q–V-plot for representative dielectric targets and copper target with an applied voltage offset U app , off = 4.0 kV between each dielectric ( d T = 6 mm).
Plasma 02 00027 g004
Figure 5. Dissipated power P i ( ϵ r ) for (a) grounded ring electrode (i = 1) and (b) grounded surface electrode (i = 2) at different applied voltages ( d T = 6 mm).
Plasma 02 00027 g005
Figure 6. Measured O3 (filled data points) and NO2 (open data points) densities for each dielectric target and voltage amplitudes of 2 kV (black points) and 3.5 kV (red points), d T = 6 mm. The qualitative detection limit of the species fit is inserted at 1 × 10 13 cm 3 . The fit includes only values above the qualitative detection limit.
Plasma 02 00027 g006
Figure 7. (Top) ratio of dissipated power at the target electrode (2) and the ring electrode (1) for voltage amplitudes of 2 kV and 3.5 kV. In addition, the expected values for a target electrode consisting of E . c o l i , tissue or water are extrapolated. (Bottom) the plasma power and the effluent power from Equations (4) and (5) are presented for voltage amplitudes of 2 kV and 3.5 kV, d T = 6 mm.
Plasma 02 00027 g007
Table 1. Dielectric materials used in this study with dielectric constant, polarization effects and sample values for water, tissue and E . c o l i . EP—electronic polarization, IP—ionic polarization, DP—dipolar polarization [20]. *** indicates no available information on polarization effects.
DielectricPE SiO 2 B270 Al 2 O 3 ZrO 2 TiO 2 H 2 O TissueE. coli
Permittivity2.254.37,09,02216080606.5
PolarizationEP, IPEP, IPEP, IPEP, IP, DPEP, IP, DPEP, IP, DPEP, IP, DP******

