Abstract
Fine powders of mixed gadolinium tantalum niobates doped with Eu, Sm, Tb, and Er were synthesized. Ceramic samples of polycomponent solid solutions of Gd0.96Eu0.01Sm0.01Tb0.01Er0.01Nb0.9Ta0.1O4 were obtained from synthesized powders using conventional sintering technology. The phase composition and phase structure characteristics of the Gd0.96Eu0.01Sm0.01Tb0.01Er0.01Nb0.9Ta0.1O4 ceramic phases were determined by XRD. The effect of ceramic sintering temperature on the physical characteristics of Gd0.96Eu0.01Sm0.01Tb0.01Er0.01Nb0.9Ta0.1O4 solid solutions is shown. The morphological features of the microstructure of the Gd0.96Eu0.01Sm0.01Tb0.01Er0.01Nb0.9Ta0.1O4 ceramics were studied in relation to its mechanical characteristics. At the same time, the strength characteristics (Young’s modulus, microhardness) and the critical stress intensity factor for mode I KIC were evaluated for the first time for the synthesized compounds. Photoluminescence and cathodoluminescence were studied in the visible region. The study confirms the potential application of Gd0.96Eu0.01Sm0.01Tb0.01Er0.01Nb0.9Ta0.1O4 ceramic solid solutions as scintillators and radioluminescent light sources.
1. Introduction
Improving the characteristics of luminescent materials is an urgent task; high-energy radiation is converted into visible light in such materials. These materials are used in dosimetry, medical diagnostics, and space research [1,2]. Applications necessitate both the search for new materials and the enhanced study of their physical properties. First luminescent materials and scintillators CsI(Tl), CsI(Na), and NaI(Tl) were well studied in the middle of the last century. They have a high optical output, but today their application is strongly limited because they also exhibit high hygroscopicity, and low chemical and radiation resistance. Oxide single crystals with high chemical and thermal resistance, such as Y3Al5O12 and YAlO3, activated with trivalent RE ions (Pr, Eu, Tb, Er) are the most prospective materials applied in aggressive media and at high temperatures. However, they are brittle and inapplicable under direct mechanical impact or overload [1]. The increasingly difficult operating conditions (aggressive chemical environments, high temperature and humidity, mechanical impacts and overloads) increase the requirements, including those of the material’s mechanical characteristics. These characteristics determine the usability and service life of fluorescence detectors. One of the characteristics is deformation resistance; this is related to the strength, hardness, and density of materials.
Mixed ceramic solid solutions (SSs) based on ReMO4-type compounds (where M = Nb, Ta, and Re = Gd, Y, Yb) are of great interest. Energy can exchange in such materials between the luminescence centers of the crystalline matrix (MO4 groups, M—Nb, Ta). Moreover, a significant increase in the blue-green emissivity of the material is observed at certain ratios of NbO4- and TaO4 complexes in GdNb1−xTaxO4 SSs [3,4]. The spectral region of emission of luminescent materials based on ReMO4 compounds depends on the type of REE of the ceramic matrix (Gd, Y, Yb), as well as on doping with other REEs [5,6,7,8]. The energy transfer can occur in such materials between the emission of luminescence centers of MO4 groups and REEs with intracenter luminescence (Eu3+, Tb3+, Er3+, Sm3+) [8,9,10,11,12,13].
In this case, the range of luminescent properties can be expanded by further complicating the ReNb1−xTaxO4 SSs by increasing the number of components. The synthesis of such multicomponent systems using nitrate solutions of REE and ultrafine hydroxides of niobium and tantalum has a number of significant advantages over solid-phase synthesis of such multicomponent systems [14]. The method homogenizes the reaction mixture at the molecular level. As a result, submicron and nanosized powders are obtained [15]. These powders provide the possibility of obtaining dense homogeneous materials with good mechanical characteristics at an optimal sintering temperature. For example, ceramics and thin films can be obtained [16,17,18,19]. High density and uniformity significantly increase the efficiency of luminescent materials, increasing the intensity of the glow due to their greater structural uniformity [3].
It should be noted that the literature provides limited works on the study of the mechanical characteristics of luminescent ceramics based on gadolinium tantalum niobates obtained by various synthesis methods. For example, the authors of [20,21,22] studied, in detail, the mechanical properties of RENbO4 and RETaO4 (RE = Y, La, Nd, Sm, Gd, Dy, Yb) ceramics synthesized by a high-temperature solid-state reaction. The RENbO4 characteristics measured by the nanoprobe method have the following values: Young’s modulus, 60–170 GPa; maximum hardness, 11.48 GPa. The values indicate a sufficiently high resistance of RENbO4 ceramics to destruction. Thus, we believe that the study of the mechanical characteristics of ceramics Gd0.96Eu0.01Sm0.01Tb0.01Er0.01Nb0.9Ta0.1O4 obtained using nitrate solutions of REE and ultrafine hydroxides of niobium and tantalum is relevant.
The goals of the study are to achieve the synthesis of polycomponent SSs Gd0.96Eu0.01Sm0.01Tb0.01Er0.01Nb0.9Ta.0.1O4 and determine how temperature treatment conditions influence their structural, mechanical, and luminescent characteristics.
2. Materials and Methods
Ultrafine powders of multicomponent SSs Gd0.96Eu0.01Sm0.01Tb0.01Er0.01Nb0.9Ta.0.1O4 were synthesized using nitrate solutions of REE and ultrafine hydroxides of niobium and tantalum. High-purity fluoride Nb and Ta-containing solutions were obtained by dissolving Nb2O5 (99.9) and Ta2O5 (99.9) oxides (Solikamsk Magnesium Plant, Solikamsk, Russia) in HF (99.9 (not more than 10−5 of 27 impurities), Komponent-reaktiv Ltd., Moscow, Russia). Solutions were taken in volumes corresponding to the given value of Nb and Ta. Niobium and tantalum hydroxides were co-precipitated by ammonia (25% NH4OH solution, 99.9 (no more than 10−5 of 23 impurities), Sigma Tek, Khimki, Russia) from these solutions at the first stage of the synthesis. Then, the mixture of niobium and tantalum hydroxides was washed with deionized water from NH4+ and F− ions and dried to a moisture content of 60–70% at 90 °C. The mixture was then mixed with Gd(NO3)3, Eu(NO3)3, Sm(NO3)3, Tb(NO3)3, Er(NO3)3 solutions in volumes that provide a given composition. The solutions were prepared by dissolving the corresponding oxides Gd2O3, Eu2O3, Sm2O3, Tb4O7, Er2O3 (99.9, Himkraft, Kaliningrad, Russia) in HNO3 (99.9 (no more than 10−4 of 18 impurities), Vekton Ltd., Saint Petersburg, Russia).
Next, ammonia was added to the resulting pulp and brought to ~pH 10. All processes were accompanied by constant stirring. The resulting hydrated precipitate was washed with deionized water at a ratio of solid and liquid phases S:VL = 1:3, dried at ~150 °C, and calcined at 700 °C for 4 h. Then, the powders were ground in a ball chalcedony mill. One part of the powder was calcined for 4 h at ~1200, and the other part was calcined for 2 h at ~1400 °C.
The content of niobium and tantalum in Nb- and Ta-containing fluoride solutions was determined by gravimetric method. The content of fluoride ions was determined by potentiometric method on ionomer EV-74 (Zavod izmeritel’nych priborov, Gomel’, Belarus) with an F-selective electrode EVL-1MZ (Zavod izmeritel’nych priborov, Belarus, Gomel’). Fluorine in the synthesized Gd0.96Eu0.01Sm0.01Tb0.01Er0.01Nb0.9Ta.0.1O4 powders was analyzed by pyrohydrolysis. Gd, Eu, Sm, Tb, Er in filtrates and strip solutions were determined by atomic emission spectrometry on an ICPE 9000 spectrometer (Shimadzu, Kyoto, Japan) and by XRF on a Spectroscan MAKS-GV (Spectron, Saint Petersburg, Russia).
The phase compositions of the powders were determined by XRF on a diffractometer Shimadzu XRD-6000 (Shimadzu, Kyoto, Japan) with a counter speed of 1 deg·min−1 (CuKα radiation). Electron probe microanalysis (EPMA) and study of cathodoluminescence of Gd0.96Eu0.01Sm0.01Tb0.01Er0.01Nb0.9Ta.0.1O4 SSs were carried out on a Camebax electron probe microanalyzer (Cameca, Gennevilliers Cedex, France) equipped with four X-ray spectrometers and a cathodoluminescent station [23]. Cathodoluminescence spectra were excited with the electron beam with the following parameters: energy 20 keV, absorbed current 10 nA, electron beam diameter ~3 μm. Spectra were registered in the range 300–800 nm.
EPMA of Gd0.96Eu0.01Sm0.01Tb0.01Er0.01Nb0.9Ta.0.1O4 ceramics was carried out at accelerating voltage of 20 kV and an absorbed electron current of 5–10 nA, the diameter of the electron beam was 5 μm. Metal niobium and tantalum with purity of 99.99 were chosen as etalons. Stoichiometric gadolinium orthophosphate GdPO4 was used as a reference sample for the determination of Gd content. Lα:Nb, Lα:Ta, and Lα:Gd were used as analytical lines. Oxygen content was calculated based on stoichiometric composition.
Wood’s metal was used to fix the ceramics in the sample cassette for research. The carbon film was additionally deposited on all samples using a JEE-4C universal vacuum station (Jeol, Tokyo, Japan) to ensure charge sink during the study on an electron probe microanalyzer.
The specific surface areas of the Gd0.96Eu0.01Sm0.01Tb0.01Er0.01Nb0.9Ta.0.1O4 powders were determined by the low-temperature nitrogen adsorption BET method, FlowSorbII 2300 and TriStar 3020 V1.03 (Micrometrics, Norcross, GA, USA).
Ceramic samples were made in the form of pellets with a diameter of 10 mm and a height of 2–3 mm from powders calcined at ~1200 °C and ~1400 °C. Polyvinyl alcohol was used as a binder. Tablets were pressed at a load of ~380 kg/cm2. The pellets were calcined in an electric furnace KEP 14/1400P (Termal, Tryokhgorny, Russia) at 1400 °C for 3 h and at 1500 °C for 2 h. A total of four types of Gd0.96Eu0.01Sm0.01Tb0.01Er0.01Nb0.9Ta.0.1O4 ceramic samples were obtained (Table 1).

Table 1.
Modes of preparation of Gd0.96Eu0.01Sm0.01Tb0.01Er0.01Nb0.9Ta.0.1O4 ceramic samples.
The phase composition and structure refinement of the Gd0.96Eu0.01Sm0.01Tb0.01Er0.01Nb0.9Ta.0.1O4 ceramic samples were performed on a diffractometer DRON-6 (SVETLANA, Russia, Saint Petersburg) under CuKα radiation in the angle scattering range of 5–145°, and a multifunctional X-ray diffractometer Rigaku (RIGAKU, Tokyo, Japan) with SmartLab Studio II software. The speed of the counter was 2 deg/min (CuKα radiation, scan range 6–90°). The ICDD databases (PDF 4, release 2022) were used to identify the phases. The structural characteristics of the phases were refined by the whole-powder-pattern fitting (WPPF) method of full-profile analysis of XRD patterns. The values of the profile R factors (Rp and Rwp) served as the criteria for the reliability of the obtained results. The factors were calculated using standard formulas.
The density of the ceramic samples Gd0.96Eu0.01Sm0.01Tb0.01Er0.01Nb0.9Ta0.1O4 was determined by hydrostatic weighing.
The microstructures of the Gd0.96Eu0.01Sm0.01Tb0.01Er0.01Nb0.9Ta0.1O4 ceramic samples were studied using a scanning electron microscope SEM LEO 420 (Carl Zeiss, Oberkochen, Germany) and analyzed using the program ScanMaster (National research nuclear university (MEPHI), Moscow Engineering Physics Institute, Moscow, Russia). The ScanMaster program is designed for the mathematical processing and measurement of such images.
The mechanical properties of Gd0.96Eu0.01Sm0.01Tb0.01Er0.01Nb0.9Ta0.1O4 ceramic samples were studied by the contact method using a probe microscope–nanohardness tester NanoSkan (FSBI TISNCM, Troitsk, Russia). The microhardness (H, GPa) of the samples was determined by comparative sclerometry: scratches are applied alternately on the material under study and the standard, the hardness of which is known [24]. Fused quartz sample was used as the standard of hardness; the sample was certified by the Russian State standard of hardness (GET 31-2006) in VNIIFTRI—State Scientific Center of the Russian Federation. Ceramics were scratched at different loads. The same probe with an indenter in the form of a trihedral diamond pyramid (Berkovich indenter) with a tip radius of ~50 nm was used for scratching and surface scanning. Since the forward movement of an acute angle during scratching with a Berkovich indenter is similar to extruding an indentation during the Vickers test, the model for the case of indentation with a Vickers pyramid was used for calculations [24,25]. The value of the hardness of the material under study was determined by the formula:
where P—the normal force with which the scratch was applied, expressed in Newtons, b—arithmetic mean of the scratch width, expressed in meters, k—indenter shape factor for a given scratch width. The parameter k was determined by scratching a standard surface with a known hardness and calculated by the formula:
where Hc—standard sample hardness.
H = k·(P/b2)
k = Hc·b2/P
Force spectroscopy was used to measure the absolute value of the ceramics Young’s modulus (E, GPa) [24,26,27]. The indenter oscillates in the direction normal to the sample surface with an amplitude of less than 10 nm and a frequency of ~12 kHz. This oscillating indenter touches the sample surface. A trihedral diamond pyramid with apex angle ~600 served as an indenter needle. The tip rounding radius was ~100 nm. The Young’s modulus and Poisson’s ratio of the needle used in the calculations were E = 1140 GPa and ν = 0.07, respectively. As a result of the interaction of the indenter with the material, the oscillation frequency of the probe increases as it is pressed against the surface. In accordance with the mathematical description based on the Hertz model, the slope of the dependence of the oscillation frequency on the depth of penetration (load–displacement curve) is proportional to the elastic modulus of the material under study [20,21]. The elasticity modulus was determined from the ratio of the slope angles of the load–displacement curves for the test and reference (standard) materials. For each sample, measurements were carried out on 10 random areas of 60 × 60 µm in size at 16 points, and the values of Young’s modulus were determined as an average value over all measurements.
Some of the studied Gd0.96Eu0.01Sm0.01Tb0.01Er0.01Nb0.9Ta0.1O4 ceramic samples were vacuum-annealed in order to establish the annealing effect on the features of the luminescent properties. Thermal vacuum treatment was carried out in the original installation developed in ICT RAS on the base of muffle tube furnace SUOL-0.4.4/12 (GRANAT, Moscow, Russia) with a vacuum system [27].
Photoluminescence spectra of samples of ceramic SSs Gd0.96Eu0.01Sm0.01Tb0.01Er0.01Nb0.9Ta0.1O4 were recorded using a SOL SL-100M spectrograph with a CCD detector FLI ML 1107 Black Illuminated (Hamamatsu PHOTONICS K.K., Hamamatsu City, Japan) in the visible region of the spectrum (380–800 nm). A He–Cd continuous laser (Kimmon KOHA, Fukushima, Japan) served as the excitation source (λex = 325 nm, 15 mW). A polarizing film was placed in front of the entrance slit of the monochromator to eliminate the spurious signal. The entrance slit of the monochromator was ~0.016 mm. The background signal was subtracted from each photoluminescence spectrum.
3. Results and Discussion
The ICP-AES results show that the strip solutions and filtrates contained only traces of Gd, Eu, Sm, Tb, and Er. This means that under selected conditions, REEs almost completely transit from Gd(NO3)3, Eu(NO3)3, Sm(NO3)3, Tb(NO3)3, Er(NO3)3 solutions to hydroxide precipitate. The XRF confirmed that Gd, Eu, Sm, Tb, and Er content in the powder samples corresponded to calculated values; the error does not exceed 2%. The fluorine concentrations in the powders were below the detection limit of the method used (i.e., less than 1 × 10⁻³ wt%). The specific surface areas of the powders were 0.57 m2/g (calcination at 1200 °C) and 0.25 m2/g (calcination at 1400 °C).
Table 2 demonstrates the EPMA results. A Nb/Ta ratio corresponds to that given within the method error (the relative error is 2%). The relative error for REE elements is higher because it is difficult to determine small concentrations (the relative error can reach 10%). The concentrations of most REEs in Gd0.96Eu0.01Sm0.01Tb0.01Er0.01Nb0.9Ta.0.1O4 ceramic samples were somewhat smaller than planned.
Table 2.
Element composition of Gd0.96Eu0.01Sm0.01Tb0.01Er0.01Nb0.9Ta.0.1O4 ceramic samples. The values are given in formulae units.
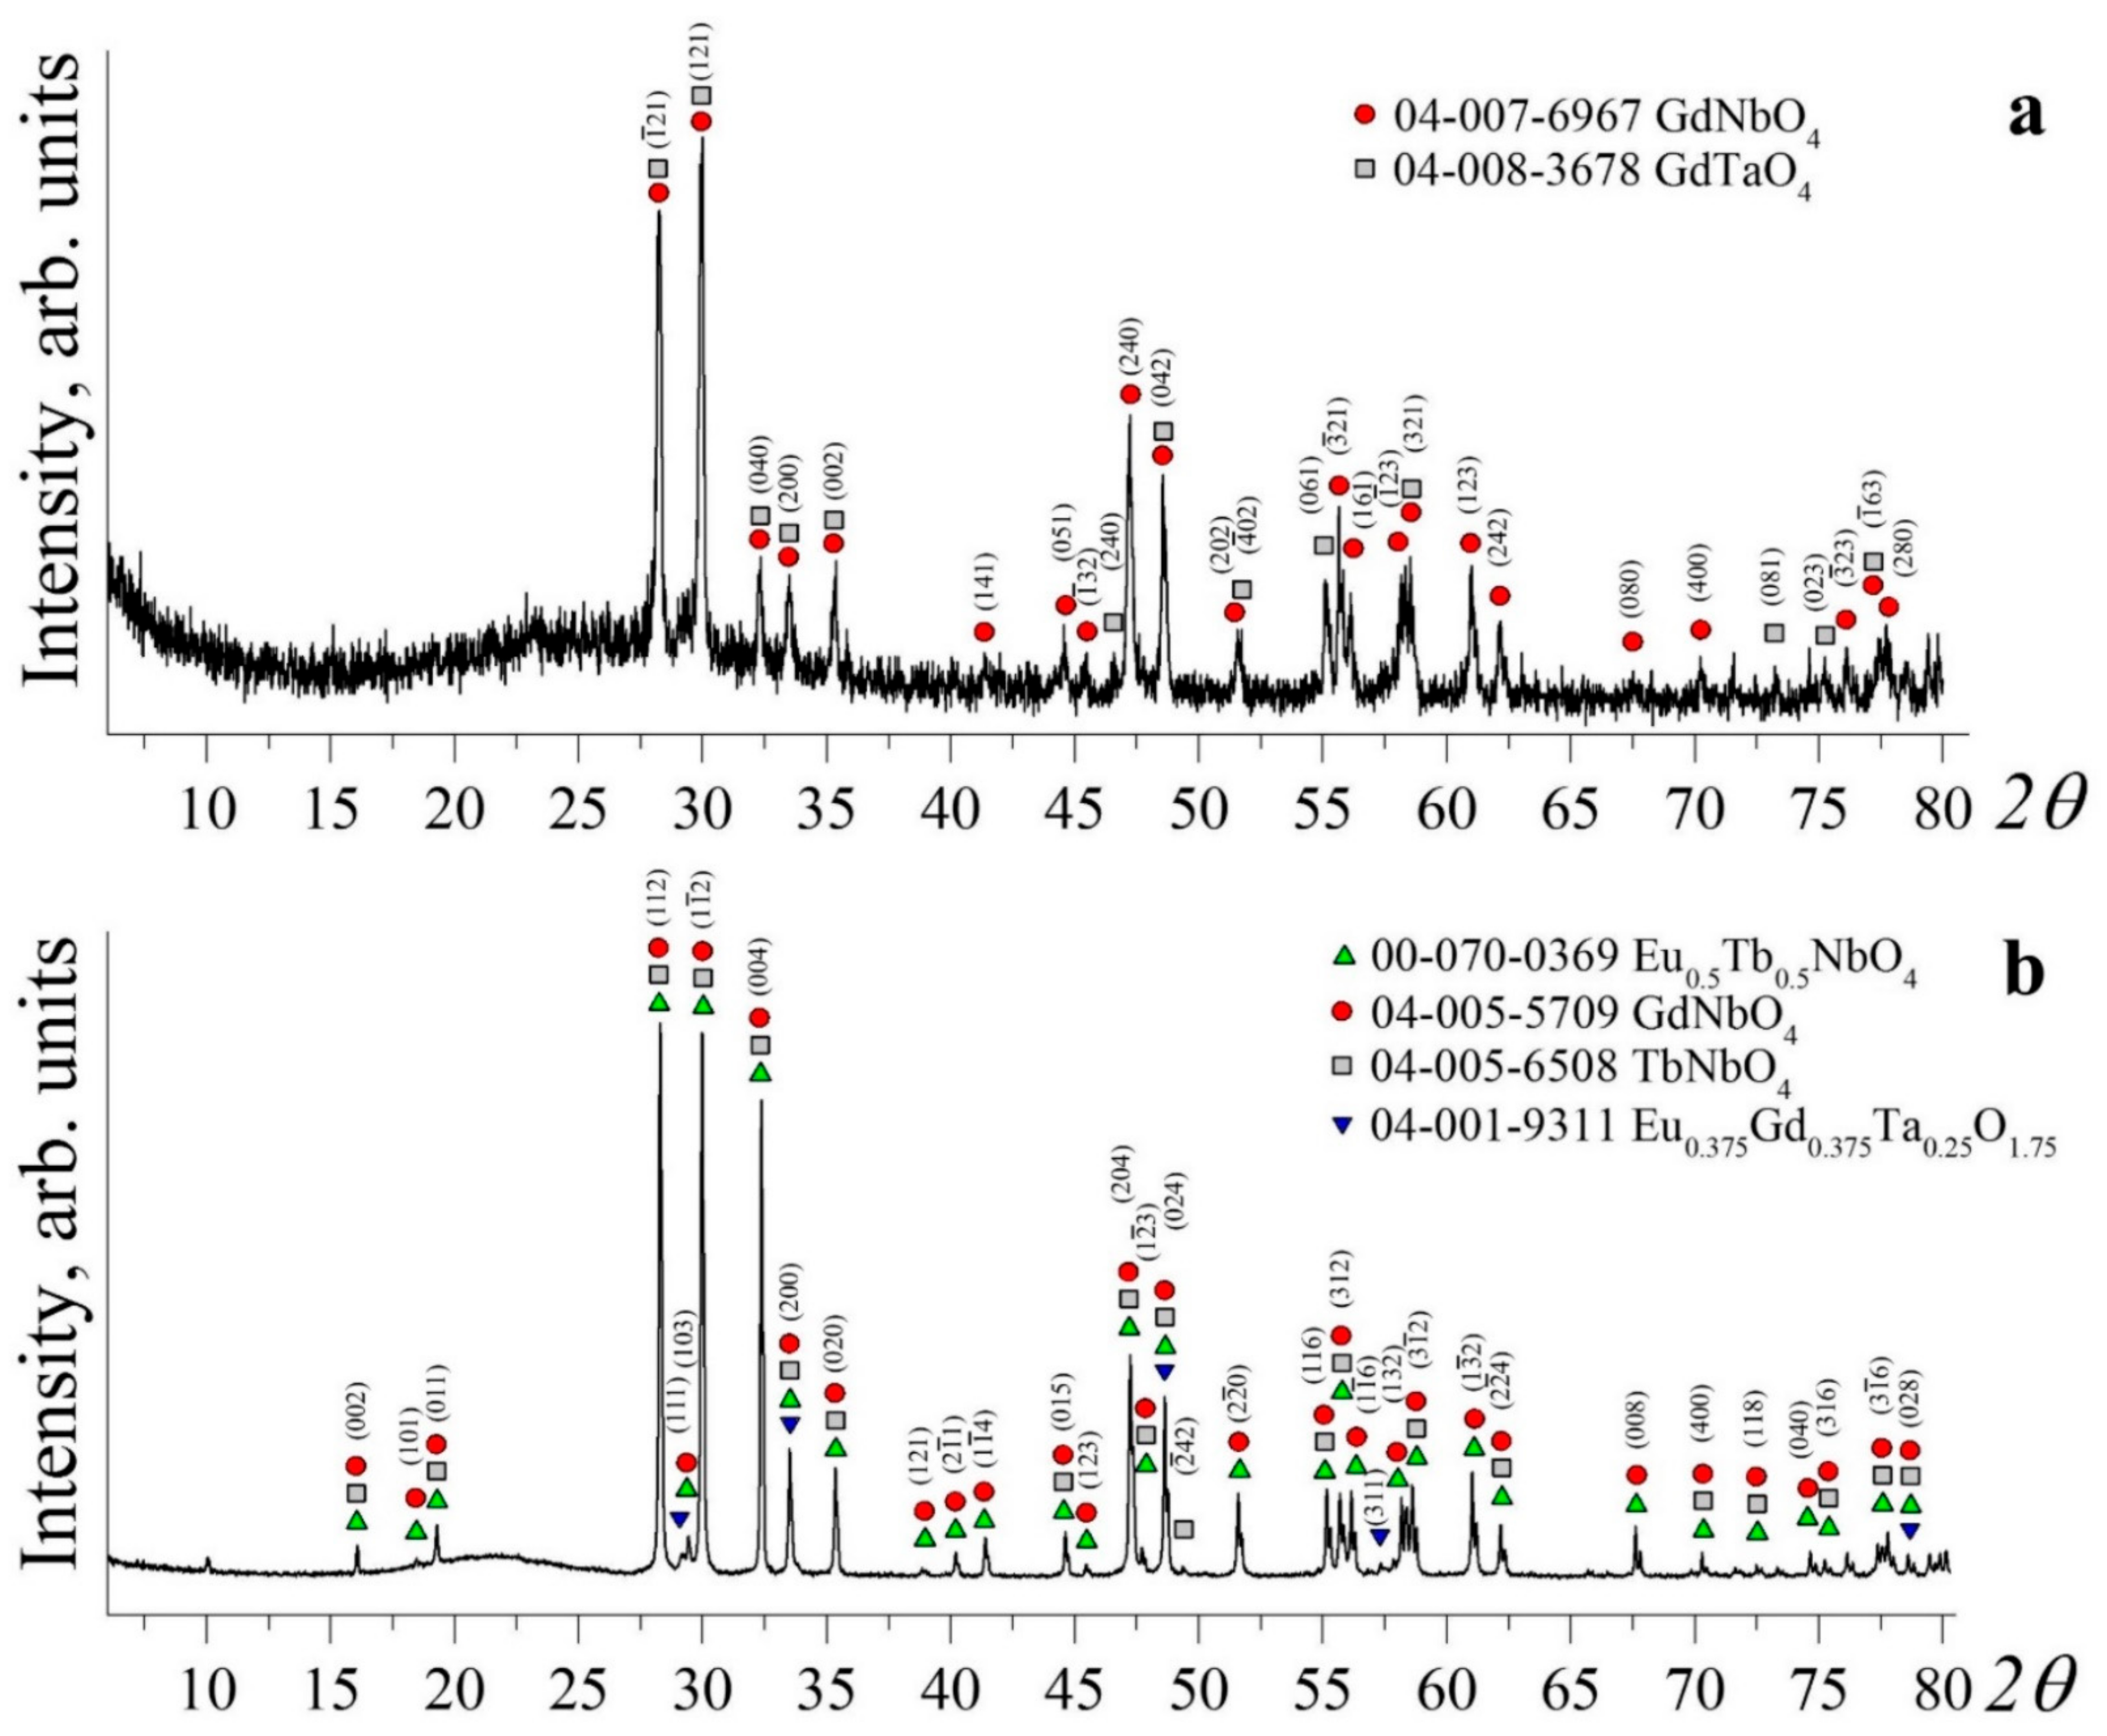
Figure 1 demonstrates the XRD patterns of Gd0.96Eu0.01Sm0.01Tb0.01Er0.01Nb0.9Ta.0.1O4 ceramic samples with the refinement of probable phases. Note: Figure 1 only demonstrates XRD patterns of samples 2 and 4. XRD patterns of samples 1 and 3 are similar to those of samples 2 and 4. Data given in some considered ICDD cards can be found in [28,29,30,31].
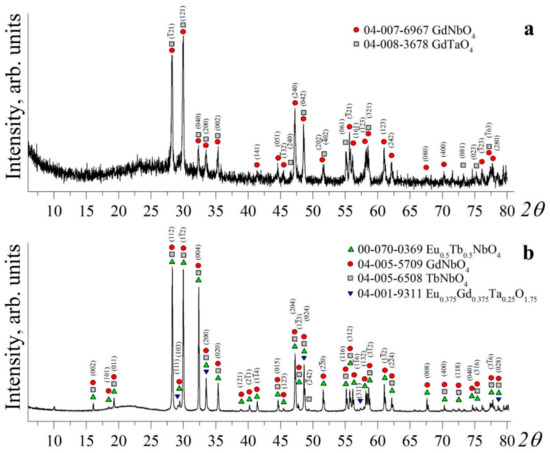
Figure 1.
XRD patterns of Gd0.96Eu0.01Sm0.01Tb0.01Er0.01Nb0.9Ta.0.1O4 ceramic samples with the refinement of probable phases. (a) Sample 2: ●—reflections corresponding to the monoclinic phase of GdNbO4 with the I2/a space group (ICDD Card 04-007-6967); ■—reflections corresponding to the monoclinic phase of GdNbO4 with the C2/c space group (ICDD Card 04-008-3678). (b) Sample 4: ▲—reflections corresponding to the monoclinic phase of (Eu0.5Tb0.5)NbO4 with the I2/b(15) space group (card 00-070-0369); ●—reflections corresponding to the monoclinic phase of GdNbO4 with the C2/c space group (card 04-005-5709); ■—reflections corresponding to the monoclinic phase of GdNbO4 with the C2/c(15) space group (card 04-005-6508); ▼—reflections corresponding to the cubic phase Eu0.375Gd0.375Ta0.25O1.75 with the Fm-3m (225) space group (Card 04-001-9311).
The WPPF analysis revealed that the structures of samples 1 and 2 (Gd0.96Eu0.01Sm0.01Tb0.01Er0.01Nb0.9Ta0.1O4 Tcc = 1400 °C) correspond to a monoclinic phase with space group I2/a, with a minor presence (near 3%) of a monoclinic phase with space group C2/c. The XRD patterns of samples 1 and 2 were identical. The refined periods and monoclinic angle β of the studied Gd0.96Eu0.01Sm0.01Tb0.01Er0.01Nb0.9Ta0.1O4 ceramics coincide with those of the GdNbO4 monoclinic phase given in [31] within the method error (Table 3).
Table 3.
Refined periods and monoclinic angles of the unit cell, site population, and atom coordinates of Gd0.96Eu0.01Sm0.01Tb0.01Er0.01Nb0.9Ta.0.1O4 ceramic sample 1.
Table 4 shows results of WPPF refinement of the structure phases of Gd0.96Eu0.01Sm0.01Tb0.01Er0.01Nb0.9Ta.0.1O4 ceramic sample 4.
Table 4.
Refined unit cell periods of Gd0.96Eu0.01Sm0.01Tb0.01Er0.01Nb0.9Ta.0.1O4 ceramic sample 4.
Corresponding polyhedra distort when REEs (Tb, Er, Eu, Sm) enter the gadolinium site. In general, the value of the distortion at such a substitution is increased compared to initial model data (Table 3 and Table 4). The fergusonite type (M or M′) probably depends not only on cation atom radius [32], but also on initial powder synthesis and ceramics calcination temperature. For example, the fracture of M′-type fergusonite crystallization is much greater at higher calcination temperature (Tcc = 1500 °C) (Table 4).
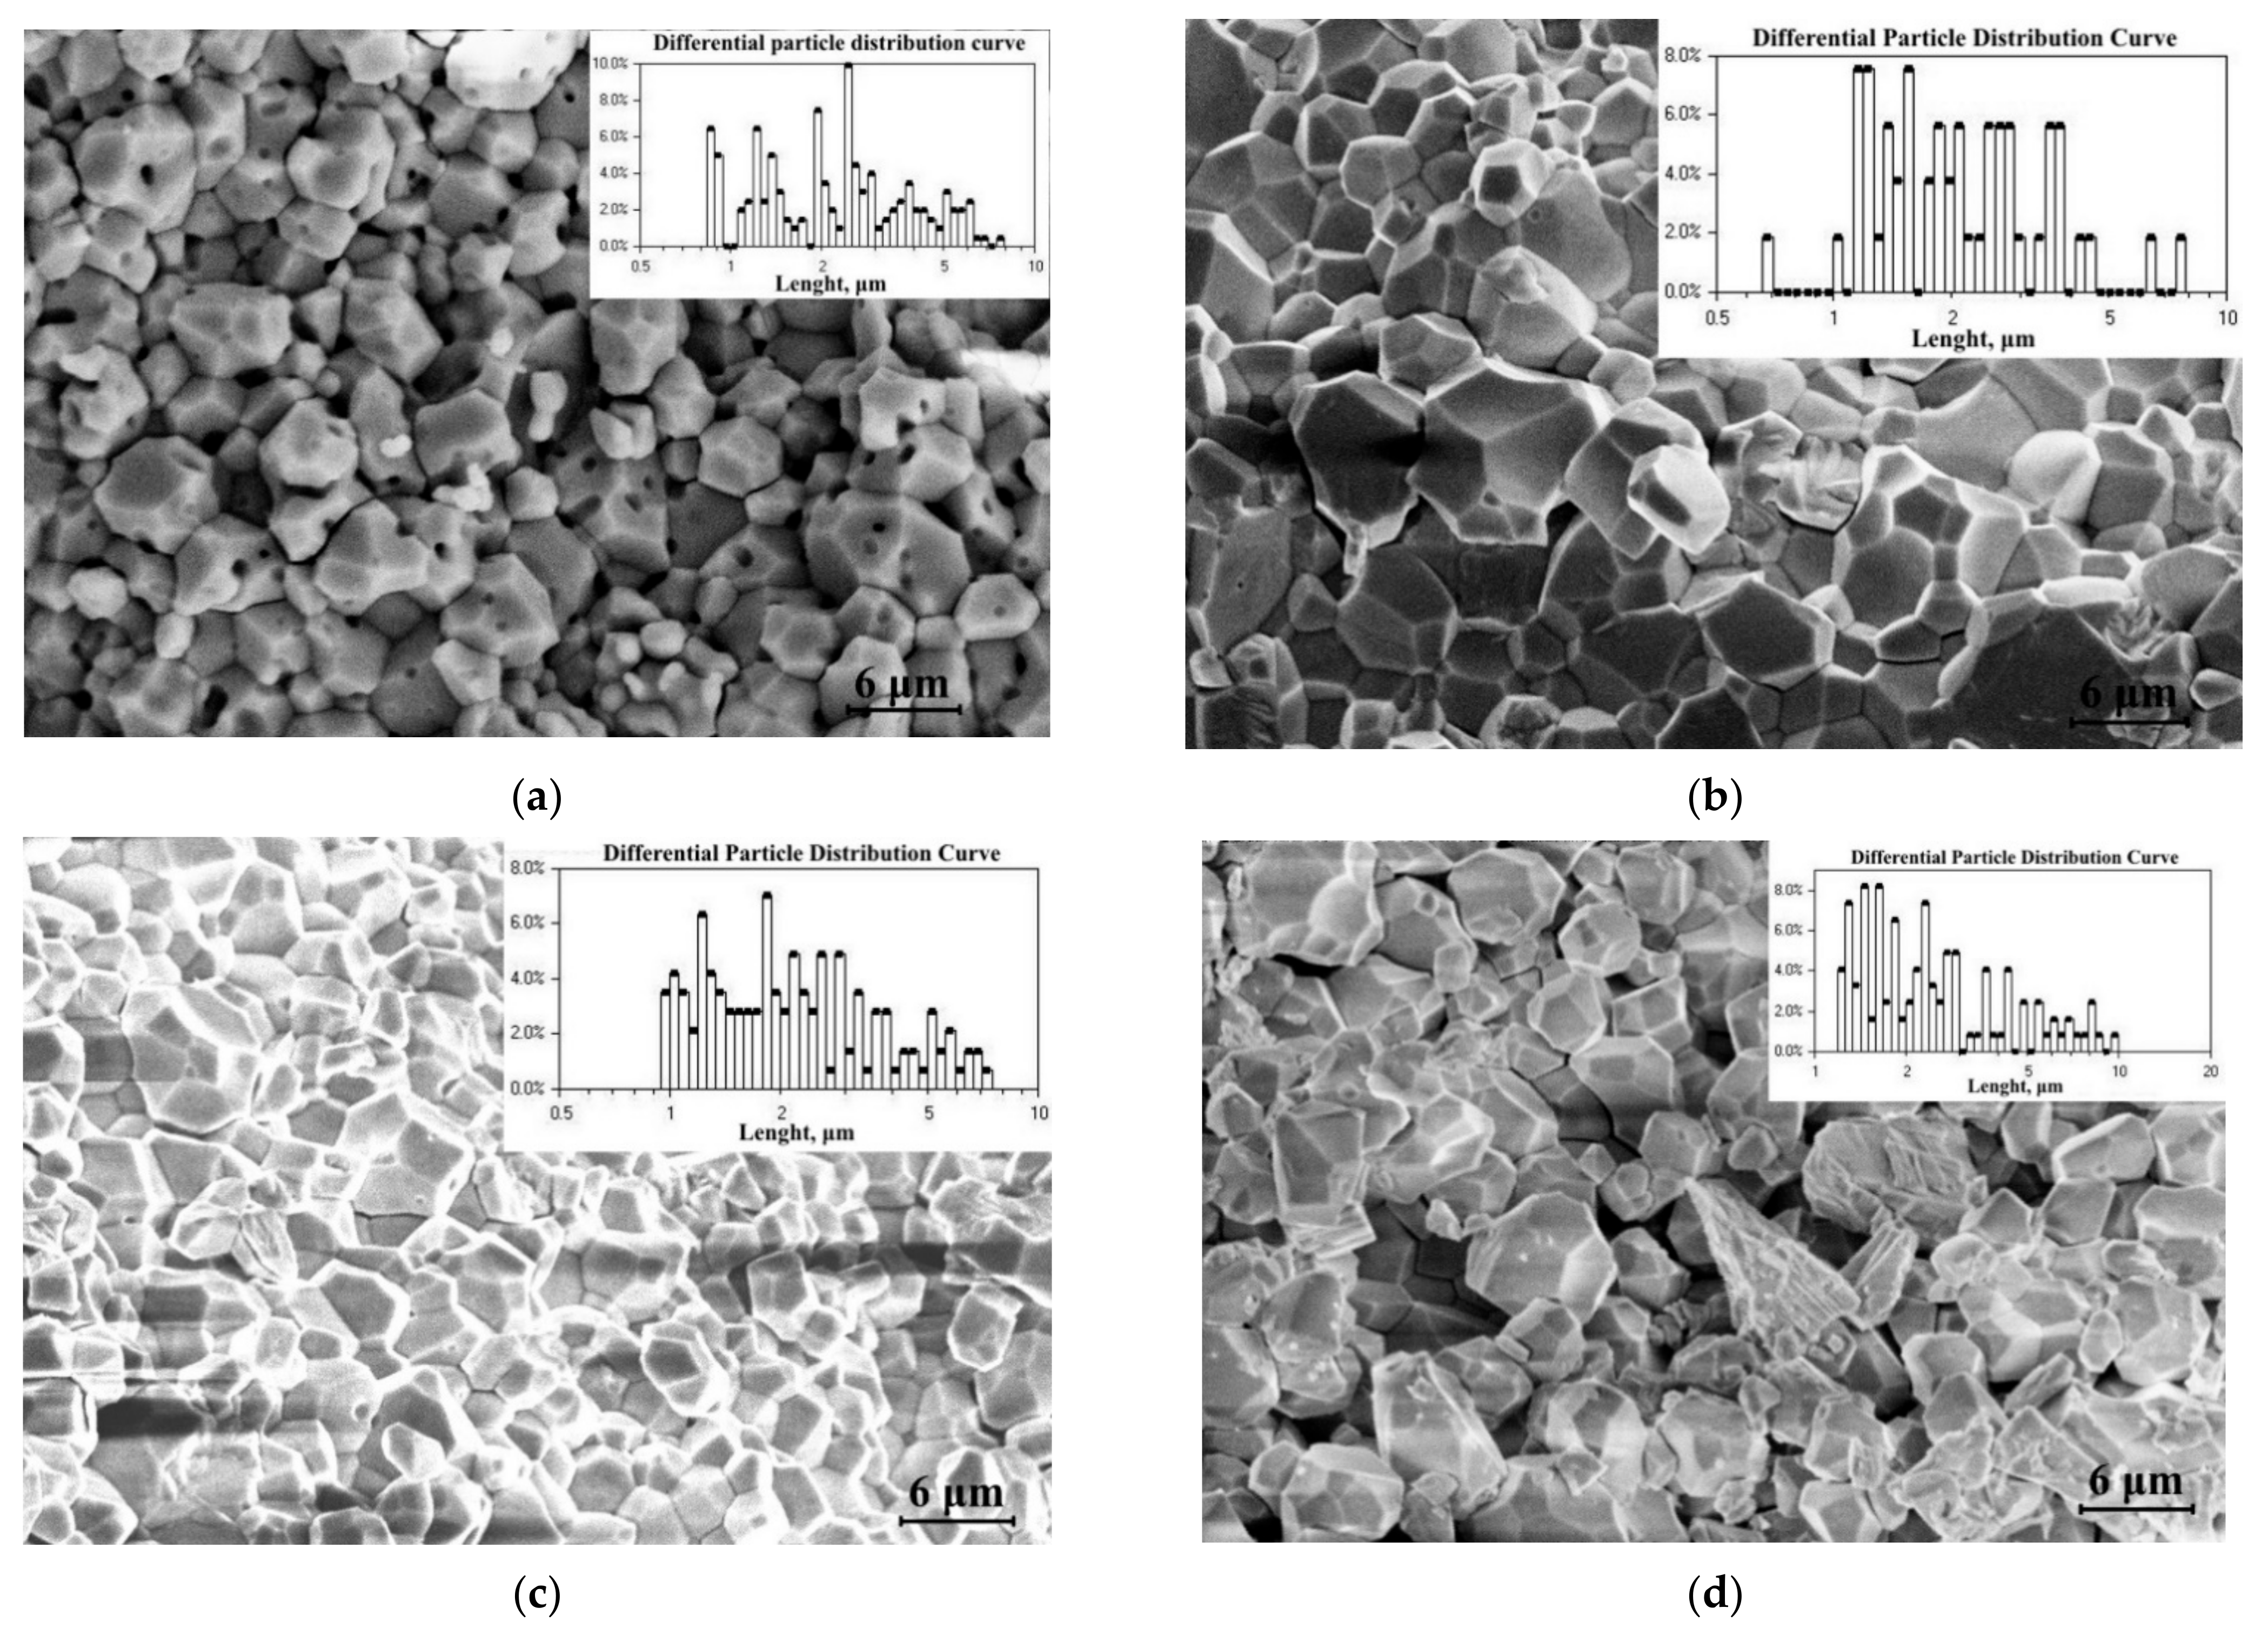
A series of SEM images characterize the morphology and grain sizes of the Gd0.96Eu0.01Sm0.01Tb0.01Er0.01Nb0.9Ta.0.1O4 ceramic samples prepared at different calcination temperatures. Figure 2 demonstrates the microstructures and size compositions of the Gd0.96Eu0.01Sm0.01Tb0.01Er0.01Nb0.9Ta.0.1O4 ceramic samples.

Figure 2.
Microstructure and size composition of Gd0.96Eu0.01Sm0.01Tb0.01Er0.01Nb0.9Ta.0.1O4 ceramic samples (a) 1; (b) 2; (c) 3; (d) 4.
Studied ceramics consisted of grains with clearly defined faceting elements characteristic of monoclinic symmetry. Crystallite sizes are ~0.5–~10 μm; such sizes were characteristic of all the studied Gd0.96Eu0.01Sm0.01Tb0.01Er0.01Nb0.9Ta.0.1O4 ceramic samples (Figure 2). Sample 3 had the most uniform structure; its average grain size was ~2.0 μm (Figure 2). The microstructure of sample 4 was much more “loose”, with considerably more microcracks and slightly larger grains (Figure 2d). Its density was thus much lower than the density of sample 3 (Table 5). Sample 3 was prepared from the powder calcined at 1200 °C, the ceramics were prepared following the same technological regime as sample 4.
Table 5.
Mechanical characteristics of studied Gd0.96Eu0.01Sm0.01Tb0.01Er0.01Nb0.9Ta.0.1O4 ceramic samples.
The elastic and mechanical properties of the samples were studied via the contact method using a NanoSkan probe microscope–nanohardness tester. Young’s modulus (E, GPa) was determined by an instrumented indentation. The elasticity modulus value was determined from the ratio of the slope angles of the load–displacement curves for the studied and reference materials [24,25,26]. Microhardness and crack resistance of ceramics were determined by comparative sclerometry at indenter loads of 5–15 mN [25,33,34]. Methods for assessing crack resistance in sclerometry are based on a quantitative study of the brittle damage zone in the scratch area, including all kinds of violations of the test material from the impact of a concentrated load on it, such as cracks, chips, etc. from the impact of a concentrated load to cracks, chips, etc. The Scan Master program was used to measure the brittle damage zone. The results allowed us to evaluate the stress intensity factor for mode I KIC; the factor is a crack resistance criteria of a material [32]. The factor characterizes resistance to a rapid degradation, which may be caused by atmosphere, for example, during the assembly of a luminescent detector. The crack resistance KIC was determined according to the model of Anstis et al. [33,34], using the following formula:
where P is the applied load, E is Young’s modulus, H is the microhardness, c is the average distance from the center of the indent to the end of the crack. To reduce the standard error of the data, the obtained values of microhardness and crack resistance were averaged over ten measurements. Measurements were carried out at 10 random areas of 60 × 60 µm in size for each sample.
Table 5 demonstrates the measurements and calculations of the mechanical characteristics of the Gd0.96Eu0.01Sm0.01Tb0.01Er0.01Nb0.9Ta.0.1O4 ceramic samples.
From Table 5, it can be seen that sample 3 not only had the highest density, but also had the best mechanical properties: microhardness H = 6.9 ± 0.48 GPa, Young’s modulus E = 336.5 ± 9.5 GPa, crack resistance KIC = 1.22 ± 0.10 MPa m0.5. The comparison of samples 3 and 4 reveals the great importance of the temperature during initial powder calcination for the Gd0.96Eu0.01Sm0.01Tb0.01Er0.01Nb0.9Ta.0.1O4 ceramic samples mechanical properties. The result is determined by the fact that long high-temperature treatment (Tpc—1400 °C for 2 h, Tcc—1500 °C for 2 h) of sample 4 led to microstructure degradation and a significant decrease in density and mechanical characteristics. Degradation of sample 4 mechanical characteristics was apparently caused by several factors: activation of recrystallization; an increase in the fraction of M′-type phase fergusonite with space group C2/c due to distortion of the monoclinic cell; appearance of an additional phase with space group Fm-3m as a result of a shear transition from a monoclinic cell to a cubic cell [28,29,30]. The growth of macrograins with poor adhesion to each other, the appearance of microcracks, and inhomogeneities of the microstructure significantly reduced the mechanical characteristics of ceramics (Figure 2c,d; Table 5). As a result, the ceramics became more brittle and prone to breakage (Table 5).
Samples 1 and 2 were more similar than samples 3 and 4 (Table 5). An increase in the temperature of initial powder calcination Tpc (from 1200 °C to 1400 °C), in general, favorably affected the mechanical characteristics of the ceramics (Table 5). Apparently, this was due to the stabilization of the phase compositions of the samples, which increased the homogeneity of the microstructures (Figure 2a,b).
Our data obtained for ceramic samples Gd0.96Eu0.01Sm0.01Tb0.01Er0.01Nb0.9Ta.0.1O4 synthesized using nitrate solutions of REE and ultrafine hydroxides of niobium and tantalum coincide with the results from [20,21,22]. These papers were dedicated to studying a novel class of high-entropy rare-earth niobates (RENbO4) synthesized via the solid-state reaction method (see Table 5). These authors showed that the Young’s modulus range for rare-earth niobates (RENbO4) is 60–170 GPa, and that hardness goes up to 11.48 GPa. Taking into account the differences in measurement methods—nanoindentation and sclerometry—these results coincide with ours. The exact hardness given in [22] was Hν = 4.96 ± 0.08 GPa; this is close to our samples 3 and 4 (H= 6.9 ± 0.48 GPa and 5.2 ± 0.55 GPa, respectively). The factor KIC in [22] is 2.05 ± 0.14 MPa·m0.5, which is slightly lower than that of our sample 3 KIC = 1.22 ± 0.10 MPa·m0.5. These differences are caused by the differences in obtaining method, properties, concentration of doping REE, and the ratio of crystalline phases in the samples [21,35]. Note that RENbO4 and RETaO4 (RE = Y, La, Nd, Sm, Gd, Dy, Yb) are considered in [20,21,22] as promising new thermal barrier coatings. The mechanical characteristics of these materials are subject to no less stringent requirements than those for luminescent materials and scintillation detectors. Thus, the ceramic Gd0.96Eu0.01Sm0.01Tb0.01Er0.01Nb0.9Ta.0.1O4 sample sintered at 1500 °C synthesized from a powder obtained using nitrate solutions of REE and ultrafine hydroxides of niobium and tantalum and calcined at 1200 °C has the mechanical characteristics suitable for materials for luminescent and scintillation devices.
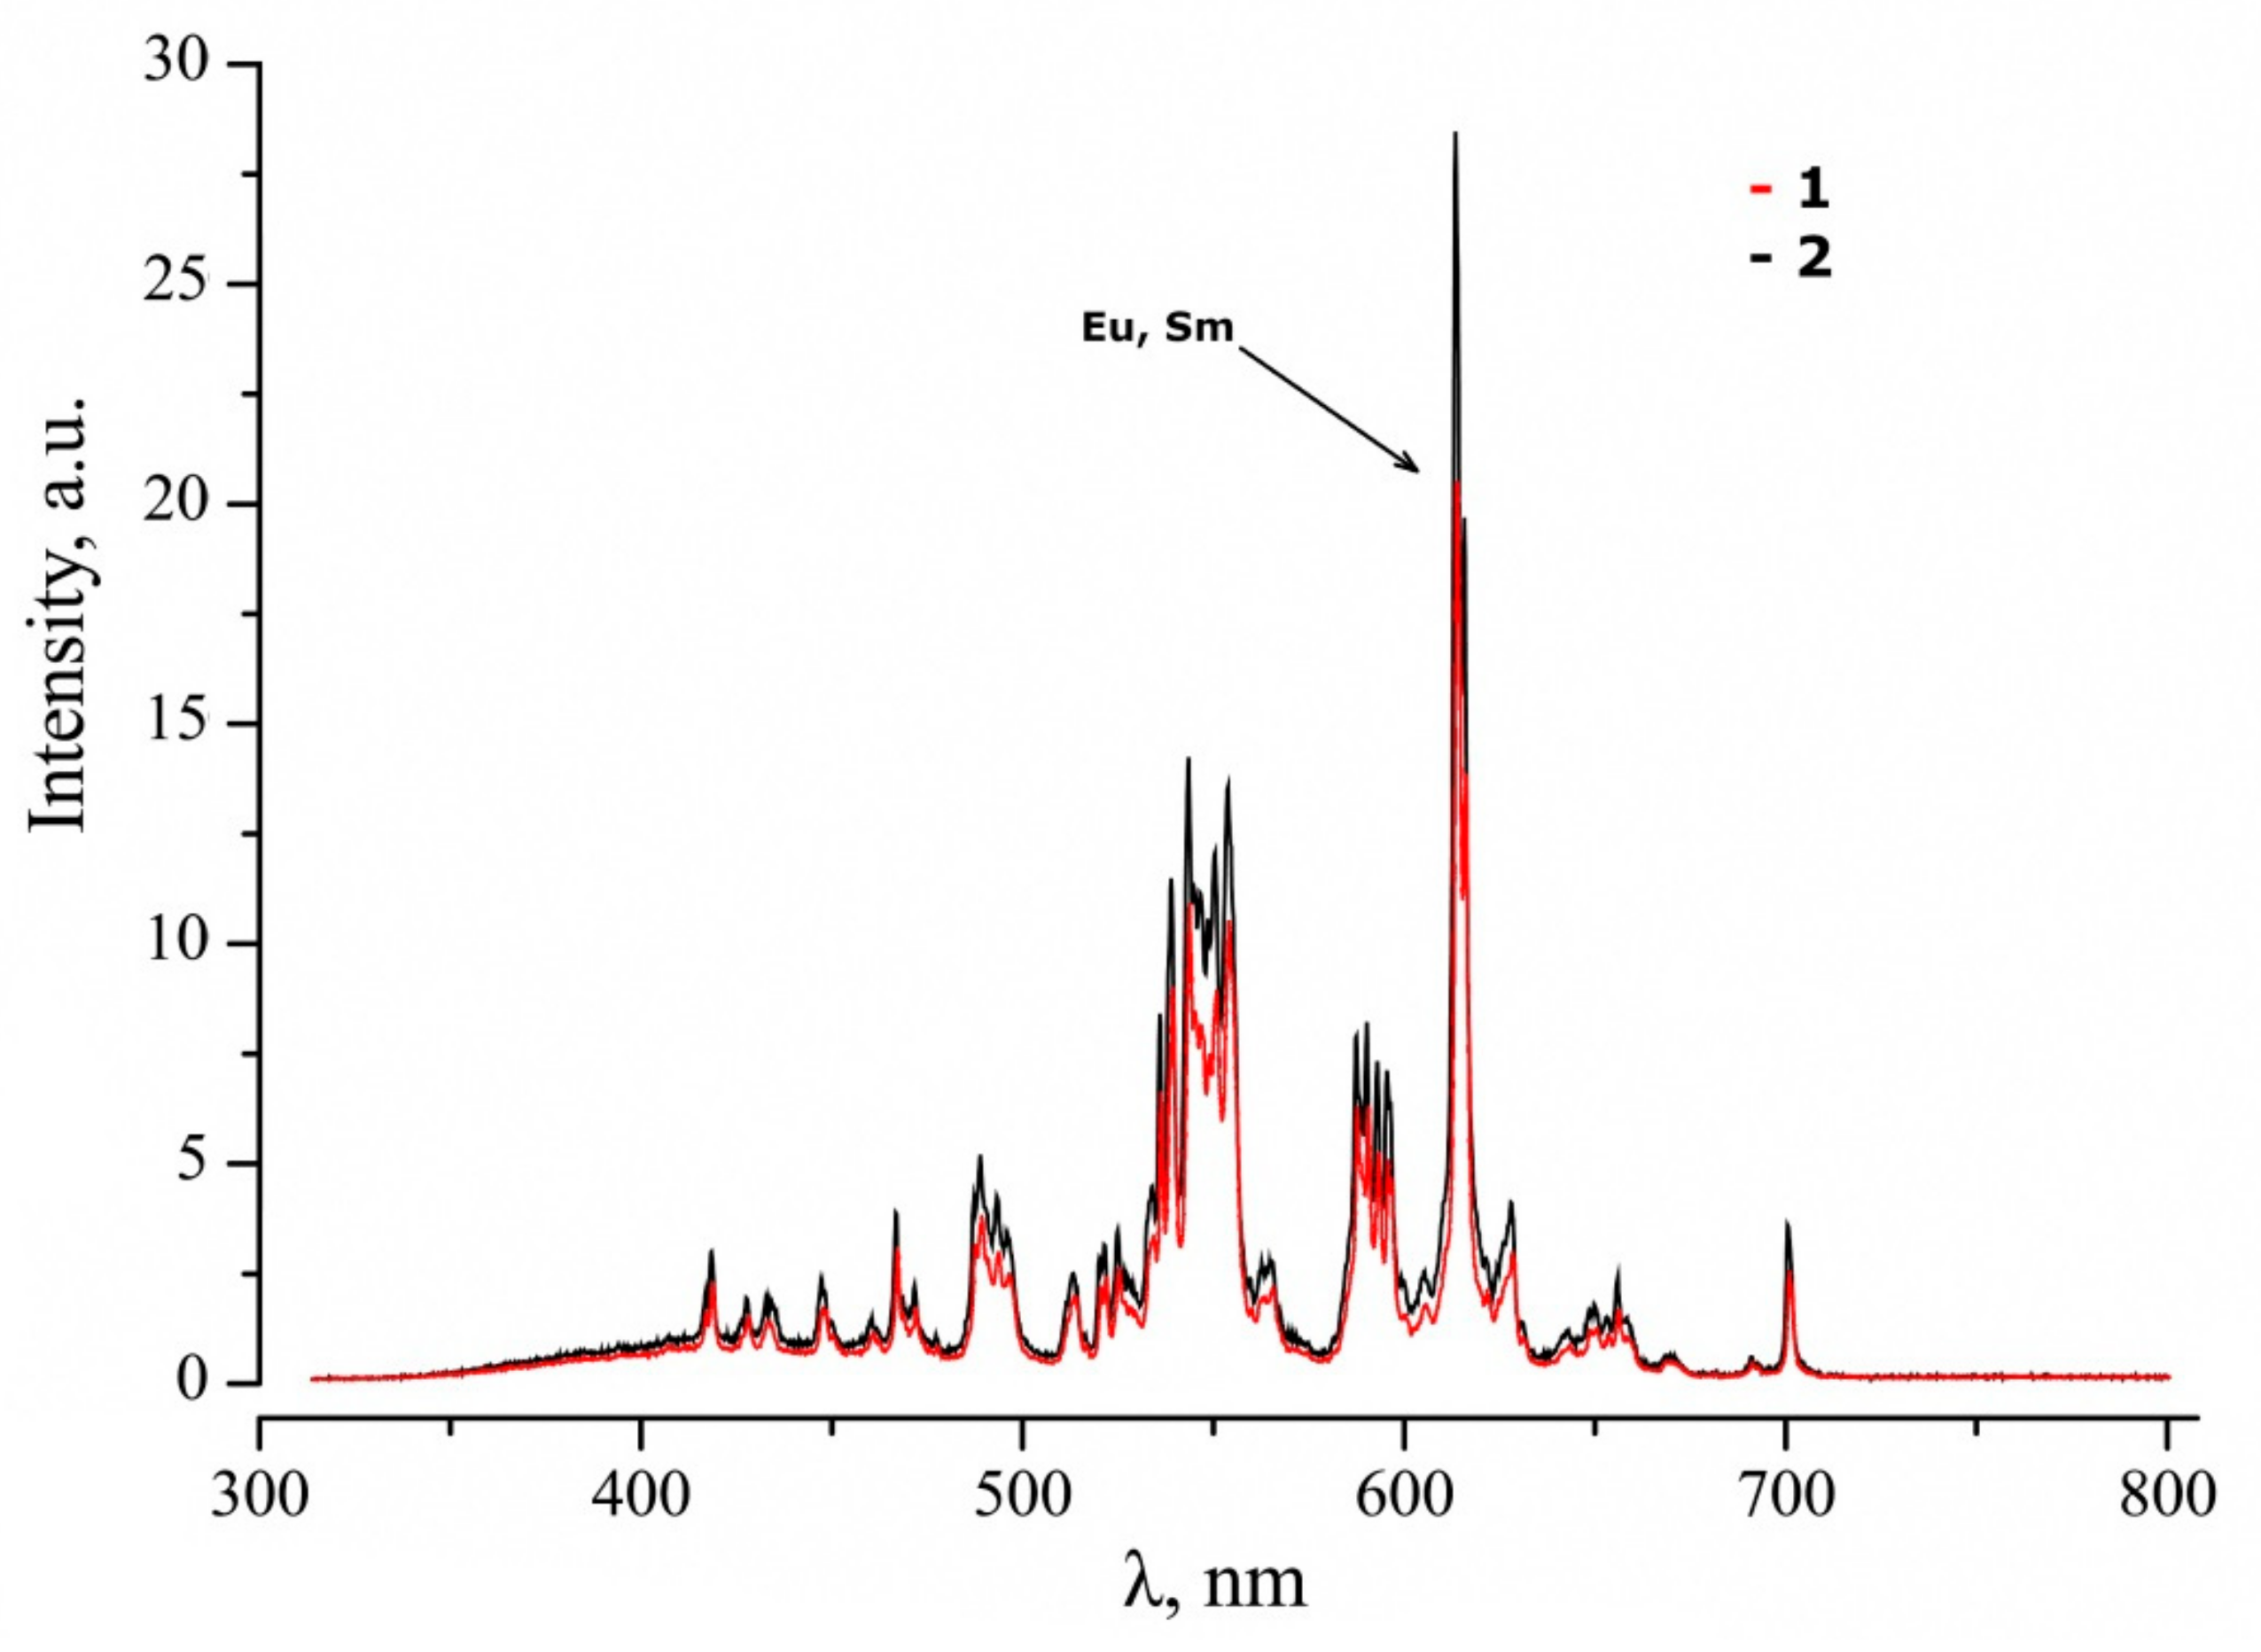
The luminescent characteristics of Gd0.96Eu0.01Sm0.01Tb0.01Er0.01Nb0.9Ta.0.1O4 ceramics were studied following the cathodoluminescence method. Some samples were annealed in a vacuum in order to establish the annealing influence on luminescent properties in the visible region, since it is known that the luminescence of ABO4 compounds is highly sensitive to the features of the defective structure of the material [35,36,37,38]. We were curious about electronic relaxations involving defect centers, such as oxygen vacancies or F-centers; the F-center is an oxygen vacancy with a localized electron. Figure 3 demonstrates the resulting spectra of studied Gd0.96Eu0.01Sm0.01Tb0.01Er0.01Nb0.9Ta.0.1O4 ceramic samples.

Figure 3.
Cathodoluminescence spectra of Gd0.96Eu0.01Sm0.01Tb0.01Er0.01Nb0.9Ta.0.1O4 sample 1 (1) before and (2) after vacuum annealing.
The spectrum consists of a low-intensity halo with a large number of luminescent bands; the bands are connected with intraconfigurational 4fn-4fn transitions of various REEs. The maximal contribution to luminescence is observed in green–orange area (Figure 3). The halo is observed in the wavelength range λ = 350–550 nm; this corresponds to the self-luminescence centers of the MO4 (M—Nb, Ta) type. Such luminescence is typical for matrices of niobates and tantalates of alkali and REEs, the maximum luminescence intensities of which have been observed at 400–440 nm [39].
The contribution of each REE to the general luminescent signal corresponds to the following possible transitions: transitions 5D4-7FJ (J = 6, 5, 4, 3) correspond to Tb3+ (maxima at 490, 550, 575, and 625 nm) [40]; transitions 5D0-7FJ (J = 0, 1, 2, 3, 4) correspond to Eu3+ (maxima at 580, 590, 610, 650, and 710 nm) [41]; transitions 2H11/2-4I15/2, 4S3/2-4I15/2 correspond to Er3+ (maxima at 525 and 555 nm) [42]; transitions 4G5/2-6HJ (J = 5/2, 7/2, 9/2, 11/2) correspond to Sm3+ (maxima at 560, 610, 650, and 700 nm) [42]. Low-intensity self-glow of MO4 groups indicates that excitation by fast electron flow transfers energy from MO4-type luminescence centers to REE with the participation of Gd atoms. The luminescence intensity maximum falls on the transitions of the Eu and Sm atoms in the orange–yellow part of the spectrum, despite their smaller concentration in the ceramic matrix (Table 2). According to literature data [41,42], Tb and Er atoms provide intense luminescence at 550 nm. Taking into account the concentration measurements of REE in the matrix of the studied ceramics (Table 2) and the maximum luminescence intensity at ~610 nm (Figure 3), energy transfer, apparently, can occur from Tb and Er atoms to Sm and Eu atoms, since the energy levels (4G5/2 and 5D0) of the latter are energetically lower, and part of the energy is dissipated by lattice phonons.
Reductive annealing uniformly increased the luminescence intensity of the entire cathodoluminescence spectrum by ~33% (Figure 3). First of all, oxygen is desorbed from the surface and from the bulk of the ceramic during reductive annealing. Thus, an oxygen vacancy with a localized electron forms in the first coordination sphere of Nb/Ta and Gd. Electrostatic interaction changes near such a defect; this changes the radiative recombination mechanisms involving MO3-VO luminescence centers and intraconfigurational 4fn-4fn REE transitions. The 5s25p6 shells of REE screen the 4f-shell; therefore, a change in the electrostatic field will have little effect on the change in the energy levels of the terms, and the main channels of radiative recombination will be the same. Thus, an increase in the luminescence intensity can be associated with an increase in energy transfer through the defect centers of MO3-VO to REEs. VO defects are hole trapping centers, thus, recombination with a fast electron flow increases the emission fraction. Emission transfers to REEs, and general cathodoluminescence increases in vacuum-annealed Gd0.96Eu0.01Sm0.01Tb0.01Er0.01Nb0.9Ta.0.1O4 ceramics.
At the same time, separate areas with relatively low luminescence intensity were observed in the vacuum-annealed ceramics samples (Figure 4a). However, the fraction of such areas was smaller than the fraction of strongly glowing areas. Different intensities of radiative recombination indicate non-uniform oxygen desorption over the ceramic sample surface. Such non-uniformity is probably caused by uneven distribution of oxygen vacancies, i.e., the formation of clusters—areas with a higher and lower content of vacancy complexes. This may be due to the technology of vacuum annealing. For example, oxygen desorption is obstructed on the surface of one of the sides of the studied tableted ceramic sample, since it is located at the bottom of the platinum cup.
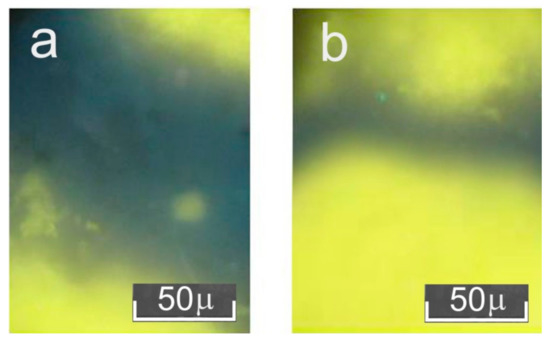
Figure 4.
Cathodoluminescence patterns of different parts of studied Gd0.96Eu0.01Sm0.01Tb0.01Er0.01Nb0.9Ta.0.1O4 ceramics after vacuum annealing: (a) bottom side of the sample, (b) top side of the sample.
Photoluminescence spectra are similar to cathodoluminescent spectra: energy transfers from ceramic matrix glow centers to doping REEs. The difference between these centers is in the different excitation sources: cathodoluminescence is a high-energy electron beam, and photoluminescence is UV excitation at 325 nm. In the first case, MO4 luminescence centers and intraconfigurational transitions of the Gd3+ ion participate in “matrix–REE” energy transfer. Oxygen vacancies, VO, are added into vacuum-annealed ceramics. In the case of photoluminescence, most of the energy transfer in Gd0.96Eu0.01Sm0.01Tb0.01Er0.01Nb0.9Ta.0.1O4 ceramics is caused by intrinsic MO4 centers and doping REEs, since 8S-6I transition of Gd3+ ion is observed at 273 nm [43].
Figure 5 demonstrates the photoluminescent spectra of Gd0.96Eu0.01Sm0.01Tb0.01Er0.01Nb0.9Ta.0.1O4 ceramic samples calcined at different temperatures, and a GdNbO4 ceramic obtained in [44]. Please note that spectra of samples 1 and 2 are identical.
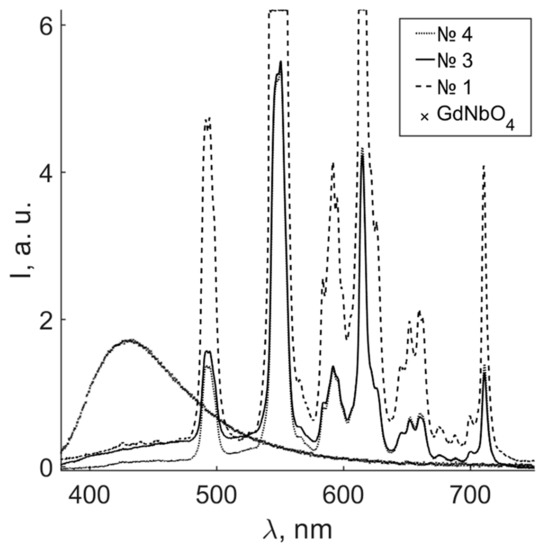
Figure 5.
Photoluminescence spectra of samples 1, 3, 4, and a GdNbO4 ceramic.
The position of the intrinsic emission of ceramic SSs depends both on the ceramic matrix REE and doping REE in the case of compounds of the ReMO4 type (where M = Nb, Ta, and Re = Gd, Y, Yb). Energy transfers between luminescent centers (MO4 groups) and elements with an intracenter luminescence (Eu3+, Tb3+, Er3+, Sm3+) [8,9,10,11,12,13]. The GdNbO4 photoluminescent spectrum contains a wide luminescent halo with a maximum at 428 nm (Figure 5). The halo is characteristic of radiative recombination between Nb4+ and O− ions [43]. The Gd0.96Eu0.01Sm0.01Tb0.01Er0.01Nb0.9Ta.0.1O4 ceramic spectrum contains a number of luminescent bands at 485, 545, 585, 610, 655, and 705 nm; the maximal intensity distribution lies in orange and green areas (Figure 5). The nature of individual maxima, as in the case of cathodoluminescence, is connected with intraconfigurational 4fn-4fn transitions of Tb, Eu, Er, and Sm [40,41,42]. The most intense photoluminescence the of Gd0.96Eu0.01Sm0.01Tb0.01Er0.01Nb0.9Ta.0.1O4 ceramics is seen in the green–red area, with maximal emission at ~550 nm from 5D0-7F5 and 4S3/2-4I15/2 transitions of Tb3+ and Er3+, when excited in the UV area (Figure 5).
The intensity of luminescence of Gd0.96Eu0.01Sm0.01Tb0.01Er0.01Nb0.9Ta.0.1O4 ceramic samples strongly depended on the ceramic calcination temperature, whereas the band frequencies were the same. The calcination temperature influenced the crystal structure, microstructure, relative content of polymorphs, and the presence of additional phases in the samples. Figure 5 demonstrates that the intensities of luminescent signals of samples 3 and 4 were much lower than those of samples 1 and 2. The relative amount of the main monoclinic phases changes and an additional cubic phase is formed (Table 2 and Table 3) at high calcination temperature (1500 °C) of samples 3 and 4. This apparently quenches the luminescence of intraconfigurational radiative transitions of REEs and the intrinsic ceramic matrix, and distorts the energy transfer between them. The difference in the photoluminescence intensities of samples 1, 2 and 3, 4 was more than 10%. Thus, the photoluminescence intensities of the ceramics will decrease with an increase in the sintering temperature. This is the result of an increase in the fraction of crystal phases acting as quenching centers.
Note that the maximum photoluminescence spectra intensity occurs in the green region (~550 nm). This is different from the cathodoluminescence data (Figure 3 and Figure 5). The difference may be due to a change in the source of excitation. High-energy electron flow excites cathodoluminescence, whereas photoluminescence is excited by UV light with a 325 nm wavelength. In the first case, the energy transfer in the “matrix–REE” system involves the luminescence centers of the MO4 type and intraconfigurational transitions of the Gd3+ ion; and in vacuum-annealed ceramics, oxygen vacancies, VO, are also involved. In our experiments on photoluminescence, the energy transfer was due to intrinsic regularly arranged MO4 centers and REE dopants in Gd0.96Eu0.01Sm0.01Tb0.01Er0.01Nb0.9Ta.0.1O4 ceramics; 8S7/2-6PJ transitions of Gd3+ ion are observed at 310 nm [45].
4. Conclusions
Finely dispersed powders were prepared using nitrate solutions of REE and ultrafine hydroxides of niobium and tantalum and calcined at different temperatures (Tpc = 1200 and 1400 °C). Ceramic samples of Gd0.96Eu0.01Sm0.01Tb0.01Er0.01Nb0.9Ta.0.1O4 were prepared from these powders by conventional sintering technology at a different calcination temperature (Tcc = 1400 and 1500 °C).
The structures of the phases of the Gd0.96Eu0.01Sm0.01Tb0.01Er0.01Nb0.9Ta.0.1O4 ceramic SSs and their dependence on the preparation conditions were refined by a full profile analysis of XRD patterns of polycrystals. The structure of Gd0.96Eu0.01Sm0.01Tb0.01Er0.01Nb0.9Ta.0.1O4 ceramics calcined at Tcc = 1400 °C was a monoclinic phase with the space group I2/a with a slight presence of the monoclinic phase (M′-type) with the space group C2/c. The ceramics calcined at higher temperature Tcc = 1500 °C exhibited a distorted monoclinic unit cell with a space group I2/a; the relative fracture of the M′-type fergusonite phase with space group C2/c increased; an additional phase appeared as a result of a shear transition from a monoclinic cell to a cubic cell with space group Fm-3m.
The morphological particularities of the microstructures of the ceramic samples were studied independent of ceramic preparation conditions. Strength characteristics were also evaluated. Sample 3 (Tpc = 1200, Tcc = 1500 °C) had the greatest density and the best mechanical characteristics among all studied samples: microhardness H = 6.9 ± 0.48 GPa, Young’s modulus E = 336.5 ± 9.5 GPa, and crack resistance KIC = 1.22 ± 0.10 MPa m0.5. Long thermal treatment of sample 4 (Tpc = 1400 for 2 h, Tcc = 1500 °C for 2 h) led to microstructure degradation, decrease in density, and a significant loss of mechanical strength. At the same time, an increase in powder calcination temperature Tpc from 1200 to 1400 °C of ceramics calcined at Tcc = 1400 °C (samples 1 and 2) increased their densities insignificantly, the increase also slightly enhanced mechanical characteristics.
Cathodo- and photoluminescence were studied in Gd0.96Eu0.01Sm0.01Tb0.01Er0.01Nb0.9Ta.0.1O4 ceramic samples. The luminescence was measured in a visible region and excited in the UV region (325 nm). The effectivity of an energy transfer between matrix and REE dopant did not depend on the excitation radiation type in Gd0.96Eu0.01Sm0.01Tb0.01Er0.01Nb0.9Ta.0.1O4 ceramics. Energy transfer from the MO4 group to the excitation of 4fn-4fn levels of doping REE cations in Gd0.96Eu0.01Sm0.01Tb0.01Er0.01Nb0.9Ta.0.1O4 ceramics was dominant with both cathodoluminescence and excitation by UV light.
Reductive annealing uniformly increased the whole cathodoluminescent spectrum by 33%. The increase could be connected with an increase in energy transfer between MO3-VO (M—Nb, Ta) defect centers and REEs. Since VO defects are hole trapping centers, recombination with a fast electron flow led to an increase in the fraction of emission that was transferred to REEs, and a general increase in cathodoluminescence of vacuum-annealed Gd0.96Eu0.01Sm0.01Tb0.01Er0.01Nb0.9Ta.0.1O4 ceramics.
Ceramic calcination temperature (Tcc) affected the crystal structure, microstructure, relative contents of the polymorphs, and the presence of additional phases in the samples. Photoluminescence intensity of Gd0.96Eu0.01Sm0.01Tb0.01Er0.01Nb0.9Ta.0.1O4 ceramic samples strongly depended on Tcc, while the bands frequencies were the same. A change in the relative amount of the main monoclinic phases and the formation of an additional cubic phase apparently led to some quenching of the luminescence of intraconfigurational radiative transitions of the REEs. Thus, photoluminescence intensity in the Gd0.96Eu0.01Sm0.01Tb0.01Er0.01Nb0.9Ta.0.1O4 ceramics depended mostly on the ratio between monoclinic phases with space groups I2/a and C2/c in the sample. This ratio, in turn, was determined by the thermal treatment conditions of the sample.
Samples calcined at Tcc = 1500 °C had better mechanical characteristics, samples calcined at Tcc = 1400 °C had higher photoluminescence intensity. Thus, the best luminescent properties claim thermal treatment conditions other than the best mechanical characteristics.
Author Contributions
Conceptualization, M.P. and O.S.; methodology, O.S., M.S., S.M. and K.A.; software, M.S., V.E. and K.A.; validation, O.S., M.S., S.M. and K.A.; investigation, O.S., M.S., S.M. and K.A.; writing—original draft preparation, M.P., O.S. and M.S.; writing—review and editing, M.P.; visualization, O.S., M.S., V.E. and K.A.; supervision, M.P. All authors have read and agreed to the published version of the manuscript.
Funding
This work was financially supported by the Ministry of Science and Higher Education Russian Federation scientific topic 0186-2022-0002 (registration number FMEZ-2022-0016).
Institutional Review Board Statement
Not applicable.
Informed Consent Statement
Not applicable.
Data Availability Statement
The raw data supporting this study is available from a corresponding author, O.S., on reasonable request.
Acknowledgments
Authors thank T.B. Popova and M.V. Zamoryanskaya from Ioffe Physical-Technical Institute of the Russian Academy of Sciences for help with XRF measurements.
Conflicts of Interest
The authors declare no conflict of interest.
References
- Yanagida, T. Inorganic scintillating materials and scintillation detectors. Proc. Jpn. Acad. Ser. B Phys. Biol. Sci. 2018, 94, 75–97. [Google Scholar] [CrossRef]
- Nikl, M.; Yoshikawa, A. Recent R&D trends in inorganic single-crystal scintillator materials for radiation detection. Adv. Opt. Mater. 2015, 3, 463–481. [Google Scholar] [CrossRef]
- Voloshyna, O.; Gerasymov, I.; Sidletskiy, O.; Kurtsev, D.; Gorbacheva, T.; Hubenko, K.; Boiaryntseva, I.; Ivanov, A.; Spassky, D.; Omelkov, S.; et al. Fast ultradense GdTa1−xNbxO4 scintillator crystals. Opt. Mater. 2017, 66, 332–337. [Google Scholar] [CrossRef]
- Palatnikov, M.N.; Smirnov, M.V.; Masloboeva, S.M.; Shcherbina, O.B.; Sidorov, N.V.; Steblevskaya, N.I.; Belobeletskaya, M.V. Luminescence properties of sol-gel derived ceramic GdNbxTa1−xO4 and YNbxTa1−xO4 solid solution. Inorg. Mater. 2020, 56, 437–442. [Google Scholar] [CrossRef]
- Blasse, G.; Bril, A. Luminescence of phosphors based on host lattices ABO4 (A is Sc, In; B is P, V, Nb). J. Chem. Phys. 1969, 50, 2974–2980. [Google Scholar] [CrossRef]
- Liu, W.; Zhang, Q.; Ding, L.; Sun, D.; Luo, J.; Yin, S. Photoluminescence properties of LuTaO4:RE3+ (RE3+ = Eu3+, Tb3+) with M′-type structure. J. Alloy. Compd. 2009, 474, 226–228. [Google Scholar] [CrossRef]
- Popovici, E.J.; Imre-Lucaci, F.; Muresan, L.; Stefan, M.; Bica, E.; Grecu, R.; Indrea, E. Spectral investigations on niobium and rare earth activated yttrium tantalate powders. J. Optoelectron. Adv. Mater 2008, 10, 2334–2337. [Google Scholar]
- Xiao, X.; Yan, B. REMO4 (RE = Y, Gd; M = Nb, Ta) phosphors from hybrid precursors: Microstructure and luminescence. J. Mater. Res. 2008, 23, 679–687. [Google Scholar] [CrossRef]
- Li, B.; Gu, Z.; Lin, J.; Su, M.-Z. X-ray luminescence properties of rare-earth doped orthotantalate. Mater. Res. Bull. 2000, 35, 1921–1931. [Google Scholar] [CrossRef]
- Zhou, P.; Zhang, Q.; Ning, K.; Yang, H.; Sun, D.; Luo, J.; Yin, S. Structural and spectral investigations on heavily Er3+ doped RETaO4 (RE = Sc, Y, Gd, Lu) polycrystalline powders. Proc. SPIE. 2011, 8206, 820622. [Google Scholar] [CrossRef]
- Hirano, M.; Ishikawa, K. Hydrothermal formation and up-conversion luminescence of Er3+-doped GdNbO4. J. Am. Ceram. Soc. 2017, 100, 2814–2821. [Google Scholar] [CrossRef]
- Zhang, D.-F.; Tang, A.; Yang, L.; Zhu, Z.-T. Potential red-emitting phosphor GdNbO4:Eu3+, Bi3+ for near-UV white light emitting diodes. Int. J. Miner. Met. Mater. 2012, 19, 1036–1039. [Google Scholar] [CrossRef]
- Ayvacıklı, M.; Ege, A.; Ekdal, E.; Popovici, E.-J.; Can, N. Radioluminescence study of rare earth doped some yttrium based phosphors. Opt. Mater. 2012, 34, 1958–1961. [Google Scholar] [CrossRef]
- Voloshyna, O.; Boiaryntseva, I.; Spassky, D.; Sidletskiy, O. Luminescence properties of the yttrium and gadolinium tantalo-niobates. Solid State Phenom. 2015, 230, 172–177. [Google Scholar] [CrossRef]
- Shcherbina, O.; Masloboeva, S.M.; Steblevskaya, N.I.; Belobeletskaya, M.V.; Efremov, V.V.; Smirnov, M.V.; Palatnikov, M.N. Synthesis, microstructure, mechanical properties and luminescence of a ceramics Gd(NbxTa1−x)O4. J. Adv. Dielectr. 2020, 10, 2060014. [Google Scholar] [CrossRef]
- Hu, B.; Yao, M.; Xiao, R.; Chen, J.; Yao, X. Optical properties of amorphous Al2O3 thin films prepared by a sol–gel process. Ceram. Int. 2014, 40, 14133–14139. [Google Scholar] [CrossRef]
- Priya, R.S.; Chaudhary, P.; Kumar, E.R.; Balamurugan, A.; Srinivas, C.; Prasad, G.; Deepty, M.; Praveenkumar, V.; Yadav, B.; Sastry, D.; et al. Effect of heat treatment on structural, morphological, dielectric and magnetic properties of Mg–Zn ferrite nanoparticles. Ceram. Int. 2022, 48, 15243–15251. [Google Scholar] [CrossRef]
- Devesa, S.; Rodrigues, J.; Teixeira, S.S.; Rooney, A.P.; Graça, M.P.F.; Cooper, D.; Monteiro, T.; Costa, L.C. Tuning green to red color in erbium niobate micro- and nanoparticles. Nanomaterials 2021, 11, 660. [Google Scholar] [CrossRef]
- Palatnikov, M.N.; Shcherbina, O.B.; Smirnov, M.V.; Andryushin, K.P.; Shilkina, L.A.; Reznichenko, L.A.; Efremov, V.V.; Masloboeva, S.M. Optimization of obtaining of translucent luminescent ceramics YNbO4 by uniaxial hot pressing from crystal powders synthesized by sol-gel. Opt. Mater. 2022, 129, 112541. [Google Scholar] [CrossRef]
- Wu, F.; Wu, P.; Zhou, Y.; Chong, X.; Feng, J. The thermo-mechanical properties and ferroelastic phase transition of RENbO4 (RE = Y, La, Nd, Sm, Gd, Dy, Yb) ceramics. J. Am. Ceram. Soc. 2019, 103, 2727–2740. [Google Scholar] [CrossRef]
- Xiao, W.; Yang, Y.; Pi, Z.; Zhang, F. Phase stability and mechanical properties of the monoclinic, monoclinic-prime and tetragonal REMO4 (M = Ta, Nb) from first-principles calculations. Coatings 2022, 12, 73. [Google Scholar] [CrossRef]
- Zhu, J.; Xu, J.; Zhang, P.; Meng, X.; Cao, S.; Wu, J.; Wei, M.; Shi, Y.; Reece, M.J.; Gao, F. Enhanced mechanical and thermal properties of ferroelastic high-entropy rare-earth-niobates. Scr. Mater. 2021, 200, 113912. [Google Scholar] [CrossRef]
- Zamoryanskaya, M.V.; Konnikov, S.G.; Zamoryanskii, A.N. A high-sensitivity system for cathodoluminescent studies with the Camebax electron probe microanalyzer. Instruments Exp. Tech. 2004, 47, 477–483. [Google Scholar] [CrossRef]
- Oliver, W.C.; Pharr, G.M. Measurement of hardness and elastic modulus by instrumented indentation: Advances in understanding and refinements to methodology. J. Mater. Res. 2004, 19, 3–20. [Google Scholar] [CrossRef]
- Useinov, A.S.; Useinov, S.S. Scratch hardness evaluation with in-situ pile-up effect estimation. Philos. Mag. 2012, 92, 3188–3198. [Google Scholar] [CrossRef]
- Maslenikov, I.I.; Reshetov, V.N.; Useinov, A.S. Mapping the elastic modulus of a surface with a NanoScan 3D scanning microscope. Instrum. Exp. Tech. 2015, 58, 711. [Google Scholar] [CrossRef]
- Belikov, M.L.; Sedneva, T.A.; Lokshin, E.P. Synthesis, properties, and visible light photocatalytic activity of nonstoichiometric titanium dioxide-based composites. Inorg. Mater. 2020, 56, 723–733. [Google Scholar] [CrossRef]
- Safronenko, M.G.; Bogatov, Y.E.; Molodkin, A.K. A study of the interaction of niobium (IV) oxide with lanthanide oxides. Russ. J. Inorg. Chem. 1992, 37, 5–11. (In Russian) [Google Scholar]
- Krylov, E.I.; Krivonosov, L.B. Terbium and thulium orthoniobates. Russ. J. Inorg. Chem. 1968, 13, 1629–1634. (In Russian) [Google Scholar]
- Ustimovich, A.B.; Pinaeva, M.M.; Kuznetsova, V.V.; Shuľman, L.D.; Sleptsov, S.E. The system Eu2O3-Gd2O3-Ta2O5 at Ta2O5 contents of 25, 50, and 75 mole % Eu0.375Gd0.375Ta0.25O1.75 crystal system: Cubic SPGR: Fm-3m (225) 04-001-9311. Inorg. Mater. 1975, 11, 897–914. [Google Scholar]
- Mather, S.A.; Davies, P.K. Nonequilibrium phase formation in oxides prepared at low temperature: Fergusonite-related phases. J. Am. Ceram. Soc. 1995, 78, 2737. [Google Scholar] [CrossRef]
- Bruncková, H.; Medvecký, Ľ.; Múdra, E.; Kovalčiková, A. Polymorphs of neodymium niobate and tantalate thin films prepared by sol-gel method. J. Powder Met. Prog. 2019, 19, 34–43. [Google Scholar] [CrossRef]
- Anstis, G.; Chantikul, P.; Lawn, B.; Marshall, D. A critical evaluation of indentation techniques for measuring fracture toughness: I, Direct crack measurements. J. Am. Ceram. Soc. 1981, 64, 533–538. [Google Scholar] [CrossRef]
- Chantikul, P.; Anstis, G.R.; Lawn, B.R.; Marshall, D.B. A critical evaluation of indentation techniques for measuring fracture toughness: II, Strength method. J. Am. Ceram. Soc. 1981, 64, 539–544. [Google Scholar] [CrossRef]
- Tian, Y.; Xu, B.; Zhao, Z. Microscopic theory of hardness and design of novel superhard crystals. Int. J. Refr. Met. Hard Mater. 2012, 33, 93–106. [Google Scholar] [CrossRef]
- Blistanov, A.A.; Zadneprovskii, B.I.; Ivanov, M.A.; Kochurikhin, V.V.; Petrakov, V.S.; Yakimova, I.O.; Zadneprovskiĭ, B.I. Luminescence of crystals of divalent tungstates. Cryst. Rep. 2005, 50, 284–290. [Google Scholar] [CrossRef]
- Yang, M.; Liu, X.; Hou, T.; Du, L.; Wang, Q.; Chang, B.; Li, B.; Liu, J.; Deng, G.; Kityk, I. Synthesis and luminescent properties of GdNbO4:Bi3+ phosphors via high temperature high pressure. J. Alloy. Compd. 2017, 723, 1–8. [Google Scholar] [CrossRef]
- Kim, J.M.; Han, B.Y.; Lee, H.J.; Yoo, J.S. A blue-emitting Gd(Nb,P)O4:Bi3+ phosphor for cold cathode fluorescent lamp applications. Electrochem. Solid-State Lett. 2008, 11, E29–E32. [Google Scholar] [CrossRef]
- Noto, L.L.; Pitale, S.S.; Ntwaeaborwa, O.M.; Terblans, J.J.; Swart, H.C. Cathodoluminescent stability of rare earth tantalate phosphors. J. Lumin. 2013, 140, 14–20. [Google Scholar] [CrossRef]
- Liu, W.; Zhang, Q.; Zhou, W.; Gu, C.; Yin, S. Growth and luminescence of M-type GdTaO4 and Tb:GdTaO4 scintillation single crystals. IEEE Trans. Nucl. Sci. 2010, 57, 1287–1290. [Google Scholar] [CrossRef]
- Xiao, X.; Yan, B. Synthesis and luminescent properties of novel RENbO4:Ln3+ (RE=Y, Gd, Lu; Ln=Eu, Tb) micro-crystalline phosphors. J. Non-Cryst. Solids 2005, 351, 3634–3639. [Google Scholar] [CrossRef]
- Si, J.; Yang, N.; Xu, M.; Li, G.; Cai, G.; Yi, W.; Zhang, J. Structure and tunable luminescence in Sm3+/Er3+ doped host-sensitized LaNbO4 phosphor by energy transfer. Ceram. Int. 2020, 46, 28373–28381. [Google Scholar] [CrossRef]
- Ding, S.; Zhang, H.; Zhang, Q.; Chen, Y.; Dou, R.; Peng, F.; Liu, W.; Sun, D. Experimental and first principle study of the structure, electronic, optical and luminescence properties of M-type GdNbO4 phosphor. J. Solid State Chem. 2018, 262, 87–93. [Google Scholar] [CrossRef]
- Shcherbina, O.; Smirnov, M.; Masloboeva, S.; Andryushin, K.; Efremov, V.; Palatnikov, M. Structure and properties of luminescent ceramics GdNbO4 obtained by usual technology and by hot pressing. Optik 2021, 245, 167683. [Google Scholar] [CrossRef]
- Brunckova, H.; Kolev, H.; Rocha, L.A.; Nassar, E.J.; Moscardini, S.B.; Medvecky, L. XPS characterization and luminescent properties of GdNbO4 and GdTaO4 thin film. Appl. Surf. Sci. 2019, 504, 144358. [Google Scholar] [CrossRef]


Publisher’s Note: MDPI stays neutral with regard to jurisdictional claims in published maps and institutional affiliations. |
© 2022 by the authors. Licensee MDPI, Basel, Switzerland. This article is an open access article distributed under the terms and conditions of the Creative Commons Attribution (CC BY) license (https://creativecommons.org/licenses/by/4.0/).