Abstract
Supply Chain Management (SCM) has received considerable attention from the industrial community in recent decades. SCM continues to be an interesting and relevant research topic in many business areas such as revealing supply chain integration benefits, uncertainty and risk mitigation methods, decision-making and optimization methodologies, etc. In current supply chain management, huge volumes of data are being developed each second, and emerging technologies such as Radio Frequency Identification (RFID) have amplified the availability of online data. Using Artificial Intelligence (AI) methods that go beyond simply using the huge volume of online data enables Supply Chain (SC) managers to monitor everything in a timely fashion. There are several aspects of an SC that AI—and specifically Artificial Neural Networks (ANNs)—can be applied to better help them manage and optimize. This study aims to review state-of-the-art ANNs and Deep Neural Networks (DNNs) in the field of supply chain management. One hundred high-quality research studies that applied ANNs in supply chain management are reviewed and categorized into four classes: performance optimization, supplier selection, forecasting, and inventory management studies. Our study shows that there is a significant possibility that we could use ANNs and DNNs to better manage supply chains. Across the reviewed studies, neural networks are frequently reported to improve predictive performance and support monitoring/control in complex, nonlinear supply chain settings, often complementing traditional operations research approaches. Finally, the limitations of ANN models and the possibilities for future studies are presented at the end of this study.
1. Introduction
1.1. Supply Chain Management (SCM) and Artificial Intelligence (AI)
A Supply Chain (SC) is a network of facilities that supports raw material procurement, product manufacturing, and the distribution of the final product to customers [1]. Supply Chain Management (SCM) is managing the companies and steps involved in moving products, information, and money from suppliers to the final customer. SCM is not just about shipping and delivery, it also includes working together with partners up and down the supply chain, because decisions made by one company can affect the others in the same supply chain [2]. SCM is looking at how to integrate the major processes in an SC, from the suppliers to the final customers and post-sales services. Designing an SC network would control all elements in the SC operations to ensure flexibility against business environment changes, as well as ensure cooperation between all stages of the SC [3].
SCM involves decisions made at different levels (strategic, planning, and operational). These decisions include designing facilities and the supply chain network, choosing suppliers and sourcing, planning production, planning transportation and distribution, and managing inventory. A key idea in SCM research is that demand and orders can become more unstable as they move up the supply chain (the “bullwhip effect”), so forecasting and coordination are important for cost and service results [4]. Modern supply chains face uncertainty from changing demand, changing lead times, and disruptions. These problems are even harder when supply chains work across many locations and partners. At the same time, supply chains now produce more data from sales systems, planning systems, tracking tools, and sensors. Because of this, recent research also looks at digital and data-based ways to improve visibility and response. One example is the idea of a digital supply chain “twin,” which links real-time data with models to help monitor the supply chain and support decisions [5].
Recent SCM research more often treats “state-of-the-art” AI as tools for handling disruptions and staying resilient, especially after the pandemic and other frequent shocks [6]. Instead of seeing disruptions as rare events, newer work focuses on constant tracking, early warning signals, and fast recovery plans supported by data-based models. For example, Reference [7] shows how machine learning models can predict product availability dates during disruptions to support logistics and inventory decisions when lead times are not reliable.
SCM has become a very popular research topic in recent decades. Companies are dealing with increased service-level expectations these days, and there is continuous competition to gain and maintain a profitable market share. This requires both improvements and a readiness to appropriately respond to market fluctuations. Successful businesses are defined by lower costs, shorter production times, shorter lead times, efficient inventory management, appropriate customer service, and efficient cooperation between manufacturing, supply, and demand [3]. SCM was developed in order to help implement, in a business, the aforementioned competitive advantages and is becoming a necessity for successful businesses. Since the introduction of SCM in 1982, there has been a lot of industrial and academic research in this field.
Several operations’ research and classic optimization methods have been used to study SCM problems in the last four decades. However, computers’ ever-increasing processing power and the resulting emerging technologies have changed the nature of input variables in SCM studies. Nowadays, SC managers have access to a vast volume of online data that can be used in descriptive, prescriptive, and predictive analytics. These technological processes are often associated with the term “intelligent supply chain management,” in which decision support systems apply input data in order to make decisions with the lowest possible level of human intervention. Using AI methods in SCM studies has been an efficient way to achieve intelligent SCM.
Artificial intelligence (AI) refers to methods that learn patterns from data and help with decisions that are hard to handle with fixed rules. Prior work describes AI in SCM as a set of tools that can support planning and control tasks such as forecasting, scheduling, supplier selection, logistics decisions, and risk management [8].
Forecasting is an important step for many supply chain decisions, but it becomes harder when demand signals change as they move upstream (the bullwhip effect). Many studies use machine learning models, including neural networks and recurrent neural networks, to learn patterns from past demand and related inputs and improve short-term and medium-term forecasts. For example, Ref. [9] compares several machine learning methods with common baseline methods such as moving average and regression in supply chain demand forecasting. Recent review papers also show that inventory topics make up a large part of machine learning work in supply chains. They also often discuss reinforcement learning as a way to learn ordering rules by trying actions in a simulated or real setting. Ref. [10] reports that demand forecasting has the most machine learning studies, followed by inventory management and transportation topics. Ref. [11] reviews reinforcement learning in supply chain management and reports that inventory management is the most common area in that reinforcement learning research.
At the modeling level, supply chain forecasting has moved beyond earlier ANN and RNN models to attention-based models and other newer deep learning models for time series that can handle longer time links and changing demand patterns [12]. More recent work goes further by building inventory cost into the training goal, so the model learns forecasts that also reduce inventory-related costs. This reflects a shift toward methods that train forecasting and decision-making together [13].
This study also looks at AI for logistics and supply chain risk, where the goal is to improve visibility and response when conditions change. In logistics, AI models are used to support decisions such as transportation planning and routing, especially when there are many limits and the situation changes during the day. In risk and disruption management, machine learning is often discussed as a way to spot risk signals earlier and support faster response. For example, Ref. [14] reviews machine-learning-based supply chain risk management and discusses how ML can support risk prediction and quicker reaction.
At the same time, because supply chains are networks, more studies now use graph-based learning and knowledge representations to model risk, links between firms, and how problems spread through the network [15]. Generative AI and Large Language Models (LLMs) are also starting to be used in SCM analytics. They can act as a natural-language tool for planning and “what-if” questions, and they can help find risk signals in text data [16].
More recent studies have shown that AI can be useful in many SCM studies with prediction and optimization applications. Instead of covering every AI method, this paper focuses on artificial neural networks (ANNs) and deep learning because they are often used when supply chain relationships are not straight-line and when there are many input factors. In this paper, neural networks are treated as one important part of AI-based decision support in SCM. The reviewed studies are discussed based on the main SCM problems they address (for example, forecasting and inventory decisions). This matches how AI-in-SCM review studies describe the field as broad and growing quickly [17].
1.2. Artificial Neural Networks (ANNs)
AI methods are based on computer-aided systems that can be trained using historical data. Most AI applications in SCM problems include neural networks and expert systems. An important benefit of using ANNs is that they can eliminate the need to use a formula for decision-making processes. This feature enables ANNs to better work with the uncertainty and complexity of decision-making problems [18]. Because of their ability to model human associative memory, ANNs are used across a wide range of subjects; however, their applications in SCM problems were limited to only a few problem types [18]. An ANN is a powerful modeling tool that helps us understand complex input/output trade-offs. The supremacy of an ANN is in its ability to analyze both linear and nonlinear relations and learn these relations from the modeling data.
Recently, “ANNs” are often used to mean a wider group of newer neural network models that fit today’s data, and they have been used in inventory control workflows to connect forecasting with replenishment decisions [19]. Moreover, because supply chains are made up of connected relationships (firms, suppliers, products, and routes), graph neural networks (GNNs) are used more often to model these links and track how risk signals spread across tiers. For example, methods that combine knowledge graphs with GNNs have been proposed to find hidden supply chain risks when data are incomplete or split across sources [20]. Related graph attention models have also been developed for supply chain finance to improve risk assessment in long credit chains by learning directly from the network structure [15].
The concept for an ANN is derived from biological science, and its application in computational studies started in 1940 [21]. Elements of an ANN are organized like a cranial nerve and have similar characteristics. An ANN is able to obtain a new result by learning from past experiences and correcting itself in response to variations in its environment [22]. ANNs differ when it comes to the training method that they use. For instance, a Bayesian Neural Network (BNN) is composed of a probabilistic model and an ANN. A BNN aims to combine the benefits of both ANNs and stochastic modeling. A BNN can use its observations to obtain the parameters’ probabilistic distribution; therefore, ANN learning parameters would be inferred in their own probabilistic space [21]. A Radial Basis Function (RBF) network is another type of ANN that applies a radial construction mechanism. This construction gives the hidden-layer parameters of the network better interpolation than a multilayer perceptron, which enables faster network training [23].
1.3. Deep Neural Networks
Deep Neural Networks (DNNs) are neural networks that have several hidden layers between the input and the output. The main idea is that having many layers helps the model learn in steps—early layers learn simple patterns, and later layers learn more complex patterns—without using hand-made rules. This “many-layer” design is why they are called deep networks, and this is what DNN means in deep learning [24]. In recent SCM research, DNN-based models are used as data-based tools to support tasks such as demand and sales forecasting, inventory control, supplier decisions, transportation and logistics planning, and other supply chain planning and control work [2].
Deep learning (DL) is the broader term that is closely linked to DNNs. In this paper, DL means learning methods that use models with many layers. In practice, these models are usually DNNs, including common types like deep feedforward networks, convolutional neural networks, and recurrent neural networks, depending on the data and the task [24]. There are recent publications in the SCM literature that have used DL for decision-making practices. DL is a novel pattern recognition technique that can automatically extract more expressive features from the data and recognize complex nonlinear patterns between the inputs and outputs [25]. DL works using the same basics as ANNs. DL is generally a common word for an ANN with more than one layer between the input and output layers that is looking for rules, modes, and hidden relationships in big data. In theory, a Neural Network with one hidden layer can approximate a wide range of functions, but more hidden layers are added mainly to learn more complex and nonlinear patterns from data [26]. In many cases, deeper networks need more training time and more computing resources. The number of hidden layers in an ANN is known as the network’s depth. Depending on what the network’s application is, DNN depth can range from two to several hundred hidden layers. DL uses DNN structures to solve complex problems. Major applications of DL include natural language processing, image processing, bioinformatics, computer vision, etc. [24,27]. DNNs are more powerful than traditional ANNs in analyzing complex data relationships and features.
DL requires a high level of computing power and large-scale data to train the network. Therefore, current developments in computer science and the availability of large-scale datasets have had a large impact on DL’s popularity among data analysts. Figure 1 shows that DL has better prediction performance when working with large-scale data, but other learning algorithms may have better results if there is not as much data used to train the network.
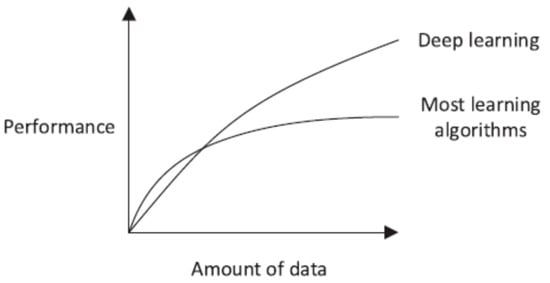
Figure 1.
DL performance compared with other machine learning algorithms [28].
Recent developments in parameter optimization algorithms are another reason for the popularity of DNN applications in SCM [28]. A DNN uses successive neuron layers, and each layer extracts features from the output of earlier layers. Therefore, DL can extract features without the need for preprocessing [29].
Several DNNs have been developed with the rapid progress of computer science in mind; Recurrent Neural Networks (RNNs) and Convolutional Neural Networks (CNNs) are among the most applied DNNs [30] in the SCM literature. Generally, RNNs are best used when working with sequential data, where these sequences do not necessarily have a specified or similar length. RNNs are ANNs with feedback loops and the ability to keep former decisions in memory. A feedback loop enables the network to model data dependency [31]. There is an activation feedback that plays the role of short-term memory. In a standard RNN, information flows forward through the sequence over time. At each time step, the model uses the current input together with a hidden state that carries information from earlier time steps. If a model processes the sequence in both the forward and backward directions, it is called a Bidirectional RNN. RNNs use the current inputs alongside past inputs in order to keep the information continuously present. Figure 2 shows the information flow in an RNN.
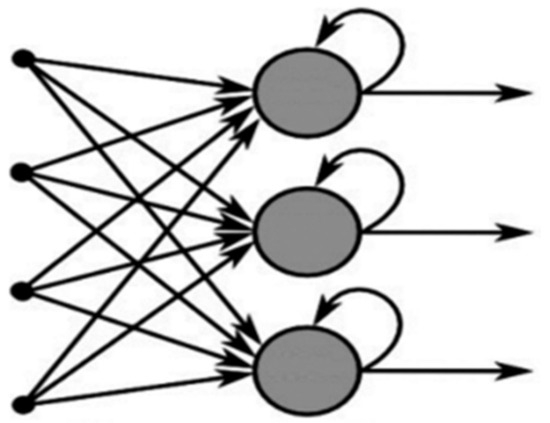
Figure 2.
Information flow in an RNN [32].
CNNs have shown noteworthy performance in analyzing vision tasks. CNNs are ANNs with one or more convolutional layers. A convolutional layer is a layer in the network that takes an array with any dimension, transforms it into a vector, and passes the components over to create a smaller vector. CNNs study the spatial dependencies in data, such as the dependency of neighboring pixels in a photo. The purpose of CNNs is to first understand the relations at the lowest level and then build these relations at higher levels. Therefore, not all neurons are connected in a CNN; each neuron is only connected to neighboring neurons. Figure 3 shows a part of a convolutional layer.
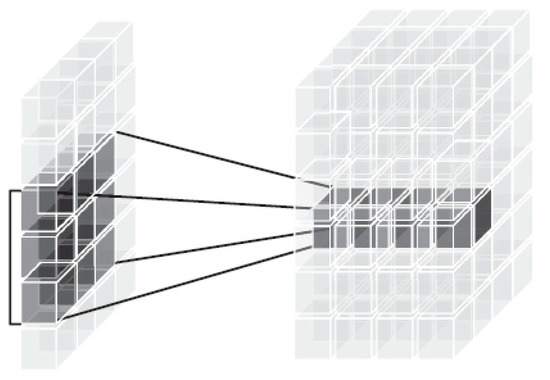
Figure 3.
Exploiting the spatial structure in input data (left) to compute the output in a CNN [28].
The major difference between CNNs and regular ANNs is that CNNs can learn features that must be hand-crafted in traditional ANNs. CNNs aim to model high-level abstractions from visual data using several nonlinear transformations. CNNs are renowned for their extraordinary performance in object recognition and image classification [33,34].
Recent deep learning work in supply chain management has moved from only predicting outcomes to also supporting decisions, modeling supply chain networks, and creating “what-if” scenarios to handle disruptions. Deep reinforcement learning has been used to learn ordering and allocation rules for inventory and distribution problems, which can reduce the need to build hand-made rules [35]. Generative models are also used to create demand scenarios so companies can test plans under disruptions and use these scenarios in optimization [36]. Some studies also pair deep learning forecasts with explanation tools so planners can understand the reasons behind delivery-risk and lead-time predictions and use them in planning [37].
1.4. Training Neural Networks
A multilayer perceptron is a nonparametric ANN, and there is no restricting assumption regarding its variables [38]. There are many algorithms available for training a multilayer perceptron, but Back-Propagation (BP) is used most often because of its high accuracy and low complexity. BP was developed in 1986 by a group of scientists led by Rumelhart and McClelland [21]. Later, Ref. [39] showed that the prediction accuracy of BPNNs for nonlinear data was better than that of other methods such as time-series and regression techniques. This algorithm adjusts weights that are randomly assigned to the neurons of an ANN. An ANN that uses BP includes an input layer, some hidden layers (according to the problem structure), and one output layer [40]. Selecting the number of units in the hidden layers is directly related to the network’s ability to generalize [41]. A lower number of units leads to an inability to learn the structural relations in the input data, and a higher number of units leads to memorization of specific features of the input data (even random variations) by the units. The number of hidden units should be determined by stepwise training.
Applying ANNs in SCM involves three steps: creating an ANN, training, and validating. The input/output parameters, hidden layer design, and training algorithm should be determined when creating the ANN. The major point of BP is to divide information transmission into two sections: forward propagation and error BP. In forward propagation, data is received at the input layer, processed in the hidden layers, and sent to the output layer. When it comes to training the network, we then provide data and random weights to the network. Random weights should be adjusted in a way that minimizes the difference (error) between the output and the desired result. Error is calculated based on the network output and is then sent to the BP step. The error is then dispersed among every node in every layer and is used to adjust the nodes’ weights. Forward propagation is then recalculated after the weight adjustment, and this cycle continues until the error parameters fall within acceptable bounds. When the error is within acceptable limits, we can stop the weight adjustment and save the results. Network validation includes testing the network’s performance with data sets other than the one that was used for training the network. This is done to ensure that the network properly learned the relation between the input and output variables, and did not simply memorize it.
Recent supply chain neural network training has moved beyond one-time, offline training to setups that work better when demand and conditions keep changing and disruptions happen. For decisions over time, like inventory replenishment with changing demand and lead times, deep reinforcement learning learns a policy by trying actions in a simulated environment instead of only learning from past labeled data [42]. Because companies often cannot share raw data, some work uses federated training, where firms share model updates instead of transaction data to predict supply risk while keeping data private [43]. To handle rare disruptions, researchers also use synthetic data and model-management practices to add more “disruption” examples and test models before use [44]. In forecasting, more studies now include uncertainty, such as using conformal forecasting on top of neural models to give prediction ranges that help with safety stock decisions [45].
It is noteworthy that in BP training, all the layers of a network are fully connected, which means all the neurons in every layer are connected to all neurons in every adjacent layer. Figure 4 shows the common architecture of an ANN that uses BP training.
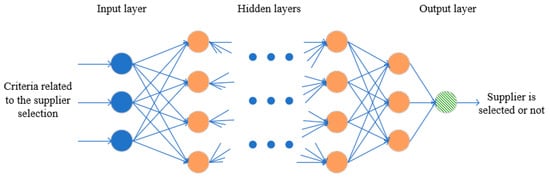
Figure 4.
Architecture of a neural network.
Because of the aforementioned benefits of using ANNs to accomplish intelligent SCM, there is a need for a study that integrates the state-of-the-art ANN applications in SCM for researchers in this area. The dominant forecasting accuracy of ANNs has been shown to be a key feature in optimizing supply chains with uncertain parameters. Since applying ANNs in other fields such as healthcare, production, computer science, etc., has been shown to be more efficient than traditional methods, using them in SCM can bring considerable benefits as well.
This article gives a clear and organized summary of how Artificial Neural Networks (ANNs) and Deep Neural Networks (DNNs) are used in Supply Chain Management (SCM). Other review papers have looked at a wider set of “soft computing” methods, but this study focuses only on ANN/DNN work in SCM. It brings together results that were spread across many different papers into one place. We looked through many papers and then selected 100 peer-reviewed studies that relate to supply chain decision-making. We reviewed them in a consistent way by following these steps: selecting the papers, describing them, grouping them into categories, and comparing them.
A second contribution of this paper is the way it organizes the studies. We group the research into four main SCM areas: (1) tracking and improving supply chain performance, (2) choosing and evaluating suppliers or partners, (3) forecasting demand and sales, and (4) managing inventory. For each area, we provide a structured summary. This helps researchers and professionals quickly see where ANN/DNN methods have been used, what decisions they help support, and how they are sometimes combined with other methods in different situations.
In the remainder of this paper, Section 2 describes the methodology used to select the published research papers for this review study. Section 3 categorizes the papers and describes the major applications of ANNs in each category, alongside each paper’s contribution. Finally, concluding remarks and possible directions for future studies are provided in Section 4.
2. Methodology
This study focuses on reviewing high-quality research papers that applied ANNs in SCM studies. The review process is performed using a content analysis approach, which involves the following four steps [46]:
- Publication selection: Related publications are selected from various sources.
- Descriptive analysis: General information based on descriptive statistics is presented.
- Categorization: Main characteristics of the literature are identified, and categorization is performed regarding the major topics and common features.
- Evaluation: Publications are analyzed based on the suggested categorization, and main contributions are interpreted.
2.1. Publication Selection
There are several publications that use ANNs in their SCM analysis approach. However, in order to define a direction for the current study, the following criteria have been considered when selecting the papers:
- The paper must be written in English.
- The paper must be published in a peer-reviewed journal.
- SC is a broad concept that includes almost all operations within a company. The paper must include the concept of SC in its context. Papers that solely applied ANN in a single operation of a company were not considered in the current study. For example, a researcher may use ANN to predict a company’s stock price. Although pricing is an SC subject, this paper is not included in our review due to a lack of any SC concepts.
We searched various electronic databases and online libraries using related keywords. This keyword-based search, which is recommended by many researchers [47,48,49], is an efficient way to cover the largest possible number of papers on a topic in the shortest period of time. However, we used cross-referencing and bibliometric software to complement our search method as well. “Neural Network,” “Artificial Neural Network,” “Machine Intelligence,” “Computational Intelligence,” “Deep Learning,” “Recurrent Neural Network,” and “Convolutional Neural Network” are keywords that we combined with “Supply Chain” to find relevant publications. We used the default search option in the Scopus database for “article” documents, using an “Article title, Abstract, Keywords” combination search. Table 1 shows the result.

Table 1.
The initial keyword-based search results in Scopus.
We refined a total of 715 articles by removing duplicate papers, which resulted in 352 papers. After carefully analyzing the papers’ content, we found that 89 of these papers are within the scope of our topic. To guarantee that we had covered almost all papers related to our subject, we complemented the Scopus search results using the following actions:
- We searched Google Scholar with the same keywords and assessed the results. Although most of the related papers were covered in the Scopus database, we found 11 more papers.
- After analyzing the papers from Scopus and Google Scholar, we realized that almost all the selected papers were published in ScienceDirect, Taylor and Francis, Springer, and Emerald. Therefore, we searched these publishers individually with the same keywords. This step did not yield any new papers to add to our database.
In summary, around 800 papers were reviewed, and 100 were included in the final database according to our screening criteria.
2.2. Descriptive Analysis
In this subsection, we discuss the general descriptive facts about the selected articles. We do not aim to provide extensive bibliometric and reference network analysis here, since there are commercial software packages such as BibExcel and Gephi that offer this. Someone can use our database as input data in order to extract more data analysis. Our current study is more focused on analyzing the content of the selected papers in order to identify the application of ANNs in SCM. A time-based analysis of these selected papers gives us interesting information on the publication trend in the field.
Figure 5 shows that, before 2008, there was not as much interest in publishing research using ANNs and DL to solve SCM problems. However, in 2008, the number of relevant publications increased significantly. Figure 6 shows the frequency of selected publications by journal.
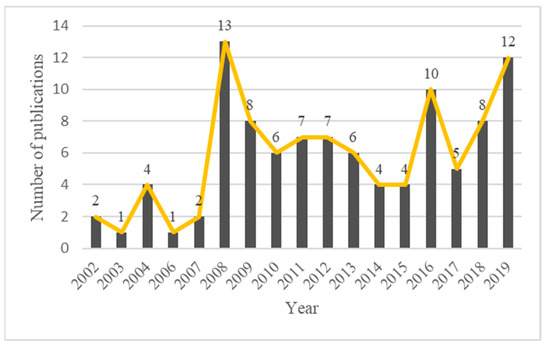
Figure 5.
Number of publications per year.
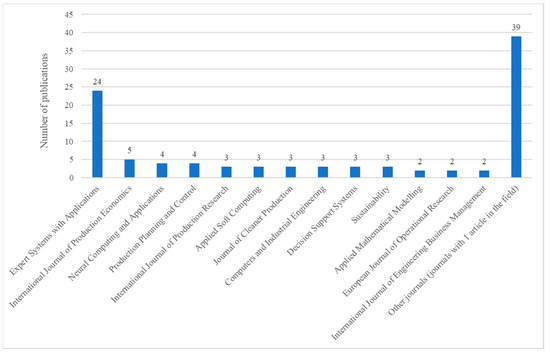
Figure 6.
Distribution of selected papers by publishing journal.
Figure 6 shows that Expert Systems with Applications and the International Journal of Production Economics published the most works on ANN and DL applications in SCM. Finally, Figure 7 shows the geographical locations of institutes that participated in using ANNs and DL in the SCM literature. For this analysis, we used only the corresponding author’s organization country for each paper. The degree of contribution is highlighted by the size of the circled shadow. The general conclusion is that this topic has attracted research organizations from many countries around the world. The highest density is found in China and Taiwan, with 26 and 11 published articles, respectively. Researchers from organizations in Turkey, Republic of Korea, Iran, and the UK are at the next levels of contribution to the field.
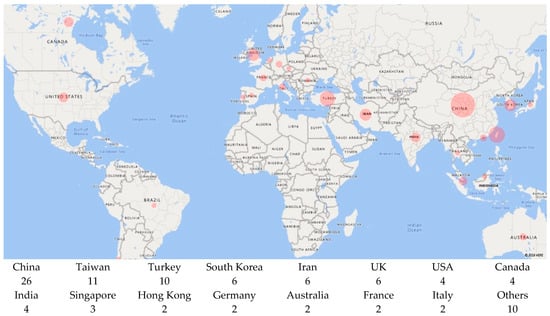
Figure 7.
Country of contributing organizations.
2.3. Categorization
All one hundred papers were studied and analyzed based on their major research focus. After studying all screened papers, the authors classified these papers into four major research focuses: (1) monitoring and/or optimizing total SC performance, (2) supplier/partner evaluation and selection, (3) demand/sales forecasting, and (4) inventory management. The next section is dedicated to explaining the ANN applications in each of these four research areas. The selected papers in each class are summarized in tables. It is notable that some of the papers focus on more than one topic; therefore, a secondary focus area has been defined for studies that fall into more than one class.
2.4. Content Evaluation
An ANN is a parallel information-processing structure that is composed of interconnected nodes called neurons. These neurons are nonlinear processing units that generate output by performing mathematical operations on input data [50]. Training the ANN enables it to recognize data patterns by copying the human brain’s mannerisms [51]. Neurons behave very simply, but the strong interconnection between neurons enables the network to model and solve very complex problems [52], as well as SCM problems. This section is dedicated to studying the four main categories of ANN applications in SCM. The one hundred reviewed papers are categorized into these four groups, and a summary of each paper is provided in a table in each subsection.
2.4.1. Monitor and/or Optimize the Supply Chain Performance
SC players can generally be categorized into four different element types: customers, distribution centers, manufacturing facilities, and suppliers. The performance of each element can affect the overall performance of the SC [53]. For instance, the production capacity of a plant can negatively affect the service level of an SC, regardless of the efficiency of the other units. Therefore, it is required that SC decision makers consider all the interactions and limitations for every member of the SC in order to achieve the best results. Besides the operational factors and constraints, managers should consider market dynamics such as product returns, demand variations, and research and development impacts in optimizing an SC. Decision-making is usually very difficult when it comes to the variety and complexity of optimization topics in SCs. Therefore, mathematical and analytical models are often used in the literature to support managers’ decision-making processes.
SCM is trying to improve overall SC performance by managing the flow of information, finance, services, and products [54]. SC optimization problems can be studied at three levels: strategy, planning, and operations [55]. At the strategic level, problems with long-term investments, such as network design and facility location issues, are investigated. The planning level is dedicated to studying problems such as coordination, logistics processes, and revenue management. Finally, problems such as warehousing operations and scheduling are among those studied at the operations level. Ref. [56] believes that using continuous improvement concepts and methods would improve SC performance; therefore, performance assessment has become an important process in SCM.
There are various objective functions used in performance optimization problems, such as customer satisfaction based on order fulfillment [57], technology adoption [58], production quality [59], production planning [60], sustainability performance [61,62], logistics management [63], and risk mitigation [64], etc. ANNs can also predict behavioral changes in an SC. Ref. [65] applied ANNs to predict behavioral changes at the initial stage of decision-making in an SC. This prediction-based ANN provides a general insight into tackling negative behavioral changes in the future.
Recent research treats “performance monitoring and optimization” as real-time control that uses live operating data and learning-based decision rules, instead of mainly using fixed, offline optimization. One area of research uses digital twins to track performance, spot bottlenecks, and try out changes before using them in real operations. For example, Ref. [66] proposes a digital twin method that uses process modeling and simulation for order fulfillment. Recent results show these methods can lower total cost compared with fixed policies in settings like multi-warehouse, two-level networks [67]. Because performance problems can spread through links between firms, graph-based deep learning is also being used to track and reduce network risk that affects cost and service. For example, Ref. [15] uses a graph neural method to assess credit risk in long supply chains for supply chain finance, where standard models often miss relationship-based risk.
Recently, sustainable SCs and food SCs have received much more attention from researchers. Ref. [68] investigated a low-carbon resource allocation problem in an SC using a quantum chaos ANN method. The results show that ANNs surpass previous techniques for resource allocation in an SC. Ref. [69] introduced a food traceability solution that evaluates the quality of food over an SC and provides real-time information for customers. The evaluation process is done using fuzzy classification, and an ANN is employed to determine the final quality grade of food. The proposed solution is applied in a pork-based food industry. In another study, ANNs were applied by [70] to predict the temperature of perishable foods in different echelons of an SC. Multiple temperature records were generated by a heat transfer model in order to train ANNs. The results highlighted that an ANN has superior performance when it comes to predicting real food temperature.
Solving monitoring and optimization problems requires determining the critical factors and their impact on SC performance. Using ANNs to determine the relative importance of effective factors in performance prediction criteria can be used for possible nonlinear features as well. ANNs and DL can be used as a complementary tool for common optimization methods, such as an agent-oriented SC model. This would create a simple, realistic calculational framework in which one could map the supply, manufacturing, and logistics resources. As long as complex optimization problems can be divided into easier subproblems, multiple ANNs can be used to solve these subproblems, which are then merged into the final solution [71].
ANN approaches can be applied to determine the best decision-making model to use in terms of optimizing SC relationship quality as well. Studies show that ANN models are powerful predictive decision-making tools [72]. Ref. [73] predicted future SME financing credit risk in an SC using ANNs. They applied the proposed model in a real-life case study of an SME in China. An ANN’s ability to predict the variables under study is commonly used in SC optimization problems. Optimization models are developed in order to optimize an objective function that generally can be measured in terms of an output variable. Since an ANN’s predictive performance is more accurate when compared to traditional predictive methods, ANNs are more commonly used to predict the effect of input variables on the output variable(s) [58]. ANNs are applicable when predicting production cost, environmental impact, and SC process time. Moreover, an ANN’s predictive capacity regarding optimization problems is applicable to problems that are more uncommon, such as humanitarian/disaster relief SC problems. ANNs are powerful, data-driven, flexible, and self-adaptive computational tools that can study complex and nonlinear characteristics of any physical process with a high degree of accuracy [74].
Because the ANN-based approaches reviewed are often used as part of heuristic or hybrid numerical methods, how well they work depends on the situation. So, in Table 2, we clearly state where each study applies by listing (i) the decision level it focuses on (strategic, planning, or operational), (ii) the SCM function or goal it aims to improve (for example, cost, service level, quality, risk, or sustainability), and (iii) the setting and data situation (a real case, a lab setting, or a simulation). This helps readers understand the reported numerical results by comparing studies in similar situations, instead of assuming there is one overall performance ranking that applies across very different studies. Table 2 provides more information on research articles that used ANNs and DL in SC performance optimization problems, including the primary quantitative evaluation metric(s) and the best reported performance value(s) (as reported in each study). Because studies use different datasets, objectives, and metrics, these numeric values are reported for transparency but are not directly comparable across papers.
2.4.2. Supplier/Partner Evaluation and Selection
Supplier selection and evaluation have played an important role in saving procurement cost and time, and in improving product and/or service quality. A notable portion of the supplier selection literature depends on supplier evaluation processes [75]. Supplier evaluation and selection studies gained particular importance once organizations became more motivated to outsource their less-profitable activities and focus more on their core competitive processes [76]. Many studies have applied and implemented mathematical methods for selecting suppliers, and numerous multi-criteria decision-making tools were developed to improve supplier selection decisions [77].
Supplier evaluation is a complex process, involving various criteria and objectives, each with different alternatives and restrictions [78]. A few studies were dedicated to supplier selection and evaluation, each of which was customized for a special case [79,80]. That said, there is still a need to work further on developing supplier selection models that can work under different circumstances.
There is a vast quantity of literature that focuses on using different methods to solve supplier selection problems. We can name a few methods, such as Case-Based Reasoning [81], Data Envelopment Analysis (DEA) [82], Analytical Hierarchy Process (AHP) [83], Multi-Objective Linear Programming [84], Multi-Criteria Decision-Making [85], or certain combinations thereof [86].
Each of the aforementioned methods has its own restrictions. For example, AHP is very simple to use but, crucially, depends upon human judgment in weight selection [87]; DEA is sensitive to outliers and statistical noise [88]; mathematical programming gives exact results but does not consider qualitative characteristics [89], etc. Using ANNs for supplier selection and evaluation does not follow the constraints of traditional methods and can simulate human brain functioning through an information-processing method.
Table 2.
Reviewed articles using ANNs and DL for monitoring and/or optimizing supply chain performance.
Table 2.
Reviewed articles using ANNs and DL for monitoring and/or optimizing supply chain performance.
| Research | Contribution | Secondary Focus | Methods Combined with ANN | Reported Evaluation Metric(s) | Best Reported Quantitative Result | Case Study |
|---|---|---|---|---|---|---|
| [71] | Develop a methodology to ensure complete order fulfillment and increase resource utilization | Inventory management | Manufacturing Resource Planning (MRP) | Order fulfillment rate/Operational savings/Profit change/Resource utilization | 100% order fulfillment (ANN); vs. auction: 65% fulfillment/ANN trade-off: profit +$15,450 with savings $5467 | Company selling assemble-to-order personal computers |
| [60] | Develop a prediction model to coordinate mid-term and short-term production planning | Production planning | Linear Programming (LP) | MAD/RMAD prediction error for demand (ELSD) and setup time/Mean total cost | ELSD MAD 3.22 (16.5%); setup-time MAD 0.72h (9.7%); costs −62% | Simulation |
| [57] | Develop a buyer order allocation policy in order to reduce the average amount of backorders | Demand forecasting | Order allocation policies | Average backorder (30 replications) | Backorder reduced 5–50% | Various data sets from the literature |
| [65] | Predict the behavior of SCs due to internal and external influential factors | Forecasting | System dynamics/Eigenvalue analysis/Simulation | Training error/Validation error | Testing accuracy ≈95%/Minimum validation error 0.0595 | Electronics manufacturing company |
| [63] | Select the proper logistics mode in a global SC | Global logistics operations | Multi-Criteria Decision-Making (MCDM)/Fuzzy inference/Analytical Hierarchy Process (AHP)/TOPSIS | Mode-choice forecast accuracy/ANFIS total training error | 70% correct mode identification (14/20 enterprises)/Minimum total training error 0.042 | Information Technology (IT) industries of Taiwan |
| [90] | Using ANNs to manage SCs as a Complex Adaptive System (CAS) | Supply network design | Complexity theory | None: proposes neural-network monitoring to manage extreme events | Recommends further research or testing for managing extreme events | Analytic approach |
| [91] | Develop a mechanism to control temperature in cold chain management | Food SCs | Exponentially weighted moving average (EWMA) | Accuracy (%)/Mean squared error (MSE) | Best accuracy 99.448% with MSE 0.00097 | - |
| [92] | Develop a hybrid model to simulate product-driven system architecture | - | Simulation | Mean and standard deviation of throughput-time residuals on learning and validation sets | RQM = 5 model achieved best reported mean residual 7.22 s learning, 7.75 s validation; SD ≈ 333–336 s | Sawmill internal SC |
| [93] | Determine the important factors in improving SC performance | - | Structural equation modeling/PC-algorithm | 10-fold cross-validation average prediction error/Minimum error | 10-fold average prediction error 6.8% (model1), 9.67% (model2)/Minimum error 2.3% | Manufacturing companies in Hong Kong |
| [59] | Develop a model to detect and warn of abnormalities in a production SC | Food SCs | Abnormality diagnosis algorithm/Pre-warning system/Fuzzy control/Simulation | Binary diagnosis output om (threshold 0.5) | 28 fault modes | Pork production company in China |
| [94] | Selecting common parts for different product groups to reduce production planning complexity | Green SC | Group Technology (GT), Self-organizing feature maps | Minimum-cost production program under cost and capacity constraints | Minimum cost when orders divided into four groups/Best program group 16 | A company in Taiwan |
| [95] | Develop a hybrid model for positioning the picking cart in warehouses | Warehouse management | RFID system/Artificial Immune System (AIS)/Fuzzy logic | Training and test MSE/Average accuracy rate/10-fold cross-validation on collected RSSI-position datasets | Training MSE 0.001644/Test MSE 0.001115/AIS-FNN: 100% accuracy | Lab experiments |
| [96] | Develop a methodology to boost SC performance | Risk management | - | Relative prediction error E | - | Data sets in the literature |
| [97] | Develop a hybrid model to evaluate, predict, and optimize the performance of a SC | Supplier evaluation | Balanced Scorecard | MSE/Fitness R/Maximum error between predicted and actual performance indices | Stable training: MSE 5.13 × 10⁻⁹, R ≈ 1/Maximum error < 0.02% | Automotive company in China |
| [98] | Optimize a SC construction under uncertain conditions | Risk management | Simulation/Genetic Algorithm (GA)/Simulated Annealing (SA) | Maximized supply chain profit | Market-demand satisfaction: d = 0.91, e = 0.93 | - |
| [58] | Studying RFID adoption in healthcare SCs | - | Unified theory of acceptance and use of technology | RMSE accuracy/10-fold cross-validation with 90% training, 10% testing | Mean RMSE 0.470 training/0.466 testing/Regression RMSE 0.512 | Survey data from a medical group in Malaysia |
| [99] | Using ANNs for predicting apple temperature in an apple SC | Food SC | Thermal imaging | RMSE and correlation coefficient between estimated and RFID-measured pallet temperatures | Cardboard: RMSE 0.086 °C vs. 3.56 °C thermal-image-only/Plastic: R2 0.9995 | Controlled room experiments |
| [68] | Analyze a resource allocation problem in SC under low-carbon constraint | Resource allocation | Cloud model/Learning effect model | MSE in chaos simulations | Lowest MSE 4.0938 × 10⁻⁷ in chaos simulation | Automotive manufacturer |
| [73] | Combine ANNs with Logistic Regression to predict credit risk in SC financing | Risk management | Logistic regression/Analysis of Variance (ANOVA) | Positive, negative, overall accuracy/ROC AUC | Negative accuracy 88.6%; overall 87.4%; ROC AUC 0.958 | SMEs’ financial data in China |
| [62] | Develop a performance evaluation method based on green measurement indicators | Green SC | Rough Set theory/Genetic Algorithm | MSE/Regression R | MSE 4.03 × 10⁻⁴ in 4 iterations/R = 0.9889 | Automotive company in China |
| [72] | Develop a method to evaluate SC performance based on its partners’ relationship quality | Supplier relationship management | Moderated Multiple Regression Analysis | Accuracy power = (1 − MAPE)%, | Overall accuracy power 88.703% on test data | Data from field survey |
| [74] | Develop a hybrid methodology to improve the efficiency and effectiveness of healthcare SCs for natural disasters | Humanitarian logistics | Multi-objective optimization/Genetic Algorithm (GA)/Particle Swarm Optimization (PSO) | R2/CPU time(s)/Objective values | Best (BP): R2 = 0.99/CPU time = 39 s | Random data set |
| [69] | Develop a traceability system to assure food quality in a SC | Food SCs | Fuzzy classification | Prediction accuracy/Maximum error/Product return-rate change | Best ANN (5 × 5 × 3) achieved 95% accuracy/≤9% error/Store return-rate fell ~20% over six months | Pork industrial SC in China |
| [25] | Apply deep belief networks to predict the remanufacturing time for multi-life equipment | Forecasting | - | Average relative error/Prediction error versus BP/Computation time ratio versus BP | Average relative error 6%/Prediction error 27% of BP/Runtime 8.3% of BP | Steel enterprise in China |
| [100] | Apply a convolutional ANN to monitor the quality of fresh-cut iceberg lettuce | Food SCs | - | Quality-level classification accuracy/CNN segmentation validation accuracy | Quality classification: 86% unpackaged, 83% packaged/CNN validation accuracy 0.979 | Data from a lettuce farm in Pontecagnano, Italy |
| [61] | Evaluate green SC practices to empower sustainability | Green SC | Partial Least Squares Structural Equation Modeling (PLS-SEM) | ANN RMSE (train/test) | Best test RMSE 0.0850 (ANN9)/Mean train RMSE 0.1240/Mean test RMSE 0.1177 | 178 large manufacturers in Malaysia |
| [101] | Develop a network model to more accurately deal with supply-and-demand fluctuations | Forecasting | Restricted Boltzmann Machine (RBM) | Prediction accuracy | DBN achieved 82.87% accuracy (SD 3.28) | - |
| [102] | Apply deep ANNs to create a credit evaluation system in food SCs | Food SCs | - | Accuracy/F1-score | Accuracy and F1-score increase with corpus, then stabilize near 90% (epoch = 3) | A Chinese text data set |
| [70] | Develop a model to improve the distribution of perishable food products | Food SCs | Heat transfer model | Average temperature prediction error (K)/Accuracy improvement from ensemble and Gaussian-noise training | Average error < 0.5 K/Ensemble improves accuracy up to 35%/Gaussian-noise training improves 45% | Data set in the literature |
| [64] | Study the impact of resilient enablers on SC vulnerabilities during disruptions | Risk management | Z-numbers Data Envelopment Analysis (DEA) | Efficiency scores via Z-DEA and neural-network algorithm/Final mean efficiency/Survey Cronbach’s alpha reliability | Full-model mean efficiency: Z-DEA 0.897, NN 0.943, final 0.920; alpha 0.72 | Car manufacturing company in Iran |
| [103] | Apply a convolutional ANN to find quality loss reasons in a potato processing SC | Food SCs | - | Training, validation, and test classification accuracy/Training loss | 99.79% training accuracy (loss 0.007)/After tuning 83.3% test, 85% validation accuracy | Potato sorting company in UK |
| [104] | Predict SC performance based on the SCOR model | - | SCOR model/Random subsampling cross-validation/Simulation | MSE and correlation coefficient (R) between expected and predicted SCOR metrics | MSE 1.432 × 10⁻⁸, R = 1.0000 (validation) | - |
| [105] | Apply a convolutional ANN to improve the product traceability in textile SCs | - | Classification network | mAP (VOC2007), recognition success rate, computation time per image | mAP 96.3% (no noise)/Recognition success 94.4%/0.5 s/image | Experimental woven fabric tags |
| [22] | Develop an evaluation method of automobile product design and service satisfaction | - | Multi-attribute decision-making | Average accuracy over 3000 automobile examples | Average accuracy 93.19% for BP neural network decision model | Automobile manufacturing and service industry in China |
| [106] | Apply deep ANNs to create a traceable vaccine SC | Risk management | Blockchain technology/Simulation | Accuracy/Precision/Recall/F1/AUC | Mixed model: accuracy 89.65%, precision 92.92%, recall 86.38%, F1 89.53%, AUC 0.95 | Influenza vaccine data in the USA from 1980 to 2017 |
Note: “Best reported quantitative result” reproduces the main performance number(s) reported by each study (e.g., RMSE, accuracy, R2, % cost reduction). Values are shown as reported and should not be interpreted as a head-to-head benchmark across papers because problem settings and measures differ.
Recent supplier and partner evaluation research now uses more data-based tools that account for disruptions and give reasons for the results. For example, some methods combine machine learning with multi-criteria decision-making so purchasing teams can handle many supplier factors and also explain and check why a supplier was chosen [107]. Other work uses prediction models to spot delivery risk earlier, so teams can act sooner—such as improving supplier performance, making backup contracts, or shifting orders when warning signs appear [108]. Some studies also treat supplier choice as a supply network problem, not just a single supplier score, and use graph-based models to use buyer–supplier links to suggest alternatives and reduce the spread of upstream problems [109].
A Self-Organized Map (SOM) ANN method was developed by [110] in order to coordinate the decisions of contract bidding and partner selection at the early stages of introducing a new product in an SC. ANNs are applied in their study to indicate design options that should be selected in a bidding contract. A case study from the cell phone industry is examined in order to show the efficiency of the suggested framework. In another article, Ref. [111] compared the application of ANNs and support vector machine methods to the problem of supplier selection in SCM.
ANN-based models can be applied to replicate suppliers’ performance and to simulate suppliers with incomplete data. ANN-based prediction models are capable of supporting SC selection negotiations. Learning from historical data, ANN prediction models can infer the performance of a supplier. ANN prediction models are accurate forecasting methods in complex negotiation environments, even if there is a nonlinear relationship between inputs and outputs [112]. ANNs are strongly capable of self-learning and self-improving; therefore, the supplier evaluation model’s output is strongly dependent upon the quality and quantity of the training data. Using qualitative and quantitative data for training enables ANNs to use various criteria in order to learn a system’s behavior. Moreover, decision makers can use fuzzy methods in developing ANNs that can learn relationships between fuzzy factors, as well as their impact on the output. Knowing this impact enables decision makers to easily apply a decision support system in order to select an appropriate supplier. This is an advantage that is not achievable by traditional methods [113].
NNs combined with common supplier selection methods—such as DEA—would help these methods deal with supplier selection inefficiencies. For example, having numerous inputs and outputs reduces the accuracy of DEA. Combining inputs or outputs into integrated variables would reduce the dimensions of the input or output vectors [114]. For instance, a hybrid approach involving an Analytical Hierarchy Process (AHP), a Data Envelopment Analysis (DEA), and an ANN was developed by [115] to evaluate suppliers in an SC. This study evaluated suppliers according to both quantitative and qualitative preperformance indicators and provided a general supplier map to show the position of every supplier in an SC. In another study, Ref. [116] combined an ANN with dynamic DEA to study performance and forecast the efficiency of green suppliers in an SC.
ANNs make it possible to reduce the number of measurement criteria by converting them into major performance measurement values. Furthermore, ANNs can work with incomplete data for a supplier’s evaluation measures (this is a common problem in practical applications). ANN-only models work best when there is enough past supplier-performance data to learn complex relationships between inputs and outputs, and to support prediction or negotiation in complicated environments [112]. In contrast, ANN–heuristic hybrid approaches are most useful when the decision needs to bring together many quantitative and qualitative criteria, deal with incomplete or uncertain information (for example, fuzzy factors), or improve efficiency measurement and benchmarking (for example, DEA-based evaluation) while still keeping the evaluation process and structure clear [113].
Therefore, for each study we review, we highlight the decision stage it focuses on (for example, screening/classification, ranking, or allocation/contracting), the type of criteria and data it uses, and the industry or supply chain context (reported in Table 3), so readers can easily see the intended application domain. Table 3 provides more information on research articles that used ANNs and DL in supplier selection problems, including the primary quantitative evaluation metric(s) and the best reported performance value(s) (as reported in each study). Because studies use different datasets, objectives, and metrics, these numeric values are reported for transparency but are not directly comparable across papers.
2.4.3. Demand/Sales Forecasting
Demand forecasting is a very important criterion when it comes to forming the activities in an SC. Forecasting results directly affect procurement, production, transportation, financial planning, and marketing when it comes to decision-making. Issues with matching supply and demand are a major obstacle in optimizing SC performance [117]. Ref. [118] shows that 47% of retailer stock issues are the result of inaccurate demand forecasts. In other words, each SC entity is affected by the trade-off between supply and demand, since accurate demand forecasting facilitates the possibility of obtaining a supply–demand balance [119].
Each SC entity should use the demand information to make a decision (integrated or unintegrated) regarding how much of a product should be ordered and when. Demand forecasting is more difficult for the backward stages of an SC, which shows the importance of precise forecasts during the forward stages. An accurate demand forecast would reduce inventory holding and lost sales costs throughout the entire SC. However, the problem is that finding an accurate demand forecast is not an easy task, since demand is affected by many environmental factors, and the variation pattern is often not known by decision makers.
Recent ANN-based demand and sales forecasting research tries to handle post-pandemic changes by moving beyond single-number forecasts. Instead, it often provides prediction ranges and includes outside factors so the results can be used more directly for inventory and capacity planning. For example, Ref. [45] uses an LSTM model with conformal forecasting to produce prediction intervals that can support service-level and safety-stock decisions. Ref. [120] combine BiLSTM with a NARX model to capture nonlinear patterns and external inputs and report better accuracy on changing demand data. For product-level forecasting in e-commerce, Ref. [121] uses an LSTM approach that learns upper and lower bounds and shows prediction intervals that cover most real outcomes on seller data. Overall, these studies treat ANN forecasting as something that supports planning under disruption by showing risk and uncertainty, not just a single forecast number.
Forecasting methods essentially need historical data. Quantitative forecasting methods can be categorized into time-series and causal analysis methods. Time-series methods such as moving averages, exponential smoothing, and the Box–Jenkins methods help find patterns in historical data. Causal analysis methodology identifies the relationship between a set of causal variables and the forecast variable. Several time-series methods—especially the ARIMA model—have been used for demand forecasting in the past, but they cannot map demand nonlinearity. On the other hand, ANNs are able to study the nonlinear relationships between input and output data [122].
Table 3.
Reviewed articles using ANNs and DL for supplier/partner evaluation and selection.
Table 3.
Reviewed articles using ANNs and DL for supplier/partner evaluation and selection.
| Research | Contribution | Secondary Focus | Methods Combined with ANN | Reported Evaluation Metric(s) | Best Reported Quantitative Result | Case Study |
|---|---|---|---|---|---|---|
| [123] | Develop a tool to continuously select and benchmark the suppliers in outsource manufacturing | - | Case-Based Reasoning (CBR) | Case similarity (%)/Total weighted score/Acceptance threshold 0.8 | Best suppliers achieved 98% similarity and total weighted score 0.87 | Honeywell consumer products in Hong Kong |
| [124] | Develop a methodology to minimize the production assignment cost among multiple SC partners | Order allocation | Fuzzy logic | Output quantity (units/day) and output quality defect points (DP per 100 products) | Adjusted supplies 4265 and 5735 units/day achieved 1.2 DP at 10,000/day | Random data set |
| [125] | Develop a supplier relationship management system in an outsourcing environment | Reduce order allocation cycle time | Case-Based Reasoning (CBR) | Honeywell satisfactory rate/Delivery delay/quality-below-standard/Customer claims | Hybrid CBR + NN: satisfactory 99%/Delay 10%/Quality-below-standard 15%/Customer claims 15% | Honeywell consumer products in Hong Kong |
| [126] | Develop a hybrid system to reduce the outsource cycle time in new product development | Performance optimization | Case-Based Reasoning (CBR) | Honeywell satisfaction rate, delay in delivery, quality-below-standard, customer claims | 95% satisfaction/10% delivery delay/17% quality-below-standard/17% customer claims | Honeywell consumer products in Hong Kong |
| [127] | Develop a hybrid model to select the orders in an electronic product SC | Decision support system | Fuzzy logic/Genetic Algorithm | Training/testing MSE comparing integrated ANN and regression models | Lowest training MSE 0.00226 (14-10-1)/Testing MSE 0.00563 | Electronic items in auto industry |
| [40] | Evaluate suppliers with incomplete information | - | Data Envelopment Analysis (DEA) | DEA Farrell efficiency scores with slack for CCR-efficiency | Max efficiency 1.000 (S13/S15)/Plain DEA rated S3 0.904 despite better performance | Automotive assembly plant in Turkey |
| [22] | Enterprise Resource Planning (ERP) performance evaluation in SCs | - | Strategic thrust theory | Canonical correlation/Model convergence error tolerance 5% | Model converged within 5% error tolerance/Canonical correlation R2 = 0.938 | Transitional textile firm in Taiwan |
| [128] | Develop a model to efficiently select a third-party reverse logistics provider | Green SC | Fuzzy Analytical Hierarchy Process (FAHP) | MSE during training/“validation success” percentage | Lowest training MSE 3.40418 × 10⁵/Model considered successful with 97% validation | Field investigation in a company in Turkey |
| [111] | Compare ANNs and support vector machines to supplier selection problem | Forecasting | Support Vector Machines (SVM) | MSE and percent prediction error for supplier credit-index predictions | SVM outperformed BPNN: sample errors 0.12–5.29% vs. 0.58–20.88% (BPNN) | Zhuhai DAIHAO Electronics in China |
| [115] | Develop a hybrid model to select the maintenance supplier in a competitive environment | Performance optimization | Analytical Hierarchy Process (AHP)/Data Envelopment Analysis (DEA) | DEA efficiency score/Neural-network test prediction accuracy | DEA efficiency 155.17%/Neural-network test accuracy 78.87% | Auto parts manufacturer |
| [110] | Develop a model to make a contract and select suppliers in the early stages of new product introduction | Product development | Analytical Hierarchy Process (AHP) | SOM importance index (Wi) from bidding-criteria weights/AHP eigenvector product ranking of options | Accepted cluster 12: importance index 2.5848/Reduced 140 typical options to 9 preferred | Cellular phone design |
| [112] | Apply supplier’s bid prices to support supplier selection negotiations | Forecasting | Simulation | RMSEtest/MAPE/Correlation coefficient (R)/MAD | RMSEtest = 0.0087/MAPE = 3.3446%/R = 0.994/MAD = 0.0170 | - |
| [129] | Develop a model to assess suppliers using both quantitative and qualitative measures | Agile SC | - | System errors across Spread values/Validation-set node outputs versus expected supplier-type labels | System error 8.526 × 10⁻¹⁴ (Spread = 2)/Validation classified suppliers (0, 0), (1, 0), (1, 1) correctly | Electrical appliance manufacturing companies in China |
| [130] | Develop a prediction model to classify suppliers into efficient and inefficient clusters | - | Data Envelopment Analysis (DEA)/Decision Trees (DT) | Regression test error/Train error | BCC-NN: 1.4% regression test error/0% classification test error | Communication systems company |
| [113] | Develop an integrated model to select a supplier considering quantitative and qualitative factors | Performance optimization | Particle Swarm Optimization (PSO)/Fuzzy set theory | MSE for regression | Lowest MSE 0.001242/Regression MSE 0.004391 | Laptop computer manufacturer in Taiwan |
| [131] | Develop a hybrid model to better evaluate supplier performance | Green SC | Data Envelopment Analysis (DEA)/Analytic Network Process (ANP) | MSE for training, testing/Topology-based MSE | Lowest MSE 0.003343/Training rate 0.9, momentum 0.5 | Digital camera manufacturer in Taiwan |
| [18] | Select and evaluate suppliers in a Just-In-Time production environment | - | - | Binary/one-hot NN output values for supplier selection and A/B/C classification/Trained/validated on historical cases | Highest-confidence outputs: supplier selection 1.0000/Evaluation Class B 0.9999/Class C 0.9991/Class A 0.9351. | Automotive factory in Turkey |
| [132] | A novel approach which solves CBR key problems in supplier selection | - | Case-Based Reasoning (CBR)/k-prototype clustering | Testing RMS, MAE/Rule correctness | Best testing performance: RMS 0.116, MAE 0.084/Rule correctness reached 100% | Petroleum enterprise in China |
| [87] | Develop a model to predict the performance rating of suppliers compared to traditional methods | - | Least square-support vector machine (LS-SVM) | MAE, MSE, MAPE, RMSE, SDE (prediction error between actual and estimated supplier ratings) | LLNF lowest errors: MAE 3.7603/MSE 20.0605/MAPE 6.3710/RMSE 4.0167/SDE 0.0400 | Cosmetic products manufacturer in Iran |
| [133] | Develop a data-driven partner selection model to deal with uncertainty and ambiguity in SCs | Agile SC | Analytic Network Process-Mixed Integer Multi-Objective Programming (ANP-MIMOP) | No numerical metric/Contribution is theoretical overview | No quantitative results reported | - |
| [134] | Develop a decision-making support system to select and evaluate suppliers, considering both multiple quantitative and qualitative measures | Forecasting | Adaptive Neuro-Fuzzy Inference System (ANFIS)/Multi-Criteria Decision-Making (MCDM) | R-value and MSE comparing ANFIS versus NN-fuzzy supplier-score prediction | ANFIS: R = 0.8467, MSE = 0.0134/NN-fuzzy: R = 0.7733, MSE = 0.0193 | Data set from literature |
| [135] | Develop a model to use both qualitative and quantitative data in partner selection | Agile SCs | Fuzzy set theory | Mean error/Standard deviation of errors across spreads/Network system standard error | Best: spread = 2/Mean error 9.44 × 10⁻⁷/SD 7.93 × 10⁻⁷/Network standard error ≈ 8× 10⁻⁷ | Companies in the electrical components industry in China |
| [136] | Develop an integrated group decision support system in order to classify highly suitable and less-suitable suppliers | - | Fuzzy set theory/Analytical Hierarchy Process (AHP)/Group Decision-Making | Cross-validation classification error/Threshold b | Average error 4.80%/Threshold b averaged 0.637 across five cross-validation tests reported | A steel manufacturer and a mid-sized packaged food company in India |
| [137] | Evaluate suppliers’ performance based on the most effective selection criteria | Forecasting | Adaptive Neuro Fuzzy Inference System (ANFIS)/Analytical Hierarchy Process (AHP) | Correlation coefficient (R) and MSE/RMSE used during ANFIS training, testing | Best testing: MSE 0.006 with R 0.73 for ANN using D,T,P criteria | Automotive company |
| [116] | Develop a model to select suppliers based on their performance predictions | Green SC | Data Envelopment Analysis (DEA) | Dynamic DEA overall efficiency q0/Efficiency-trend slope R/Score wi | Best supplier: wi = 0.9135 (a = 0.5), q0 = 0.845, slope R = 0.982, rank1 | Home appliances manufacturer in Iran |
| [138] | Develop a model to select suppliers according to criteria associated with resiliency | Risk management | Logistic regression/Classification and Regression Tree (CART)/Analytic Hierarchy Process (AHP) | Pseudo R2 (Cox–Snell, Nagelkerke)/Cumulative gains | Nagelkerke R2 = 0.824/Ensemble gains > 25% additional correct responses at top 40th percentile | Plastic pipe manufacturer in USA |
| [139] | Develop a partner selection and evaluation method with a cooperative relationship in a SC | - | Evaluation index construction | Classification accuracy (train/test 3:2 split) for BP neural-network partner-selection model | Accuracy 90.18% on 500 samples, trained/tested 3:2 split | Data set from the literature |
Note: “Best reported quantitative result” reproduces the main performance number(s) reported by each study (e.g., RMSE, accuracy, R2, % cost reduction). Values are shown as reported and should not be interpreted as a head-to-head benchmark across papers because problem settings and measures differ.
Traditional time-series forecasting methods such as ARIMA are accurate forecasting methods for working with stationary data that follows a linear pattern. The ANN forecasting method generates more accurate outputs for data sets that are not stationary, and where statistical information does not necessitate a linear pattern [140]. Moreover, ANNs provide more accurate short-term demand forecasts compared to traditional forecasting methods. This would help SCs reduce the average inventory level and increase the service level simultaneously by reducing lost sales, especially for retailers [141]. ANNs are often used as a forecasting method in SCM research. For example, Ref. [142] developed a DL sales forecasting model to predict sales in the footwear industry. The study focused on short-term/mid-term forecasting in order to mitigate uncertainty in the planning of footwear sales. Ref. [143] developed a new ANN-based optimization model to solve the problem of short-term inventory replenishment forecasting. The authors implemented their model in the fashion industry and showed that the new model provides better performance compared to current popular replenishment forecasting models.
Across the demand/sales forecasting studies we reviewed, where ANN-based and hybrid heuristic approaches work best depends mainly on (i) how the data behaves (stable and roughly linear vs. nonlinear and changing over time), (ii) how much data is available (only a short history vs. many sources and extra explanatory variables), and (iii) whether the goal is only forecast accuracy or also better supply chain outcomes (for example, inventory cost, bullwhip effects, or service level). Traditional time-series models (such as ARIMA) fit best when demand patterns are fairly stable and close to linear. In contrast, ANN/deep learning models are more suitable when demand is nonlinear, affected by disruptions, or show changing, nonstationary behavior over time.
Heuristic and metaheuristic numerical methods (such as GA/PSO or harmony search) are usually used when the forecasting or decision model requires a difficult, nonconvex search for the best ANN structure or parameters, or when the objective is measured using simulation-based supply chain cost and service outcomes rather than a closed-form optimization model. In Table 4, this shows up in studies that combine ANNs with GA/PSO for cost-focused distribution–inventory settings, and in other heuristic hybrids used in fashion and retail sales forecasting contexts.
ANNs are a practical method for SC demand forecasting that shows competitive results in sales forecasting [144]. The output evaluation of an ANN is useful when it comes to designing an SC and calculating optimal flow between manufacturers, warehouses, and logistics providers in this SC. ANN capability in studying nonlinear relationships provides more accurate forecasts of highly unpredictable variables. For instance, in an SC, after transportation disruptions (whether by natural or human factors), demand is highly unpredictable, while production planning and inventory control are severely affected [145]. On the other hand, there are some flaws with using ANNs in forecasting. ANNs do not have a satisfying level of performance when it comes to identifying forecasting variables. Ref. [146] addressed this flaw by combining other methods, such as Multivariate Adaptive Regression Splines (MARS), with an ANN. The modified ANN was applied to forecast wholesale sales in the computer industry. The proposed model was applied to a real-world example from the computer market in Taiwan. The results proved that an ANN using the MARS technique outperforms traditional ANNs using a BP method. Table 4 provides more information on research articles that used ANNs and DL in demand/sales forecasting, including the primary quantitative evaluation metric(s) and the best reported performance value(s) (as reported in each study). Because studies use different datasets, objectives, and metrics, these numeric values are reported for transparency but are not directly comparable across papers.
Table 4.
Reviewed articles using ANNs and DL for demand/sales forecasting.
Table 4.
Reviewed articles using ANNs and DL for demand/sales forecasting.
| Research | Contribution | Secondary Focus | Methods Combined with ANN | Reported Evaluation Metric(s) | Best Reported Quantitative Result | Case Study |
|---|---|---|---|---|---|---|
| [147] | Develop a forecasting method to optimize the total cost of a distribution inventory SC | Inventory management | Genetic Algorithm (GA)/Particle Swarm Optimization (PSO) | Computation speed (sec) for GA and PSO | Computation speed 2341 s | Tire industry in India |
| [141] | Develop a forecasting model to optimize the inventory replenishment system | Inventory management | Autoregressive Integrated Moving Average (ARIMA) | MAPE and NMSE for training, test demand forecasts/Inventory reaching days/Sales-failure rate | Hybrid model M9: test MAPE 28.80%, NMSE 0.3544/Reaching days 5/Failures 0.9% | Economax supermarket in Chile |
| [142] | Use a RNN to improve sales forecasting | Warehouse management | - | Test MSE/Average percentage forecasting error/Short-term accuracy | MSE 0.00661666/6-week forecast error 12.7%/Accuracy ~9% | Footwear sales data in India |
| [9] | Compare the forecasting accuracy between AI and traditional methods | Supply network design | Support Vector Machines (SVM) | Testing, training MAE | Lowest testing MAE: 447.72 (simulation, RNN)/20.352 (foundries, RNN) | Foundries data provided by Statistics Canada |
| [148] | Develop an algorithm to forecast the demand rate and determine proper material planning | Supplier selection/Inventory management | Genetic Algorithm (GA)/Fuzzy approximation/Principle Component Analysis (PCA) | RMSE/R2 for demand forecasting/GA objective fitness cost | FNN forecasting RMSE = 0.3272, R2 = 0.99999/Model reduced case-study costs 4% | Sewing machine manufacturer in Iran |
| [149] | Develop a model for cooperative forecasting in a service SC that will optimize resource planning | Performance monitor and optimization | - | MSE of combined forecast/Compares ANN combination versus simple averaging | ANN combination MSE = 0.01 versus averaging MSE = 0.02 when resolving forecasting exceptions | British Telecom holding company in United Kingdom |
| [150] | Present a decision support system to forecast demand based on an ANN | Supply network design | Fuzzy inference systems | Validation MAPE/ANFIS training, test error | ANFIS outperformed ANN: control MAPE 4.88%, 7.05%, 2.41% | Durable consumer goods industry in Turkey |
| [3] | Design the optimal product flow between the factories, warehouses, and distributors | Supply network design | Mixed Integer Linear Programming (MILP)/Fuzzy approximation | Demand-forecast MSE (ANFIS vs. ARIMA)/Network-design objective value (minimum total cost) | Minimum cost 167,231 (analytical) vs. 182,021 (ANN); ANFIS MSE lower all distributors | Alcohol-free beverage company in Turkey |
| [151] | Develop a hybrid intelligent model to obtain more accurate fashion sales forecasts | - | Harmony search algorithm/Extreme learning machine | Forecast accuracy: RMSE, MAPE (%), MASE | Best reported quarterly category1 MASE = 0.07/RMSE = 4.4 × 10⁶/MAPE = 11.9% | Medium-priced fashion products seller in China |
| [152] | Develop a methodology to integrate SC echelons with uncertain demand and/or lead times | SC integration/optimization | Fuzzy inference systems | MAPE/MSE | Average MAPE 2.41%/Total MSE: warehouse 0.002688, plant 0.00150 | Consumer electronics company in Turkey |
| [146] | Use an ANN to develop a sales forecasting model for computer wholesalers | - | Multivariate Adaptive Regression Splines (MARS) | MAD, RMSE, MAPE, RMSPE | MARS achieved lowest errors/Robustness test MAPE 0.07% (90/10 split) versus rivals | Computer wholesale industry in Taiwan |
| [153] | Assess the role of sharing sales information on supplier forecasting accuracy | Performance monitor | - | Out-of-sample MAPE and MdAPE, plus residual standard deviation | MAPE = 26.63%/MdAPE = 17.35%/Lowest residual SD = 1880.92 across 43 SKUs tested | Household product manufacturer |
| [154] | Develop a model to predict and optimize service level | Inventory management | Fuzzy linear regression | MAPE comparing ANN | ANN minimum MAPE 1.9% (7 test periods, 29 training periods)/selected ANN MAPE 2.96% | Electrical and automation products distributor in Iran |
| [155] | Develop a model to improve demand forecast accuracy | Inventory management | Minimum Description Length (MDL)/Surrogate data method | MSE/Prediction accuracy (proportion within threshold deviation on test data) | MDL-optimal NN: prediction accuracy 0.85/MSE 3.33 × 10⁻³, outperforming smoothing and regression | Random data set |
| [140] | Propose a new forecasting method to reduce the bullwhip effect in a SC | Inventory management | Autoregressive Integrated Moving Average (ARIMA)/Discrete wavelet transforms | MSE/Bullwhip effect/Net-stock amplification ratios under base-stock policy | MSE = 4.3918/BWE = 0.99/NSAmp = 0.024 | Automotive parts and accessories/Cement manufacturer/Steel processing industry, all in India |
| [143] | Develop an ANN model to improve short-term forecasting in the fashion industry | Inventory management | Multi-objective optimization | RMSE, MAPE, MAE on training and test samples for replenishment forecasting accuracy | MOONN1 best in 12 RMSE, 8 MAPE, 11 MAE cases/Never worst | Fashion retailer in Hong Kong and China |
| [156] | Develop a fuzzy ANN to improve the forecast of a Longan supply | - | Fuzzy Support Vector Regression | MAPE for training, validation/testing/Training runtime for six ANN/SVR variants | FSVR achieved lowest testing MAPE ≈ 2%/Training runtime ≈ 1.6 min | Longan SC in Thailand |
| [145] | Develop a model to better predict market demand after a transportation disruption in a SC | Risk management/Transportation | Gray model | Average relative error (ARE%) | Improved gray neural network average relative error 0.3592%, beating improved GM(1,1) 0.7521% overall forecasting performance | Snow disaster of 2008 in South China |
| [157] | Apply a probabilistic RNN to design an intelligent energy SC | Supply network design | Factored Conditional Restricted Boltzmann Machine | RMSE, Pearson correlation (R), and p-value significance for forecasts across scenarios | FCRBM achieved lowest RMSE 0.1702, highest R 0.7856, p = 0.0001 (weekly power) | Data set from the literature |
| [158] | Develop a model to forecast sales based on online reviews and reviewer characteristics | Online marketplace | Sentiment analysis | Relative error for sales-rank prediction/sensitivity-analysis importance percentages for predictors | Lowest testing error 0.918/Mean testing 0.958/Importance: helpful votes 15%, reviewer picture 13% | Real data from Amazon.com |
| [159] | Forecast the number of end-of-life vehicles in an auto industry | Reverse SC | Gray model/Particle Swarm Optimization (PSO)/Exponential smoothing | MAE, RMSE, MAPE, Theil’s inequality coefficient (TIC) used to evaluate four forecasting models | Best: GM(1,1)-TES-GM(1,N)-PSOBP/MAE = 1692.167/RMSE = 3009.017/MAPE = 0.096/TIC = 0.029. | End-of-life vehicle reverse logistics industry in China |
| [160] | Develop a RNN to forecast intermittent demand | Internet of Things | Weibull distribution/Failure modes | Sensitivity, specificity, accuracy/Plus hidden-layer node selection using test-set error rate. | Validation accuracy 1.00/Test accuracy 0.9804, sensitivity 1.00, specificity 0.9643. | Battery replacement data for toy cars |
| [161] | Applied DNNs to forecast sales in the fashion industry | - | Decision trees/Random forest/Support Vector Regression (SVR) | R2, RMSE, MAPE, MAE, MSE on held-out season (SS16) via bootstrapped testing. | Best R2 0.756 (Random Forest)/Lowest RMSE 1861, MSE 3,526,377 (DNN) | A fashion company with over 900 stores in different parts of the world |
| [162] | Develop a model to reduce the occurrence of stock depletion in wholesale distributing systems | Inventory management | Price determination | MAPE/Economic loss from out-of-stocks (OOS) used | Cascade ANN framework decreased economic loss due to OOS occurrence by >56% | Beauty products distributor in Italy |
| [29] | Develop a hybrid demand forecasting model to mitigate forecast error | Performance optimization | Time series/Support Vector Regression (SVR) | MAPE and MAD/Accuracy computed as 1−MAPE for weekly demand forecasts | Average MAPE 0.2469 (24.69%) with DL-enhanced integration strategy/2–3% added improvement | A market with 6700 stores in Turkey |
| [163] | Apply RNN to forecast renewable energy sources and water demand | - | Multi-objective optimization/Energy reliability index | RMSE for forecasts/PLPSP (energy reliability)/Total annual cost and GHG emissions | Optimized 111 PV panels and 5 wind turbines/Reduced PLPSP 18.3% versus base | Data from London Home Office |
| [164] | Extend a model to forecast the export volume of aquatic products | - | Particle Swarm Optimization (PSO) | RMSE/Learning efficiency/Model–actual matching ratio | Model–actual matching ratio 0.96571 after 87 iterations/Stable prediction within error threshold | Volume of aquatic product exports in Liaoning Province, China |
Note: “Best reported quantitative result” reproduces the main performance number(s) reported by each study (e.g., RMSE, accuracy, R2, % cost reduction). Values are shown as reported and should not be interpreted as a head-to-head benchmark across papers because problem settings and measures differ.
2.4.4. Inventory Management
Inventory management is one of the main tactical decisions made in SCs. Inventory in an SC may be available in the form of finished goods, semi-finished products, work-in-progress, and raw materials. Inventory is kept to support the normal activities of an SC, and a well-defined inventory management policy would increase how efficiently resources are used. We may consider Harris’s development of the economic order quantity formula in 1913 as a defining moment for using mathematical models in inventory management [165]. Inventory management is dedicated to planning and controlling inventory throughout the entire SC network in order to improve customer service, reduce costs, and increase product variety [166]. As inventory cost is a key cost in many SCs, improving inventory management practices would reduce a significant proportion of the costs in an entire SC [167].
Dealing with uncertainty is another significant issue that should be considered when defining inventory management policies. Uncertainty can affect the reliability indexes of manufacturing SCs, such as the service level, which shows the SC’s ability to satisfy customer demand with on-hand inventory. In addition to uncertainty regarding demand and supply, uncertain manufacturing and distribution parameters would also affect inventory management practices [166].
An SC’s inventory management is strictly dependent upon accurate demand forecasting. One application of ANNs in SCs is to improve the inventory management system when it comes to reducing costs and increasing the quality of customer service. Generally, there are several nonlinear behaviors regarding customer demand in an SC that traditional models cannot study. ANNs, however, can learn complex and nonlinear trends in demand data and provide more accurate forecasts compared to linear models [9]. Moreover, emerging technologies, such as RFID applications, have improved the performance of inventory management systems in recent decades. RFID enables the inventory manager to monitor material flow in an SC. An ANN controller can identify customer demand variations by measuring changes in the level of customer service with RFID technology. This RFID data can adjust node weights in an ANN to make optimal inventory decisions and keep customer service at an appropriate level [168].
Recent inventory management research focuses more on ordering decisions that can adjust during disruptions in multi-level supply chains, instead of using fixed policies. Many studies use reinforcement learning to learn when to order and how much to order when demand and lead times keep changing. For example, Ref. [169] uses a hybrid Q-learning method with Demand-Driven MRP ideas to improve ordering under different demand patterns. Other work shows that deep reinforcement learning can learn reorder rules for multi-level networks and reduce holding and backorder costs across different supply chain structures [170]. Since inventory decisions are often made by different sites with limited shared information, some newer studies use multi-agent deep reinforcement learning to model decentralized decision-making and test policies under changing conditions to make them more stable [171].
Most studies that applied ANNs in the area of inventory management optimization are dedicated to reducing the bullwhip effect—or whiplash effect—in an SC [172]. The bullwhip effect increases demand variations as orders move backward in an SC. A literature review shows that the bullwhip effect was first introduced in a study by [173]. Demand forecasting errors would amplify inventory levels and lost sales, as well as reduce the gross profit of the retailing echelon of an SC. Manufacturers’ inventory and customer service levels are negatively impacted as well. Excessive retailer orders disturb the manufacturer’s production plan, which initiates the bullwhip effect in an SC. Various simulation runs have shown that the bullwhip effect increases as the number of companies in an SC increases [174].
Other important areas of application include the use of ANNs to feed accurate data patterns into logistics processes. These applications are more integrated with RFID technology, which better supports decision-making with online data regarding the location of items in the SC [168,175,176]. However, the main advantage of using ANNs in inventory management is mapping the nonlinear relationships between input and output data and considering unknown factors that affect inventory levels. To give an example of ANN performance in inventory management, Ref. [177] examined various ANN models for a lot-sizing problem and compared the results with traditional inventory control policies, such as Economic Order Quantity (EOQ). Using 186 types of product in Turkey as the focus of their case study, they showed that an ANN-based inventory model performs better than all the other approaches considered in the study. In another study, Ref. [178] introduced several ANN models to determine the optimal level of inventory in a company. ANN models allowed the company to reduce its inventory purchases and consequently reduce its inventory costs. They also presented a new framework to help predict the optimal future order cycle with the lowest possible costs.
The inventory-management studies reviewed here apply to different problem areas, depending on the supply chain structure, how often decisions are made, and what data are available. First, studies focused on reducing the bullwhip effect mainly apply to multi-echelon supply chains, where orders grow larger as they move upstream because of forecast updates, information delays, and step-by-step replenishment decisions. These studies usually test policies using simulation and are most relevant when demand variability spreads upstream [176,178].
Second, ANN/RFID-enabled approaches apply to settings where there is item-level visibility and frequent operational updates (for example, warehousing, distribution, and logistics), where real-time location and status information can support dynamic inventory decisions [172,179,180]. Third, firm-level lot-sizing and inventory-level optimization applications are most relevant when organizations have strong historical records and clear, stable cost and service definitions. In these cases, ANN models can learn nonlinear relationships between demand and inventory and can perform better than fixed analytical policies such as EOQ in the studied setting [181,182].
Overall, these domains show that ANN-based heuristics are mainly used for offline policy design and evaluation using simulation or historical data, and for online decision support when real-time sensing data are available. Table 5 provides more information on research articles that used ANNs and DL in SC inventory management, including the primary quantitative evaluation metric(s) and the best reported performance value(s) (as reported in each study). Because studies use different datasets, objectives, and metrics, these numeric values are reported for transparency but are not directly comparable across papers.
Table 5.
Reviewed articles using ANNs and DL for inventory management.
2.5. Agentic AI, Multi-Agent Systems, and Orchestration
Recent supply chain AI practice is increasingly moving beyond using ANN/DNN models only as standalone predictors, and toward agent-based and distributed decision systems where neural models handle perception, forecasting, and value-function approximation as part of larger closed-loop architectures. In this view, ANN/DNN components are not being replaced; instead, they are integrated as “engines” that support sense–predict–decide–act cycles across multiple supply chain nodes, often under partial observability, non-stationary demand, and disruption risk. This shift matches the broader concept of autonomous supply chains where multi-agent designs are often used to represent decentralized supply chain actors and their local objectives [182].
2.5.1. Agentic AI and Autonomous Decision-Making Under Uncertainty
Agentic AI in SCM can be described as AI-enabled systems that (i) continuously take in operational signals (e.g., orders, inventory levels, and delays), (ii) produce or update predictions (often using ANN/DNN models), (iii) choose actions using optimization methods, decision rules, or learned policies, and (iv) track outcomes to adjust future decisions. One supply chain example is the multi-agent implementation of an autonomous supply chain proposed by [182]. That study presents a design methodology, an architecture, a toolkit, and a case study (a perishable supply chain) to show how autonomy can be put into practice through interacting agents.
In these settings, ANNs typically serve one or more functions: demand and lead-time prediction, anomaly detection, surrogate modeling of complex processes, or learning policies and value functions for sequential decision-making. This framing matters because many SCM decisions are dynamic (e.g., replenishment, allocation, and rerouting) and must react quickly as new information arrives.
A key driver of agentic decision-making is Deep Reinforcement Learning (DRL), especially Multi-Agent DRL (MADRL), for decentralized or distributed control. For example, Ref. [171] models a multi-echelon inventory optimization problem as a decentralized POMDP and develops MADRL methods that can learn replenishment behavior without relying on simplified analytical assumptions.
2.5.2. Multi-Agent Systems (MASs) for Distributed Coordination and Negotiation
Supply chains naturally involve many actors, and these actors often have different information and different goals. A Multi-Agent System (MAS) treats each facility or process as an autonomous agent that can coordinate, negotiate, or work with other agents. In autonomous supply chain designs, MAS helps represent (and implement) distributed decision-making, limits on communication, and local optimization. Ref. [182] explicitly argues that MAS is a practical way to build autonomous supply chains, and they show how agent-based designs can improve resilience and flexibility.
From the perspective of an ANN/DNN review, the main link is that ANN/DNN modules often provide the “intelligence” inside each agent. Multi-agent DRL strengthens this connection even more by using ANNs as function approximators to learn decentralized policies under partial observability [171]. As a result, MAS integration is not a separate approach that competes with ANN/DNN; instead, it is increasingly the environment in which neural models are deployed and used.
2.5.3. Orchestration Mechanisms
A repeated idea in “agentic SCM” is orchestration—the mechanisms that manage how models, agents, enterprise systems, and humans interact. One commonly discussed orchestration base is the digital twin (DT). A DT can support real-time synchronization, simulation, and what-if analysis, which allows agents to test possible actions before carrying them out. Ref. [183] review DTs for SCM and note that full DT integration is still difficult. They propose a layered DT concept for improving SCM performance. In a related direction, Ref. [184] studies DT implementations and maturity and reports that only a small share reach closed-loop capabilities that are typical of fully functional DTs, and they identify governance and alignment with the decision context as major gaps. Relatedly, Ref. [185] discusses governance for cognitive digital twins in agile supply chains, directly linking DTs to learning and optimization (“cognition”) while stressing business and sustainability goals, as well as data and model governance.
A second orchestration route is tool-augmented AI, where LLM-based or agent-based interfaces coordinate calls to optimization solvers, planning systems, and analytics services. Ref. [186] argues that LLMs can “democratize” access to supply chain decision tools by speeding up scenario analysis, explanation, and model updates. Orchestration is increasingly supported by hybrid AI methods that combine neural learning with symbolic constraints, rules, or knowledge graphs to improve robustness, compliance, and explainability. For example, Ref. [187] reviews explainable AI in SCM using neurosymbolic approaches and highlights how logic-based reasoning combined with neural architectures can address the explainability barrier that often slows adoption. More broadly, recent systematic evidence points to fast growth in generative and agentic approaches in SCM research, while also noting that reporting of system-level KPIs and architectures is still underdeveloped [188].
2.5.4. Implications for ANN/DNN-Based SCM Research and a Forward-Looking Agenda
This review focuses on ANN/DNN applications in SCM, but the developments above show that the focus is shifting from “a model” to “a model used inside a decision system.” In real deployments, ANN/DNN modules are increasingly (i) built into distributed agents, (ii) connected to sequential decision policies (often using DRL), and (iii) coordinated through digital twins, event-driven data pipelines, and tool-calling architectures that combine forecasting, optimization, and monitoring.
Therefore, future ANN/DNN studies in SCM would benefit from reporting not only prediction results, but also (a) the decision impact on operational KPIs (cost, service, resilience), (b) the coordination assumptions (centralized vs. distributed), (c) the feedback-loop design (how decisions change future system states), and (d) governance requirements (data provenance, auditability, and human override). These reporting items would help clarify where neural methods apply when they are used inside agentic, real-time supply chain settings, and would reduce the risk that results across studies are not truly comparable because the study setups are different.
3. Discussion
An ANN has several capabilities that cause SCM researchers to choose to use ANNs in their decision-making studies. The reviewed research papers in this study show that ANNs can develop intelligent SCM systems that operate well in a completely uncertain environment. Figure 8 shows a summary of ANN and DL applications in the various fields of SCM. ANN models have been shown to be reliable prediction tools when it comes to decision-making. Many studies have taken advantage of the ANN’s capability to learn from both qualitative and quantitative data, which provides more promising results compared to when only one type of data is studied. This learning feature of an ANN gives it the opportunity to work with incomplete data as well. ANNs are a dominant method used when working with uncertainty in an SC’s parameters. The studied articles have shown that ANNs are compatible with probability distributions and fuzzy numbers. Many researchers have applied fuzzy theory when displaying the input variables to an ANN, with promising results. Other researchers have shown that integrating ANNs with simulations is also an appropriate way to study the randomness of SCM activities.
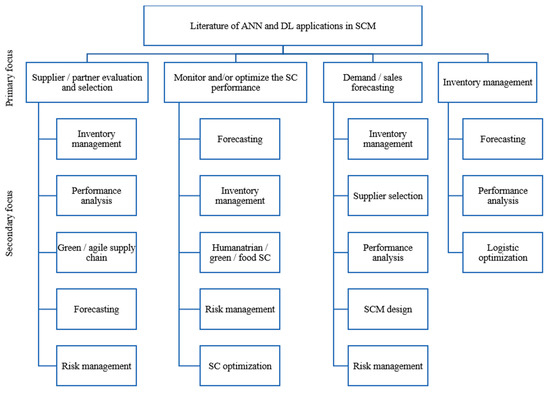
Figure 8.
Summary of the categorization of reviewed papers.
Figure 9 indicates the percentage of papers in each category we focused on. Our research has revealed that ANNs are applied more often for monitoring and optimization purposes in SCM. It is worth noting that traditional ANNs are applied more often in supplier selection studies; however, recent developments in DL have led to more publications on SCM monitoring and optimization. CNNs are advanced monitoring tools that can control the quality of products and materials throughout all stages of SCs. Moreover, the ability of DNNs to work with big data has led to many recently published articles on SCM performance optimization.
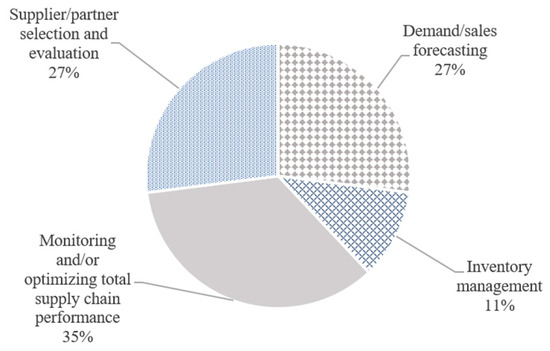
Figure 9.
Distribution of the reviewed papers based on primary focus.
Using ANNs in supplier selection decision-making processes reduces human involvement and increases decision-making speed and consistency. These same supplier selection models can also be applied in outsourcing studies to reduce production and delivery time. Using ANNs in supplier selection studies has often been combined with other methods, such as Data Envelopment Analysis (DEA) or Analytic Hierarchy Process (AHP).
The other reviewed studies in this paper have been separated into demand forecasting and inventory management studies. The prediction ability of ANNs has been a point of interest even in studies that were not centered around forecasting developments. Using ANNs to improve demand forecasting accuracy is an important application in SCs that keeps inventory at an appropriate level, reduces lost sales, and increases the gross margin for retailers. Using an ANN in inventory management research has shown that an intelligent SCM almost completely removes the bullwhip effect and enables decision makers to discover the optimal choice(s) when analytical solutions are not available.
This review shows a few clear patterns across the four groups. First, many papers use ANNs because supply chain problems often have many inputs, unclear relationships, and noisy data. For this reason, ANNs are commonly used as prediction tools (for example, predicting demand, lead time, risk, or performance) and then the predictions are used inside a decision model. Second, hybrid designs appear often. In many papers, ANNs are not used alone, but together with methods such as fuzzy logic, probability distributions, simulation, or multi-criteria decision tools. These combinations are used because supply chain decisions usually include both numbers (cost, time, demand) and judgment-based inputs (expert ratings, risk levels, supplier scores).
A second pattern is that the type of data strongly affects which ANN/DNN structure is used. When the main input is time-based data (such as demand history, sales, or lead time series), models related to recurrent networks are more common because they are built to learn from sequences and past values. When the input includes images or visual signals (such as product quality and inspection), convolutional networks are used more often because they are designed for image patterns [25,36]. When the inputs are mostly structured tables (supplier criteria, performance indicators, cost drivers), classical feedforward ANNs are still widely used because they are simple and work well when the data is not high-dimensional.
The reviewed papers also show an evolution over time. The descriptive analysis shows that the number of publications increased after 2008. This change matches the wider growth in data availability and computing power. As a result, deep learning becomes more visible in the newer supply chain studies, especially in monitoring and optimization areas where big data, sensor data, or image-based data may exist [25,28]. Deep learning is closely related to deep neural networks, where the model has multiple hidden layers and learns more complex patterns than shallow ANNs. In supply chains, this matters most when the data is large and complex, or when feature extraction is difficult to do by hand [25,28].
Even with these benefits, the reviewed papers point to repeating limits that explain why ANN/DNN models do not solve every supply chain problem. One limit is data readiness. Many ANN studies require a long data preparation step and enough training samples, and performance can drop when the data set is small or not consistent. Another limit is model tuning and stability. DNN models often need heavy parameter tuning, and the results can change if the training setting changes. A third limit is explainability. Many ANN/DNN models work like a black box, which makes it hard to justify decisions to managers, auditors, or partners. Finally, many ANN/DNN solutions are tied to one setting; if the business environment changes, retraining is often needed. These limits help explain why many papers still use hybrid models (for example, ANN + fuzzy logic, ANN + simulation, or ANN + multi-criteria tools): the hybrid design is often used to improve robustness, handle uncertainty, or provide more understandable decision logic. Table 6 shows the overall findings from the reviewed papers more clearly.
Table 6.
Linking SCM tasks, data type, and ANN/DNN choice based on the reviewed patterns.
We did our best to include all available high-quality studies in the four studied categories in this paper, but there are some other applications that do not neatly fit into these categories and may not have been noted. It should be noted that information analysis regarding ANN models has its own limitations, too. First, the evaluation of an ANN is totally dependent on the criteria used, and is completely controlled by criteria that were involved in the decision-making process. Moreover, the network training phase can be affected by the complexity of the decision-making environment and by experts’ inconsistent judgment of data quality and quantity. In this situation, the training phase needs to use more samples and data in order to sufficiently represent the available knowledge. Second, ANNs have a longer data preparation phase compared to other methods. Generally, ANNs are not suitable when there are fewer than one hundred input data points. ANN training needs to obtain data from sufficiently large samples that can effectively undergo network training. One obstacle when it comes to using DNNs is that their configuration requires massive parameter tuning. Moreover, ANNs’ behavior in obtaining outputs is not easily explainable, since it is a black-box process. The lack of accountability and interpretability are known weaknesses of DNNs. Finally, an ANN training phase is implemented for a specific decision-making context, and if this context changes at some point in the future, the network should be retrained.
4. Conclusions and Future Work
The growing importance of cooperation and strategic partnerships in recent years has shown that only businesses that operate in an SC can survive in the global business environment. It is a known fact that the main source of competition is not between companies anymore, but between SCs that may include several companies. Numerous studies have been done in the field of SCM over the last four decades, but applying AI in the area of SCM is still relatively new compared to using classic operations research methods. Using AI would reduce the human-dependent aspect of decision-making, as well as improve the accuracy and timeliness of decisions. Because of the recent popularity of using ANNs and DL in the area of SCM, this study has reviewed some high-quality published papers in this field. One hundred selected papers were analyzed and reviewed in four distinct categories, and each paper was summarized in a table to show the contributions at a glance.
Many emerging methods and concepts have been introduced in SCM studies, and some of them have benefited from the use of AI. However, the accuracy and learning ability of ANNs show that there is still much more to be done when using them in SCM. Evolving technologies—such as Industry 4.0—generate new data concepts, such as big data and data warehouses, which facilitate the application of DL models. This data boom has generated a large volume of inputs that can be studied by ANNs and DNNs in order to improve the different stages of an SC. Most of the reviewed studies in this paper have developed ANN models that only monitor or optimize a single echelon of an SC. Developing ANN models that can study integrated SCs is an interesting topic for future studies. Another popular research topic is the sustainability and environmental impact of an SC. It will be interesting to see the results of emission calculations from manufacturing and logistics processes—specifically the volume of CO2 emissions—when analyzed by ANN models. Moreover, future studies can combine various network structures and training methods and fine-tune the parameters in order to improve the prediction performance of DNNs.
When discussing ANN forecasting models, accuracy has been the most important measure discussed in all of the aforementioned studies. Analyzing biases in a forecasting ANN can be another interesting direction for future research. It would be useful to find the reason for an ANN forecast’s biases, as this would display hidden forecasting insights to the decision maker. Moreover, most forecasting applications of ANNs that focus on accuracy do not question the financial impacts of these obtained forecasts. In future studies, if the results of an ANN forecasting study are reported in terms of monetary values, it will provide more data for decision makers to consider regarding their investments in advanced forecasting systems. Finally, it is worth noting that although DNNs provide reliable predictions, it is still challenging to create a management approach solely from the results of a DNN. Further studies could focus on developing efficient decision-making systems based on the outputs of a DNN.
Funding
This research did not receive any specific grant from funding agencies in the public, commercial, or not-for-profit sectors.
Institutional Review Board Statement
Not applicable.
Data Availability Statement
Data sharing is not applicable to this article as no new data were created or analyzed in this study.
Conflicts of Interest
The author declare no conflict of interest.
References
- Huang, S.H.; Sheoran, S.K.; Keskar, H. Computer-assisted supply chain configuration based on supply chain operations reference (SCOR) model. Comput. Ind. Eng. 2005, 48, 377–394. [Google Scholar] [CrossRef]
- Shavaki, F.H.; Ghahnavieh, A.E. Applications of deep learning into supply chain management: A systematic literature review and a framework for future research. Artif. Intell. Rev. 2023, 56, 4447–4489. [Google Scholar] [CrossRef]
- Gumus, A.T.; Guneri, A.F.; Keles, S. Supply chain network design using an integrated neuro-fuzzy and MILP approach: A comparative design study. Expert Syst. Appl. 2009, 36, 12570–12577. [Google Scholar] [CrossRef]
- Brauch, M.; Mohaghegh, M.; Größler, A. Causes of the bullwhip effect: A systematic review and categorization of its causes. Manag. Res. Rev. 2024, 47, 1127–1149. [Google Scholar] [CrossRef]
- Bhandal, R.; Meriton, R.; Kavanagh, R.E.; Brown, A. The application of digital twin technology in operations and supply chain management: A bibliometric review. Supply Chain Manag. Int. J. 2022, 27, 182–206. [Google Scholar] [CrossRef]
- Balan, G.S.; Kumar, V.S.; Raj, S.A. Machine Learning and Artificial Intelligence Methods and Applications for Post-Crisis Supply Chain Resiliency and Recovery. Supply Chain Anal. 2025, 10, 100121. [Google Scholar] [CrossRef]
- Camur, M.C.; Ravi, S.K.; Saleh, S. Enhancing supply chain resilience: A machine learning approach for predicting product availability dates under disruption. Expert Syst. Appl. 2024, 247, 123226. [Google Scholar] [CrossRef]
- Sharma, R.; Shishodia, A.; Gunasekaran, A.; Min, H.; Munim, Z.H. The role of artificial intelligence in supply chain management: Mapping the territory. Int. J. Prod. Res. 2022, 60, 7527–7550. [Google Scholar] [CrossRef]
- Carbonneau, R.; Laframboise, K.; Vahidov, R. Application of machine learning techniques for supply chain demand forecasting. Eur. J. Oper. Res. 2008, 184, 1140–1154. [Google Scholar] [CrossRef]
- Babai, M.Z.; Arampatzis, M.; Hasni, M.; Lolli, F.; Tsadiras, A. On the use of machine learning in supply chain management: A systematic review. IMA J. Manag. Math. 2025, 36, 21–49. [Google Scholar] [CrossRef]
- Rolf, B.; Jackson, I.; Müller, M.; Lang, S.; Reggelin, T.; Ivanov, D. A review on reinforcement learning algorithms and applications in supply chain management. Int. J. Prod. Res. 2023, 61, 7151–7179. [Google Scholar] [CrossRef]
- Oliveira, J.M.; Ramos, P. Evaluating the effectiveness of time series transformers for demand forecasting in retail. Mathematics 2024, 12, 2728. [Google Scholar] [CrossRef]
- Nguyen, T.N.A.; Nguyen, T.X.H.; Thi, H.N.; Vu, H.A.; Tran, N.T.; Anh, N.P. Optimizing Supply Chain Operations Using Advanced Time-Series Mixer Models for Demand Forecasting and Inventory Under Uncertain Demand. Expert Syst. Appl. 2026, 296, 128955. [Google Scholar] [CrossRef]
- Yang, M.; Lim, M.K.; Qu, Y.; Ni, D.; Xiao, Z. Supply chain risk management with machine learning technology: A literature review and future research directions. Comput. Ind. Eng. 2023, 175, 108859. [Google Scholar] [CrossRef]
- Liu, Y.; Liu, S.; Lu, Y. Supply chain financial risk assessment: A modified graph attention neural network. Financ. Res. Lett. 2025, 86, 108285. [Google Scholar] [CrossRef]
- Fan, S.; Kong, D.; Wu, Y.; Yu, H. Digital innovation and supply chain risk: A large language model-based analysis. Pac.-Basin Financ. J. 2025, 92, 102799. [Google Scholar] [CrossRef]
- Meidute-Kavaliauskiene, I.; Taşkın, K.; Ghorbani, S.; Činčikaitė, R.; Kačenauskaitė, R. Reviewing the applications of neural networks in supply chain: Exploring research propositions for future directions. Information 2022, 13, 261. [Google Scholar] [CrossRef]
- Aksoy, A.; Öztürk, N. Supplier selection and performance evaluation in just-in-time production environments. Expert Syst. Appl. 2011, 38, 6351–6359. [Google Scholar] [CrossRef]
- Wang, S. Forecasting Demand and Controlling Inventory Using Transformer-Based Neural Network Optimized by Whale Optimization Algorithm. In Proceedings of the 2024 Guangdong-Hong Kong-Macao Greater Bay Area International Conference on Digital Economy and Artificial Intelligence, Guangdong, China, 25 July 2024; Association for Computing Machinery: New York, NY, USA, 2024; pp. 915–923. [Google Scholar]
- Kosasih, E.E.; Margaroli, F.; Gelli, S.; Aziz, A.; Wildgoose, N.; Brintrup, A. Towards knowledge graph reasoning for supply chain risk management using graph neural networks. Int. J. Prod. Res. 2024, 62, 5596–5612. [Google Scholar] [CrossRef]
- Yang, M.; Zhu, H.; Guo, K. Research on manufacturing service combination optimization based on neural network and multi-attribute decision making. Neural Comput. Appl. 2020, 32, 1691–1700. [Google Scholar] [CrossRef]
- Chang, I.-C.; Hwang, H.-G.; Liaw, H.-C.; Hung, M.-C.; Chen, S.-L.; Yen, D.C. A neural network evaluation model for ERP performance from SCM perspective to enhance enterprise competitive advantage. Expert Syst. Appl. 2008, 35, 1809–1816. [Google Scholar] [CrossRef]
- Nelles, O. Nonlinear System Identification: From Classical Approaches to Neural Networks and Fuzzy Models; Springer Science & Business Media: Berlin/Heidelberg, Germany, 2013. [Google Scholar]
- LeCun, Y.; Bengio, Y.; Hinton, G. Deep learning. Nature 2015, 521, 436–444. [Google Scholar] [CrossRef] [PubMed]
- Wang, L.; Xia, X.; Cao, J.; Liu, X. Modeling and predicting remanufacturing time of equipment using deep belief networks. Clust. Comput. 2019, 22, 2677–2688. [Google Scholar] [CrossRef]
- Li, Y.; Jiang, W.; Yang, L.; Wu, T. On neural networks and learning systems for business computing. Neurocomputing 2018, 275, 1150–1159. [Google Scholar] [CrossRef]
- Bengio, Y. Practical recommendations for gradient-based training of deep architectures. In Neural Networks: Tricks of the Trade; Springer: Berlin/Heidelberg, Germany, 2012; pp. 437–478. [Google Scholar]
- Kraus, M.; Feuerriegel, S.; Oztekin, A. Deep learning in business analytics and operations research: Models, applications and managerial implications. Eur. J. Oper. Res. 2020, 281, 628–641. [Google Scholar] [CrossRef]
- Kilimci, Z.H.; Akyuz, A.O.; Uysal, M.; Akyokus, S.; Uysal, M.O.; Atak Bulbul, B.; Ekmis, M.A. An Improved Demand Forecasting Model Using Deep Learning Approach and Proposed Decision Integration Strategy for Supply Chain. Complexity 2019, 2019, 9067367. [Google Scholar] [CrossRef]
- Ketkar, N. Deep Learning with Python; Springer: Berlin/Heidelberg, Germany, 2017. [Google Scholar]
- Ramakrishnan, N.; Soni, T. Network Traffic Prediction Using Recurrent Neural Networks. In 2018 17th IEEE International Conference on Machine Learning and Applications (ICMLA); IEEE: New York, NY, USA, 2018; pp. 187–193. [Google Scholar]
- Bousqaoui, H.; Slimani, I.; Achchab, S. Improving Coordination in Supply Chain Using Artificial Neural Networks and Multi-agent Approach. In International Conference on Engineering Optimization; Springer: Berlin/Heidelberg, Germany, 2018; pp. 1353–1359. [Google Scholar]
- Chatfield, K.; Simonyan, K.; Vedaldi, A.; Zisserman, A. Return of the devil in the details: Delving deep into convolutional nets. arXiv 2014, arXiv:1405.3531. [Google Scholar] [CrossRef]
- Krizhevsky, A.; Sutskever, I.; Hinton, G.E. Imagenet classification with deep convolutional neural networks. In Advances in Neural Information Processing Systems; NIPS: San Diego, CA, USA, 2012; pp. 1097–1105. [Google Scholar]
- Kaynov, I.; Van Knippenberg, M.; Menkovski, V.; Van Breemen, A.; Van Jaarsveld, W. Deep reinforcement learning for one-warehouse multi-retailer inventory management. Int. J. Prod. Econ. 2024, 267, 109088. [Google Scholar] [CrossRef]
- Necula, S.-C.; Rieder, E. Generative and Adaptive AI for Sustainable Supply Chain Design. J. Theor. Appl. Electron. Commer. Res. 2025, 20, 240. [Google Scholar] [CrossRef]
- Ahmed, K.R.; Ansari, M.E.; Ahsan, M.N.; Rohan, A.; Uddin, M.B.; Rivin, M.A.H. Deep learning framework for interpretable supply chain forecasting using SOM ANN and SHAP. Sci. Rep. 2025, 15, 26355. [Google Scholar] [CrossRef]
- Chong, A.Y.L.; Li, B.; Ngai, E.W.; Ch’ng, E.; Lee, F. Predicting online product sales via online reviews, sentiments, and promotion strategies: A big data architecture and neural network approach. Int. J. Oper. Prod. Manag. 2016, 36, 358–383. [Google Scholar] [CrossRef]
- Law, R. Back-propagation learning in improving the accuracy of neural network-based tourism demand forecasting. Tour. Manag. 2000, 21, 331–340. [Google Scholar] [CrossRef]
- Çelebi, D.; Bayraktar, D. An integrated neural network and data envelopment analysis for supplier evaluation under incomplete information. Expert Syst. Appl. 2008, 35, 1698–1710. [Google Scholar] [CrossRef]
- Schalkoff, R.J. Artificial Neural Networks; McGraw-Hill Higher Education: New York, NY, USA, 1997. [Google Scholar]
- Boute, R.N.; Gijsbrechts, J.; Van Jaarsveld, W.; Vanvuchelen, N. Deep reinforcement learning for inventory control: A roadmap. Eur. J. Oper. Res. 2022, 298, 401–412. [Google Scholar] [CrossRef]
- Zheng, G.; Ivanov, D.; Brintrup, A. An adaptive federated learning system for information sharing in supply chains. Int. J. Prod. Res. 2025, 63, 3938–3960. [Google Scholar] [CrossRef]
- Long, Y.; Kroeger, S.; Zaeh, M.F.; Brintrup, A. Leveraging synthetic data to tackle machine learning challenges in supply chains: Challenges, methods, applications, and research opportunities. Int. J. Prod. Res. 2025, 1–22. [Google Scholar] [CrossRef]
- Zhang, X.; Li, C.; Wang, W.; Hu, C.; Kang, Y. Sales forecasting method based on LSTM and conformal forecasting. In Proceedings of the 2024 5th International Conference on Computer Science and Management Technology, Xiamen, China, 18–20 October 2024; Association for Computing Machinery: New York, NY, USA, 2025; pp. 1347–1350. [Google Scholar]
- Mayring, P. Qualitative Inhaltanalyse Grundlagenund Techniken (Qualitative Content Analysis); Beltz: Weinheim, Germany, 2003. [Google Scholar]
- Bakker, M.; Riezebos, J.; Teunter, R.H. Review of inventory systems with deterioration since 2001. Eur. J. Oper. Res. 2012, 221, 275–284. [Google Scholar] [CrossRef]
- Brandenburg, M.; Govindan, K.; Sarkis, J.; Seuring, S. Quantitative models for sustainable supply chain management: Developments and directions. Eur. J. Oper. Res. 2014, 233, 299–312. [Google Scholar] [CrossRef]
- Glock, C.H. The joint economic lot size problem: A review. Int. J. Prod. Econ. 2012, 135, 671–686. [Google Scholar] [CrossRef]
- Musilek, P.; Gupta, M.M. Neural networks and fuzzy systems. In Soft Computing and Intelligent Systems: Theory and Applications; Academic Press: San Diego, CA, USA, 2000. [Google Scholar]
- Kartalopoulos, S.V.; Kartakapoulos, S.V. Understanding Neural Networks and Fuzzy Logic: Basic Concepts and Applications; Wiley-IEEE Press: New York, NY, USA, 1997. [Google Scholar]
- Ko, M.; Tiwari, A.; Mehnen, J. A review of soft computing applications in supply chain management. Appl. Soft Comput. 2010, 10, 661–674. [Google Scholar] [CrossRef]
- Perea-Lopez, E.; Ydstie, B.E.; Grossmann, I.E. A model predictive control strategy for supply chain optimization. Comput. Chem. Eng. 2003, 27, 1201–1218. [Google Scholar] [CrossRef]
- Maestrini, V.; Luzzini, D.; Maccarrone, P.; Caniato, F. Supply chain performance measurement systems: A systematic review and research agenda. Int. J. Prod. Econ. 2017, 183, 299–315. [Google Scholar] [CrossRef]
- Chopra, S.; Meindl, P. Supply chain management. Strategy, planning & operation. In Das Summa Summarum des Management; Springer: Berlin/Heidelberg, Germany, 2007; pp. 265–275. [Google Scholar]
- Nudurupati, S.S.; Bititci, U.S.; Kumar, V.; Chan, F.T. State of the art literature review on performance measurement. Comput. Ind. Eng. 2011, 60, 279–290. [Google Scholar] [CrossRef]
- Lee, Y.H.; Jung, J.W.; Eum, S.C.; Park, S.M.; Nam, H.K. Production quantity allocation for order fulfilment in the supply chain: A neural network based approach. Prod. Plan. Control 2006, 17, 378–389. [Google Scholar] [CrossRef]
- Chong, A.Y.-L.; Liu, M.J.; Luo, J.; Keng-Boon, O. Predicting RFID adoption in healthcare supply chain from the perspectives of users. Int. J. Prod. Econ. 2015, 159, 66–75. [Google Scholar] [CrossRef]
- Zhang, K.; Chai, Y.; Yang, S.X.; Weng, D. Pre-warning analysis and application in traceability systems for food production supply chains. Expert Syst. Appl. 2011, 38, 2500–2507. [Google Scholar] [CrossRef]
- Rohde, J. Hierarchical supply chain planning using artificial neural networks to anticipate base-level outcomes. OR Spectr. 2004, 26, 471–492. [Google Scholar] [CrossRef]
- Foo, P.-Y.; Lee, V.-H.; Tan, G.W.-H.; Ooi, K.-B. A gateway to realising sustainability performance via green supply chain management practices: A PLS–ANN approach. Expert Syst. Appl. 2018, 107, 1–14. [Google Scholar] [CrossRef]
- Liu, P.; Yi, S. New Algorithm for Evaluating the Green Supply Chain Performance in an Uncertain Environment. Sustainability 2016, 8, 960. [Google Scholar] [CrossRef]
- Sheu, J.-B. A hybrid neuro-fuzzy analytical approach to mode choice of global logistics management. Eur. J. Oper. Res. 2008, 189, 971–986. [Google Scholar] [CrossRef]
- Yazdanparast, R.; Tavakkoli-Moghaddam, R.; Heidari, R.; Aliabadi, L. A hybrid Z-number data envelopment analysis and neural network for assessment of supply chain resilience: A case study. Cent. Eur. J. Oper. Res. 2021, 29, 611–631. [Google Scholar] [CrossRef]
- Rabelo, L.; Helal, M.; Lertpattarapong, C.; Moraga, R.; Sarmiento, A. Using system dynamics, neural nets, and eigenvalues to analyse supply chain behaviour. A case study. Int. J. Prod. Res. 2008, 46, 51–71. [Google Scholar] [CrossRef]
- Abouzid, I.; Saidi, R. Digital twin implementation approach in supply chain processes. Sci. Afr. 2023, 21, e01821. [Google Scholar] [CrossRef]
- Stranieri, F.; Stella, F.; Kouki, C. Performance of deep reinforcement learning algorithms in two-echelon inventory control systems. Int. J. Prod. Res. 2024, 62, 6211–6226. [Google Scholar] [CrossRef]
- Liu, X.-H.; Shan, M.-Y.; Zhang, L.-H. Low-carbon supply chain resources allocation based on quantum chaos neural network algorithm and learning effect. Nat. Hazards 2016, 83, 389–409. [Google Scholar] [CrossRef]
- Wang, J.; Yue, H.; Zhou, Z. An improved traceability system for food quality assurance and evaluation based on fuzzy classification and neural network. Food Control 2017, 79, 363–370. [Google Scholar] [CrossRef]
- Mercier, S.; Uysal, I. Neural network models for predicting perishable food temperatures along the supply chain. Biosyst. Eng. 2018, 171, 91–100. [Google Scholar] [CrossRef]
- Chiu, M.; Lin, G. Collaborative supply chain planning using the artificial neural network approach. J. Manuf. Technol. Manag. 2004, 15, 787–796. [Google Scholar] [CrossRef]
- Tsai, J.-M.; Hung, S.-W. Supply chain relationship quality and performance in technological turbulence: An artificial neural network approach. Int. J. Prod. Res. 2016, 54, 2757–2770. [Google Scholar] [CrossRef]
- Zhu, Y.; Xie, C.; Sun, B.; Wang, G.-J.; Yan, X.-G. Predicting China’s SME credit risk in supply chain financing by logistic regression, artificial neural network and hybrid models. Sustainability 2016, 8, 433. [Google Scholar] [CrossRef]
- Sabegh, M.H.Z.; Mohammadi, M.; Naderi, B. Multi-objective optimization considering quality concepts in a green healthcare supply chain for natural disaster response: Neural network approaches. Int. J. Syst. Assur. Eng. Manag. 2017, 8, 1689–1703. [Google Scholar] [CrossRef]
- Motwani, J.; Youssef, M.; Kathawala, Y.; Futch, E. Supplier selection in developing countries: A model development. Integr. Manuf. Syst. 1999, 10, 154–162. [Google Scholar] [CrossRef]
- Bhutta, K.S.; Huq, F. Supplier selection problem: A comparison of the total cost of ownership and analytic hierarchy process approaches. Supply Chain Manag. Int. J. 2002, 7, 126–135. [Google Scholar] [CrossRef]
- Wu, D.D.; Zhang, Y.; Wu, D.; Olson, D.L. Fuzzy multi-objective programming for supplier selection and risk modeling: A possibility approach. Eur. J. Oper. Res. 2010, 200, 774–787. [Google Scholar] [CrossRef]
- Jayaraman, K.; Vejayon, S.; Raman, S.; Mostafiz, I. The proposed e-waste management model from the conviction of individual laptop disposal practices-An empirical study in Malaysia. J. Clean. Prod. 2019, 208, 688–696. [Google Scholar] [CrossRef]
- Marufuzzaman, M.; Ahsan, K.B.; Xing, K. Supplier selection and evaluation method using Analytical Hierarchy Process (AHP): A case study on an apparel manufacturing organisation. Int. J. Value Chain Manag. 2009, 3, 224–240. [Google Scholar] [CrossRef]
- Önüt, S.; Kara, S.S.; Işik, E. Long term supplier selection using a combined fuzzy MCDM approach: A case study for a telecommunication company. Expert Syst. Appl. 2009, 36, 3887–3895. [Google Scholar] [CrossRef]
- Choy, K.L.; Lee, W.B.; Lau, H.C.; Choy, L.C. A knowledge-based supplier intelligence retrieval system for outsource manufacturing. Knowl.-Based Syst. 2005, 18, 1–17. [Google Scholar] [CrossRef]
- Liu, F.-H.F.; Hai, H.L. The voting analytic hierarchy process method for selecting supplier. Int. J. Prod. Econ. 2005, 97, 308–317. [Google Scholar] [CrossRef]
- Lee, E.-K.; Ha, S.; Kim, S.-K. Supplier selection and management system considering relationships in supply chain management. IEEE Trans. Eng. Manag. 2001, 48, 307–318. [Google Scholar]
- Ting, S.-C.; Cho, D.I. An integrated approach for supplier selection and purchasing decisions. Supply Chain Manag. Int. J. 2008, 13, 116–127. [Google Scholar] [CrossRef]
- Wang, G.; Huang, S.H.; Dismukes, J.P. Product-driven supply chain selection using integrated multi-criteria decision-making methodology. Int. J. Prod. Econ. 2004, 91, 1–15. [Google Scholar] [CrossRef]
- Ramanathan, R. Supplier selection problem: Integrating DEA with the approaches of total cost of ownership and AHP. Supply Chain Manag. Int. J. 2007, 12, 258–261. [Google Scholar] [CrossRef]
- Vahdani, B.; Iranmanesh, S.H.; Mousavi, S.M.; Abdollahzade, M. A locally linear neuro-fuzzy model for supplier selection in cosmetics industry. Appl. Math. Model. 2012, 36, 4714–4727. [Google Scholar] [CrossRef]
- Azadeh, A.; Saberi, M.; Anvari, M. An Integrated Artificial Neural Network Fuzzy C-Means-Normalization Algorithm for performance assessment of decision-making units: The cases of auto industry and power plant. Comput. Ind. Eng. 2011, 60, 328–340. [Google Scholar] [CrossRef]
- Golmohammadi, D. Neural network application for fuzzy multi-criteria decision making problems. Int. J. Prod. Econ. 2011, 131, 490–504. [Google Scholar] [CrossRef]
- Wycisk, C.; McKelvey, B.; Hülsmann, M. ‘Smart parts’ supply networks as complex adaptive systems: Analysis and implications. Int. J. Phys. Distrib. Logist. Manag. 2008, 38, 108–125. [Google Scholar] [CrossRef]
- Chen, K.-Y.; Shaw, Y.-C. Applying back propagation network to cold chain temperature monitoring. Adv. Eng. Inform. 2011, 25, 11–22. [Google Scholar] [CrossRef]
- Thomas, P.; Thomas, A.; Suhner, M.-C. A neural network for the reduction of a product-driven system emulation model. Prod. Plan. Control 2011, 22, 767–781. [Google Scholar] [CrossRef]
- Wong, T.C.; Law, K.M.; Yau, H.K.; Ngan, S.-C. Analyzing supply chain operation models with the PC-algorithm and the neural network. Expert Syst. Appl. 2011, 38, 7526–7534. [Google Scholar] [CrossRef]
- Chen, M.-K.; Tai, T.-W.; Hung, T.-Y. Component selection system for green supply chain. Expert Syst. Appl. 2012, 39, 5687–5701. [Google Scholar] [CrossRef]
- Kuo, R.-J.; Tseng, W.L.; Tien, F.C.; Liao, T.W. Application of an artificial immune system-based fuzzy neural network to a RFID-based positioning system. Comput. Ind. Eng. 2012, 63, 943–956. [Google Scholar] [CrossRef]
- Smeureanu, I.; Ruxanda, G.; Diosteanu, A.; Delcea, C.; Cotfas, L.A. Intelligent agents and risk based model for supply chain management. Technol. Econ. Dev. Econ. 2012, 18, 452–469. [Google Scholar] [CrossRef]
- Fan, X.; Zhang, S.; Wang, L.; Yang, Y.; Hapeshi, K. An evaluation model of supply chain performances using 5DBSC and LMBP neural network algorithm. J. Bionic Eng. 2013, 10, 383–395. [Google Scholar] [CrossRef]
- Shu, T.; Chen, S.; Wang, S.; Lai, K.K. GBOM-oriented management of production disruption risk and optimization of supply chain construction. Expert Syst. Appl. 2014, 41, 59–68. [Google Scholar] [CrossRef]
- Badia-Melis, R.; Qian, J.P.; Fan, B.L.; Hoyos-Echevarria, P.; Ruiz-García, L.; Yang, X.T. Artificial neural networks and thermal image for temperature prediction in apples. Food Bioprocess Technol. 2016, 9, 1089–1099. [Google Scholar] [CrossRef]
- Cavallo, D.P.; Cefola, M.; Pace, B.; Logrieco, A.F.; Attolico, G. Non-destructive automatic quality evaluation of fresh-cut iceberg lettuce through packaging material. J. Food Eng. 2018, 223, 46–52. [Google Scholar] [CrossRef]
- Kong, F.; Li, J. The promotion strategy of supply chain flexibility based on deep belief network. Appl. Intell. 2018, 48, 1394–1405. [Google Scholar] [CrossRef]
- Mao, D.; Wang, F.; Hao, Z.; Li, H. Credit evaluation system based on blockchain for multiple stakeholders in the food supply chain. Int. J. Environ. Res. Public Health 2018, 15, 1627. [Google Scholar] [CrossRef]
- Jagtap, S.; Bhatt, C.; Thik, J.; Rahimifard, S. Monitoring Potato Waste in Food Manufacturing Using Image Processing and Internet of Things Approach. Sustainability 2019, 11, 3173. [Google Scholar] [CrossRef]
- Lima-Junior, F.R.; Carpinetti, L.C.R. Predicting supply chain performance based on SCOR® metrics and multilayer perceptron neural networks. Int. J. Prod. Econ. 2019, 212, 19–38. [Google Scholar] [CrossRef]
- Wang, K.; Kumar, V.; Zeng, X.; Koehl, L.; Tao, X.; Chen, Y. Development of a Textile Coding Tag for the Traceability in Textile Supply Chain by Using Pattern Recognition and Robust Deep Learning. Int. J. Comput. Intell. Syst. 2019, 12, 713–722. [Google Scholar] [CrossRef]
- Yong, B.; Shen, J.; Liu, X.; Li, F.; Chen, H.; Zhou, Q. An intelligent blockchain-based system for safe vaccine supply and supervision. Int. J. Inf. Manag. 2020, 52, 102024. [Google Scholar] [CrossRef]
- Abdulla, A.; Baryannis, G. A hybrid multi-criteria decision-making and machine learning approach for explainable supplier selection. Supply Chain Anal. 2024, 7, 100074. [Google Scholar] [CrossRef]
- Steinberg, F.; Burggräf, P.; Wagner, J.; Heinbach, B.; Saßmannshausen, T.; Brintrup, A. A novel machine learning model for predicting late supplier deliveries of low-volume-high-variety products with application in a German machinery industry. Supply Chain Anal. 2023, 1, 100003. [Google Scholar] [CrossRef]
- Tu, Y.; Li, W.; Song, X.; Gong, K.; Liu, L.; Qin, Y.; Liu, S.; Liu, M. Using graph neural network to conduct supplier recommendation based on large-scale supply chain. Int. J. Prod. Res. 2024, 62, 8595–8608. [Google Scholar] [CrossRef]
- Yan, W.; Chen, C.-H.; Huang, Y.; Mi, W. An integration of bidding-oriented product conceptualization and supply chain formation. Comput. Ind. 2008, 59, 128–144. [Google Scholar] [CrossRef]
- Hu, G.; Zhang, G. Comparison on neural networks and support vector machines in suppliers’ selection. J. Syst. Eng. Electron. 2008, 19, 316–320. [Google Scholar] [CrossRef]
- Lee, C.C.; Ou-Yang, C. A neural networks approach for forecasting the supplier’s bid prices in supplier selection negotiation process. Expert Syst. Appl. 2009, 36, 2961–2970. [Google Scholar] [CrossRef]
- Kuo, R.J.; Hong, S.Y.; Huang, Y.C. Integration of particle swarm optimization-based fuzzy neural network and artificial neural network for supplier selection. Appl. Math. Model. 2010, 34, 3976–3990. [Google Scholar] [CrossRef]
- Ray, S.C. Input Aggregation in Models of Data Envelopment Analysis: A Statistical Test with an Application to Indian Manufacturing. 2005. Available online: https://opencommons.uconn.edu/econ_wpapers/200554 (accessed on 10 February 2026).
- Ha, S.H.; Krishnan, R. A hybrid approach to supplier selection for the maintenance of a competitive supply chain. Expert Syst. Appl. 2008, 34, 1303–1311. [Google Scholar] [CrossRef]
- Shabanpour, H.; Yousefi, S.; Saen, R.F. Forecasting efficiency of green suppliers by dynamic data envelopment analysis and artificial neural networks. J. Clean. Prod. 2017, 142, 1098–1107. [Google Scholar] [CrossRef]
- Stank, T.P.; Dittmann, J.P.; Autry, C.W. The new supply chain agenda: A synopsis and directions for future research. Int. J. Phys. Distrib. Logist. Manag. 2011, 41, 940–955. [Google Scholar] [CrossRef]
- Gruen, T.W.; Corsten, D.S.; Bharadwaj, S. Retail Out of Stocks: A Worldwide Examination of Extent. In Causes, and Consumer Responses; Grocery Manufacturers of America: Washington, DC, USA, 2002. [Google Scholar]
- Lee, H.L.; Padmanabhan, V.; Whang, S. Information distortion in a supply chain: The bullwhip effect. Manag. Sci. 1997, 43, 546–558. [Google Scholar] [CrossRef]
- Aldahmani, E.; Alzubi, A.; Iyiola, K. Demand Forecasting in Supply Chain Using Uni-Regression Deep Approximate Forecasting Model. Appl. Sci. 2024, 14, 8110. [Google Scholar] [CrossRef]
- Handy, E.; Ibrahim, M.A. Product-level sales prediction in e-commerce using LSTM modeling. Procedia Comput. Sci. 2025, 269, 853–862. [Google Scholar] [CrossRef]
- Wei, S.; Song, J.; Khan, N.I. Simulating and predicting river discharge time series using a wavelet-neural network hybrid modelling approach. Hydrol. Process. 2012, 26, 281–296. [Google Scholar] [CrossRef]
- Choy, K.L.; Lee, W.B.; Lo, V. An intelligent supplier management tool for benchmarking suppliers in outsource manufacturing. Expert Syst. Appl. 2002, 22, 213–224. [Google Scholar] [CrossRef]
- Lau, H.C.; Hui, I.-K.; Chan, F.T.; Wong, C.W. Monitoring the supply of products in a supply chain environment: A fuzzy neural approach. Expert Syst. 2002, 19, 235–243. [Google Scholar] [CrossRef]
- Choy, K.L.; Lee, W.B.; Lo, V. Design of an intelligent supplier relationship management system: A hybrid case based neural network approach. Expert Syst. Appl. 2003, 24, 225–237. [Google Scholar] [CrossRef]
- Choy, K.L.; Lee, W.B.; Lau, H.; Lu, D.; Lo, V. Design of an intelligent supplier relationship management system for new product development. Int. J. Comput. Integr. Manuf. 2004, 17, 692–715. [Google Scholar] [CrossRef]
- Kuo, R.J.; Chen, J.A. A decision support system for order selection in electronic commerce based on fuzzy neural network supported by real-coded genetic algorithm. Expert Syst. Appl. 2004, 26, 141–154. [Google Scholar] [CrossRef]
- Efendigil, T.; Önüt, S.; Kongar, E. A holistic approach for selecting a third-party reverse logistics provider in the presence of vagueness. Comput. Ind. Eng. 2008, 54, 269–287. [Google Scholar] [CrossRef]
- Luo, X.; Wu, C.; Rosenberg, D.; Barnes, D. Supplier selection in agile supply chains: An information-processing model and an illustration. J. Purch. Supply Manag. 2009, 15, 249–262. [Google Scholar] [CrossRef]
- Wu, D. Supplier selection: A hybrid model using DEA, decision tree and neural network. Expert Syst. Appl. 2009, 36, 9105–9112. [Google Scholar] [CrossRef]
- Kuo, R.J.; Wang, Y.C.; Tien, F.C. Integration of artificial neural network and MADA methods for green supplier selection. J. Clean. Prod. 2010, 18, 1161–1170. [Google Scholar] [CrossRef]
- Zhao, K.; Yu, X. A case based reasoning approach on supplier selection in petroleum enterprises. Expert Syst. Appl. 2011, 38, 6839–6847. [Google Scholar] [CrossRef]
- Wu, C.; Barnes, D. A dynamic feedback model for partner selection in agile supply chains. Int. J. Oper. Prod. Manag. 2012, 32, 79–103. [Google Scholar] [CrossRef]
- Özkan, G.; İnal, M. Comparison of neural network application for fuzzy and ANFIS approaches for multi-criteria decision making problems. Appl. Soft Comput. 2014, 24, 232–238. [Google Scholar] [CrossRef]
- Wu, C.; Barnes, D. Partner selection in agile supply chains: A fuzzy intelligent approach. Prod. Plan. Control 2014, 25, 821–839. [Google Scholar] [CrossRef]
- Kar, A.K. A hybrid group decision support system for supplier selection using analytic hierarchy process, fuzzy set theory and neural network. J. Comput. Sci. 2015, 6, 23–33. [Google Scholar] [CrossRef]
- Tavana, M.; Fallahpour, A.; Di Caprio, D.; Santos-Arteaga, F.J. A hybrid intelligent fuzzy predictive model with simulation for supplier evaluation and selection. Expert Syst. Appl. 2016, 61, 129–144. [Google Scholar] [CrossRef]
- Hosseini, S.; Al Khaled, A. A hybrid ensemble and AHP approach for resilient supplier selection. J. Intell. Manuf. 2019, 30, 207–228. [Google Scholar] [CrossRef]
- Liu, L.; Ran, W. Research on supply chain partner selection method based on BP neural network. Neural Comput. Appl. 2020, 32, 1543–1553. [Google Scholar] [CrossRef]
- Jaipuria, S.; Mahapatra, S.S. An improved demand forecasting method to reduce bullwhip effect in supply chains. Expert Syst. Appl. 2014, 41, 2395–2408. [Google Scholar] [CrossRef]
- Aburto, L.; Weber, R. Improved supply chain management based on hybrid demand forecasts. Appl. Soft Comput. 2007, 7, 136–144. [Google Scholar] [CrossRef]
- Das, P.; Chaudhury, S. Prediction of retail sales of footwear using feedforward and recurrent neural networks. Neural Comput. Appl. 2007, 16, 491–502. [Google Scholar] [CrossRef]
- Du, W.; Leung, S.Y.S.; Kwong, C.K. A multiobjective optimization-based neural network model for short-term replenishment forecasting in fashion industry. Neurocomputing 2015, 151, 342–353. [Google Scholar] [CrossRef]
- Thiesing, F.M.; Vornberger, O. Sales forecasting using neural networks. In Proceedings of International Conference on Neural Networks (ICNN’97); IEEE: New York, NY, USA, 1997; pp. 2125–2128. [Google Scholar]
- Liu, C.; Shu, T.; Chen, S.; Wang, S.; Lai, K.K.; Gan, L. An improved grey neural network model for predicting transportation disruptions. Expert Syst. Appl. 2016, 45, 331–340. [Google Scholar] [CrossRef]
- Lu, C.-J.; Lee, T.-S.; Lian, C.-M. Sales forecasting for computer wholesalers: A comparison of multivariate adaptive regression splines and artificial neural networks. Decis. Support Syst. 2012, 54, 584–596. [Google Scholar] [CrossRef]
- Haq, A.N.; Kannan, G. Effect of forecasting on the multi-echelon distribution inventory supply chain cost using neural network, genetic algorithm and particle swarm optimisation. Int. J. Serv. Oper. Inform. 2006, 1, 1–22. [Google Scholar] [CrossRef]
- Moghadam, M.R.S.; Afsar, A.; Sohrabi, B. Inventory lot-sizing with supplier selection using hybrid intelligent algorithm. Appl. Soft Comput. 2008, 8, 1523–1529. [Google Scholar] [CrossRef]
- Stubbings, P.; Virginas, B.; Owusu, G.; Voudouris, C. Modular neural networks for recursive collaborative forecasting in the service chain. Knowl.-Based Syst. 2008, 21, 450–457. [Google Scholar] [CrossRef]
- Efendigil, T.; Önüt, S.; Kahraman, C. A decision support system for demand forecasting with artificial neural networks and neuro-fuzzy models: A comparative analysis. Expert Syst. Appl. 2009, 36, 6697–6707. [Google Scholar] [CrossRef]
- Wong, W.K.; Guo, Z.X. A hybrid intelligent model for medium-term sales forecasting in fashion retail supply chains using extreme learning machine and harmony search algorithm. Int. J. Prod. Econ. 2010, 128, 614–624. [Google Scholar] [CrossRef]
- Efendigil, T.; Önüt, S. An integration methodology based on fuzzy inference systems and neural approaches for multi-stage supply-chains. Comput. Ind. Eng. 2012, 62, 554–569. [Google Scholar] [CrossRef]
- Trapero, J.R.; Kourentzes, N.; Fildes, R. Impact of information exchange on supplier forecasting performance. Omega 2012, 40, 738–747. [Google Scholar] [CrossRef]
- Azadeh, A.; Sheikhalishahi, M.; Asadzadeh, S.M.; Saberi, M.; Neghab, A.P. Forecasting and optimization of service level in vague and complex SCM by a flexible neural network–fuzzy mathematical programming approach. Int. J. Adv. Manuf. Technol. 2013, 68, 1453–1470. [Google Scholar] [CrossRef]
- Lau, H.C.; Ho, G.T.; Zhao, Y. A demand forecast model using a combination of surrogate data analysis and optimal neural network approach. Decis. Support Syst. 2013, 54, 1404–1416. [Google Scholar] [CrossRef]
- Leksakul, K.; Holimchayachotikul, P.; Sopadang, A. Forecast of off-season longan supply using fuzzy support vector regression and fuzzy artificial neural network. Comput. Electron. Agric. 2015, 118, 259–269. [Google Scholar] [CrossRef]
- Mocanu, E.; Nguyen, P.H.; Gibescu, M.; Kling, W.L. Deep learning for estimating building energy consumption. Sustain. Energy Grids Netw. 2016, 6, 91–99. [Google Scholar] [CrossRef]
- Hou, F.; Li, B.; Chong, A.Y.-L.; Yannopoulou, N.; Liu, M.J. Understanding and predicting what influence online product sales? A neural network approach. Prod. Plan. Control 2017, 28, 964–975. [Google Scholar] [CrossRef]
- Hao, H.; Zhang, Q.; Wang, Z.; Zhang, J. Forecasting the number of end-of-life vehicles using a hybrid model based on grey model and artificial neural network. J. Clean. Prod. 2018, 202, 684–696. [Google Scholar] [CrossRef]
- Lee, K.; Kang, D.Y.; Choi, H.R.; Park, B.K.; Cho, M.J.; Kim, D. Intermittent Demand Forecasting with a Recurrent Neural Network Model Using IoT Data. Int. J. Control Autom. 2018, 11, 153–168. [Google Scholar] [CrossRef]
- Loureiro, A.L.; Miguéis, V.L.; da Silva, L.F. Exploring the use of deep neural networks for sales forecasting in fashion retail. Decis. Support Syst. 2018, 114, 81–93. [Google Scholar] [CrossRef]
- Bottani, E.; Centobelli, P.; Gallo, M.; Kaviani, M.A.; Jain, V.; Murino, T. Modelling wholesale distribution operations: An artificial intelligence framework. Ind. Manag. Data Syst. 2019, 119, 698–718. [Google Scholar] [CrossRef]
- Li, Q.; Loy-Benitez, J.; Nam, K.; Hwangbo, S.; Rashidi, J.; Yoo, C. Sustainable and reliable design of reverse osmosis desalination with hybrid renewable energy systems through supply chain forecasting using recurrent neural networks. Energy 2019, 178, 277–292. [Google Scholar] [CrossRef]
- Zhang, Y. Application of improved BP neural network based on e-commerce supply chain network data in the forecast of aquatic product export volume. Cogn. Syst. Res. 2019, 57, 228–235. [Google Scholar] [CrossRef]
- Chan, F.; Routroy, S.; Kodali, R. Differential evolution algorithm for supply chain inventory planning. J. Manuf. Technol. Manag. 2005, 16, 7–17. [Google Scholar] [CrossRef]
- Giannoccaro, I.; Pontrandolfo, P.; Scozzi, B. A fuzzy echelon approach for inventory management in supply chains. Eur. J. Oper. Res. 2003, 149, 185–196. [Google Scholar] [CrossRef]
- He, W. An inventory controlled supply chain model based on improved BP neural network. Discret. Dyn. Nat. Soc. 2013, 2013, 537675. [Google Scholar] [CrossRef]
- Yoo, J.S.; Hong, S.R.; Kim, C.O. Service level management of nonstationary supply chain using direct neural network controller. Expert Syst. Appl. 2009, 36, 3574–3586. [Google Scholar] [CrossRef]
- Cuartas, C.; Aguilar, J. Hybrid algorithm based on reinforcement learning for smart inventory management. J. Intell. Manuf. 2023, 34, 123–149. [Google Scholar] [CrossRef]
- Geevers, K.; Van Hezewijk, L.; Mes, M.R. Multi-echelon inventory optimization using deep reinforcement learning. Cent. Eur. J. Oper. Res. 2024, 32, 653–683. [Google Scholar] [CrossRef]
- Hu, J.; Xia, L.; Huang, T.; Wu, H. A multi-agent deep reinforcement learning approach for multi-echelon inventory optimization and its application to the beer game. Transp. Res. Part E Logist. Transp. Rev. 2025, 203, 104367. [Google Scholar] [CrossRef]
- Zarandi, M.F.; Pourakbar, M.; Turksen, I.B. A Fuzzy agent-based model for reduction of bullwhip effect in supply chain systems. Expert Syst. Appl. 2008, 34, 1680–1691. [Google Scholar] [CrossRef]
- Forrester, J. Industrial Dynamics; MIT Press: Cambridge, MA, USA, 1961. [Google Scholar]
- Thomassey, S. Sales forecasts in clothing industry: The key success factor of the supply chain management. Int. J. Prod. Econ. 2010, 128, 470–483. [Google Scholar] [CrossRef]
- Hong, S.R.; Kim, S.T.; Kim, C.O. Neural network controller with on-line inventory feedback data in RFID-enabled supply chain. Int. J. Prod. Res. 2010, 48, 2613–2632. [Google Scholar] [CrossRef]
- Lee, C.K.; Ho, W.; Ho, G.T.; Lau, H.C. Design and development of logistics workflow systems for demand management with RFID. Expert Syst. Appl. 2011, 38, 5428–5437. [Google Scholar] [CrossRef]
- Şenyiğit, E.; Atici, U. Artificial neural network models for lot-sizing problem: A case study. Neural Comput. Appl. 2013, 22, 1039–1047. [Google Scholar] [CrossRef]
- Sustrova, T. An Artificial Neural Network Model for a Wholesale Company’s Order-Cycle Management. Int. J. Eng. Bus. Manag. 2016, 8, 2. [Google Scholar] [CrossRef]
- Gumus, A.T.; Guneri, A.F. A multi-echelon inventory management framework for stochastic and fuzzy supply chains. Expert Syst. Appl. 2009, 36, 5565–5575. [Google Scholar] [CrossRef]
- Mitrea, C.A.; Lee, C.K.M.; Wu, Z. A comparison between neural networks and traditional forecasting methods: A case study. Int. J. Eng. Bus. Manag. 2009, 1, 11. [Google Scholar] [CrossRef]
- Gumus, A.T.; Guneri, A.F.; Ulengin, F. A new methodology for multi-echelon inventory management in stochastic and neuro-fuzzy environments. Int. J. Prod. Econ. 2010, 128, 248–260. [Google Scholar] [CrossRef]
- Xu, L.; Mak, S.; Minaricova, M.; Brintrup, A. On implementing autonomous supply chains: A multi-agent system approach. Comput. Ind. 2024, 161, 104120. [Google Scholar] [CrossRef]
- Zaidi, S.A.H.; Khan, S.A.; Chaabane, A. Unlocking the potential of digital twins in supply chains: A systematic review. Supply Chain Anal. 2024, 7, 100075. [Google Scholar] [CrossRef]
- Benhamou, L.; Giard, V.; Lamouri, S. Digital twins in supply chain management: Scope and methodological issues. Int. J. Prod. Econ. 2025, 291, 109842. [Google Scholar] [CrossRef]
- Kalaboukas, K.; Kiritsis, D.; Arampatzis, G. Governance framework for autonomous and cognitive digital twins in agile supply chains. Comput. Ind. 2023, 146, 103857. [Google Scholar] [CrossRef]
- Simchi-Levi, D.; Mellou, K.; Menache, I.; Pathuri, J. Large language models for supply chain decisions. In AI in Supply Chains: Perspectives from Global Thought Leaders; Springer: Berlin/Heidelberg, Germany, 2026; pp. 93–104. [Google Scholar]
- Kosasih, E.E.; Papadakis, E.; Baryannis, G.; Brintrup, A. A review of explainable artificial intelligence in supply chain management using neurosymbolic approaches. Int. J. Prod. Res. 2024, 62, 1510–1540. [Google Scholar] [CrossRef]
- Bahroun, Z.; Saihi, A.; As’ad, R.; Tanash, M. A Systematic Analysis of Generative Artificial Intelligence for Supply Chain Transformation. Supply Chain Anal. 2025, 13, 100188. [Google Scholar] [CrossRef]


Disclaimer/Publisher’s Note: The statements, opinions and data contained in all publications are solely those of the individual author(s) and contributor(s) and not of MDPI and/or the editor(s). MDPI and/or the editor(s) disclaim responsibility for any injury to people or property resulting from any ideas, methods, instructions or products referred to in the content. |
© 2026 by the author. Published by MDPI on behalf of the International Institute of Knowledge Innovation and Invention. Licensee MDPI, Basel, Switzerland. This article is an open access article distributed under the terms and conditions of the Creative Commons Attribution (CC BY) license.