Abstract
This study applies a multicriteria decision analysis to explore how experts from different backgrounds assess traditional and emerging criteria for urban cycling. A hierarchical model with 7 main criteria and 31 subcriteria was evaluated by 30 specialists from academic, technical, and user-focused groups. Using pairwise comparisons and aggregated judgments, this study reveals points of agreement and divergence among expert priorities. Safety and infrastructure were rated as the most important factors. In contrast, contextual and technological aspects, such as Multimodality, Environmental Quality, Shared Systems, and Digital Solutions, received moderate to lower weights, with differences linked to expert profiles. These results highlight how different disciplinary perspectives influence the understanding of bikeability-related factors. Conceptually, the findings support a broader view of cycling conditions that incorporates both established and emerging criteria. Methodologically, this study demonstrates the value of the Analytic Hierarchy Process (AHP) as a participatory and transparent tool to integrate diverse stakeholder opinions into a structured evaluation model. This approach can support cycling mobility planning and policymaking. Future applications may include case studies in specific cities, combining expert-based priorities with local spatial data, as well as longitudinal research to track changes in cycling conditions over time.
1. Introduction
Cycling has emerged as a fundamental element of moving toward more sustainable, resilient, and inclusive cities, particularly considering growing concerns about climate change, air quality, urban congestion, and public health [1,2]. In response, bicycles have been increasingly integrated into mobility policies, with bikeability gaining traction in urban planning, transportation, and public health research [3]. This reflects a recognition of cycling as a feasible option for motorized transportation that is capable of delivering individual and collective benefits while contributing to several Sustainable Development Goals [1,4].
Regarding urban environments, bicycles are a versatile and low-cost solution. They require less space, reduce travel time for short distances, and facilitate seamless integration with various transport modes [5,6,7]. In addition to encouraging healthier routines and mitigating carbon emissions, cycling also supports local economic activity. Furthermore, when properly planned, cycling infrastructure is more economical and adaptable than car-centric alternatives [8,9].
It has been demonstrated that new phenomena, such as electric bicycles, electrified sharing systems, and digital technologies, have challenged traditional bikeability assessment models, prompting more inclusive, systematic, and methodologically robust approaches [3]. Among these emerging trends, the rising popularity of electrically assisted bicycles (e-bikes) is particularly notable. They combine energy efficiency, user accessibility, and extended reach, positioning themselves between active and motorized mobility options [10,11]. Research has shown that e-bikes attract new user profiles, including older adults, women, individuals with lower physical fitness, and commuters. This significantly broadens the potential user base for cycling mobility [12,13]. However, their higher average speed and increased weight require adaptations to cycling infrastructure, especially concerning safety, segregation, and interoperability with conventional bicycles [14,15]. In addition, the large-scale adoption of e-bikes raises challenges related to charging infrastructure, secure parking, and the environmental management of battery life cycles [16].
Bike-sharing systems (BSS), including electric variants, play an increasingly prominent role in urban mobility strategies. From the informality of early generations to the digital sophistication of present-day models, the schemes enhance their reach and operational efficiency [17,18]. Their integration has helped to reframe the bicycle as a practical and multimodal transport option. In doing so, BSS contributes to key urban objectives by reducing short car journeys, minimizing environmental impact, and reinforcing public transport connectivity. They are particularly effective in addressing the challenges of first and last-mile gaps [7,19,20]. E-BSS, in particular, offers significant advantages in cities with topographical constraints and among user groups that are less likely to cycle under typical conditions [17,21]. Still, despite their benefits, challenges and operational drawbacks remain. Key issues include unequal access across different urban areas, misuse and vandalism, regulatory complexities tied to dockless models, and challenges in fleet balancing [22,23].
Another transformative vector lies in the growing incorporation of digital technologies into the cycling experience. Tools such as mobile applications, Big Data platforms, the Internet of Things (IoT), and artificial intelligence now support better route guidance, performance tracking, and modal integration [24,25]. These digital solutions not only increase the convenience of cycling through features such as route planning, gamification, incentive schemes, and individual performance tracking but also generate valuable data for evidence-based urban planning [26,27]. Real-time data can guide more targeted interventions by mapping flows, conflicts, and infrastructure gaps. However, challenges remain, including platform compatibility, fragmented datasets, and ongoing privacy concerns [28,29].
While many studies have investigated cycling conditions, most focus on traditional infrastructure and safety-related metrics, often overlooking emerging factors. Additionally, there has been limited attention to how experts from different disciplinary and stakeholder backgrounds prioritize these factors. This study aims to address this gap by employing the Analytic Hierarchy Process (AHP) to integrate and compare the perspectives of academic, technical, and user-focused experts within a comprehensive hierarchical framework of urban cycling criteria. The insights gathered will be linked to implications for planning and policy. The remainder of this paper is structured as follows: Section 2 discusses the theoretical background on bikeability, multicriteria decision analysis, and the application of the AHP method. Section 3 outlines the case study and methodological approach, including expert consistency, group consensus, and prioritisation patterns. Section 4 discusses the main findings, and Section 5 concludes the paper by outlining potential directions for future research.
2. Background
2.1. Bikeability Assessment
Bikeability has gained ground as a strategic approach in sustainable mobility planning, aligned with efforts to foster cities that support cycling for everyday travel, recreation, and tourism. Its theoretical and methodological consolidation has enabled the identification of the elements that constitute a cycle-friendly environment and the development of diagnostic tools and decision-support mechanisms that inform public policies, cycling plans, and infrastructural interventions. Initially understood as the capacity of a given territory to accommodate bicycle use, the concept has evolved to encompass a diversity of definitions and analytical scales, ranging from more normative perspectives focused on infrastructure performance [30,31] to more perceptual approaches, which incorporate subjective and contextual factors related to user experience [32,33]. This variety of perspectives underscores how complex interactions with the spatial structure of cities shape cycling.
Recent literature identifies a recurring set of dimensions for assessing bikeability: traffic and personal safety, cycling infrastructure, accessibility and connectivity, environmental characteristics, and behavioral factors. These dimensions are operationalized through both objective indicators, such as lane width, the presence of segregated cycle paths, pavement quality, or dedicated signage, and subjective ones, such as perceived comfort, feelings of safety, or the route’s overall attractiveness [34,35,36]. In such studies, the usual principles of cycling infrastructure design, such as safety, comfort, coherence, attractiveness, and directness, are broken down into indicators applicable at the street segment scale. Previous research has also proposed analytical frameworks integrating multiple domains. Since network analysis can be extended to a broader scale and oriented toward future scenarios, it may serve as a planning tool to support the development of cycling’s potential. In that context, a model based on fuzzy logic and geoprocessing was developed, incorporating six key factors: accessibility, infrastructure, parking, road features, urban surroundings, and traffic safety [37].
Within this context, the growing role of multicriteria approaches, such as the Analytic Hierarchy Process (AHP), also stands out in the structuring and prioritizing of criteria involved in cycle network evaluation. Although the methodological development of AHP is explored in this study, it is worth noting that the method has enabled the integration of the diverse factors involved in the decision-making process, reflecting the relative weight that different users and experts assign to the assessment criteria [35,38].
Among the studies, it is possible to identify the criteria most frequently used to evaluate urban bikeability. Safety, both in terms of traffic conditions and public perception, emerges as the dominant factor, followed by cycling infrastructure (presence, typology, continuity, and quality), accessibility and connectivity, environmental conditions (including topography, greenery, and air quality), and behavioral and social factors, such as users’ demographic profiles and their perception of risk. These criteria form a common core that underpins most assessment models. However, a lack of consideration for innovative parameters, such as electric bicycles, sharing systems, and digital solutions, was highlighted in previous work, despite their growing relevance in cycling mobility [3]. Ongoing shifts in urban mobility demand a revision of how cycling conditions are assessed. While conventional models still prioritize infrastructure and safety, recent studies have argued for including digital platforms, shared bicycles, and innovations such as electric bicycles [39,40].
Recent research has expanded the analytical scope of bikeability assessments, but traditional criteria still dominate. To illustrate this trend, we mapped the temporal distribution of seven evaluation criteria across 24 studies identified in two previous review papers [3,36]. Each study was classified according to our analytical framework.
Figure 1 shows the number of studies addressing each criterion (indicated in parentheses). Throughout the period analyzed, Infrastructure and Safety were the predominant focus areas, while Environmental Quality and Multimodality received limited coverage. Specifically, Environmental Quality was assessed through the sub-criterion of Air Quality (with no studies evaluating noise), and Multimodality was explored only in terms of Connection to Public Transport. Shared Systems were addressed solely through the Availability of Shared Bicycle Systems.
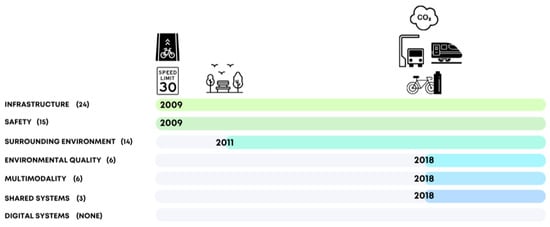
Figure 1.
Temporal distribution of the seven evaluation criteria in 24 studies identified in two previous review papers [3,36].
These patterns highlight the persistence of traditional focuses in bikeability assessments and the slower integration of emerging dimensions. Notably, Digital Systems were not mentioned in any of the reviewed studies, which points to their absence in established bikeability assessment frameworks.
2.2. Multicriteria Decision Analysis (MCDA) in Urban Planning
Multicriteria decision analysis (MCDA) provides tools for addressing choices involving multiple goals, which may sometimes conflict. Combining diverse analytical dimensions enables a systematic evaluation of alternatives [41]. The increasing complexity of urban problems requires decision models capable of simultaneously accounting for technical, social, environmental, and economic variables, thereby justifying the widespread application of MCDA in spatial planning. The formulation and structuring of the decision problem are central stages in the application of MCDA. The hierarchical decomposition of complex systems allows decision elements to be organized from general objectives to specific criteria, facilitating comparative evaluation among alternatives [42]. The method of transparency preserves the internal logic of evaluators’ judgments while also making it possible to replicate the model in varied decision-making contexts [41].
From a methodological perspective, multicriteria methods can be classified into two broad categories: Multi-Attribute Decision Making (MADM) and Multi-Objective Decision Making (MODM). The former are applied when dealing with a discrete and finite set of alternatives and are used to evaluate available options based on multiple criteria. MODM methods, on the other hand, are employed in continuous optimization problems, where the aim is to identify compromise solutions among competing objective functions, taking into account different dimensions and their interdependencies [41].
The Analytic Hierarchy Process, widely used among MADM techniques, provides logical clarity and a well-structured hierarchy to convert subjective assessments into numerical scores, enabling comparisons based on decision-makers’ views. A consistency check strengthens the process, making AHP a strong fit for decisions requiring openness, traceability, and stakeholder involvement [41,42].
Its applicability has been demonstrated across various domains: in strategic planning and security [43,44,45,46,47], project management [48,49], natural resource management and sustainability [50,51,52,53,54,55], and urban and transport planning [56,57,58,59,60,61,62]. Its capacity to operationalise complex decisions in a structured manner has contributed to its growing diffusion among researchers and decision-makers working in urban contexts.
2.3. AHP Applications in Bikeability Assessment
The analysis of urban bikeability has emerged as a central dimension of sustainable city planning, requiring methodological approaches capable of integrating multiple technical, environmental, social, and behavioral criteria. In this context, the AHP has distinguished itself, integrated qualitative and quantitative preferences, and produced robust and transparent rankings. The method’s flexibility has enabled its application across various active mobility scenarios, from prioritizing cycling interventions to assessing network or territorial suitability.
Several studies have recently employed AHP to support bikeability assessments in urban contexts. This method has been used to structure participatory decision-making processes involving experts and stakeholders in order to define priority measures to promote cycling, such as low-speed zones and educational campaigns [56]. It has also been applied to investigate specific aspects of cyclist interaction with other road users, particularly in shared spaces with pedestrians, thus contributing to the planning of safer and more inclusive infrastructure [63,64].
The methodology has also proven helpful in complementary domains, such as route selection for cycling tourism. In this context, AHP was applied to engage cycle tourists and guides in identifying decisive factors, including road quality, surrounding landscape, and local events [65]. Other studies used the method to evaluate green infrastructure principles with direct implications for integrating cycling corridors into urban space [66,67]. These examples illustrate AHP’s ability to encompass both technical dimensions and subjective perceptions within the realm of cycling mobility.
While the AHP has been applied across various contexts, its use in creating composite bikeability indices remains relatively limited. Most studies employ this method primarily to support rankings or isolated decisions. A notable exception has developed a spatial index that integrates slope, intersection density, and vegetation cover, utilizing AHP-derived weights within a Geographic Information System (GIS) environment. This demonstrates the recent emergence of such applications and highlights the benefits of integrating geoprocessing with relevant indicators [35]. This confirms the recent nature of such applications and the value of integrating geoprocessing and indicators. Typically, the expert samples in these studies are small, ranging from 7 to 17 participants [35,56,65,67], which can limit their representativeness. Broader and more diverse panels are likely to yield stronger models. The growing interest in expert-based and spatial tools indicates promising avenues for advancing cycling policy.
3. Case Study in Portugal
3.1. The Expert Panel
The selection process began by sending invitations to potential participants with recognized experience and knowledge in urban and transport planning. In addition to ensuring expertise in the subject matter, invitations were directed to individuals representing different stakeholder perspectives: academic, technical/professional, and user/advocacy, to capture a broad range of insights. Those who accepted the invitation were enrolled in the study and provided with detailed instructions about the evaluation process. All assessments were conducted online.
Before initiating the pairwise comparisons, participants completed a supplementary questionnaire designed to gather background information. This included age, gender, frequency and purpose of bicycle use, level of education, institutional affiliation, and experience in mobility-related projects. This information helped characterize the panel and allowed for the segmentation of responses based on expert profiles, as discussed later in the case study. The questionnaire also introduced the hierarchical model of the evaluation, consisting of seven main criteria and thirty-one subcriteria. Participants were asked to compare these elements using a nine-point scale to indicate their relative importance. The individual matrices were then aggregated for analysis, with consistency checks applied to ensure reliability.
The panel consisted of 30 experts with backgrounds in urban and transport planning. Based on the supplementary questionnaire, three distinct groups were identified: academics (12); professionals from public and private institutions (11), including engineers, architects, and technical planners; and user representatives (7), comprising seasoned cyclists and members of cycling advocacy organisations. Although no prior balancing was imposed during the selection process, the final composition reflected a wide range of perspectives and experiential knowledge.
Most participants (43%) fell within the 41–50 age range, generally corresponding to mature stages of professional experience. The panel included 11 women and 19 men. Bicycle usage patterns varied among the participants: while those from academic and professional backgrounds reported mixed frequencies, 71% of user representatives indicated they cycled three or more days per week. The size of the panel is significantly larger than what is usually observed in most AHP studies on urban cycling [35,56,65,67] and was considered sufficient to ensure robust results. Combined with the deliberate inclusion of different stakeholder profiles, this composition enhanced the diversity of viewpoints and strengthened the reliability of the prioritization outcomes.
3.2. Methodological Approach
This study employs the Analytic Hierarchy Process to assess factors affecting urban bikeability. AHP utilizes a structured decision-making framework that incorporates pairwise comparisons, allowing experts to prioritize criteria through matrices, derive priority vectors, and assess consistency [42]. The methodological steps are summarized in Figure 2.
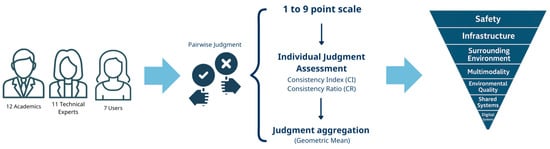
Figure 2.
Methodological steps.
The hierarchical model was developed based on previous studies [3,37] and the identification of gaps in existing bikeability indices. The model comprised seven main criteria: surrounding environment, infrastructure, safety, environmental quality, multimodality, shared systems, and digital systems, each broken down into operational subcriteria. The structure encompassed both traditional dimensions and new approaches, including criteria such as Environmental Quality (air pollution, noise, and allergenic factors), Shared Systems (coverage and integration of bike-sharing systems), and Digital Systems (information, technological features, and usage costs). Figure 3 presents the hierarchy.
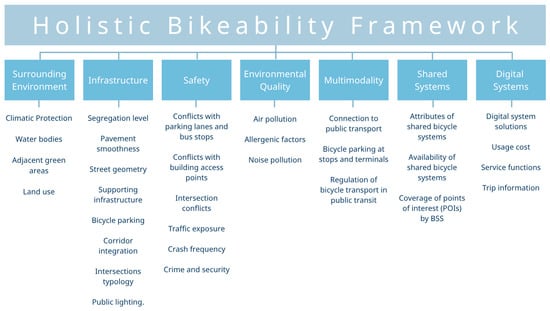
Figure 3.
AHP criteria (1st level) and subcriteria (2nd level).
The process began with the elaboration of the pairwise comparison matrices. Each expert was instructed on how to compare all elements at the same level in terms of their importance to the component immediately above. These comparisons utilized Saaty’s fundamental scale, which ranges from 1 to 9 [42]. The method relies on a square reciprocal matrix of pairwise judgments (1), where each element represents the relative importance of element over . By definition, and .
The resulting priority vector , representing the relative weights of the elements, is obtained by solving the principal eigenvalue Equation (2):
This relationship establishes that the derived weights reflect consistent judgments when . In practice, however, slight inconsistencies are expected. The value of is therefore used not only to verify the coherence of preferences but also as the basis for calculating the consistency indices described in the following section. This process ensures that the weight accurately reflects the expert’s pairwise preferences while preserving the reciprocal properties of the comparison matrix. The same procedure is applied for all matrices individually, and the derived weight vectors are subsequently assessed for consistency [41,42].
The reliability of individual judgments was assessed through the Consistency Index (CI) (3) and Consistency Ratio (CR) (4) [42]. A consistent judgment yields a principal eigenvalue equal to the matrix dimension. Deviations indicate inconsistencies in pairwise comparisons. The Consistency Index is computed as
where is the largest eigenvalue of the matrix, and is the number of compared elements.
To contextualize the magnitude of this deviation, the Consistency Ratio is calculated by normalizing the CI against a Random Index (RI), which represents the average CI of randomly generated matrices of the same order:
According to Saaty’s threshold, a Consistency Ratio below 0.10 is considered acceptable, indicating that the judgments made are coherent [42]. This consistency check enhances the reliability of individual prioritizations. It lays the groundwork for combining pairwise comparison matrices into a collective group matrix, which is essential for effective group decision making. The geometric mean method, which preserves the reciprocal property of judgments, is usually employed in this aggregation and is widely recommended in the literature as it attenuates the influence of individual extreme judgments [41,42].
The aggregation was performed by computing, for each , the geometric mean of the corresponding weights provided by the target group of experts. This method avoids reconstructing the group matrix and directly produces a vector that reflects the shared judgment of the panel. The aggregated weight for each criterion is calculated as shown (5):
where denotes the weight assigned to criterion by expert , and is the number of experts. The aggregated priority vector thus represents the consensus judgment across individual perspectives. This procedure preserves the relative importance across experts while maintaining scale consistency [42]. A detailed example of matrix aggregation is provided in Appendix A.
3.3. Individual Judgement Consistency and Group Consensus
The following sections present results from aggregating expert judgments and analyzing consistency and consensus across individual and group evaluations.
The overall consistency of individual judgments was deemed satisfactory. Most participants exhibited Consistency Ratios (CR) below the 0.10 threshold across the matrices. At the first level of comparison (criteria), no expert exceeded this threshold, reinforcing the reliability of the evaluations. However, greater inconsistencies were observed at the second level (subcriteria), particularly within the Infrastructure, Safety, and Environmental Quality matrices. Notably, two extreme cases with CR values exceeding 1.0 were recorded in the Environmental Quality matrix for experts 3A and 19B. Despite these outliers, all expert judgments were retained in the analysis. This choice aligns with AHP best practices, as employing the geometric mean aggregation method helps to soften the impact of inconsistent responses. Furthermore, each expert was used throughout the entire hierarchy, encompassing both criteria and subcriteria levels, which rendered the selective removal methodologically inappropriate. A comparative test excluding these two experts confirmed that the overall hierarchy and priority rankings remained stable, demonstrating the robustness of the aggregation approach.
Figure 4 presents boxplots depicting the distribution of Consistency Ratios (CR) across all comparison matrices, highlighting the variability in individual judgments and the proportion of values within the acceptable threshold (CR ≤ 0.10). The horizontal axis is limited to 0.7 for visual clarity. Values above 0.6 exist and were discussed above. Boxplots for the Consistency Index (CI) were not included, as they reflect the same pattern.
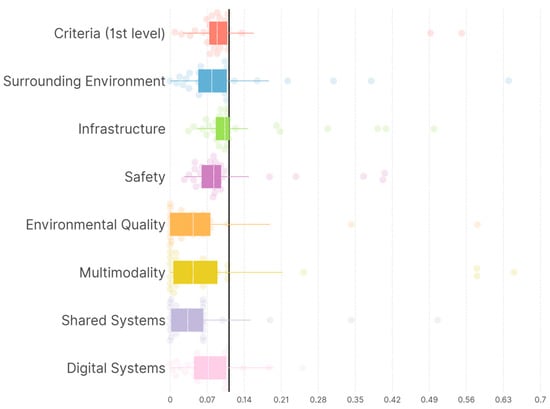
Figure 4.
Consistency Ratios (CRs) by comparison matrix. Boxplots are limited to the range [0–0.7], with a vertical reference line at the acceptability threshold (CR = 0.10).
Individual judgments were aggregated using the geometric mean, a method that mitigates the impact of outlier values [42]. A table of CR and IC values for each judgment is available in Appendix B.
3.4. Criteria-Level Results
The global priorities based on the aggregation of responses from 30 experts reveal clear distinctions in how the criteria were ranked. Safety (0.297) and Infrastructure (0.256) are the most influential factors, together accounting for over half of the total weight. In contrast, Shared Systems (0.088) and Digital Systems (0.051) received the lowest scores. The aggregated comparison matrix was highly consistent (CR = 0.004; CI = 0.00528).
In addition to analyzing the overall sample, this study examined how each group prioritized the main criteria of the assessment model. This segmentation provides a more nuanced understanding of how different stakeholder profiles assign importance based on their backgrounds and experiences. Table 1 presents each group’s normalized weights for the first-level hierarchy. While there are areas of convergence across the groups, several meaningful differences emerge, reflecting their distinct professional perspectives.

Table 1.
Weights assigned to the main criteria.
The table design features a horizontal division separating the aggregation from the three expert groups. ‘Global’ represents the prioritization of all 30 expert responses, while the other columns show results by stakeholder profile. Color gradients indicate the weight distribution within each group independently. Bolded values highlight the highest weight assigned to each subcriterion across the expert groups.
The comparative analysis of the three expert groups highlights differing priorities for bikeability criteria based on professional backgrounds. Safety (0.297) and infrastructure (0.256) emerged as core dimensions, accounting for over half the total weight. User representatives and cycling advocates assigned the highest values to both, reflecting daily experience with risk and infrastructure quality. Academic experts followed closely, while technical professionals attributed slightly lower weights, indicating a more balanced planning-oriented view.
A second set of contextual criteria, Surrounding Environment (0.106), Multimodality (0.104), and Environmental Quality (0.097), ranked at an intermediate level, with notable variation in group valuations. Technical professionals prioritized the Surrounding Environment (0.124), likely due to its relevance for infrastructure planning, whereas users (0.101) and academics (0.089) gave it less emphasis, possibly favoring structural aspects. Regarding Multimodality, technical professionals again assigned the highest weight (0.121), followed by academics (0.117), with users significantly lower (0.062), suggesting limited engagement with strategic integration across modes. In terms of Environmental Quality, academics attributed the most significant importance (0.118), focusing on air and noise pollution. At the same time, technical professionals (0.094) and users (0.070) appeared more focused on immediate infrastructure and safety concerns.
Shared Systems (0.088) and Digital Systems (0.051) received the lowest global weights but were valued differently across groups. Academics assigned the highest weights to both Shared Systems (0.121) and Digital Systems (0.074), indicating openness to emerging mobility trends and technological integration. Users followed (0.094 and 0.048), likely reflecting personal exposure and practical engagement, whereas technical professionals provided the lowest values (0.045 and 0.028), possibly due to concerns about feasibility or operational complexity.
In summary, while strong convergence was observed around the structural foundations of bikeability, namely, Safety and Infrastructure, the analysis reveals meaningful divergence in how complementary and emerging factors are valued. These findings underscore the importance of incorporating multiple expert viewpoints when evaluating cycling conditions in urban settings.
3.5. Subcriteria-Level Results
3.5.1. Weight Distribution in Surrounding Environment
The prioritization of subcriteria under the Surrounding Environment criterion reveals how experts perceive the role of contextual factors in urban cycling. Among the four elements, Land Use received the highest emphasis (0.320), followed by Climatic Protection (0.290) and Adjacent Green Areas (0.270). Water Bodies were rated as the least relevant (0.119), indicating minimal influence on bikeability (Table 2). Land Use was particularly valued by academic experts (0.404) and user representatives (0.363), emphasizing the importance of land use diversity and active urban frontages in shaping functional and attractive cycling environments. Technical professionals assigned a lower weight (0.216). Climatic Protection was more highly valued by technical professionals (0.317) than the other groups, suggesting a focus on creating sheltered infrastructure, such as tree-lined routes or built shading.
Table 2.
Weights assigned to the subcriteria of the Surrounding Environment.
In contrast, frequent cyclists appeared less concerned with such features. For Adjacent Green Areas, technical professionals (0.307) and user representatives (0.308) assigned the highest weights, reinforcing the perceived role of greenery in enhancing route appeal. Water Bodies received the lowest weights across all groups: 0.160 (technical), 0.101 (users), and 0.096 (academics). While such features may enhance urban aesthetics or environmental ambience, they were not considered to influence cycling decisions significantly. The expert panel’s aggregated comparison matrix showed a Consistency Ratio (CR) of 0.011 and a Consistency Index (CI) of 0.0099, indicating strong internal coherence. The small matrix size may have facilitated this alignment, even though the lower prioritization of Water Bodies may have introduced some divergence.
3.5.2. Weight Distribution Across Infrastructure
The assessment of subcriteria under the Infrastructure criterion primarily focuses on the physical features of the cycling network. Segregation Level was the top priority (0.197), followed by Corridor Integration (0.162), Pavement Smoothness (0.147), and Street Geometry (0.147), while Supporting Infrastructure (0.065) and Public Lighting (0.066) were deemed less necessary (Table 3). The results underscore the significance of structural components for route safety and continuity, particularly the need to minimize interactions with motorised traffic. Group-level analysis revealed differences in emphasis among experts. Academics rated Segregation Level highest (0.211), followed by technical professionals (0.198) and user representatives (0.163), indicating shared recognition of the importance of segregated infrastructure.
Table 3.
Weights assigned to the subcriteria of Infrastructure.
For Corridor Integration, technical professionals assigned the highest weight (0.184), while user representatives and academics rated it lower, suggesting that practitioners place greater emphasis on network continuity. Users prioritized Pavement Smoothness (0.200), reflecting their experiences with surface conditions, whereas other groups rated it lower. Supporting Infrastructure (e.g., maintenance points or e-bike charging stations) received its highest score from technical professionals (0.081). Public Lighting was generally deprioritized, possibly viewed as a complementary rather than core element, with academics assigning it a slightly higher weight (0.091). The panel’s aggregated comparison matrix yielded a Consistency Ratio (CR) of 0.006 and a Consistency Index (CI) of 0.00846, indicating high coherence in judgment.
3.5.3. Weight Distribution Across Safety
Subcriteria for cyclist safety were prioritized as follows: Traffic Exposure (0.282), Crash Frequency (0.256), and Intersection Conflicts (0.179) received the highest weights, while Conflicts with Parking Lanes and Bus Stops (0.083), Crime and Security (0.130), and Conflicts with Building Access Points (0.069) were less prioritized (Table 4). This distribution highlights concerns with objective physical threats. Traffic Exposure was prioritized across all groups, defined by the presence, speed, and volume of nearby motorized vehicles. It reflects the demand for physical separation and reduced interaction with traffic. Crash Frequency indicates the relevance of historical safety data, while Intersection Conflicts relate to perceived risk at junctions. Meanwhile, subcriteria such as Crime and Security and both types of spatial conflict were considered less influential, possibly due to their subjectivity or context dependency.
Table 4.
Weights assigned to the subcriteria of Safety.
Traffic Exposure was consistently prioritized, with user representatives assigning the highest weight (0.305), followed by academic experts (0.299) and technical professionals (0.250). This near-unanimous ranking underscores its perceived immediacy, especially among experienced cyclists. Crash Frequency was rated highest by technical professionals (0.282), slightly ahead of academics (0.260), while users assigned the lowest value (0.208), perhaps reflecting a stronger response to perceived rather than statistical risk. User representatives (0.219) emphasized Intersection Conflicts most, followed by academic experts (0.180) and technical professionals (0.154), reinforcing concern about navigating mixed-traffic environments.
Crime and Security received relatively similar weights across groups: 0.149 (technical), 0.137 (users), and 0.110 (academics), indicating moderate but consistent attention to social safety. The two lowest-ranked subcriteria, Conflicts with Parking Lanes and Bus Stops and Conflicts with Building Access Points, showed close values across all groups, though slightly higher among technical professionals (0.098 and 0.068, respectively). These factors appear to be seen as contextual inconveniences rather than primary safety risks. The panel’s aggregated matrix achieved a Consistency Ratio (CR) of 0.004 and a Consistency Index (CI) of 0.00496, indicating strong coherence across expert perspectives.
3.5.4. Weight Distribution Across Environmental Quality
Expert assessments under the Environmental Quality criterion show strong concern for health impacts, prioritizing Air Pollution (0.531) over Noise Pollution (0.302) and Allergenic Factors (0.168). This indicates a focus on quantifiable environmental risks affecting cyclists’ comfort and safety (Table 5). Air Pollution was the highest priority, reflecting awareness of the dangers associated with exposure to particulate matter, especially in high-traffic areas. Noise Pollution, beyond discomfort, may be seen as a proxy for traffic intensity and urban stress. Allergenic Factors, by contrast, were perceived as less immediate or as having lower attribution to cycling conditions.
Table 5.
Weights assigned to the subcriteria of Environmental Quality.
Weight distributions across groups were relatively consistent. Academics assigned the highest weight to Air Pollution (0.553), followed by technical professionals (0.511) and user representatives (0.492), showing broad agreement on its critical impact. For Noise Pollution, values were more dispersed: 0.340 (academics), 0.299 (users), and 0.265 (technical), suggesting slightly greater sensitivity among academics and users. Allergenic Factors were ranked low across all groups: 0.106 (users), 0.180 (academics), and 0.224 (technical), indicating a shared view of their marginal role, possibly due to individual variability and seasonal variation. The aggregated comparison matrix showed perfect consistency (CR and CI equal to zero). The relatively small matrix size may have facilitated alignment, supported by the apparent dominance of air pollution in expert judgments.
3.5.5. Weight Distribution Across Multimodality
The subcriteria under Multimodality received closely weighted responses, indicating general agreement on their relevance. Connection to Public Transport was the highest priority (0.373), followed by Bicycle Parking at Stops and Terminals (0.335) and Regulation of Bicycle Transport in Public Transit (0.292) (Table 6). This emphasizes the importance of integrating cycling with other transport modes. The high value assigned to Connection to Public Transport suggests the need for effective intermodal links, supporting bicycle use over medium to longer distances. Secure parking at terminals was also considered critical, while regulation within transit systems was slightly less emphasized, possibly due to its perceived complexity.
Table 6.
Weights assigned to the subcriteria of Multimodality.
Academics prioritized Connection to Public Transport most (0.466), compared to lower values from technical professionals (0.305) and user representatives (0.323). This may reflect an understanding of Multimodality as a core element of sustainable mobility systems. For Bicycle Parking at Stops and Terminals, technical professionals attributed the highest weight (0.368), consistent with a focus on infrastructure provision. Users followed (0.293), while academics assigned the lowest value (0.215), possibly preferring systemic over facility-based solutions. Regarding the Regulation of Bicycle Transport, weights were more balanced: 0.385 (users), 0.326 (technical), and 0.319 (academics), indicating shared recognition of its role in enabling intermodal travel. The panel’s aggregated matrix showed satisfactory consistency (CI = 0.00754; CR = 0.013), indicating a coherent set of judgments, with some variation possibly influenced by differences in professional background or planning context.
3.5.6. Weight Distribution Across Shared Systems
Subcriteria related to Shared Bicycle Systems (BSS) showed a moderate hierarchy of importance. Coverage of Points of Interest (POIs) was prioritized highest (0.365), followed by Availability of Systems (0.347) and Attributes of the Systems (0.288) (Table 7). This distribution highlights the perceived relevance of spatial reach and accessibility. The prioritization of BSS coverage at strategic locations, such as travel generator zones and transport hubs, suggests that their integration into everyday travel flows is essential. Availability followed closely, reflecting concern with service presence and distribution. System attributes, such as bicycle type, interface, and reliability, were considered somewhat less central, though still relevant.
Table 7.
Weights assigned to the subcriteria of Shared Systems.
Among expert groups, user representatives assigned the highest weight to Availability (0.488), likely reflecting the importance of tangible presence in influencing daily use. Academic experts prioritized Attributes (0.405), indicating conceptual attention to BSS design and operation. Technical professionals assigned the highest value to POI Coverage (0.382), aligning with a planning logic favoring integration with key activity nodes. Despite differing emphases, the three groups assigned relatively similar weights to POI Coverage: 0.313 (academics), 0.382 (technical), and 0.369 (users), showing convergence on this spatial dimension. Conversely, user representatives assigned Attributes the lowest weight (0.132), indicating that functional features are secondary to availability in daily use contexts. The panel’s comparison matrix showed perfect consistency (CR and CI equal to zero), possibly facilitated by the limited number of elements in the matrix and the shared valuation of system coverage in Portugal, where BSS are still developing and are mainly found in larger urban areas.
3.5.7. Weight Distribution Across Digital Systems
The global priorities based on expert assessments under the Digital Systems criterion show a balanced prioritization, with Usage Cost ranking highest (0.299), followed by Service Functions (0.249), Digital System Solutions (0.240), and Trip Information (0.212) (Table 8). These results suggest that while digital dimensions are not central, they are not dismissed outright in assessing cycling conditions. Comparisons across groups revealed notable differences. Academic experts assigned the highest weight to Usage Cost (0.354), emphasising equity and inclusion in digital access, followed by user representatives (0.315) and technical professionals (0.226). For Service Functions, technical professionals gave the highest weight (0.281), while user representatives assigned the lowest (0.188), possibly perceiving such features as less essential.
Table 8.
Weights assigned to the subcriteria of Digital Systems.
Digital System Solutions received the highest weight from technical professionals (0.332), reinforcing their focus on system integration and accessibility. Academic experts assigned the lowest value (0.162). Lastly, Trip Information was prioritized mostly by academics (0.237), with technical professionals (0.161) and user representatives (0.241) assigning similar but slightly lower values. The aggregated matrix showed excellent consistency (CI = 0.0009; CR = 0.001), with only slight variations observed among expert judgments.
4. Discussion
The expert panel’s evaluation shows consistent prioritization patterns, providing insight into the valuation of both traditional and emerging factors when assessing urban bikeability. Even with varying professional backgrounds and experiences, there was a notable agreement on several key dimensions. Safety and infrastructure were the most prioritized criteria across all groups, reaffirming their foundational role in cycling policy.
The second tier of criteria, comprising Surrounding Environment, Multimodality, and Environmental Quality, reflects a growing awareness of contextual and integrative factors. Although not perceived as central, these elements shape the broader cycling experience in urban areas; features related to this criterion contribute to usability and long-term sustainability. Air pollution emerged as the most influential subcriterion within Environmental Quality, underscoring its significance for planning low-emission routes and safeguarding public health.
In contrast, Shared Systems and Digital Systems received lower weights, suggesting more reserved expectations regarding these emerging components. Regarding shared mobility, the limited presence of bicycle-sharing systems (BSS) in Portugal may have influenced participants’ evaluations. Still, these systems represent an emerging dimension of bikeability, with potential to broaden the functional scope of cycling, diversify user profiles, and enhance flexibility and connectivity in urban mobility. Despite their potential to expand access and promote cycling, such systems remain heavily dependent on the quality of cycling infrastructure and the perceived safety of the network. As such, their effectiveness is seen as contingent rather than autonomous.
For Digital Systems, the subcriteria selected may not have fully captured the potential relevance of technology to bikeability. As currently framed, the focus was placed on the cost of use, service features, and trip data, elements that, although useful, are often considered peripheral by frequent cyclists. It is plausible that if digital features had included aspects directly linked to infrastructure or safety, such as environmental sensing systems, real-time hazard alerts, or advanced rider-assist functions, these elements might have received greater attention. For example, cyclist-carried devices capable of receiving accident warnings or systems akin to vehicular driver-assistance tools could be perceived as strong enablers of safety and confidence in complex urban settings.
Furthermore, for experienced cyclists or those familiar with local travel routines, navigational apps are unlikely to be used in day-to-day travel unless route modifications are needed. In this context, the perceived utility of basic digital navigation functions without contextual alerts may have contributed to the lower prioritization of this criterion. The distinctions among expert groups offer additional detail. User representatives highlighted practical considerations, such as availability, surface conditions, and traffic exposure, which indicate firsthand experience with the cycling environment. Technical professionals maintained a balanced perspective, concentrating on network design and the feasibility of implementation. On the other hand, academic experts gave higher importance to conceptual and emerging issues, particularly concerning environmental quality, shared systems, and digital integration.
These findings have clear implications for urban mobility planning. They reinforce the need to prioritize high-quality infrastructure as the backbone of cycling systems while integrating environmental and intermodal considerations to enhance user experience. From a policy perspective, understanding the relative importance of each criterion can guide investment strategies: factors with high perceived importance but low current performance may be prioritized for improvement. At the same time, less relevant elements may be addressed in a secondary phase. Conversely, strengthening highly valued aspects that already perform well can generate significant returns in user satisfaction and network performance. Additionally, peripheral, shared, and digital systems innovations should not be overlooked. Their gradual integration, notably when aligned with established infrastructure and safety standards, can support more inclusive, adaptive, and technologically enabled mobility models. In summary, the prioritization patterns observed reflect a balance between foundational needs, contextual considerations, and emerging solutions. Capturing the perspectives of diverse expert groups, including academic, technical, and experiential profiles, is essential to ensure responsive, evidence-based, and forward-looking cycling policies.
5. Conclusions
This study examines how urban and transportation planning experts perceive the relevance of traditional and emerging criteria in evaluating cycling networks. Using the Analytic Hierarchy Process (AHP), we elicited and compared the priorities of 30 specialists from academic, technical, and user-based profiles. The findings offer a structured and multidimensional view of how bikeability is evaluated by stakeholders with diverse backgrounds and viewpoints.
All expert groups prioritized traditional criteria such as Safety and Infrastructure. At the same time, Shared and Digital Systems were perceived as complementary elements, receiving lower weights overall, although academic experts valued them more. The limited prioritization of emerging criteria appears to reflect contextual factors, such as the availability of shared systems or the framing of digital tools around ancillary features rather than core infrastructure or safety. Still, these additions did not significantly alter the hierarchy of priorities.
This study emphasizes the potential of AHP as a transparent and replicable method for evaluating urban cycling conditions, particularly when implemented through digitally supported procedures. From a planning standpoint, it reinforces the importance of investing in robust infrastructure and physical safety. Additionally, contextual and integrative elements such as environmental quality and multimodality should be considered.
Though currently less prioritized, shared mobility systems, e-bikes, and digital tools challenge traditional bikeability assessment models by introducing dimensions that go beyond physical infrastructure and safety. They expand the functional reach of cycling; diversify user profiles; and incorporate new aspects of attractiveness, flexibility, and connectivity. Their importance may grow as these technologies are more explicitly linked to safety-related functions and embedded within established infrastructure standards. This integration could strengthen connections with other transport modes, attract new cyclists, and support more inclusive and adaptive mobility models. The involvement of various expert profiles was crucial in creating a nuanced and balanced assessment that captures both current limitations and future potential.
However, there are limitations to consider. These include reliance on expert judgment, a geographically restricted sample, and the static nature of perceptions captured at a specific moment. These factors suggest opportunities for further research, such as applying the framework at local levels, conducting comparative studies, integrating empirical data, and using GIS tools to apply prioritization weights to real cycling networks. This approach could help generate spatialized bikeability indices and inform targeted interventions. For example, integrating expert-weighted criteria with geospatial data such as cycling flow patterns, accident locations, infrastructure coverage, and environmental quality indicators could enable location-specific planning and policy development.
Author Contributions
Conceptualisation, U.N.C., P.J.G.R. and J.F.G.M.; methodology, U.N.C. and P.J.G.R.; formal analysis, U.N.C. and P.J.G.R.; investigation, U.N.C.; writing—original draft preparation, U.N.C.; writing—review and editing, U.N.C. and P.J.G.R.; visualization, U.N.C., P.J.G.R. and J.F.G.M.; supervision, P.J.G.R. and J.F.G.M. All authors have read and agreed to the published version of the manuscript.
Funding
This research received no external funding.
Data Availability Statement
Data are contained within the article. Further inquiries can be directed to the corresponding authors.
Conflicts of Interest
The authors declare no conflicts of interest.
Correction Statement
This article has been republished with a minor correction to the Data Availability Statement. This change does not affect the scientific content of the article.
Abbreviations
The following abbreviations are used in this manuscript:
| AHP | Analytic Hierarchy Process. |
| BSS | Bike-sharing Systems. |
| CI | Consistency Index. |
| CR | Consistency Ratio. |
| E-BSS | Electric Bike-sharing Systems. |
| GIS | Geographic Information System. |
| MADM | Multi-Attribute Decision Making. |
| MCDA | Multicriteria Decision Analysis. |
| MODM | Multi-Objective Decision Making. |
| POI | Point of Interest. |
| RI | Random Index. |
Appendix A
Appendix A.1
This appendix provides a step-by-step aggregation example using two 3 × 3 pairwise comparison matrices and applying the AHP method according to the geometric mean of individual priority vectors. It demonstrates the procedure used for calculating priority weights at the criteria level, as per Section 3.2. The process involves constructing individual pairwise comparison matrices, calculating priority vectors using the principal eigenvalue method, and aggregating the individual weight vectors using the geometric mean method. All steps are clearly shown for transparency and reproducibility. The individual pairwise comparison matrices used in this example are denoted as Expert A and Expert B, referring to three evaluation criteria (C1, C2, and C3). The values represent the relative importance of each criterion as assessed by the experts.
Table A1.
Expert A pairwise comparison matrix.
Table A1.
Expert A pairwise comparison matrix.
| C1 | C2 | C3 | |
|---|---|---|---|
| C1 | 1 | 3 | 4 |
| C2 | 1/3 | 1 | 2 |
| C3 | 1/4 | 1/2 | 1 |
Table A2.
Expert B’s pairwise comparison matrix.
Table A2.
Expert B’s pairwise comparison matrix.
| C1 | C2 | C3 | |
|---|---|---|---|
| C1 | 1 | 2 | 3 |
| C2 | 1/2 | 1 | 2 |
| C3 | 1/3 | 1/2 | 1 |
Appendix A.2
This section details the step-by-step derivation of the vectors for each expert’s judgment matrix using the principal eigenvalue method.
- Step 1—Compute Column Sums
- Step 2—Normalize the Matrix
Each element is divided by the sum of its column:
- Step 3—Compute Priority Vector w
Take the arithmetic mean of each row:
For Matrix A:
For Matrix B:
Priority vectors:
For Matrix A:
For Matrix B:
Appendix A.3
This section explains how to aggregate judgments from two experts using the geometric mean of priority vectors.
- Step 1—Apply the Geometric Mean to Individual Priority Vectors:
To combine two priority vectors, we apply the geometric mean for each element:
where and are the weights from Experts A and B, respectively.
- Step 2—Compute the Group Priority Vector:
Normalize:
Since this approach aggregates already normalized individual priority vectors through the geometric mean, the consistency measures CI (Consistency Index) and CR (Consistency Ratio) are not computed at the group level. These indicators are only meaningful when derived from complete pairwise comparison matrices, which are not reconstructed in this version of the method.
Appendix B
This appendix contains the individual consistency metrics calculated for each expert’s pairwise comparison matrices at both levels of the AHP hierarchy: the criteria and subcriteria. The results include the Consistency Ratio (CR) and the Consistency Index (CI), which are standard indicators used to assess the logical coherence of the judgments.
Table A3.
Consistency Ratio (CR) values for individual pairwise comparisons at the criteria and subcriteria levels.
Table A3.
Consistency Ratio (CR) values for individual pairwise comparisons at the criteria and subcriteria levels.
| ID | Criteria (1st Level) | Subcriteria (2nd Level) | ||||||
|---|---|---|---|---|---|---|---|---|
| Surrounding Environment | Infrastructure | Safety | Environmental Quality | Multimodality | Shared Systems | Digital Systems | ||
| 1A | 0.075 | 0.052 | 0.086 | 0.073 | 0.019 | 0.056 | 0.010 | 0.011 |
| 2A | 0.063 | 0.062 | 0.093 | 0.032 | 0 | 0.006 | 0.002 | 0.004 |
| 3A | 0.080 | 0.093 | 0.097 | 0.068 | 1.491 | 0.056 | 0.056 | 0.099 |
| 4A | 0.062 | 0.032 | 0.066 | 0.076 | 0 | 0 | 0 | 0.026 |
| 5B | 0.068 | 0.200 | 0.268 | 0.362 | 0.308 | 0.522 | 0.308 | 0.125 |
| 6A | 0.084 | 0.069 | 0.100 | 0.076 | 0.068 | 0.098 | 0.056 | 0.098 |
| 7B | 0.089 | 0.016 | 0.040 | 0.089 | 0.015 | 0.010 | 0.089 | 0.069 |
| 8A | 0.098 | 0.049 | 0.074 | 0.086 | 0.039 | 0.074 | 0.030 | 0.093 |
| 9B | 0.042 | 0.027 | 0.083 | 0.092 | 0.002 | 0 | 0 | 0.030 |
| 10B | 0.072 | 0.096 | 0.079 | 0.214 | 0.056 | 0.010 | 0.056 | 0.041 |
| 11C | 0.071 | 0.095 | 0.061 | 0.076 | 0 | 0 | 0.056 | 0.065 |
| 12A | 0.080 | 0.054 | 0.367 | 0.055 | 0.039 | 0.039 | 0.056 | 0.046 |
| 13A | 0.081 | 0.022 | 0.084 | 0.086 | 0.019 | 0.019 | 0.056 | 0.017 |
| 14B | 0.067 | 0.033 | 0.097 | 0.077 | 0 | 0 | 0 | 0.053 |
| 15A | 0.085 | 0.148 | 0.111 | 0.044 | 0 | 0 | 0.026 | 0.068 |
| 16B | 0.443 | 0.109 | 0.187 | 0.329 | 0.523 | 0.522 | 0.455 | 0.225 |
| 17C | 0.069 | 0.071 | 0.095 | 0.065 | 0 | 0.056 | 0.019 | 0.095 |
| 18C | 0.094 | 0.091 | 0.098 | 0.074 | 0.056 | 0.098 | 0.006 | 0.093 |
| 19B | 0.019 | 0.342 | 0.449 | 0.051 | 5.317 | 0 | 0 | 0.043 |
| 20B | 0.084 | 0.011 | 0.062 | 0.040 | 0.010 | 0.002 | 0.056 | 0.054 |
| 21C | 0.496 | 0.576 | 0.353 | 0.365 | 0 | 0.585 | 0.002 | 0.168 |
| 22B | 0.098 | 0.096 | 0.086 | 0.054 | 0.039 | 0.098 | 0.010 | 0.089 |
| 23C | 0.097 | 0.049 | 0.096 | 0.080 | 0.068 | 0.056 | 0.003 | 0.079 |
| 24A | 0.122 | 0.278 | 0.181 | 0.169 | 0.019 | 0.227 | 0.170 | 0.057 |
| 25C | 0.087 | 0 | 0.099 | 0.042 | 0.098 | 0.010 | 0 | 0 |
| 26C | 0.099 | 0.057 | 0.084 | 0.060 | 0.039 | 0.074 | 0.030 | 0.046 |
| 27A | 0.057 | 0.072 | 0.078 | 0.024 | 0.056 | 0.010 | 0.056 | 0.044 |
| 28A | 0.034 | 0.048 | 0.031 | 0.042 | 0 | 0.010 | 0.040 | 0.010 |
| 29B | 0.098 | 0.097 | 0.093 | 0.083 | 0.056 | 0.080 | 0 | 0.089 |
| 30B | 0.008 | 0.084 | 0.055 | 0.074 | 0.019 | 0.019 | 0.010 | 0.097 |
Table A4.
Consistency Index (CI) values for individual pairwise comparisons at the criteria and subcriteria levels.
Table A4.
Consistency Index (CI) values for individual pairwise comparisons at the criteria and subcriteria levels.
| ID | Criteria (1st Level) | Subcriteria (2nd Level) | ||||||
|---|---|---|---|---|---|---|---|---|
| Surrounding Environment | Infrastructure | Safety | Environmental Quality | Multimodality | Shared Systems | Digital Systems | ||
| 1A | 0.099 | 0.047 | 0.121 | 0.091 | 0.011 | 0.032 | 0.006 | 0.010 |
| 2A | 0.083 | 0.056 | 0.131 | 0.040 | 0 | 0.003 | 0.001 | 0.004 |
| 3A | 0.106 | 0.084 | 0.137 | 0.084 | 0.865 | 0.032 | 0.032 | 0.089 |
| 4A | 0.082 | 0.029 | 0.093 | 0.094 | 0 | 0 | 0 | 0.023 |
| 5B | 0.090 | 0.180 | 0.378 | 0.449 | 0.179 | 0.303 | 0.179 | 0.113 |
| 6A | 0.111 | 0.062 | 0.141 | 0.094 | 0.039 | 0.057 | 0.032 | 0.088 |
| 7B | 0.117 | 0.014 | 0.056 | 0.110 | 0.009 | 0.006 | 0.052 | 0.062 |
| 8A | 0.129 | 0.044 | 0.104 | 0.107 | 0.023 | 0.043 | 0.017 | 0.084 |
| 9B | 0.055 | 0.024 | 0.117 | 0.114 | 0.001 | 0 | 0 | 0.027 |
| 10B | 0.095 | 0.086 | 0.111 | 0.265 | 0.032 | 0.006 | 0.032 | 0.037 |
| 11C | 0.094 | 0.086 | 0.086 | 0.094 | 0 | 0 | 0.032 | 0.059 |
| 12A | 0.106 | 0.049 | 0.517 | 0.068 | 0.023 | 0.023 | 0.032 | 0.041 |
| 13A | 0.107 | 0.020 | 0.118 | 0.107 | 0.011 | 0.011 | 0.032 | 0.015 |
| 14B | 0.088 | 0.030 | 0.137 | 0.095 | 0 | 0 | 0 | 0.048 |
| 15A | 0.112 | 0.133 | 0.157 | 0.055 | 0 | 0 | 0.015 | 0.061 |
| 16B | 0.585 | 0.098 | 0.264 | 0.408 | 0.303 | 0.303 | 0.264 | 0.203 |
| 17C | 0.091 | 0.064 | 0.134 | 0.081 | 0 | 0.032 | 0.011 | 0.086 |
| 18C | 0.124 | 0.082 | 0.138 | 0.092 | 0.032 | 0.057 | 0.003 | 0.084 |
| 19B | 0.025 | 0.308 | 0.633 | 0.063 | 3.084 | 0 | 0 | 0.039 |
| 20B | 0.111 | 0.010 | 0.087 | 0.050 | 0.006 | 0.001 | 0.032 | 0.049 |
| 21C | 0.655 | 0.518 | 0.498 | 0.453 | 0 | 0.339 | 0.001 | 0.151 |
| 22B | 0.129 | 0.086 | 0.121 | 0.067 | 0.023 | 0.057 | 0.006 | 0.080 |
| 23C | 0.128 | 0.044 | 0.135 | 0.099 | 0.039 | 0.032 | 0.002 | 0.071 |
| 24A | 0.161 | 0.250 | 0.255 | 0.210 | 0.011 | 0.132 | 0.099 | 0.051 |
| 25C | 0.115 | 0.000 | 0.140 | 0.052 | 0.057 | 0.006 | 0 | 0 |
| 26C | 0.131 | 0.051 | 0.118 | 0.074 | 0.023 | 0.043 | 0.017 | 0.041 |
| 27A | 0.075 | 0.065 | 0.110 | 0.030 | 0.032 | 0.006 | 0.032 | 0.040 |
| 28A | 0.045 | 0.043 | 0.044 | 0.052 | 0 | 0.006 | 0.023 | 0.009 |
| 29B | 0.129 | 0.087 | 0.131 | 0.103 | 0.032 | 0.046 | 0 | 0.080 |
| 30B | 0.011 | 0.076 | 0.078 | 0.092 | 0.011 | 0.011 | 0.006 | 0.087 |
References
- UN. Transforming Our World: The 2030 Agenda for Sustainable Development; UN: New York, NY, USA, 2016. [Google Scholar]
- Banister, D. The Sustainable Mobility Paradigm. Transp. Policy 2008, 15, 73–80. [Google Scholar] [CrossRef]
- Castañon, U.N.; Ribeiro, P.J.G. Bikeability and Emerging Phenomena in Cycling: Exploratory Analysis and Review. Sustainability 2021, 13, 2394. [Google Scholar] [CrossRef]
- ECF. Cycling Delivers on the Global Goals; ECF: Brussels, Belgium, 2015; p. 8. [Google Scholar]
- Czech, P.; Turoń, K.; Urbańczyk, R. Bike-Sharing as an Element of Integrated Urban Transport System. Adv. Intell. Syst. Comput. 2018, 631, 103–111. [Google Scholar] [CrossRef]
- Hamilton, T.L.; Wichman, C.J. Bicycle Infrastructure and Traffic Congestion: Evidence from DC’s Capital Bikeshare. J. Environ. Econ. Manag. 2018, 87, 72–93. [Google Scholar] [CrossRef]
- Wang, M.; Zhou, X. Bike-Sharing Systems and Congestion: Evidence from US Cities. J. Transp. Geogr. 2017, 65, 147–154. [Google Scholar] [CrossRef]
- Pucher, J.; Buehler, R. Making Cycling Irresistible: Lessons from the Netherlands, Denmark and Germany. Transp. Rev. 2008, 28, 495–528. [Google Scholar] [CrossRef]
- Ribeiro, P.J.G.; Dias, G.; Mendes, J.F.G. Decarbonizing Urban Mobility: A Methodology for Shifting Modal Shares to Achieve CO2 Reduction Targets. Sustainability 2024, 16, 7049. [Google Scholar] [CrossRef]
- Ahrens, G.-A.; Becker, U.; Böhmer, T.; Richter, F.; Rico, W. Potential of Cycling to Reduce Emissions in Road Transport; Federal Environment Agency (Umweltbundesamt): Dessau-Roßlau, Germany, 2013. [Google Scholar]
- Lin, X.; Wells, P.; Sovacool, B.K. Benign Mobility? Electric Bicycles, Sustainable Transport Consumption Behaviour and Socio-Technical Transitions in Nanjing, China. Transp. Res. Part A Policy Pract. 2017, 103, 223–234. [Google Scholar] [CrossRef]
- Fyhri, A.; Fearnley, N. Effects of E-Bikes on Bicycle Use and Mode Share. Transp. Res. D Transp. Environ. 2015, 36, 45–52. [Google Scholar] [CrossRef]
- Wolf, A.; Seebauer, S. Technology Adoption of Electric Bicycles: A Survey among Early Adopters. Transp. Res. Part A Policy Pract. 2014, 69, 196–211. [Google Scholar] [CrossRef]
- Huertas-Leyva, P.; Dozza, M.; Baldanzini, N. Investigating Cycling Kinematics and Braking Maneuvers in the Real World: E-Bikes Make Cyclists Move Faster, Brake Harder, and Experience New Conflicts. Transp. Res. Part F Traffic Psychol. Behav. 2018, 54, 211–222. [Google Scholar] [CrossRef]
- Schepers, J.P.; Fishman, E.; Den Hertog, P.; Wolt, K.K.; Schwab, A.L. The Safety of Electrically Assisted Bicycles Compared to Classic Bicycles. Accid. Anal. Prev. 2014, 73, 174–180. [Google Scholar] [CrossRef]
- Hiselius, L.W.; Svensson, A. E-Bike Use in Sweden–CO2effects Due to Modal Change and Municipal Promotion Strategies. J. Clean. Prod. 2017, 141, 818–824. [Google Scholar] [CrossRef]
- Fishman, E.; Cherry, C. E-Bikes in the Mainstream: Reviewing a Decade of Research. Transp. Rev. 2016, 36, 72–91. [Google Scholar] [CrossRef]
- Parkes, S.; Marsden, G.; Shaheen, S.; Cohen, A. Understanding the Diffusion of Public Bikesharing Systems: Evidence from Europe and North America. J. Transp. Geogr. 2013, 31, 94–103. [Google Scholar] [CrossRef]
- Martin, E.W.; Shaheen, S.A. Evaluating Public Transit Modal Shift Dynamics in Response to Bikesharing: A Tale of Two U.S. Cities. J. Transp. Geogr. 2014, 41, 315–324. [Google Scholar] [CrossRef]
- Jäppinen, S.; Toivonen, T.; Salonen, M. Modelling the Potential Effect of Shared Bicycles on Public Transport Travel Times in Greater Helsinki: An Open Data Approach. Appl. Geogr. 2013, 43, 13–24. [Google Scholar] [CrossRef]
- Guidon, S.; Becker, H.; Dediu, H.; Axhausen, K.W. Electric Bicycle-Sharing: A New Competitor in the Urban Transportation Market? An Empirical Analysis of Transaction Data. Transp. Res. Rec. 2019, 2673, 15–26. [Google Scholar] [CrossRef]
- Fishman, E.; Washington, S.; Haworth, N.; Mazzei, A. Barriers to Bikesharing: An Analysis from Melbourne and Brisbane. J. Transp. Geogr. 2014, 41, 325–337. [Google Scholar] [CrossRef]
- Romanillos, G.; Moya-Gómez, B.; Zaltz-Austwick, M.; Lamíquiz-Daudén, P.J. The Pulse of the Cycling City: Visualising Madrid Bike Share System GPS Routes and Cycling Flow. J. Maps 2018, 14, 34–43. [Google Scholar] [CrossRef]
- Behrendt, F. Why Cycling Matters for Electric Mobility: Towards Diverse, Active and Sustainable e-Mobilities. Mobilities 2018, 13, 64–80. [Google Scholar] [CrossRef]
- Reck, D.J.; Martin, H.; Axhausen, K.W. Mode Choice, Substitution Patterns and Environmental Impacts of Shared and Personal Micro-Mobility. Transp. Res. D Transp. Environ. 2022, 102, 103134. [Google Scholar] [CrossRef]
- Kazemzadeh, K.; Ronchi, E. From Bike to Electric Bike Level-of-Service. Transp. Rev. 2022, 42, 6–31. [Google Scholar] [CrossRef]
- Meireles, M.; Ribeiro, P.J.G. Digital Platform/Mobile App to Boost Cycling for the Promotion of Sustainable Mobility in Mid-Sized Starter Cycling Cities. Sustainability 2020, 12, 2064. [Google Scholar] [CrossRef]
- Zhang, C.; Zhang, L.; Liu, Y.; Yang, X. Short-Term Prediction of Bike-Sharing Usage Considering Public Transport: A LSTM Approach. In Proceedings of the IEEE Conference on Intelligent Transportation Systems, Proceedings, ITSC, Maui, HI, USA, 4–7 November 2018; Institute of Electrical and Electronics Engineers Inc.: Piscataway, NJ, USA, 2018; pp. 1564–1571. [Google Scholar]
- Sjöman, M.; Ringenson, T.; Kramers, A. Exploring Everyday Mobility in a Living Lab Based on Economic Interventions. Eur. Transp. Res. Rev. 2020, 12, 1–17. [Google Scholar] [CrossRef]
- Lowry, M.; Callister, D.; Gresham, M.; Moore, B. Assessment of Communitywide Bikeability with Bicycle Level of Service. Transp. Res. Rec. 2012, 41–48. [Google Scholar] [CrossRef]
- Winters, M.; Brauer, M.; Setton, E.M.; Teschke, K. Mapping Bikeability: A Spatial Tool to Support Sustainable Travel. Environ. Plan. B Plan. Des. 2013, 40, 865–883. [Google Scholar] [CrossRef]
- Wahlgren, L.; Schantz, P. Bikeability and Methodological Issues Using the Active Commuting Route Environment Scale (ACRES) in a Metropolitan Setting. BMC Med. Res. Methodol. 2011, 11, 6. [Google Scholar] [CrossRef]
- Grigore, E.; Garrick, N.; Fuhrer, R.; Axhausen, I.K.W. Bikeability in Basel. Transp. Res. Rec. J. Transp. Res. Board 2019, 2673, 607–617. [Google Scholar] [CrossRef]
- Ahmed, T.; Pirdavani, A.; Wets, G.; Janssens, D. Micro-Level Bicycle Infrastructure Design Elements: A Framework for Developing a Bikeability Index for Urban Areas. Smart Cities 2025, 8, 46. [Google Scholar] [CrossRef]
- Karolemeas, C.; Vassi, A.; Tsigdinos, S.; Bakogiannis, D.E. Measure the Ability of Cities to Be Biked via Weighted Parameters, Using GIS Tools. the Case Study of Zografou in Greece. Transp. Res. Procedia 2022, 62, 59–66. [Google Scholar] [CrossRef]
- Ahmed, T.; Pirdavani, A.; Wets, G.; Janssens, D. Bicycle Infrastructure Design Principles in Urban Bikeability Indices: A Systematic Review. Sustainability 2024, 16, 2545. [Google Scholar] [CrossRef]
- Castañon, U.N.; Ribeiro, P.J.G.; Mendes, J.F.G. Evaluating Urban Bikeability: A Comprehensive Assessment of Póvoa de Varzim’s Network. Sustainability 2024, 16, 9472. [Google Scholar] [CrossRef]
- Psarrou Kalakoni, A.M.; Christoforou, Z.; Farhi, N. A Novel Methodology for Micromobility System Assessment Using Multi-Criteria Analysis. Case Stud. Transp. Policy 2022, 10, 976–992. [Google Scholar] [CrossRef]
- La Paix, L.; Cherchi, E.; Geurs, K. Role of Perception of Bicycle Infrastructure on the Choice of the Bicycle as a Train Feeder Mode. Int. J. Sustain. Transp. 2021, 15, 486–499. [Google Scholar] [CrossRef]
- Hsu, C.C.; Kuo, Y.W.; Liou, J.J.H. A Hybrid Model for Evaluating the Bikeability of Urban Bicycle Systems. Axioms 2023, 12, 155. [Google Scholar] [CrossRef]
- Malczewski, J.; Rinner, C. Multicriteria Decision Analysis in Geographic Information Science; Advances in Geographic Information Science; Springer: Berlin/Heidelberg, Germany, 2015; ISBN 978-3-540-74756-7. [Google Scholar]
- Saaty, T.L.; Vargas, L.G. Models, Methods, Concepts & Applications of the Analytic Hierarchy Process; International Series in Operations Research & Management Science; Springer: Boston, MA, USA, 2012; Volume 175, ISBN 978-1-4614-3596-9. [Google Scholar]
- Uğurlu, Ö.; Kum, S.; Aydoğdu, Y.V. Analysis of Occupational Accidents Encountered by Deck Cadets in Maritime Transportation. Marit. Policy Manag. 2017, 44, 304–322. [Google Scholar] [CrossRef]
- Ha, M.H.; Yang, Z. Comparative Analysis of Port Performance Indicators: Independency and Interdependency. Transp. Res. Part A Policy Pract. 2017, 103, 264–278. [Google Scholar] [CrossRef]
- Ha, M.H.; Yang, Z.; Heo, M.W. A New Hybrid Decision Making Framework for Prioritising Port Performance Improvement Strategies. Asian J. Shipp. Logist. 2017, 33, 105–116. [Google Scholar] [CrossRef]
- Oliveira, I.A.S.J.; Carayannis, E.G.; Ferreira, F.A.F.; Jalali, M.S.; Carlucci, D.; Ferreira, J.J.M. Constructing Home Safety Indices for Strategic Planning in Residential Real Estate: A Socio-Technical Approach. Technol. Forecast. Soc. Change 2018, 131, 67–77. [Google Scholar] [CrossRef]
- Havle, C.A.; Kılıç, B. A Hybrid Approach Based on the Fuzzy AHP and HFACS Framework for Identifying and Analyzing Gross Navigation Errors during Transatlantic Flights. J. Air Transp. Manag. 2019, 76, 21–30. [Google Scholar] [CrossRef]
- Lee, H.; Geum, Y. Development of the Scenario-Based Technology Roadmap Considering Layer Heterogeneity: An Approach Using CIA and AHP. Technol. Forecast. Soc. Change 2017, 117, 12–24. [Google Scholar] [CrossRef]
- Yeh, C.C.; Chen, Y.F. Critical Success Factors for Adoption of 3D Printing. Technol. Forecast. Soc. Change 2018, 132, 209–216. [Google Scholar] [CrossRef]
- Banihabib, M.E.; Hashemi, F.; Shabestari, M.H. A Framework for Sustainable Strategic Planning of Water Demand and Supply in Arid Regions. Sustain. Dev. 2017, 25, 254–266. [Google Scholar] [CrossRef]
- Kil, S.H.; Lee, D.K.; Kim, J.H.; Li, M.H.; Newman, G. Utilizing the Analytic Hierarchy Process to Establish Weighted Values for Evaluating the Stability of Slope Revegetation Based on Hydroseeding Applications in South Korea. Sustainability 2016, 8, 58. [Google Scholar] [CrossRef]
- Karahalios, H. The Application of the AHP-TOPSIS for Evaluating Ballast Water Treatment Systems by Ship Operators. Transp. Res. D Transp. Environ. 2017, 52, 172–184. [Google Scholar] [CrossRef]
- Karaman, A.S.; Akman, E. Taking-off Corporate Social Responsibility Programs: An AHP Application in Airline Industry. J. Air Transp. Manag. 2018, 68, 187–197. [Google Scholar] [CrossRef]
- Gómez Romero, J.A.; Soto Flores, R.; Garduño Román, S. Determinación de Las Ponderaciones de Los Criterios de Sustentabilidad Hidroeléctrica Mediante La Combinación de Los Métodos AHP y GP Extendida. Ingeniería 2019, 24, 116–142. [Google Scholar] [CrossRef]
- Zheng, Y.; Lan, S.; Chen, W.Y.; Chen, X.; Xu, X.; Chen, Y.; Dong, J. Visual Sensitivity versus Ecological Sensitivity: An Application of GIS in Urban Forest Park Planning. Urban Urban Green. 2019, 41, 139–149. [Google Scholar] [CrossRef]
- Le Pira, M.; Inturri, G.; Ignaccolo, M.; Pluchino, A. Modelling Consensus Building in Delphi Practices for Participated Transport Planning. Transp. Res. Procedia 2017, 25, 3725–3735. [Google Scholar] [CrossRef]
- Güner, S. Measuring the Quality of Public Transportation Systems and Ranking the Bus Transit Routes Using Multi-Criteria Decision Making Techniques. Case Stud. Transp. Policy 2018, 6, 214–224. [Google Scholar] [CrossRef]
- Yang, D.; Jiang, L.; Ng, A.K.Y. One Belt One Road, but Several Routes: A Case Study of New Emerging Trade Corridors Connecting the Far East to Europe. Transp. Res. Part A Policy Pract. 2018, 117, 190–204. [Google Scholar] [CrossRef]
- Nalmpantis, D.; Roukouni, A.; Genitsaris, E.; Stamelou, A.; Naniopoulos, A. Evaluation of Innovative Ideas for Public Transport Proposed by Citizens Using Multi-Criteria Decision Analysis (MCDA). Eur. Transp. Res. Rev. 2019, 11, 22. [Google Scholar] [CrossRef]
- Wolnowska, A.E.; Konicki, W. Multi-Criterial Analysis of Oversize Cargo Transport through the City, Using the AHP Method. Transp. Res. Procedia 2019, 39, 614–623. [Google Scholar] [CrossRef]
- Chin, K.S.; Yang, Q.; Chan, C.Y.P.; Tsui, K.L.; Li, Y. lai Identifying Passengers’ Needs in Cabin Interiors of High-Speed Rails in China Using Quality Function Deployment for Improving Passenger Satisfaction. Transp. Res. Part A Policy Pract. 2019, 119, 326–342. [Google Scholar] [CrossRef]
- Su, S.; Zhang, H.; Wang, M.; Weng, M.; Kang, M. Transit-Oriented Development (TOD) Typologies around Metro Station Areas in Urban China: A Comparative Analysis of Five Typical Megacities for Planning Implications. J. Transp. Geogr. 2021, 90, 102939. [Google Scholar] [CrossRef]
- Zuo, T.; Wei, H. Bikeway Prioritization to Increase Bicycle Network Connectivity and Bicycle-Transit Connection: A Multi-Criteria Decision Analysis Approach. Transp. Res. Part A Policy Pract. 2019, 129, 52–71. [Google Scholar] [CrossRef]
- Nikiforiadis, A.; Basbas, S.; Garyfalou, M.I. A Methodology for the Assessment of Pedestrians-Cyclists Shared Space Level of Service. J. Clean. Prod. 2020, 254, 120172. [Google Scholar] [CrossRef]
- Bakogiannis, E.; Vlastos, T.; Athanasopoulos, K.; Vassi, A.; Christodoulopoulou, G.; Karolemeas, C.; Tsigdinos, S.; Kyriakidis, C.; Noutsou, M.S.; Siti, M.; et al. Exploring Motivators and Deterrents of Cycling Tourism Using Qualitative Social Research Methods and Participative Analytical Hierarchy Process (AHP). Sustainability 2020, 12, 2418. [Google Scholar] [CrossRef]
- Pais, F.; Monteiro, J.; Sousa, N.; Coutinho-Rodrigues, J.; Natividade-Jesus, E. A Multicriteria Methodology for Maintenance Planning of Cycling Infrastructure. Proc. Inst. Civ. Eng. Eng. Sustain. 2022, 175, 248–264. [Google Scholar] [CrossRef]
- Monteiro, R.; Ferreira, J.C.; Antunes, P. Green Infrastructure Planning Principles: Identification of Priorities Using Analytic Hierarchy Process. Sustainability 2022, 14, 5170. [Google Scholar] [CrossRef]
Disclaimer/Publisher’s Note: The statements, opinions and data contained in all publications are solely those of the individual author(s) and contributor(s) and not of MDPI and/or the editor(s). MDPI and/or the editor(s) disclaim responsibility for any injury to people or property resulting from any ideas, methods, instructions or products referred to in the content. |
© 2025 by the authors. Published by MDPI on behalf of the International Institute of Knowledge Innovation and Invention. Licensee MDPI, Basel, Switzerland. This article is an open access article distributed under the terms and conditions of the Creative Commons Attribution (CC BY) license (https://creativecommons.org/licenses/by/4.0/).