Abstract
Aeolian deposits are globally recognized as sensitive recorders of Quaternary climate and environmental change, exemplified by the continuous loess sequences of the Chinese Loess Plateau in northern China, which document paleoclimatic and paleoenvironmental evolution since the Miocene. However, such deposits have rarely been confirmed in low-latitude inland regions of southern China. Here we present systematic evidence of aeolian deposition in a low-latitude environment, namely at the Xinlipoding (XLPD) Paleolithic site, situated between the Bose and Bubing Basins in Guangxi, southern China. Using optically stimulated luminescence (OSL), geochemical, and grain-size analyses, we investigate 100 cm thick yellow-brown sandy loam exposed on the hillside of the Bubing Basin. OSL dating constrains its accumulation between 25.3 ± 1.5 ka and 2.7 ± 0.1 ka, spanning the Last Glacial Maximum (LGM) to the late Holocene. Geochemical signatures indicate that the sediments were primarily derived from a nearby terrace in the Bose and Bubing Basins. Grain-size end-member modeling further reveals a mixed alluvial-aeolian origin, comprising both windblown and reworked loess. These findings demonstrate that aeolian dust deposition persisted even in the humid subtropical low-latitude regions of China, recording continuous dust input across glacial–interglacial cycles. The XLPD section thus provides a valuable framework for reconstructing late quaternary environmental change and extends the spatial reach of global aeolian deposition into previously underrecognized regions. Importantly, it also offers a crucial paleoenvironmental context for human occupation in the Bubing Basin from the LGM through the late Holocene.
1. Introduction
Aeolian deposits are key archives of past environmental and climatic change and have been extensively investigated across diverse geomorphological and climatic contexts. In China, typical aeolian deposits are widely distributed in northern regions, particularly on the Chinese Loess Plateau (CLP) (Figure 1A) (e.g., [,,,,]). More recently, deposits with possible aeolian origins have also been identified in subtropical humid monsoon regions of southern China (Figure 1A) [,,], such as the lower Yangtze River [,,] and the Chengdu Basin [], though the debate of their genesis lasted for a long time [,,]. To date, however, no aeolian deposits have been confirmed in the low-latitude inland areas of subtropical southern China, despite growing evidence that the production, transport, and deposition of aeolian sediments can occur under a wide range of geomorphological and climatic conditions [,]. Addressing this gap is therefore critical for refining our understanding of dust dynamics and environmental change in subtropical East Asia.
The Bubing Basin (Figure 1B), located in the subtropical regions on the southwestern side of the Nanling Mountains, is a small basin containing multiple terraces and numerous caves with abundant Quaternary sediments. The yellow-brown sandy loam soil deposits are widely distributed on limestone hill platforms near the watershed between the Bubing and Bose Basins, and previous research has suggested a possible aeolian origin for these sediments [,]. At Xinlipoding (XLPD), a northwestern hill within the Bubing Basin, these deposits contain well-preserved stone artifacts, yet their genesis has not been systematically investigated.
In this study, we conduct grain-size analysis, geochemical analysis, and Optically Stimulated Luminescence (OSL) dating of the XLPD deposits. This work provides the first comprehensive evidence to evaluate their aeolian origin and establishes a new stratigraphic framework for reconstructing the paleoenvironmental context of hominin occupation in the Bubing Basin.
2. Geological Setting and Sampling
2.1. Geological Setting
The Bubing Basin (106°54′01″ E~107°0′21″ E, 23°34′38″ N~23°39′29″ N) (Figure 1B) is located in the western Guangxi Zhuang Autonomous Region, South China, adjacent to the much larger Bose Basin on its southeastern side. The basin extends northwest–southeast for approximately 15 km and is about 1 km wide []. It is bounded by karstic limestone highlands composed of Triassic tuff, dolomitic limestone, and dolomite (Figure 1B). The southwestern margin consists of Late Paleozoic limestone, while the northeastern margin is defined by a Paleogene sandstone horst with minor Paleozoic limestone, separating the Bubing Basin from the Bose Basin [].
Both the Bose and Bubing Basins lie in the transition zone between the Yunnan-Guizhou Plateau (Figure 1A) to the east and the Nanling Hills to the west. They are surrounded by low mountains composed mainly of Triassic sandstone, shale, and mudstone, with elevations ranging from 500 to 1500 m above sea level (m asl) []. Since the Miocene, this region has undergone intermittent uplift associated with the expansion of the Qinghai–Tibetan Plateau, resulting in significant crustal extrusion, tectonic stretching, intense weathering, and landscape denudation [,]. These multi-stage tectonic uplifts, combined with erosion, shaped the meandering stream systems of the Bose–Bubing Basins and influenced the development of five distinct river terraces, whose deposits range in age from the Pleistocene to the Holocene [,,,].
Both the Bose and Bubing Basins, collectively referred to as the Bose–Bubing Basin, are situated in a subtropical monsoonal climate zone. The climate is characterized as warm and humid, influenced by the East Asian summer monsoon (EASM), the East Asian winter monsoon (EAWM), and the Indian Summer monsoon (ISM) (Figure 1A). Most of the annual precipitation, with monthly totals over 100 mm, occurs during the wet seasons from May to September, while the annual average temperature is 22.4 °C, with monthly temperatures above 20 °C from May to August. The region experiences distinct dry and wet seasons, with monthly precipitation less than 100 mm and temperatures below 10 °C during the dry seasons [].

Figure 1.
Geographic setting and location of the XLPD site. (A) Distribution of deserts, sandy land, loess, and red earth in China, adapted from Lu et al. []. Abbreviations: CLP—Chinese Loess Plateau; CDB—Chengdu Basin; LYR—Lower Yangtze River; YGP—Yunnan–Guizhou Plateau; QTP—Qinghai-Tibetan Plateau; NH—Nanling Hills. (B) Detailed geological map of the Bose-Bubing Basin. The XLPD section (23°39′04.29″ N, 106°56′44.14″ E, 173 m asl) (B) is situated within the karstic landscape of the northwestern Bubing Basin. This section is part of a test pit, which measures 10 m in length, 5 m in width, and 2 m in depth, that is part of the XLPD Paleolithic archeological site (Figure 2A).

Figure 2.
(A) Overview of the excavation pit, measuring 10 m in length, 5 m in width, and 2 m in depth; (B) The lithology and quartz OSL samples for the XLPD section.
2.2. Sampling
In 2019, we conducted a systematic excavation of the well-preserved stone artifacts in the XLPD site. A total of four test pits and one trench were excavated. The XLPD section in this study is located at the northern side of test pit C (Figure 2A) (XLPD). Sediments from the XLPD section were collected to analyze variations in grain-size distribution over an extended temporal period. A total of thirty samples were obtained for grain-size analyses at 5 cm intervals. Additionally, twelve samples were collected for geochemical analyses. For each sample, approximately 500 g of clastic sediments was gathered. Furthermore, twelve OSL samples were collected from the profile at 10 cm intervals (Figure 2B).
3. Materials and Methods
3.1. Optically Stimulated Luminescence (OSL) Dating
All analyses were conducted in the luminescence dating laboratory, Shantou University. The laboratory procedures for sample preparation and measurement adhered to established luminescence dating protocols [,] and were conducted under subdued red light []. Twelve samples were first decarbonated using 10% hydrochloric acid (HCl), followed by wet sieving to isolate 90–125 µm coarse-grained fractions. These fractions were treated with 30% hydrogen peroxide (H2O2) to remove organic materials and were further sieved to obtain the desired 90–125 μm grain size for extraction. To purify quartz for OSL dating, the 90–125 μm polymineral fractions underwent 40 min of etching with 40% hydrofluoric acid (HF) to remove feldspar grains and the superficial alpha-irradiated layer (~10 μm) of quartz grains to avoid age underestimation []. A final wash with 10% HCl for 30 min was performed to eliminate fluoride precipitation. The purity of quartz fractions was verified using infrared stimulated luminescence (IRSL) signals.
Quartz fractions within the 90–125 µm range were mounted on stainless-steel disks (9.7 mm) using silicone oil, focusing on the central 6 mm for equivalent dose (De) measurements. These measurements, including irradiation, preheating, and OSL, were conducted using a Risø TL/OSL-DA-20 reader, Roskilde, Denmark [] equipped with a 90Sr/90Y beta source delivering a dose rate of 0.0992 Gy/s. Blue-light LED stimulation (470 ± 20 nm) was used for quartz OSL measurements, while IR laser diode stimulation (850 ± 30 nm) assessed feldspar contamination. Stimulation was performed at 130 °C for 40 s, with the response captured by an Electron Tube (ET) PDM 9107-CP-TTL photomultiplier tube (PMT), Roskilde, Denmark fitted with a 7.5 mm thick Hoya U-340 detection, Roskilde, Denmark.
The De values were determined using a combination of the single aliquot regenerative dose (SAR) protocol [] and the standard growth curve (SGC) method [,,], known as the SAR-SGC method []. For each sample, 4–6 aliquots were analyzed using the SAR method to obtain SAR Des, while 10–21 natural aliquots were also measured to determine their LN/TN values. The final De for each sample was calculated as the average of all SAR Des and SGC Des.
Uranium (U) and thorium (Th) concentrations were measured using inductively coupled plasma mass spectrometry (ICP-MS), and potassium (K) levels were determined via inductively coupled plasma/optical emission spectrometry (ICP/OES). The cosmic ray dose was calculated considering the sample’s depth, altitude, and geomagnetic latitude []. Variations in sediment water content over time can significantly affect dose rate estimates, with rather large uncertainties arising from the poorly constrained moisture history of burial environments [,]. Because the measured water content does not reliably represent past conditions, a fixed value of 25% ± 5% was adopted for all OSL samples, reflecting the estimated range of water content variation in the study area during the burial period. The dose rates and final ages were computed using the “DRAC” program [].
3.2. Grain-Size Analysis
All grain-size analyses were conducted in the joint international research laboratory of environmental and social archeology, Shandong University. For particle size analysis, approximately 1 g of dry samples was weighed and placed into 50 mL centrifuge tubes. Prior to analysis, all samples underwent pretreatment to remove organic matter and carbonate by adding 15 mL of 30% H2O2 and 15 mL of 10% HCl, respectively. To ensure particle dispersion, 10 mL of 5% (NaPO3)6 was added, followed by ultrasonic treatment. Particle size distribution was then analyzed using a Laser Diffraction Particle Size Analyzer (Beckman Coulter LS 13 320 with additional PIDS technology), which measures a size range of 0.01–3500 μm.
The initial analysis focused on grain-size parameters, including mean grain size (MG), sorting (σG), skewness (SkG), and kurtosis (KG), which are established based on the seminal work of Folk and Ward [] and the modal grain size. Mean grain size was categorized into clay (<4 μm), silt (4–63 μm), and sand (63–2000 μm), as defined by Udden [] and Wentworth []. Additionally, a novel algorithm proposed by Paterson and Heslop [] was employed to conduct parametric End-Member Modeling Analysis (EMMA) for the extraction of end-members (EMs).
3.3. Major and Trace Element Geochemistry
Twelve samples were finely ground using an agate mortar and then passed through a 200-mesh sieve. Both major and trace element analyses were conducted at Guizhou Tongwei Analytical Technology Co., Ltd. in 2024. The major element analysis of XLPD samples was conducted through three primary processes: Loss on Ignition (LOI), fused pellet preparation, and determination of major element content via X-ray fluorescence (XRF) spectrometry. The powdered bulk samples were initially dried at 105 °C, and the LOI was calculated as the mass difference between aliquots heated from 105 °C to 1050 °C. For XRF analysis, fused pellets were produced from the powdered samples, with major element concentrations measured using a Thermo Fisher ARL Perform’X 4200 XRF spectrometer. This instrument operated with a rhodium-target X-ray tube, end-window type, and a 50 μm ultra-thin Be window, under a high-frequency solid-state generator with a maximum voltage of 60 kV and current of 140 mA, achieving an analytical uncertainty of less than 5%.
Trace element concentrations in XLPD section samples were determined using a Thermo Fisher ICAP-MS X2, equipped with a Cetac ASX-520 AutoSampler, ensuring an analytical precision of better than 5%. Approximately 50 mg of each sediment was dissolved in Teflon vessels using a concentrated HF-HNO3 (4:1) mixture, then heated at 185 °C for three days. After HF evaporation, the residues were re-dissolved in HNO3, dried, and finally dissolved in a 2N HNO3 solution. The final sample solutions were diluted to 4000 times with 2% HNO3 and spiked with 6 ppb Rh, In, Re, and Bi as internal standards. The USGS reference standard W-2a was employed, cross-verified with BHVO-2 and other materials. Internal spikes and external monitors were used to correct for instrument drift, following the modified procedures of Eggins et al. [] and Kamber et al. [] for ICP-MS analysis.
4. Results
4.1. Field Description of Terraces in the Bose–Bubing Basins and the Section XLPD
The Bose–Bubing Basin contains five distinct river terraces at varying altitudes ranging from 107 m to 170 m asl [].
In the Bubing Basin, Terrace 1 (T1) occurs along the Tingnao and Xiangshui riverbanks at ~114 m asl, roughly 2 m above the modern river level, and is composed of yellowish-brown sandy clay, represented by the BBT1 (Bubing Terrace 1) site. Terrace 2 (T2), located in the northwest and central parts of the basin at ~119 m asl (~7 m above the river), shows light reddish-brown sandy clay at the top (BBT2). Terrace 3 (T3) rises to ~125 m asl, forming broad platforms ~13 m above the river, with light yellowish-brown sandy clay (BBT3). Terrace 4 (T4), confined to the northern Bubing Basin, occurs at ~162 m asl (~50 m above the river) and shows an upper 7–10 m silt and red-earth layer overlying reticular mottled red clay characteristic of laterites, underlain by 5–20 m of well-sorted cobble conglomerate (BBT4). Terrace 5 (T5) exposes at the XLPD site at ~170 m asl (~58 m above the river) scattered surface gravel while most fine sediments were removed from the upper layer.
In the adjacent Bose Basin, a similar system of river terraces is distributed along both sides of the Youjiang River. Terraces near the XLPD site are T1 at 107 m asl, T2 at 114 m asl, T3 at 133 m asl, T4 at 155 m asl, and T5 at approximately 170 m asl. Although earlier studies identified up to seven terrace levels in the basin [], our field observations reveal that only the lower terraces (T1–T4) preserve the characteristic dual structure of channel and floodplain facies. In contrast, the higher terraces (T5–T7) are show solely residual gravel layers. Representative sites of Bose Terrace 4 (BST4) include Bose Xiaomei (BSXM) and Gaolingpo (GLP). Despite substantial erosion of the overlying floodplain deposits, T4 remains are well preserved over an area exceeding 5 km2 [].
The XLPD Paleolithic archeological site is located on a limestone hill platform near the watershed dividing the Bubing and Bose Basins, adjacent to the BBT4. The section analyzed in this study was excavated from the northern wall of test pit C and reveals four lithologically distinct stratigraphic units (Figure 2B) from top to bottom:
Layer 1 (0–20 cm): gray-brown clayey silts with plant roots;
Layer 2 (20–120 cm): yellow-brown fine silts with concentrated artifacts;
Layer 3 (120–170 cm): reddish-brown sandy silt with very fine gravel and coarse sand (<4 mm); Layer 4 (>170 cm): weathered bedrock, overlying Triassic sandstone with a sharp unconformity.
4.2. Chronology of the XLPD Section
The OSL dating results for the XLPD section are summarized in Table 1. Quartz OSL signals for representative samples XLPD-G04 and XLPD-G09 are shown in Figure 3A,B. The OSL signals exhibit a rapid decline to background levels within the first second, suggesting the dominance of fast components, which are considered the most reliable for OSL dating. The Des values are normally distributed (Figure 3C,D), with low overdispersion values (~7–18%) across the samples (Table 1). These results establish a comprehensive chronological framework for the XLPD section (Figure 4A,B), extending back to approximately 41 ka. Specifically, the ages for Layer 2 range from 2.73 ± 0.14 ka to 25.29 ± 1.52 ka, while those for Layer 3 span from 25.29 ± 1.52 ka to 40.90 ± 1.92 ka. The stratigraphy and numerical ages of the yellow-brown sandy loam soil deposit layer suggest that aggradation occurred intermittently from the Last Glacial Maximum (LGM) to the late Holocene.

Figure 3.
Luminescence characteristics and abanico plots of De distribution for samples XLPD-G04 and XLPD-G09. (A,B) Main plots display the OSL decay curves for regeneration, natural, test, and zero doses, while the inset plots present the averaged dose–response curves of SAR aliquots, fitted using a saturating exponential plus linear function. The insets also show the dose–response curves (black lines) for each single-aliquot regenerative-dose aliquot, alongside their corresponding standard growth curve (red line). Red hollow cycles represent the regenerative doses; (C,D) Abanico plots illustrating the De distribution.

Table 1.
OSL dating results of the XLPD section.
Table 1.
OSL dating results of the XLPD section.
| Sample ID | Depth (m) | Aliquot Numbers | Dose Rate (Gy/ka) | Moisture (%) | U (ppm) | Th (ppm) | K (%) | Overdispersion (%) | De (Gy) | Age (ka) |
|---|---|---|---|---|---|---|---|---|---|---|
| XLPD-G01 | 0.18 | 6 a + 12 b | 1.77 ± 0.07 | 25 ± 5 | 2.51 ± 0.13 | 11.20 ± 0.56 | 0.61 ± 0.06 | 13 ± 3 | 4.83 ± 0.16 | 2.73 ± 0.14 |
| XLPD-G02 | 0.32 | 4 a + 10 b | 1.97 ± 0.08 | 25 ± 5 | 2.79 ± 0.14 | 12.50 ± 0.63 | 0.73 ± 0.07 | 13 ± 3 | 9.04 ± 0.33 | 4.60 ± 0.25 |
| XLPD-G03 | 0.42 | 4 a + 12 b | 2.01 ± 0.09 | 25 ± 5 | 2.78 ± 0.14 | 12.40 ± 0.62 | 0.81 ± 0.08 | 11 ± 2 | 11.46 ± 0.35 | 5.70 ± 0.30 |
| XLPD-G04 | 0.52 | 4 a + 10 b | 2.08 ± 0.09 | 25 ± 5 | 2.90 ± 0.15 | 12.50 ± 0.63 | 0.87 ± 0.09 | 10 ± 2 | 18.85 ± 0.52 | 9.08 ± 0.47 |
| XLPD-G05 | 0.60 | 4 a + 12 b | 2.08 ± 0.09 | 25 ± 5 | 2.85 ± 0.14 | 12.90 ± 0.65 | 0.86 ± 0.09 | 14 ± 3 | 18.64 ± 0.74 | 8.98 ± 0.53 |
| XLPD-G06 | 0.73 | 4 a + 10 b | 2.22 ± 0.10 | 25 ± 5 | 3.00 ± 0.15 | 14.00 ± 0.70 | 0.95 ± 0.10 | 13 ± 3 | 27.73 ± 0.98 | 12.47 ± 0.71 |
| XLPD-G07 | 0.83 | 4 a + 10 b | 2.22 ± 0.10 | 25 ± 5 | 3.05 ± 0.15 | 13.60 ± 0.68 | 0.97 ± 0.10 | 7 ± 2 | 34.13 ± 0.77 | 15.36 ± 0.77 |
| XLPD-G08 | 0.96 | 4 a + 11 b | 2.24 ± 0.10 | 25 ± 5 | 2.99 ± 0.15 | 13.80 ± 0.69 | 1.00 ± 0.10 | 18 ± 4 | 32.14 ± 1.55 | 14.33 ± 0.94 |
| XLPD-G09 | 1.10 | 4 a + 9 b | 2.19 ± 0.10 | 25 ± 5 | 2.88 ± 0.14 | 13.00 ± 0.65 | 1.02 ± 0.10 | 12 ± 3 | 43.85 ± 1.70 | 20.01 ± 1.19 |
| XLPD-G10 | 1.20 | 4 a + 9 b | 1.80 ± 0.08 | 25 ± 5 | 2.75 ± 0.14 | 10.90 ± 0.55 | 0.70 ± 0.07 | 15 ± 3 | 45.61 ± 1.94 | 25.29 ± 1.52 |
| XLPD-G11 | 1.35 | 4 a + 9 b | 1.91 ± 0.08 | 25 ± 5 | 2.70 ± 0.14 | 11.30 ± 0.57 | 0.83 ± 0.08 | 13 ± 3 | 78.29 ± 1.35 | 40.90 ± 1.92 |
| XLPD-G12 | 1.50 | 8 a + 21 b | 2.17 ± 0.10 | 25 ± 5 | 3.00 ± 0.15 | 13.20 ± 0.66 | 0.96 ± 0.10 | 16 ± 2 | 71.19 ± 2.23 | 32.82 ± 1.80 |
The superscript “a” indicates aliquot numbers for the SAR protocol and “b” indicates aliquot numbers for SGC protocol.

Figure 4.
(A) The lithology and quartz OSL ages for the XLPD section; (B) OSL ages plotted against depth, with Bayesian age-depth models generated using the Bacon software []. The red lines represent the best-fit age-depth models, and the red-shaded regions indicate the 95% confidence interval. The calculated average accumulation rates are also shown.
4.3. Grain-Size Results
The grain-size distribution curves and corresponding parameters from the XLPD section are presented in Figure 5 and Supplementary Table S1. Overall, the samples exhibit mean grain sizes ranging from 4 to 57 μm, corresponding to fine to very coarse silt, and are characterized by very poor sorting. The distributions are polymodal, with modes <10 μm and >100 μm.
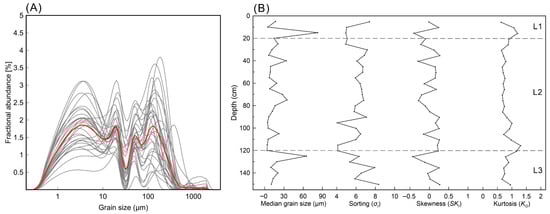
Figure 5.
(A) Grain-size distribution curves of all samples, with the red curve representing the overall average, individual sample measurements are depicted by the black curves; (B) Parameter curves showing mean grain size, sorting, skewness, and kurtosis. The number of end-members was determined using linear correlation (R2 = 0.9757), angular deviations (θ = 6.7433), and endmember correlations (EM R2 = 0.0554), resulting in the identification of five EMs through the parametric General Weibull fit. The five-component model illustrates the vertical distribution of EM abundances (Figure 6B), with individual modal grain sizes of 3, 20, 50, 116, and 223 μm, respectively (Figure 6A). EM1 (2–5 μm) is a clay–very fine silt; EM2 (11–26 μm) a medium–coarse silt; EM3 (31–66 μm) a very coarse silt–very fine sand; EM4 (66–168 μm) to very fine–fine sand; and EM5 (153–324 μm) a fine–medium sand. EM1 is characterized by a broad, low peak, while EM2–EM5 display steep, high-peaked curves.
Across the entire profile, the average proportions of EM1–EM5 are 55%, 10%, 7%, 18%, and 11%, respectively, with EM1 clearly dominant (Figure 6B). In Layers 3 (120–170 cm) and 1 (0–20 cm), coarse fractions (EM4 and EM5) alternate with finer components (EM1–EM3). EM5 is dominant at the bottom of the section but declines sharply higher up to negligible levels at the Layer 3/2 and Layer 1/2 boundaries. By contrast, Layer 2 exhibits more consistent trends throughout its depth, with EM1 remaining the prevailing component.

Figure 6.
The end-member modeling results for the five end-member models. (A) Modeled end-members with a modal grain size of 3 μm (EM 1), 20 μm (EM 2), 50 μm (EM 3), 116 μm (EM 4), and 223 μm (EM 5). (B) Percentage of the end-members plotted next to the lithostratigraphic column.
4.4. Geochemistry Results
4.4.1. Major Element Geochemistry
The major element compositions of the XLPD section are summarized in Supplementary Table S2, with SiO2 (67% average), Al2O3 (16% average), Fe2O3 (6.8% average), K2O (1.4% average), and TiO2 (1% average) as the dominant constituents (Figure 7). For comparison, the major element compositions from terraces in the Bubing Basin are presented []. UCC (Upper Continental Crust)-normalized abundances reveal that XLPDC and BBT4 samples exhibit similar compositions, in contrast to BBT1, BBT2, and BBT3 (Figure 8).
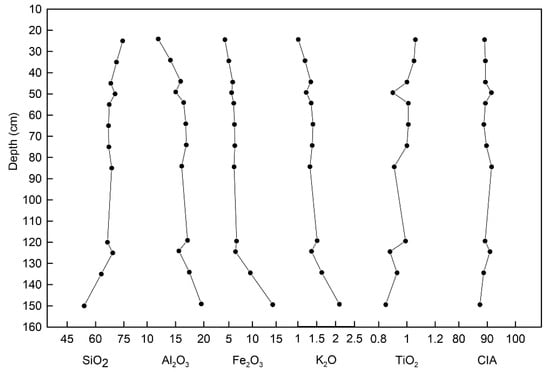
Figure 7.
Percentage variations in major elements (SiO2, Al2O3, Fe2O3, K2O, TiO2), and CIA variations for the upper 150 cm of the XLPD section.
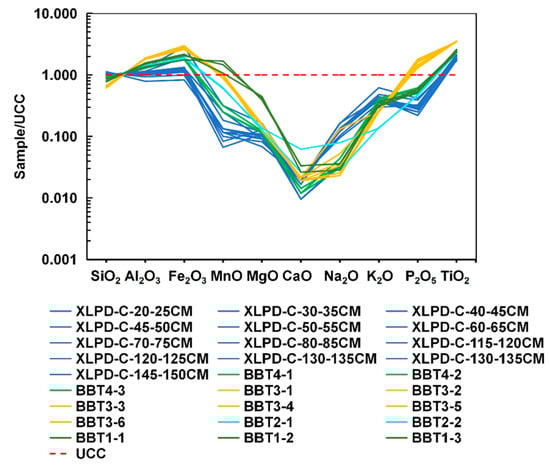
Figure 8.
UCC-normalized spidergrams for the samples. UCC values are sourced from Taylor and McLennan []. Data for XLPDC is from this study, while data for BBT1, BBT2, BBT3, and BBT4 are from Liao et al. [].
The TiO2/Al2O3 ratio, a key indicator of sediment provenance due to the variability of Ti content across rock types [,], is low for the XLPDC samples, resembling values from BBT4 and BST4, indicating a common source. The K2O/Al2O3 ratio, typically used to assess chemical maturity and original sediment composition [], is higher in XLPDC, BBT4, and BST4 compared to those from BBT1 to BBT3, reflecting greater chemical weathering at these sites (Figure 9).
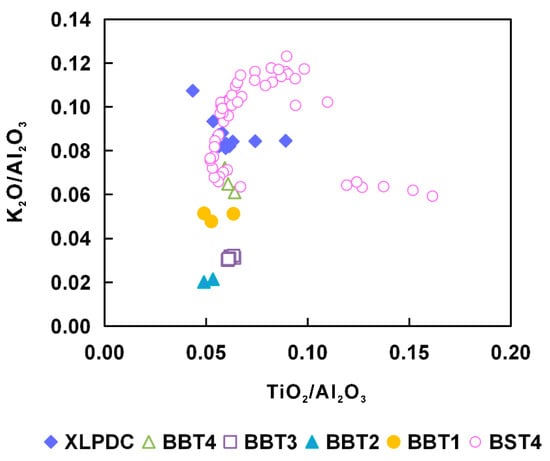
Figure 9.
Plot of K2O/Al2O3 versus TiO2/Al2O3 for samples. Data for BST4 are from Shen et al. []. Data sources for other samples are consistent with those in Figure 8.
The strength of chemical weathering in clastic sediments is quantified by the CIA, calculated as CIA = Al2O3/(Al2O3 + Na2O + K2O + CaO *) × 100% (molar proportions, and CaO * refers to the Ca in silicates) []. The CIA values across the XLPDC (89.48 ± 2.05), BBT4 (92.97 ± 0.53), BBT3 (95.74 ± 0.66), BBT2 (96.03 ± 0.58), BBT1 (92.49 ± 0.28), and BST4 (91 ± 2.5) are uniformly high, indicating that these deposits experienced intensive chemical weathering.
4.4.2. Trace Element Geochemistry
The trace element compositions, including Rare Earth Elements (REEs), for the XLPD section are provided in Supplementary Table S3. The chondrite-normalized REE distribution patterns for samples from the Bose–Bubing Basin (Figure 10) exhibit steep slopes for light REEs (LREE), relatively flat heavy-REE (HREE) patterns, and consistent negative Eu anomalies. Within the XLPDC, the samples exhibit relatively uniform chondrite-normalized REE patterns, resembling those of UCC [], as well as BBT4. Trace element analysis reveals that the chondrite-normalized REE distribution patterns for the XLPDC (Figure 10) are consistent throughout, closely resembling those of BBT4, indicating a shared provenance among these profiles. The La–Th–Sc diagram, widely recognized for its effectiveness in identifying sediment provenance, shows that these elements are relatively stable during weathering, transport, and sedimentation [,,], and the ternary diagrams of La-Th-Sc and Zr/10-Th-Sc have successfully distinguished the provenance of aeolian deposits []. Differences in sediment composition between XLPDC and other sites in the Bose–Bubing Basin are evident in these diagrams (Figure 11), with XLPDC samples closely resembling those from BBT4 and BST4.
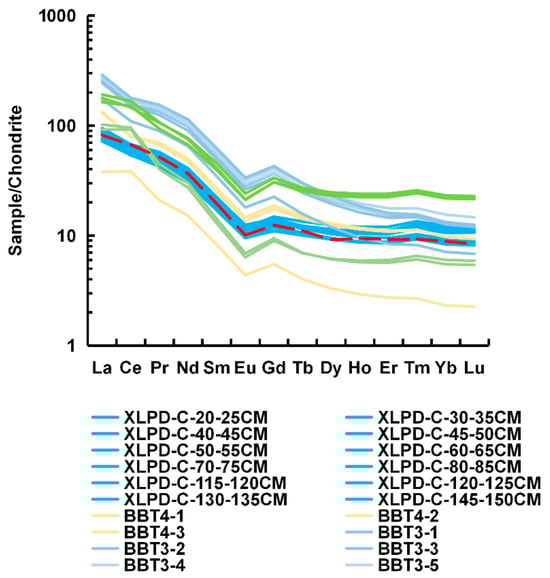
Figure 10.
Chondrite-normalized REE distribution patterns. Data sources correspond to those presented in Figure 8. The red dotted line denotes the UCC reference value.
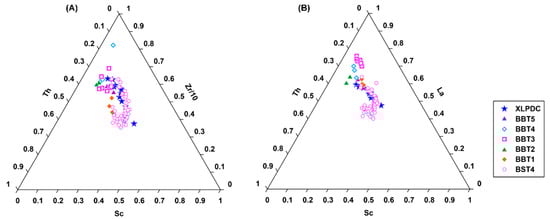
Figure 11.
Ternary plots of Zr/10-Th-Sc (A) and La-Th-Sc (B). Data sources for different samples are the same as in Figure 8.
5. Discussion
5.1. Geochemical Evidence for Provenance of XLPD Sediments
Geochemical evidence for the provenance of various sediments from different sites in the Bose–Bubing Basin indicates that the XLPD samples closely resemble those from BBT4 and BST4. This compositional similarity suggests that the deposits overlying the weathered bedrock at XLPD were primarily derived from T4 in the Bose–Bubing Basin, reflecting proximal sources within 1–25 km. T4 is composed of silt and red earth underlain by reticular mottled red clay, characteristic of laterites, which is extensively exposed on both sides of the Youjiang River in Bose–Bubing Basin [,,]. Moreover, the vermiculated red soil at T4 has consistently remained infertile, where field observations classify these deposits in the T4 region as badland (a type of dry terrain where sediments have been extensively eroded by surface drainage) [] (Figure 12), with a lack of vegetation even today in the Holocene. This situation would have persisted during warm periods and was even more pronounced during glacial periods, providing a continuous source of material for dust accumulation. Consequently, T4 would have served as an adequate source region for sediments transported over short distances to the northwestern hills of the Bubing Basin from the Last Glacial Maximum to the late Holocene.
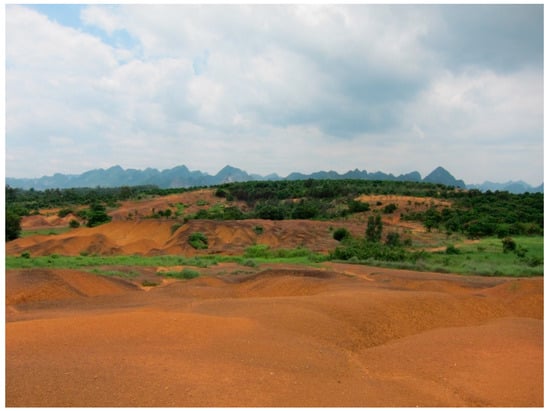
Figure 12.
Geomorphological landscape of T4.
5.2. Evidence for Sedimentary Characteristics Provided by End-Member Modeling
Geochemical evidence indicates that the XLPD sediments were sourced proximally from the lower-elevation T4 deposits, raising a key question regarding their transport mechanism: Were these sediments relocated by fluvial processes or by aeolian activity? The topographic profile of the Bose–Bubing Basin (Figure 13) shows that T4 is situated at ~155 m, whereas the XLPD deposits occur at ~173 m, approximately 18 m higher, effectively precluding uphill fluvial transport. Instead, the silt-dominated grain-size characteristics and the draping of deposits over convex slopes strongly support an aeolian origin for the XLPD sediments.
The mean grain size of the XLPD sediments indicates that they represent atypical aeolian deposits compared with more conventional examples. Unlike the characteristic distributions of Chinese Loess Plateau loess and the clay-dominated sediments of the Chengdu Basin, both the lower Yangtze River dust and the proximal aeolian deposits from the Bubing Basin exhibit polymodal distributions. Multimodal grain-size distribution patterns often result from mixing during deposition [,]. As noted by Vandenberghe [], post-depositional reworking frequently leads to particle sorting and potential mixing with other sedimentary material.

Figure 13.
(A,B) NW-SE topographic profile across the Bose–Bubing Basin. (C) Three-dimensional satellite maps of the study region, with the yellow star indicating the location of the XLPD site, the green rhombuses mark the locations of the T4 sites within the basins.
Based on the end-member analysis of the XLPD samples, three distinct grain-size populations can be identified according to their modal values: (1) the finest fraction, represented by EM1 with a mode of 3 μm; (2) the silt fraction, represented by EM2 and EM3 with modes of 20 μm and 50 μm, respectively; and (3) the coarsest fraction, represented by EM4 and EM5 with modes of 116 μm and 223 μm.
The finest fraction (EM 1, mode 3 μm) (Figure 6B) corresponds closely to the finest loess subgroup 1.c.2 (2–10 μm) described by Vandenberghe [] and may originate from two potential sources. The first is in situ chemical weathering, consistent with the XLPD site’s location in a subtropical monsoon climate zone. Previous studies have shown that intense weathering in subtropical southern China increases the fine fraction within aeolian deposits, contributing to the multimodal grain-size distributions typical of these sediments [,]. At XLPD, the presence of weathered bedrock at the base of the profile and the hillside location of the site support a local weathering contribution. However, a second potential origin, such as allochthonous aeolian origin, cannot be excluded. Fine particles in the 2–10 μm range may be interpreted as background dust deposited via continuous aeolian processes, capable of transport in high suspension clouds over distances of 1000–2000 km [,] as confirmed by recent distal dust deposition in Guangxi [].
The silt fraction (EM 2 and EM 3, modes 20 and 50 μm) (Figure 6B) corresponds to loess type 1.b (25–65 μm) described by Vandenberghe []. This fraction typically represents loess deposited from near-surface to low-level suspension clouds, with transport distances over broadly tens of kilometers [,]. Furthermore, Vandenberghe et al. [] noted that silt with a modal size of ~30 μm may also be fluvially reworked rather than representing primary aeolian deposition as, for instance, in the Hanzhong Basin. The combined geochemical and grain-size evidence indicates that silts from Fengshudao (T4, ~43 km northwest of XLPD) in the Bose–Bubing Basin contributed significantly to this component, serving as a proximal source for the XLPD deposits [], thus supporting a fluvial reworked origin for this silt fraction at XLPD. It confirms that fluvial reworking of primary aeolian loess does not substantially change the original modal size [].
The coarsest fraction (EM 4 and EM 5, 116–223 μm) (Figure 6B) corresponds to the aeolian sand component (90–250 μm) described by Dietze, Maussion, Ahlborn, Diekmann, Hartmann, Henkel, Kasper, Lockot, Opitz and Haberzettl [] likely transported locally in near-surface, short-term suspension clouds via rolling and saltation under strong surface winds (facies 2.a of Vandenberghe []. Alternatively, these sediments may have been mobilized from proximal sources through surface runoff or water flow and considered as fluvio-aeolian [,,]. In fluvial settings, high-energy flow can erode adjacent or underlying basin-margin deposits, incorporating coarser silt and sand into the aeolian matrix []. An interlink between fluvial and eolian depositional environments has also been described along the Yellow River by Wang et al. []. Given the elevated position of the XLPD site, sheet flow likely dominated the transport of these fluvio-aeolian sediments.
6. Conclusions
This study integrates grain-size and geochemical analyses with OSL dating of the XLPD section in the Bubing Basin to investigate the characteristics and origin of the yellow-brown sandy loam deposits at the XLPD Paleolithic site. Geochemical comparisons with sediments from multiple sites within the Bose–Bubing Basin indicate that the XLPD samples closely resemble those from T4, suggesting that the sediments were derived from proximal sources and transported over short distances to the northwestern hills of the Bubing Basin from the Last Glacial Maximum (LGM) through the late Holocene.
End-member modeling of the grain-size dataset identifies five components: EM 1, the dominant fraction, represents background dust transported via aeolian processes, probably affected by pedogenesis; EM 2 and EM 3 correspond to typical windblown loess deposited from low suspension clouds, possibly fluvially reworked; EM 4 and EM 5 reflect locally saltated eolian action or fluvio-aeolian reworking by sheet flow. Collectively, these results indicate that the XLPD deposits are dominantly alluvial-aeolian in nature, comprising a mixture of primary windblown loess and (secondary) reworked loess.
Overall, the findings confirm that the yellow-brown sandy loam deposits at XLPD are primarily aeolian in origin, although possibly and/or partially reworked later on, from the LGM to the late Holocene. These sediments constitute an important stratigraphic archive for reconstructing late Quaternary terrestrial environmental changes in the region. Furthermore, they provide an essential paleoenvironmental context for understanding human occupation in the Bubing Basin during this period.
Supplementary Materials
The following supporting information can be downloaded at: https://www.mdpi.com/article/10.3390/quat8040070/s1. Table S1: Grain-size parameter of samples from the XLPD profile; Table S2: Major element compositions of XLPD profile (wt%); Table S3: Trace elements compositions of XLPD profile (µg/g).
Author Contributions
J.Z.: Investigation, data curation, visualization, writing—original draft. P.L.: Investigation, data curation, visualization. W.L.: Investigation, methodology, data curation. Z.L.: Investigation, methodology, writing—reviewing and editing. C.J.B.: Investigation, writing—reviewing and editing. W.W.: Conceptualization, methodology, funding acquisition, investigation, supervision, writing—reviewing and editing. J.V.: Discussion of results, writing—reviewing and editing. All authors have read and agreed to the published version of the manuscript.
Funding
This work has been supported by the Major Program of the National Social Science Foundation of China (20&ZD246), the National Natural Science Foundation of China (42472007), and the Taishan Scholars Project Special Funding.
Data Availability Statement
All data and code required to reproduce the findings of this study are contained within the article and its Supplementary Materials.
Conflicts of Interest
The authors declare no conflicts of interest.
References
- Li, Y.; He, S.; Peng, J.; Xu, Q.; Aydin, A.; Xu, Y. Loess geology and surface processes: An introductory note. J. Asian Earth Sci. 2020, 200, 104477. [Google Scholar] [CrossRef]
- Liu, T. Loess and Environment; Beijing Science Press: Beijing, China, 1985. [Google Scholar]
- Prins, M.A.; Vriend, M. Glacial and interglacial eolian dust dispersal patterns across the Chinese Loess Plateau inferred from decomposed loess grain-size records. Geochem. Geophys. Geosyst. 2007, 8, 1–17. [Google Scholar] [CrossRef]
- Stevens, T.; Palk, C.; Carter, A.; Lu, H.; Clift, P.D. Assessing the provenance of loess and desert sediments in northern China using U-Pb dating and morphology of detrital zircons. GSA Bull. 2010, 122, 1331–1344. [Google Scholar] [CrossRef]
- Qin, X.; Cai, B.; Liu, T. Loess record of the aerodynamic environment in the east Asia monsoon area since 60,000 years before present. J. Geophys. Res. Solid Earth 2005, 110, 1–16. [Google Scholar] [CrossRef]
- Wang, Y.; Yang, S.; Ding, Z. Provenance and paleoclimatic implications of loess deposits in Shandong Province, eastern China. Quat. Res. 2021, 103, 88–98. [Google Scholar] [CrossRef]
- Zhang, W.; Dong, C.; Ye, L.; Ma, H.; Yu, L. Magnetic properties of coastal loess on the Midao islands, northern China: Implications for provenance and weathering intensity. Palaeogeogr. Palaeoclimatol. Palaeoecol. 2012, 333–334, 160–167. [Google Scholar] [CrossRef]
- Lü, T.; Sun, J.; Feathers, J.K.; Sun, D.; Cui, C.; Shen, X. OSL dating of coastal sand dunes in southeastern China provides new insights into the relationship between aeolian activity and eustatic sea-level fluctuations. Palaeogeogr. Palaeoclimatol. Palaeoecol. 2022, 600, 111082. [Google Scholar] [CrossRef]
- Hao, Q.; Guo, Z.; Qiao, Y.; Xu, B.; Oldfield, F. Geochemical evidence for the provenance of middle Pleistocene loess deposits in southern China. Quat. Sci. Rev. 2010, 29, 3317–3326. [Google Scholar] [CrossRef]
- Qiao, Y.; Guo, Z.; Hao, Q.; Wu, W.; Jiang, W.; Yuan, B.; Zhang, Z.; Wei, J.; Zhao, H. Loess-soil sequences in southern Anhui Province: Magnetostratigraphy and paleoclimatic significance. Chin. Sci. Bull. 2003, 48, 2088–2093. [Google Scholar] [CrossRef]
- Yang, S.Y.; Li, C.X.; Yang, D.Y.; Li, X.S. Chemical weathering of the loess deposits in the lower Changjiang Valley, China, and paleoclimatic implications. Quat. Int. 2004, 117, 27–34. [Google Scholar] [CrossRef]
- Qiao, Y.; Zhao, Z.; Li, Z.; Wang, Y.; Fu, J.; Wang, S.; Li, C.; Yao, H.; Jiang, F. Aeolian origin of the red earth formation in the Chengdu Plain. Quat. Sci. 2007, 27, 286–294, (Chinese with English abstract). [Google Scholar]
- Xiong, S.; Sun, D.; Ding, Z. Aeolian origin of the red earth in southeast China. J. Quat. Sci. Publ. Quat. Res. Assoc. 2002, 17, 181–191. [Google Scholar] [CrossRef]
- Hong, H.; Wang, C.; Zeng, K.; Gu, Y.; Wu, Y.; Yin, K.; Li, Z. Geochemical constraints on provenance of the mid-Pleistocene red earth sediments in subtropical China. Sediment. Geol. 2013, 290, 97–108. [Google Scholar] [CrossRef]
- Yang, D.; Han, H.; Zhou, L. Mid to late Pleistocene eolian deposits in Xuancheng, Anhui. Mar. Geol. Quat. Geol. 1991, 11, 97–104, (Chinese with English abstract). [Google Scholar]
- Sun, Y.; Yan, Y.; Nie, J.; Li, G.; Shi, Z.; Qiang, X.; Chang, H.; An, Z. Source-to-sink fluctuations of Asian aeolian deposits since the late Oligocene. Earth Sci. Rev. 2020, 200, 102963. [Google Scholar] [CrossRef]
- Iriondo, M.H.; Kröhling, D. Non-classical types of loess. Sediment. Geol. 2007, 202, 352–368. [Google Scholar] [CrossRef]
- Yuan, B.; Hou, Y.; Wang, W.; Rick, P.; Guo, Z.; Huang, W. On the morphological evolution of the bose basin, a lower paleolithic locality in South china. Acta Anthropol. Sin. 1999, 18, 215–224, (Chinese with English abstract). [Google Scholar]
- Xia, Y.; Chen, X.; Lu, H.; Xie, G.; Yi, S.W.; Yang, F.; Chen, Y.; Rao, Z. Optically stimulated luminescence dating and its significance of the newly discovered Paleolithic sites in the Bose Basin, Guangxi Zhuang Autonomous Region, South China. Quat. Sci. 2025, 45, 1–14, (Chinese with English abstract). [Google Scholar]
- Wang, W. Recently discovered Paleolithic sites in the Bubing Basin, South China. Acta Anthropol. Sin. 2014, 33, 270–284, (Chinese with English abstract). [Google Scholar]
- Hou, Y.; Potts, R.; Yuan, B.; Guo, Z.; Deino, A.; Wang, W.; Clark, J.; Xie, G.; Huang, W. Mid-Pleistocene Acheulean-like Stone Technology of the Bose Basin, South China. Science 2000, 287, 1622–1626. [Google Scholar] [CrossRef]
- Shen, X.; Hong, H.; Huang, S.; Algeo, T.J.; Huang, Q.; Bae, C.J.; Yin, K.; Wang, C.; Fang, Q.; Liu, C. Terrestrial paleoclimate changes recorded by Pleistocene red earth deposits at the Gaolingpo Paleolithic site, Bose Basin, South China. Palaeogeogr. Palaeoclimatol. Palaeoecol. 2023, 614, 111438. [Google Scholar] [CrossRef]
- Yuan, B.; Xia, Z.; Li, B.; Qiao, Y.; Gu, Z.; Zhang, J.; Xu, B.; Huang, W.; Zeng, R. Chronostratigraphy and stratigraphic division of red soil in southern china. Quat. Sci. 2008, 28, 1–13, (Chinese with English abstract). [Google Scholar]
- Wang, W.; Bae, C.J.; Huang, S.; Huang, X.; Tian, F.; Mo, J.; Huang, Z.; Huang, C.; Xie, S.; Li, D. Middle Pleistocene bifaces from Fengshudao (Bose Basin, Guangxi, China). J. Hum. Evol. 2014, 69, 110–122. [Google Scholar] [CrossRef] [PubMed]
- Huang, W.; Leng, J.; Yuan, X.; Xie, G. Advanced opinions on the stratigraphy and chronology of Baise stone industry. Acta Anthropol. Sin. 1990, 9, 105–112, (Chinese with English abstract). [Google Scholar]
- Lu, H.; Wang, X.; Wang, Y.; Zhang, X.; Yi, S.; Wang, X.; Stevens, T.; Kurbanov, R.; Marković, S.B. Chinese loess and the Asian monsoon: What we know and what remains unknown. Quat. Int. 2022, 620, 85–97. [Google Scholar] [CrossRef]
- Lai, Z. Chronology and the upper dating limit for loess samples from Luochuan section in the Chinese Loess Plateau using quartz OSL SAR protocol. J. Asian Earth Sci. 2010, 37, 176–185. [Google Scholar] [CrossRef]
- Lai, Z.-P.; Brückner, H.; Zöller, L.; Fülling, A. Existence of a common growth curve for silt-sized quartz OSL of loess from different continents. Radiat. Meas. 2007, 42, 1432–1440. [Google Scholar] [CrossRef]
- Aitken, M.J. Introduction to Optical Dating: The Dating of Quaternary Sediments by the Use of Photon-Stimulated Luminescence; Clarendon Press: Oxford, UK, 1998. [Google Scholar]
- Lai, Z.; Brückner, H. Effects of Feldspar Contamination on Equivalent dose and the Shape of Growth Curve for OSL of Silt-Sized Quartz Extracted from Chinese Loess. Geochronometria 2008, 30, 49–53. [Google Scholar] [CrossRef]
- Bøtter-Jensen, L.; Duller, G.; Murray, A.; Banerjee, D. Blue light emitting diodes for optical stimulation of quartz in retrospective dosimetry and dating. Radiat. Prot. Dosim. 1999, 84, 335–340. [Google Scholar] [CrossRef]
- Murray, A.S.; Wintle, A.G. Luminescence dating of quartz using an improved single-aliquot regenerative-dose protocol. Radiat. Meas. 2000, 32, 57–73. [Google Scholar] [CrossRef]
- Roberts, H.; Duller, G.A. Standardised growth curves for optical dating of sediment using multiple-grain aliquots. Radiat. Meas. 2004, 38, 241–252. [Google Scholar] [CrossRef]
- Lai, Z. Testing the use of an OSL standardised growth curve (SGC) for De determination on quartz from the Chinese Loess Plateau. Radiat. Meas. 2006, 41, 9–16. [Google Scholar] [CrossRef]
- Lai, Z.; Ou, X. Basic procedures of optically stimulated luminescence (OSL) dating. Prog. Geogr. 2013, 32, 683–693, (In Chinese with English abstract). [Google Scholar]
- Prescott, J.R.; Hutton, J.T. Cosmic ray contributions to dose rates for luminescence and ESR dating: Large depths and long-term time variations. Radiat. Meas. 1994, 23, 497–500. [Google Scholar] [CrossRef]
- Wallinga, J.; Cunningham, A.C. Luminescence dating, uncertainties and age range. In Encyclopedia of Scientific Dating Methods; Springer: Dordrecht, The Netherlands, 2015; pp. 440–445. [Google Scholar]
- Durcan, J.A.; King, G.E.; Duller, G.A. DRAC: Dose Rate and Age Calculator for trapped charge dating. Quat. Geochronol. 2015, 28, 54–61. [Google Scholar] [CrossRef]
- Folk, R.; Ward, W. Brazos River Bar: A Study in the Significance of Grain Size Parameters. J. Sediment. Petrol. 1957, 27, 3–26. [Google Scholar] [CrossRef]
- Udden, J.A. Mechanical composition of clastic sediments. Bull. Geol. Soc. Am. 1914, 25, 655–744. [Google Scholar] [CrossRef]
- Wentworth, C.K. A scale of grade and class terms for clastic sediments. J. Geol. 1922, 30, 377–392. [Google Scholar] [CrossRef]
- Paterson, G.A.; Heslop, D. New methods for unmixing sediment grain size data. Geochem. Geophys. Geosyst. 2015, 16, 4494–4506. [Google Scholar] [CrossRef]
- Eggins, S.M.; Woodhead, J.D.; Kinsley, L.P.J.; Mortimer, G.E.; Sylvester, P.; McCulloch, M.T.; Hergt, J.M.; Handler, M.R. A simple method for the precise determination of ≥40 trace elements in geological samples by ICPMS using enriched isotope internal standardisation. Chem. Geol. 1997, 134, 311–326. [Google Scholar] [CrossRef]
- Kamber, B.S.; Greig, A.; Schoenberg, R.; Collerson, K.D. A refined solution to Earth’s hidden niobium: Implications for evolution of continental crust and mode of core formation. Precambrian Res. 2003, 126, 289–308. [Google Scholar] [CrossRef]
- Blaauw, M.; Christen, J.A. Flexible paleoclimate age-depth models using an autoregressive gamma process. Bayesian Anal. 2011, 6, 457–474, 418. [Google Scholar] [CrossRef]
- Liao, W.; Tian, C.; Liang, H.; Yao, Y.; Li, J.; Yan, Y.; Huang, S.; Bae, C.J.; Wang, W. Provenance geochemical detection of soil deposits from archaeological limestone caves in the Bubing Basin, tropical China. Quat. Int. 2024, 714, 109580. [Google Scholar] [CrossRef]
- Taylor, S.R.; McLennan, S.M. The Continental Crust: Its Composition and Evolution; Blackwell Scientific Publications: Oxford, UK, 1985. [Google Scholar]
- Sheldon, N.D.; Tabor, N.J. Quantitative paleoenvironmental and paleoclimatic reconstruction using paleosols. Earth Sci. Rev. 2009, 95, 1–52. [Google Scholar] [CrossRef]
- Cox, R.; Lowe, D.R.; Cullers, R. The influence of sediment recycling and basement composition on evolution of mudrock chemistry in the southwestern United States. Geochim. Cosmochim. Acta 1995, 59, 2919–2940. [Google Scholar] [CrossRef]
- McLennan, S.M. Weathering and Global Denudation. J. Geol. 1993, 101, 295–303. [Google Scholar] [CrossRef]
- Bhatia, M.R.; Crook, K.A.W. Trace element characteristics of graywackes and tectonic setting discrimination of sedimentary basins. Contrib. Mineral. Petrol. 1986, 92, 181–193. [Google Scholar] [CrossRef]
- Kasanzu, C.; Maboko, M.A.H.; Manya, S. Geochemistry of fine-grained clastic sedimentary rocks of the Neoproterozoic Ikorongo Group, NE Tanzania: Implications for provenance and source rock weathering. Precambrian Res. 2008, 164, 201–213. [Google Scholar] [CrossRef]
- Muhs, D.R.; Budahn, J.R.; Johnson, D.L.; Reheis, M.; Beann, J.; Skipp, G.; Fisher, E.; Jones, J.A. Geochemical evidence for airborne dust additions to soils in Channel Islands National Park, California. GSA Bull. 2008, 120, 106–126. [Google Scholar] [CrossRef]
- Dietze, E.; Maussion, F.; Ahlborn, M.; Diekmann, B.; Hartmann, K.; Henkel, K.; Kasper, T.; Lockot, G.; Opitz, S.; Haberzettl, T. Sediment transport processes across the Tibetan Plateau inferred from robust grain-size end members in lake sediments. Clim. Past 2014, 10, 91–106. [Google Scholar] [CrossRef]
- Vandenberghe, J.; Sun, Y.; Wang, X.; Abels, H.A.; Liu, X. Grain-size characterization of reworked fine-grained aeolian deposits. Earth-Sci. Rev. 2018, 177, 43–52. [Google Scholar] [CrossRef]
- Vandenberghe, J. Grain size of fine-grained windblown sediment: A powerful proxy for process identification. Earth-Sci. Rev. 2013, 121, 18–30. [Google Scholar] [CrossRef]
- Du, Y. OSL Dating of the Quaternary Red Clay Distributed in the Reaches of the Yangtze River and Paleoclimatic Changes since the Last Interglacial Period in Mid-Subtropical Southeast China. Ph.D. Thesis, Shanghai University, Shanghai, China, 2013. [Google Scholar]
- Sun, D.; Bloemendal, J.; Rea, D.K.; An, Z.; Vandenberghe, J.; Lu, H.; Su, R.; Liu, T. Bimodal grain-size distribution of Chinese loess, and its palaeoclimatic implications. CATENA 2004, 55, 325–340. [Google Scholar] [CrossRef]
- Wang, Y.; Mai, B.; He, L. Analysis of the causes of a rare floating dust weather in Guangxi in March 2021. J. Meteorol. Res. Appl. 2023, 44, 96–101, (Chinese with English abstract). [Google Scholar]
- Tsoar, H.; Pye, K. Dust transport and the question of desert loess formation. Sedimentology 1987, 34, 139–153. [Google Scholar] [CrossRef]
- Prins, M.A.; Vriend, M.; Nugteren, G.; Vandenberghe, J.; Lu, H.; Zheng, H.; Weltje, G.J. Late Quaternary aeolian dust input variability on the Chinese Loess Plateau: Inferences from unmixing of loess grain-size records. Quat. Sci. Rev. 2007, 26, 230–242. [Google Scholar] [CrossRef]
- Vandenberghe, J.; Yang, X.; Wang, X.; Wang, S.; Lu, H. Diverse floodplain deposits of reworked loess in a monsoon climate (Hanzhong Basin, central China). Quat. Res. 2021, 103, 4–20. [Google Scholar] [CrossRef]
- Song, X.; Zhu, T.; Mo, J.; Bae, C.J.; Wang, W. In situ (splash-form) tektites from the Middle Pleistocene laterite deposits in Bose Basin, South China. Quat. Sci. Rev. 2025, 366, 109500. [Google Scholar] [CrossRef]
- Wang, X.; Ma, J.; Yi, S.; Vandenberghe, J.; Dai, Y.; Lu, H. Interaction of fluvial and eolian sedimentation processes, and response to climate change since the last glacial in a semiarid environment along the Yellow River. Quat. Res. 2019, 91, 570–583. [Google Scholar] [CrossRef]
Disclaimer/Publisher’s Note: The statements, opinions and data contained in all publications are solely those of the individual author(s) and contributor(s) and not of MDPI and/or the editor(s). MDPI and/or the editor(s) disclaim responsibility for any injury to people or property resulting from any ideas, methods, instructions or products referred to in the content. |
© 2025 by the authors. Licensee MDPI, Basel, Switzerland. This article is an open access article distributed under the terms and conditions of the Creative Commons Attribution (CC BY) license (https://creativecommons.org/licenses/by/4.0/).