Abstract
Severe floods such as in the Ahr valley in July 2021 are one of the leading causes of fatalities from natural disaster. Riverine and lacustrine floods are caused by a sudden flux of water masses from heavy rainfall or snowmelts. These surface water runoff events significantly enhance erosion of detrital material in the catchment, which is then deposited in natural sinks such as lakes. We reconstructed flood phases from Eifel maar lakes over the last 60,000 years and compared flood behavior with regional riverine flood data covering the past 1000 years. Multi-centennial flood cycles persisted throughout the Holocene with durations of flood-poor periods significantly decreasing around 3700 years ago due to human activity in the Eifel region. Holocene flood frequency peaked in the 13th and 14th centuries during the medieval agricultural revolution. Late Pleistocene flood phases occurred during the Younger Dryas and Heinrich stadials and represent surface runoff events in cold and dry climates. As flood behavior is strongly affected not only by increased water supply but also by soil stability and erosion processes in the catchment area, flood phases reflect shifts in the prevailing climate conditions and vegetation cover, either through natural steppe formation or human impact.
1. Introduction
In mid-July 2021, a disastrous flood event struck several river systems in western Germany and neighboring countries. In particular, the river Ahr, draining large parts of the northern Eifel area, was overwhelmed by extensive rainfall and subsequent fast-rising water levels and extreme discharge rates [1]. This natural disaster resulted in the death of more than 180 people in the region and affected tens of thousands in total [2]. In addition to the dolorous loss of many lives and countless personal tragedies inflicted by this fateful event, the flash flood wreaked havoc on the existing infrastructure along the river (Figure 1), resulting in massive economic damages amounting to 40–50 billion Euro (e.g., [3]).
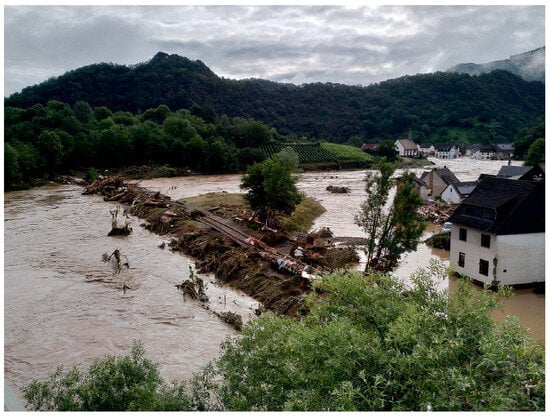
Figure 1.
Picture of the devastating consequences of the July 2021 Ahr valley flood event, Altenahr [4].
If we take a look at Eifel precipitation and water level variations in the regional river Moselle since 1963, a clear connection becomes apparent between years with intensified rainfall and high-water phases in the river (Figure 2A). Long-term temperature variations, on the other hand, appear to have only minor or no effects on flood potential. In contrast, temperature variability is the main driver of seasonal water level fluctuations, as annual snowmelt events in the river’s catchment result in significantly elevated gauge heights while water levels remain low during summer months (Figure 2B). However, this was not the case in July 2021. In the days leading up to the severe floodings, heavy rains struck the Eifel, peaking in the night from the 14th to 15th and causing dramatic water levels and discharge rates in the Moselle and regional river systems.
The devastating scale of the July 2021 flood serves as a stark reminder that humans remain fundamentally vulnerable to the uncontrollable forces of nature. Still, the question arises, should we be expecting such extreme events more frequently in the future, or was this an outlier? Where is the 2021 flood event to be placed in a historical context?
Throughout the Middle Ages, central European rivers underwent a series of intervals with heightened flood frequencies. Glaser and Stangel [5] found a periodicity between 30 and 100 years for increasing and decreasing flood activity in fluvial catchments across the continent. Although high-frequent flood phases show considerable variations between the various rivers as they are mainly controlled by the local geomorphology and regional climate factors, there are also spatial and temporal synchronicities. Glaser et al. [6] identified four flood-rich periods for 12 major river systems across central Europe, i.e., between 1540–1600, 1640–1700, 1730–1790, and 1790–1840. Particularly during the mid to late 1500s, central European rivers were struck by a significant increase in flood frequency (e.g., [5,7]). For the Moselle, four extreme historical flood events were reported in the Eifel town of Cochem in the past 500 years, i.e., in 1573, 1651, 1740, and 1784 [8].

Figure 2.
Moselle water level fluctuation. (A) Recorded water levels of the Moselle in Cochem since 1965 (source: Federal Waterways and Shipping Administration (WSV), provided by the Federal Institute of Hydrology (BfG)) with atmospheric CO2 levels (Mauna Loa and Law Dome) [9,10] and Eifel temperature and precipitation data [11]. Light blue areas represent phases of increased precipitation and water levels. CO2 data was smoothed with a 3 pt. running mean. Eifel climate data and Mosel water level record were smoothed over a period of 1 year (2190 pt. running mean and 365 pt. running mean, respectively). (B) Seasonal water level fluctuation between 2010 and 2022. Eifel temperature data was smoothed over a period of 1 month (180 pt. running mean), revealing significantly increased water levels during the winter seasons (light blue areas), as well as the extreme flood event of July 2021 (orange area).
The most severe flood event in central Europe in the past 1000 years was the so-called St. Magdalene Flood in July 1342. During this event, which is considered a millennium flood, intense rainfall lasted for eight straight days and flooded many riverine catchments (e.g., [12,13]). In addition, violent snowmelt floods struck the continent only five months earlier before the St. Magdalene Flood ultimately devastated the weakened infrastructure [14]. The catastrophic consequences of this millennium event are well documented in countless chronicles along the catchments of many rivers across Europe (e.g., [15,16]).
When comparing flood time series of the past millennium with historical atmospheric circulation trends, it becomes apparent that flood events were much more prevalent during periods of specific circulation patterns [5,12,17]. For example, an increased flood occurrence during the Little Ice Age (LIA; 14th–19th centuries) was caused by intensified snowmelts and consequent water runoff in the European river systems (e.g., [6,18]). A 2500-year long flood record comprised of sediment cores from ten lakes in Switzerland shows that flood-frequent intervals coincided with periods of lower summer temperatures, suggesting a link between increased flood frequency and latitudinal shifts of westerly storm tracks [19].
Although riverine flood frequencies show a clear rise within the last two millennia due to intensified agricultural land use and deforestation during the Roman period and Middle Ages (e.g., [20,21,22,23]), intervals of heightened fluvial activity lasting for several centuries occurred throughout the Holocene. Benito et al. [24] linked high-frequent flood phases in rivers in the UK and central Europe to multi-decadal solar irradiance minima and ice-rafted debris (IRD) events [25]. Particularly before 5000 cal. BP, flood-rich phases correlate well with IRD peaks and North Atlantic cooling trends [22].
At around 5000 cal. BP, winter insolation in the Northern Hemisphere experienced a significant increase [26], causing milder and wetter winter conditions due to a weakening of the westerlies [24]. As a consequence, a general shift can be observed in flood patterns in European rivers. During the second half of the Holocene, flood-rich periods occurred more frequently, which can be contributed to climate changes as well as an intensification of Neolithic activity (e.g., [27,28,29]).
Changes in the European hydrological system around the middle–late Holocene boundary can also be observed in lacustrine records. In the Austrian Lake Mondsee, a stepwise rise in flood frequencies occurred during the Late Holocene, linked to a decrease in Northern Hemisphere summer insolation [30]. Lauterbach et al. [31] reported an increased frequency of small-scale turbidites and detrital matter flux in Lake Iseo, southern Alps, connected to a rise in human activity in the surrounding area at around 4200 cal. BP. Similarly, a stacked flood record comprised of several lakes in the southern Alps shows a significant increase in flood deposition [32]. However, because pollen data indicate that human activity only began around 2000 years ago near some of the lakes, the elevated flood frequency cannot solely be explained by an anthropogenic impact. Furthermore, this hydrological trend cannot be observed in northern Alpine lakes, suggesting a shift in the atmospheric circulation pattern towards the south, which caused increased precipitation in the southern Alps.
Looking even further back in time, before humans actively changed their environment through intensive land use, it becomes apparent that climate-driven shifts in European hydrological systems and phases of increased flood activity occurred throughout the Late Pleistocene. During Heinrich stadials (H), which are defined by coarse-grained event layers of ice-rafted debris in North Atlantic sediment records [33], an expansion of sea ice and interruption of the Atlantic Meridional Overturing Circulation (AMOC) caused pronounced climate deteriorations in the Northern Hemisphere (e.g., [34,35]), detectable in many terrestrial archives across Europe (e.g., [36,37,38]). Westaway and Bridgland [39] showed that peaks in paleoflow records of several Northwest European rivers coincide with H1 and H2 at around 17 ka and 25 ka, respectively. Intervals of increased and supra-local flood activity matching H1–H6 were also found in Eifel maar lake sediments [40], suggesting a clear hydrodynamic response to increased water supply during Heinrich times.
In this paper, we present time series of flood events in Eifel maar basins during the last 60,000 years. We further compare flood frequency in the maar lake of Schalkenmehren with historical flood data from the regional river system for the past millennium [41]. Previous Eifel flood time series covering the Late Pleistocene and Holocene were presented by Brunck et al. [42] and Albert and Sirocko [40]. Here, we complement and revise these results based on the ELSA-20 stratigraphy [43] and fine-tuning update of sediment record AU3 [44].
2. Materials and Methods
Information about long-term flood activity in fluvial systems is often lost due to frequent erosion effects in high-energy environments [45]. In contrast, lakes act as a natural sink and trap the majority of inflowing detrital material. Furthermore, lake sediments are optimal for studying the timing of flood events due to their generally slow and consistent sedimentation rates and therefore reliable age control. An ideal area to study long-term flood behavior is the West Eifel Volcanic Field in western Germany with its numerous maar structures (Figure 3), which formed by repeated volcanic activity over the past 500,000 years (e.g., [46,47]). The open maar lakes and infilled maar basins of the region have been systematically drilled and investigated since 1998 by the ELSA (Eifel Laminated Sediment Archive) project at the University of Mainz, Germany (e.g., [43,48,49,50]).
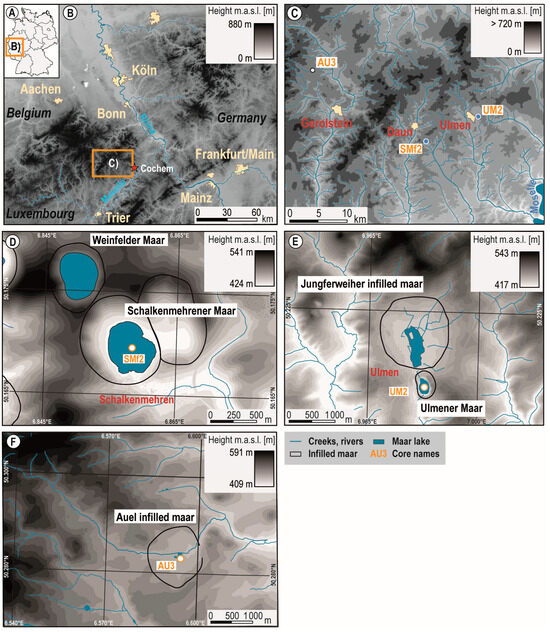
Figure 3.
Location of coring sites. (A) Overview of Germany. (B) Digital elevation model (DGM) of West Germany with rivers and streams. Additionally shown is the location of the Moselle water station, Cochem (red star, see Figure 2). (C) DGM of the West Eifel Volcanic Field with drainage system and locations of Schalkenmehrener Maar (SMf2), Ulmener Maar (UM2), and Auel infilled maar (AU3). (D) DGM of the Schalkenmehrener Maar with exact location of core SMf2. (E) DGM of the Ulmener Maar with exact location of core UM2. (F) DGM of the Auel infilled maar with exact location of core AU3.
Sediment records from three maar lakes were used for this study. Holocene cores SMf2 (Schalkenmehrener Maar) and UM2 (Ulmener Maar) were recovered using UWITEC freeze core technology and ‘Niederreiter’ technology, respectively. Late Pleistocene core AU3 (Auel infilled maar) was recovered using ‘Seilkern’ coring technology. The exact locations of all maars are shown in Figure 3C.
2.1. Coring Sites
The Schalkenmehrener Maar has a diameter of 528 m and a water depth of 22 m. It was formed by a phreatomagmatic eruption which occurred at around 72,090 yr b2k (years before the year 2000) [51]. The maar structure consists of three eruption centers [52,53]. However, only the western crater is filled with water today, while the eastern parts have been silted up since the mid-Holocene (Figure 3D) [54]. The maar lake of Schalkenmehren is part of the Dauner Maar group and, with a surface area of 219,000 m2, is one of the largest maar lakes in the region. Although the maar has no significant inflow or outflow stream today, there is a small creek flowing into the lake. Freeze core SMf2 shows an exceptional preservation of laminations and varve counting performed on the 2 m long core (Figure S1A) yield an age of 1000 years with a precision of ±5% [55,56].
With a diameter of 265 m, the Ulmener Maar is the smallest maar lake in the Eifel (Figure 3E). It is also the youngest maar and has an estimated age of 10,650 yr b2k [51]. It has a maximum water depth of 36 m and although there is no inflow today, the nearby Uessbach creek must have flowed into the maar in the past at least during intense flood events. Core UM2 (Figure S1B) was dated by 156 radiocarbon ages and is well suited to reconstruct the regional flood history due to its thick event layers [57]. The core base of the 12 m long sediment record has an estimated age of 9000 yr b2k.
A distinct feature of the flood layers in the Ulmener Maar is their unique white color (Figure 4C), which originates from a nearby Kaolinit sandstone outcrop in the western catchment area of the maar. During heavy surface runoff events, material from the exposed white sandstone is eroded and washed into the maar, where the typical whitish flood layers contrast starkly from the brown, dark background sediments (Figure S1B).
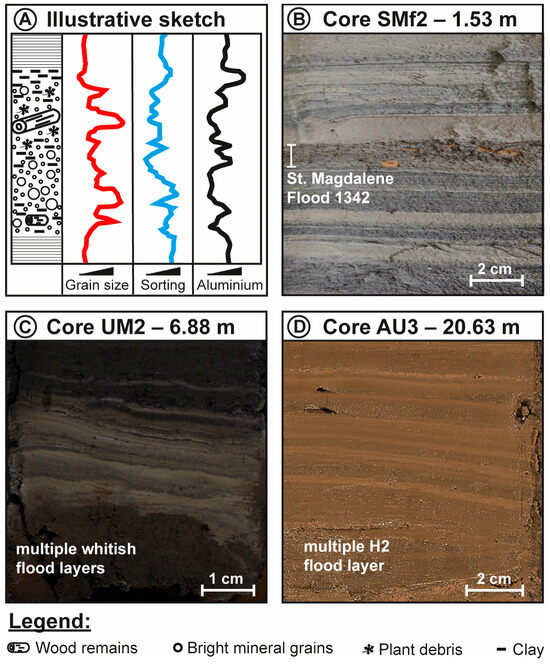
Figure 4.
Flood layers in maar sediment records. (A) Illustrative sketch (after [54]) and pictures of flood layers in cores SMf2 (B), UM2 (C), and AU3 (D).
The Auel infilled maar has a diameter of 1325 m and is one of the largest maar basins in the Eifel (Figure 3F). It formed at around 59,130 yr b2k and was filled up during the early Holocene [43]. Today, the Tieferbach flows through its former center, covering a catchment area of 12.187 km2. The Auel infilled maar has the highest sedimentation rate of all Eifel maars due to its abundant fluvial input (2.3 mm yr−1). With an estimated core base of 59,110 yr b2k, the 102 m long AU3 sediment record (Figure S2) almost reaches the maar’s eruption sequence and contains all Greenland Interstadials (GI) [58] back to GI17 (e.g., [43,44]).
2.2. Flood Layers
A characteristic feature of flood layers is their distinct sediment texture (Figure 4) and major flood events can even be identified macroscopically on the core (Figure 4B–D). Since the maar lakes vary greatly in their characteristic features such as diameter, basin volume, or inflow rate, differences in flood behavior are also to be expected. For records UM2 and AU3, cores were macroscopically examined and flood deposits thicker than 0.7 cm were visually identified. This allowed a distinction to other event layers caused by, for instance, slope failures. Core SMf2 includes thinner flood layers and was examined microscopically. To compare the flood records, a normalized flood index was calculated (number of flood layers per time interval divided by the maximum number of flood layers per time interval). This method, first established by Brunck et al. [42], yields flood frequency variabilities and does not present an exact count of flood occurrences. Flood records of cores SMf2 and UM2 were first documented by Brunck et al. [42]. AU3 flood data was first published by Albert and Sirocko [40]. Here, we present modified versions based on the ELSA-20 stratigraphy [43] and fine-tuning update of sediment record AU3 [44].
3. Results
3.1. Present–9000 yr b2k (The Maar Lakes of Schalkenmehren and Ulmen)
Flood events occurred in Eifel maar lakes throughout the Holocene (Figure 5 and Figure 6). However, flood layers are not uniformly distributed and episodic clusters of high-frequent flood activity can be observed in cores SMf2 and UM2.
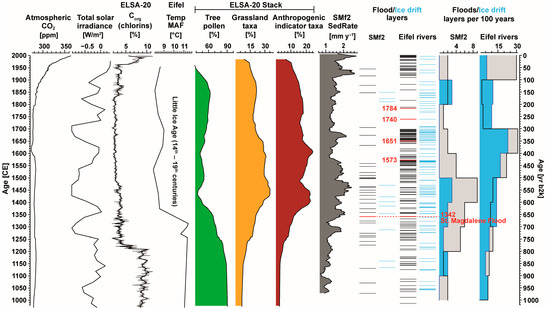
Figure 5.
Flood activity in the maar lake of Schalkenmehren (SMf2) in the past 1000 years compared to flood activity in Eifel river systems. Identified flood (black bars) and ice drift layers (light blue bars) and flood and ice drift layers per 100 years (light grey areas and light blue areas, respectively). Additionally shown are atmospheric CO2 levels (Law Dome) [10], total solar irradiance [59], ELSA-20 Corg(chlorins) content [43], a proxy for lake primary production, Eifel temperatures during months above freezing (MAF) [60], the ELSA-20 pollen stack [50], reflecting the prevailing vegetation cover influencing soil stability, SMf2 sedimentation rates (dark grey area), and recorded flood and ice drift events from the Eifel rivers Rhine, Moselle, and tributaries [41]. Also marked are extreme Moselle flood events documented in historical archives in Cochem (red bars), including the St. Magdalene Flood in 1342 [8]. CO2 and pollen data were smoothed with a 3 pt. running mean. ELSA-20 Corg(chlorins) and SMf2 sedimentation rates were smoothed with a 10 pt. and 25 pt. running mean, respectively, with the grey graph (ELSA-20) representing unsmoothed data.
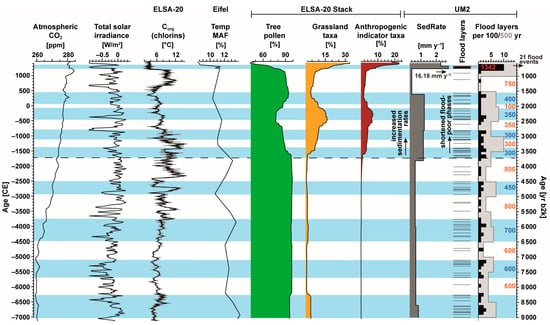
Figure 6.
Phases of increased flood frequency in the Ulmener Maar (UM2) from 600 to 9000 yr b2k. Identified flood layers (black bars) and flood layers per 100 and 500 years (black area and light grey area, respectively). Additionally shown are atmospheric CO2 levels (Law Dome and Dome C) [10,61,62,63], total solar irradiance [59], ELSA-20 Corg(chlorins) content [43], a proxy for lake primary production, Eifel temperatures during months above freezing (MAF) [60], the ELSA-20 pollen stack [50], reflecting the prevailing vegetation cover influencing soil stability, and UM2 sedimentation rates (dark grey area). CO2 and pollen data were smoothed with a 3 pt. running mean. ELSA-20 Corg(chlorins) was smoothed with a 10 pt. running mean with the grey graph representing unsmoothed data. Additionally marked are the St. Magdalene flood event of 1342 (red bar) (e.g., [8]), durations in years of flood-rich (blue) and flood-poor (orange) periods, and a prominent shift in the flood pattern at around 3700 yr b2k (dashed black line).
When comparing flood frequencies of the past millennium between the maar lake of Schalkenmehren and the rivers Rhine, Moselle, and tributaries, a clear difference becomes apparent (Figure 5). Regional riverine flood events occurred much more frequently throughout the Middle Ages, up to several floods per decade. In contrast, core SMf2 only shows one flood layer per decade on average during its most flood-rich period, i.e., between around 1220 and 1560 CE. In these three centuries, a steady increase in flood frequency is visible in the SMf2 record, culminating in nine flood events during the 1400s (Figure 5). After 1560 CE, flood activity in the Schalkenmehrener Maar dropped to one or two flood events per century. A similar gradual rise can be observed in the Eifel rivers flood record, where floods occurred seven times in the 11th century and reached 31 events between 1600 and 1700 CE.
In the riverine ice drift record, a noticeable shift occurred at around 1280 CE (Figure 5). Documented events per 100 years increased from 5–8 in the preceding centuries to 14 between 1300 and 1500 CE and 23 recorded events in the 17th century. In 1278, an ice drift also occurred in Schalkenmehren with several more following over the next 200 years, while regional temperatures during months above freezing (MAF) declined by approximately 2 °C.
At the turn of the 18th century, a sharp cut can be observed in the flood records (Figure 5). Flood events became much less frequent in the Eifel rivers. In particular, summer floods only occurred once or twice per century over the next 200 years. In Schalkenmehren, no summer flood layer was deposited between 1710 and 1850. However, a second small cluster of three ice drift events is visible in the SMf2 record between 1810 and 1850. In these four decades, several ice drifts occurring within a few years were also recorded in the Rhine and Moselle, particularly 1827–1830, 1837–1838, and 1845–1848 [41]. While flood frequency has since remained low in the Eifel maar, the regional rivers experienced another increase in summer flood frequency in the 1910s, which lasted throughout the 20th century.
When examining Holocene flood activity in the maar lake of Ulmen, a clear hydrodynamic shift is apparent near the middle–late Holocene boundary (Figure 6). Prior to 3700 yr b2k, flood phases lasting between 450 and 700 years alternated with 600- to 800-year long periods with only sporadic flood events. After 3700 yr b2k, the frequency of flood-rich periods significantly increased and flood-poor intervals lasted much shorter. This shift coincides with a retreat of woodland and expansion of open grassland, as well as an initial rise in anthropogenic pollen taxa representing early settlements in the region.
During the Roman period and the Middle Ages, the Ulmener Maar experienced its two most contrasting periods regarding its sediment dynamics (Figure 6). Between 1550 and 780 yr b2k, the sedimentation rate in the maar dropped to around 0.4 mm yr−1 and only two flood layers are visible in the sediment record. In contrast, maximum flood activity and detrital influx (16.18 mm yr−1) took place in the 13th and 14th centuries with 20 flood events occurring in only 150 years.
3.2. 10,000–60,000 yr b2k (The Auel Infilled Maar)
Multiple flood-rich periods could be identified in core AU3, i.e., 48,100–47,300 yr b2k, 34,600–29,300 yr b2k, 25,500–19,800 yr b2k, 17,200–16,200 yr b2k, and 12,700–11,500 yr b2k (Figure 7) [40,42].
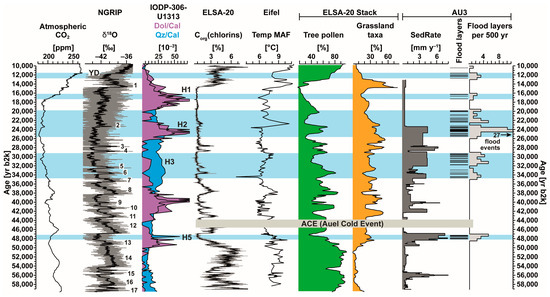
Figure 7.
Phases of increased flood frequency in the Auel infilled maar (AU3) from 10,000 to 60,000 yr b2k (light blue areas). Identified flood layers (black bars) and flood layers per 500 years (light grey area). Additionally shown are atmospheric CO2 levels (Dome C, WAIS, Siple Dome, and TALDICE) [61,62,64,65,66], Greenland Interstadials (GI) 1–17 of the NGRIP oxygen isotope ice core chronology [58], quartz/calcite (blue) and dolomite/calcite (purple) ratios from North Atlantic site U1313 [67], ELSA-20 Corg(chlorins) content [43], a proxy for lake primary production, Eifel temperatures during months above freezing (MAF) [60], the ELSA-20 pollen stack [50], reflecting the prevailing vegetation cover influencing soil stability, and AU3 sedimentation rates (dark grey area) [44]. CO2 data was smoothed with a 3 pt. running mean. NGRIP and ELSA-20 Corg(chlorins) records were smoothed with a 30 pt. running mean with grey graphs representing unsmoothed data. Pollen curves were smoothed with a 10 pt. running mean. Additionally shown are the Auel Cold Event [40], the Younger Dryas (YD) cold period [68] and Heinrich stadials 1–3 and 5 (H1–3, H5) [33].
No flood formation occurred during the early MIS 3 warm phase between 60,000 and 48,100 yr b2k when a lush spruce and hornbeam forest was present in the Eifel region [49,50,56]. The first presence of flood layers in core AU3 during early Greenland Stadial (GS) 13 (onset of H5) coincides with a sharp rise in detrital influx into the maar, a prominent decline in tree pollen and synchronous increase in steppe taxa percentages, and a peak in MAF temperatures (Figure 7). At 47,300 yr b2k, flood activity suddenly stopped and no flood layers were deposited in the Auel Maar until around 34,600 yr b2k.
Between 34,600 and 29,300 yr b2k, a prolonged flood-rich period is evident in the sediment record. The onset of this flood phase is characterized by a peak in steppe expansion and sudden major decline in Eifel MAF temperatures during GS7. This extremely cold phase lasted around 500 years and a pronounced increase in tree taxa is visible in the pollen record during subsequent GI6 (Figure 7). Flood formation was interrupted during GI5 (32,500–32,040 yr b2k) until it was reactivated at the onset of H3. Between 32,000 and 29,300 yr b2k, while MAF temperatures gradually increased and tree taxa declined in the region, flood events were quite frequent in the Auel Maar. The end of this flood phase coincides with a well-defined tree pollen maximum and sharp drop in MAF temperatures at around 29,300 yr b2k.
Maximum flood activity in the AU3 record occurred during H2 and the Last Glacial Maximum (LGM; 25,500–19,800 yr b2k). Particularly between 24,500 and 23,500 yr b2k, flood events were quite numerous, reaching up to 27 identified flood layers per 500 years (Figure 7). Similar to the preceding flood phase, flood activity halted between 23,100 and 22,400 yr b2k (early GS2). No flood layers are visible during this period, which is marked by a pronounced maximum in Eifel MAF temperatures and sharp decline in tree pollen.
The next occurrence of flood layers in core AU3 can be observed between 17,200 and 16,200 yr b2k, which corresponds to H1. The onset of this flood phase coincides with a prominent initial rise of atmospheric CO2 levels [64], ultimately reaching concentrations characteristic of the Holocene. While tree taxa steadily declined and regional MAF temperatures oscillated between 7 and 8 °C in the preceding millennia, they dropped below 6 °C during the flood phase (Figure 7).
The last flood-rich period in core AU3 occurred between 12,700 and 11,500 yr b2k during the Younger Dryas (YD; Figure 7). At its onset, CO2 levels show a sharp rise after almost 2000 years of relative stability [64]. NGRIP δ18O [58], ELSA-20 Corg(chlorins) [43], and Eifel MAF temperatures [60] exhibit prominent minima throughout the entire flood phase. In the preceding millennium, a rapid increase in tree taxa can be observed in the pollen record. Tree pollen percentages continued to rise during the YD flood phase, although at a significantly lower rate. At 11,500 yr b2k, as global CO2 levels reached a stable phase and MAF temperatures abruptly increased, the maar’s final flood-rich period ended.
4. Discussion
Although riverine systems show a higher sensitivity to paleoweather extremes (Figure 5), they are prone to erosion processes erasing any long-term information [45]. The maar lakes of the Eifel region with their slow and steady sedimentation rates are well suited for documenting extreme events like severe floodings over very long timescales and comparing them with landscape changes and the presence of human activity (Figure 5, Figure 6 and Figure 7). Natural retreat of woodland, or anthropogenic deforestation and land use in a lake’s catchment displace soil-stabilizing vegetation cover and create open landscapes, either through natural steppe formation or agricultural grazing and farmland (e.g., [69,70]). This makes the soil vulnerable to increased water runoff during massive rainfall or snowmelt events, elevating the potential of erosion effects and subsequent flood deposition.
When combining the flood records of cores SMf2, UM2, and AU3, the ELSA Flood Stack yields an almost continuous flood record covering the past 60,000 years (Figure 8) with gaps between 9000 yr b2k (core base UM2) and 10,000 yr b2k (core top AU3) and at around 43,500 yr b2k (Auel Cold Event) [40].
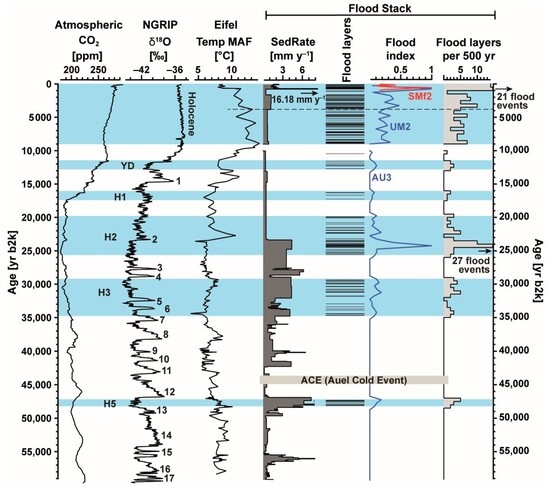
Figure 8.
The ELSA flood stack. Identified flood layers (black bars) and flood layers per 500 years (light grey area) associated with Heinrich stadials 1–3 and 5 (H1–3, H5) [33], the Younger Dryas stadial phase (YD) [68], and the Holocene (light blue areas). Additionally shown are atmospheric CO2 levels (Dome C, WAIS, Siple Dome, and TALDICE) [9,10,61,62,63,64,65,66], Greenland Interstadials (GI) 1–17 of the NGRIP oxygen isotope ice core chronology [58], Eifel temperatures during months above freezing (MAF) [60], sedimentation rates (dark grey area) and normalized flood indices (blue and red lines, see methods) of cores SMf2, UM2, and AU3, the Auel Cold Event [40], and first Neolithic settlements in the Eifel (dashed black line). CO2 and NGRIP data were smoothed with a 3 pt. and 10 pt. running mean, respectively. SMf2 part of sedimentation rate was smoothed with a 25 pt. running mean.
4.1. Late Pleistocene Flood Phases
After the early MIS 3 warm phase when the Eifel was covered by a warm temperate mixed forest (e.g., [50,56]), early GS13 (onset H5) was marked by an abrupt shift towards colder climate conditions. North Atlantic near-surface summer temperatures rapidly decreased by several degrees. In the Western Iberian Margin region in particular, the ocean experienced a surface cooling of more than 5 °C in only a few centuries [71]. Winter temperatures in southern France and the Iberian Peninsula dropped by 1.5–4 °C [72]. This deteriorating climate state caused a sudden retreat of woodland in the Eifel. The landscape transitioned from a spruce-dominated warm temperate forest to a cold temperate forest with increased open grassland [50]. Hornbeam almost completely disappeared in the region, reflecting a sharp decline in mean annual air temperatures below its 5 °C threshold [49]. Relatively warm recorded regional MAF temperatures suggest a higher seasonality and extended winter periods during H5 [60]. This led to an increased water supply from snowmelt events during short, yet relatively warm summers, which eroded the destabilized soils and triggered extensive flood deposition in several Eifel maar lakes in the following millennia (Figure 7) [40].
No flood deposition occurred in the Auel Maar during H4 (at around 40,000 yr b2k). However, it is evident in the flood records of the nearby Dehner Maar, Rother Maar, and Mehrscheider Maar [40]. These differences in flood characteristics suggest that unique maar processes took place in the Auel Maar during this period. Although it is not definitively clear why no flood layers were deposited in the maar during H4, one potential clue may be found in the sedimentation rate of core AU3 (Figure 7 and Figure 8). After an initial pronounced increase at around 40,150 yr b2k, sediment input into the Auel Maar quickly dropped again and remained relatively low during the subsequent millennia. This indicates that processes in the maar’s catchment area (e.g., an upstream sink) redirected or prevented increased water masses from flowing into the maar during H4.
With the onset of GS7 (34,740 yr b2k), drastic climate changes struck the region. MAF temperatures declined dramatically as the landscape changed from a cold temperate forest to a forest steppe [50]. A distinct and long-lasting rise in sediment influx into the Auel Maar at the GI7/GS7 boundary—sediment accumulation rates increased from around 2 mm yr−1 to 4–6 mm yr−1—reflects a clear response in the hydrodynamic state of its catchment to increasingly stadial climate conditions (Figure 7 and Figure 8). During GS7, the Eifel experienced its coldest recorded ice-free months of the past 60,000 years [60]. However, these extremely cold conditions persisted only for around 500 years and a prominent boreal forest quickly redeveloped during GI6. This dense forest, too, lasted only for around 1000 years, before open steppe vegetation expanded again in the subsequent millennia. During this period, enhanced water runoff in the maars’ catchments increased detrital matter influx and activated flood formation in the Eifel maar lakes, especially in the Auel Maar (Figure 7 and Figure 8) [40]. Gradually increasing MAF temperatures between 32,000 and 29,300 yr b2k indicate intensifying winter seasons and relatively mild summers during the height of H3 [60], which caused extensive snowmelt-induced flood deposition. With the onset of GI4 at 28,900 yr b2k and the presence of a pronounced forest in the region, stable climate and soil conditions suppressed erosion processes and enhanced surface runoff in the region’s catchment areas.
The most flood-clustered interval in the Auel Maar, i.e., where flood layers exhibit the highest frequency in all of the sediment record, corresponds to H2 (25,500–24,000 yr b2k). This interval marks the beginning of the LGM, when glacier extent from northern Europe and the Alps reached its maximum expansion (e.g., [73,74]) and temperatures significantly dropped across the continent [75]. Eifel MAF temperatures had reached a long-lasting minimum of approximately 6.2 °C in the preceding millennia [60]. Similar cold conditions were recorded in the nearby Rhine Valley, where mean warm-season land-surface temperatures dropped from 11.3 ± 5.0 °C (GI3) to 7.3 ± 4.7 °C (GS3) [38]. During the height of H2 (24,500–24,000 yr b2k; peak abundance of quartz and dolomite in North Atlantic sediment records) [67], the most flood-frequent phase of all MIS 3 and MIS 2 occurred in the Eifel maars (Figure 7 and Figure 8) [40]. Since precipitation in north-western Europe was considerably reduced during this time (e.g., [38,76,77]), the increased water supply is likely to have originated from high-frequent, massive snowmelt events.
During early GS2, climate conditions in the region continued to deteriorate and it was even too cold for snowmelt-induced floods to occur. As the region transitioned from a forest tundra into the polar desert of the LGM [50], sediment transport into the Auel Maar almost completely halted—sedimentation rates abruptly dropped to 0.7 mm yr−1 with the onset of GS2 (Figure 7 and Figure 8). A pronounced maximum in MAF temperatures at around 23,000 yr b2k suggests that long and severe winter seasons suppressed snowmelt effects and flood formation in the Auel Maar and nearby Dehner Maar (Figure 7 and Figure 8) [40]. This extremely cold period lasted approximately 700 years, before a milder climate during the following millennia with longer ice-free seasons reactivated meltwater runoff and flood deposition in the Auel Maar until around 19,800 yr b2k.
During H1 (18,000–15,000 yr b2k), extensive meltwater release from the Laurentian and European ice sheets [78] triggered a termination, or at least major weakening, of the AMOC [79]. This caused a significant decrease in the ocean carbon inventory [80], and atmospheric CO2 and methane concentrations began to rise rapidly after the long stable phase of the LGM (Figure 7 and Figure 8) [64]. The cold freshwater masses flowing into the North Atlantic led to a drastic change in the ocean current pattern as evident by a sudden drop of sea surface temperatures in the Iberian margin [81] and a decline in sea surface salinity in the Bay of Biscay [82]. Consequently, a complex hydroclimatic system established in southwestern Europe (e.g., [83,84]). In the Eifel, MAF temperatures during H1 were relatively mild, although showing a slight decline of 1–2 °C compared to the preceding millennia [60]. This allowed for extensive snowmelt events and flood formation throughout H1 in several maar lakes in the region (Figure 7 and Figure 8) [40].
Starting at around 12,900 yr b2k, the Northern Hemisphere experiences its last major cooling event, i.e., the YD cold period, disrupting the warming trend at the end of the last glaciation (e.g., [58,68]). An expansion of North Atlantic sea ice and a severe reduction in AMOC strength triggered major changes in oceanic and atmospheric circulation patterns (e.g., [85,86]) and rapidly rising CO2 levels [64]. During the second phase of the YD, which began around 12,700 years ago [68], Europe’s climate shifted towards extreme winter seasons and short warm summers [87]. In the Eifel, a rapid expansion of forests during the preceding Allerød was slowed down substantially as MAF temperatures dropped by around 2 °C (Figure 7) [60]. Müller et al. [88] reported an intensification in wave and water circulation activity during the YD for Lake Gościąż in central Poland. Similarly, a sudden increase in storminess within days is visible in the sediments of the Eifel lake Meerfelder Maar at 12,679 yr BP (12,729 yr b2k) [89]. A clear hydrodynamic response to the deteriorating climate conditions also occurred in the catchments of the Holzmaar [42] and the Auel Maar—our age model dates the first YD flood layer at 12,666 yr b2k, anchored at the nearby Laacher See Tephra marker layer at 13,056 yr b2k [40,90].
4.2. Holocene Flood Activity
Although we cannot provide reliable information about the earliest Holocene—a single flood layer is visible in core AU3 during the maar’s final sedimentation phase (Figure 7 and Figure 8) and core UM2 only reaches 9000 yr b2k (Figure 6 and Figure 8)—Brunck et al. [42] reported a disruption of flood formation in the nearby Holzmaar at the onset of the Holocene. With the termination of the YD cold period and a lasting shift towards stable interglacial conditions, a rapid warming trend occurred across Europe (e.g., [60,88,91]). The development of a dense thermophilic forest in the Eifel [56] provided stabilizing vegetation cover, which suppressed flood formation in the Auel Maar and Holzmaar at around 11,500 yr b2k (Figure 7 and Figure 8). In the Holzmaar, flood formation was only reactivated during the Late Holocene [42].
The Ulmener Maar, on the other hand, experienced numerous flood events throughout the Holocene. However, these events did not occur randomly and a clear centennial-scale cyclic intensification of flood frequency is evident (Figure 6 and Figure 8). As humans had not yet settled in the Eifel region, flood frequency fluctuations during the early and middle Holocene were solely controlled by natural forcing mechanisms. Climatically driven multi-centennial flood cycles were also reported from Alpine lakes in Switzerland and northern Italy [31,32] and several river systems across Europe (e.g., [22,24]), where increased flood activity occurred during cold phases.
At 3700 yr b2k, a notable change in flood behavior occurred in the Ulmener Maar (Figure 6 and Figure 8). Flood-poor intervals significantly shortened from 600–800 years down to 100–350 years. Permanent Neolithic settlements established in the Eifel and with them husbandry—humans practiced cattle farming and cultivated cereal, rye, and buckwheat, among others [50,56]. Forest clearings and a reduction in stabilizing vegetation cover intensified erosion effects and detrital input into the maar. Furthermore, soils became more prone to heavy rainfall and snowmelt events, which is reflected in increased flood occurrences in the region [42]. The impact of human activity and settlements in a lake’s catchment on flood behavior and lasting changes in flood frequency around the middle–late Holocene boundary are well documented in European archives (e.g., [31,92]).
During the Roman period, as human activity in the Eifel declined significantly and forests regenerated, the soils in the catchment area of the Ulmener Maar stabilized and very little detrital material was washed into the maar (sedimentation rate of 0.4 mm yr−1; Figure 6 and Figure 8). This resulted in a notable flood-poor phase with only two flood events occurring in a span of around 750 years, similar in duration to pre-human times.
Maximum flood activity in the Ulmener Maar occurred during the medieval agricultural revolution in the 13th and 14th centuries [93], when extensive forest clearings in the Eifel provided timber for construction in the nearby towns of Aachen, Cologne, Mainz, and others. This massive deforestation made the soils in the maar’s catchment very vulnerable to erosion, resulting in extreme sedimentation rates and high-frequent flood formation (Figure 6 and Figure 8).
An intensification of flood activity and increase in detrital influx in the first half of the last millennium is also visible in the sediments of the Schalkenmehrener Maar (Figure 5). While only three flood events occurred in the maar between 1000 and 1230 CE, flood frequency considerably increased with the onset of the medieval agricultural revolution [93]. This trend of significantly elevated flood frequencies during the Middle Ages also occurred in the regional river systems as the Eifel and the surrounding landscapes were deforested on a massive scale (Figure 5).
Between 1250 and 1700 CE, a sequence of pronounced minima in total solar irradiance [59] caused a prominent MAF temperature drop of 2 °C in the Eifel [60]. This interval marks the cold phase of the LIA. Heightened flood and ice drift activities in the maar lake of Schalkenmehren and the regional rivers reflect increased surface runoff due to intensified heavy rains and snowmelt effects (Figure 5). Flood sensitivity during the LIA was significantly higher in the Eifel rivers than in the Schalkenmehrener Maar, indicating a much stronger response in river systems to the changing climate conditions and human impact. Additionally, increased flood activity in the Schalkenmehrener Maar lasted only until around 1560 CE, whereas central European rivers experienced several flood-rich phases during the second half of the last millennium [6]. The four extreme Moselle flood events of 1573, 1651, 1740, and 1784, which were documented in the nearby town of Cochem (Figure 3) [8], did not occur in the Schalkenmehrener Maar.
5. Conclusions
Flood events are among the world’s most common natural disasters and severe floods like in the Ahr valley in July 2021 occurred throughout history. Riverine and lacustrine floods reflect surface runoff events originating from heavy rains or snowmelts in their catchment areas. A decrease in stabilizing vegetation, either through natural processes or human influence, increases the potential of detrital material being eroded and deposited in natural sinks as flood layers. Although riverine and lacustrine floods are caused by the same underlying mechanisms, a direct comparison between the two should be made with caution. Due to their considerably larger catchments and higher hydrodynamic states, flood sensitivity is much greater in rivers.
In the Eifel maar lakes, flood phases occurred throughout the Holocene and during cold phases in the Late Pleistocene:
- Holocene flood events are mainly summer floods in mild, interglacial climate conditions;
- During the early and middle Holocene, multi-centennial cycles of increased flood frequency were driven by natural processes;
- As humans settled in the Eifel region at around 3700 yr b2k and actively impacted their environment through agricultural activity, floods occurred much more frequently, peaking in the 13th and 14th centuries during the medieval agricultural revolution;
- Late Pleistocene floods occurred during the YD cold phase and Heinrich stadials, representing increased soil erosion effects due to a decline in stabilizing vegetation cover in cold and dry climates.
Supplementary Materials
The following supporting information can be downloaded at https://www.mdpi.com/article/10.3390/quat8040069/s1; Figure S1: Core photos of sediment records SMf2 (A) and UM2 (B); Figure S2: Core photo of sediment record AU3 with the Auel Cold Event (ACE) [40].
Author Contributions
Conceptualization, J.A. and F.S.; methodology, J.A.; validation, F.S.; investigation, J.A.; resources, F.S.; writing—original draft preparation, J.A.; writing—review and editing, F.S.; visualization, J.A.; supervision, F.S. All authors have read and agreed to the published version of the manuscript.
Funding
This research was funded by the Johannes Gutenberg-University of Mainz.
Data Availability Statement
All data will be downloadable at the website (www.elsa-project.de, accessed on 19 October 2025).
Acknowledgments
Drilling of core AU3 was conducted by the drilling company “Stölben Bohr” (Cochem, Germany). Drilling of Holocene cores was performed under the supervision of Klaus Schwibus, who also handled the preparation of all sediment cores. We thank Petra Sigl for her help with the illustrations. We further would like to thank the three anonymous reviewers for their thoughtful suggestions and comments on the manuscript.
Conflicts of Interest
The authors declare no conflicts of interest.
References
- Tradowsky, J.S.; Philip, S.Y.; Kreienkamp, F.; Kew, S.F.; Lorenz, P.; Arrighi, J.; Bettmann, T.; Caluwaerts, S.; Chan, S.C.; De Cruz, L.; et al. Attribution of the heavy rainfall events leading to severe flooding in Western Europe during July 2021. Clim. Change 2023, 176, 90. [Google Scholar] [CrossRef]
- Mohr, S.; Ehret, U.; Kunz, M.; Ludwig, P.; Caldas-Alvarez, A.; Daniell, J.E.; Ehmele, F.; Feldmann, H.; Franca, M.J.; Gattke, C.; et al. A multi-disciplinary analysis of the exceptional flood event of July 2021 in central Europe—Part 1: Event description and analysis. Nat. Hazards Earth Syst. Sci. 2023, 23, 525–551. [Google Scholar] [CrossRef]
- Roggenkamp, T.; Herget, J. Flood reconstruction—The unexpected rather frequent event at River Ahr in July 2021. Glob. Planet Change 2024, 240, 104541. [Google Scholar] [CrossRef]
- Flooding in Altenahr Altenburg, Rhineland-Palatinate, Germany. Available online: https://en.wikipedia.org/wiki/2021_European_floods#/media/File:Hochwasser_in_Altenahr_Altenburg.jpg (accessed on 19 October 2025).
- Glaser, R.; Stangl, H. Climate and Floods in Central Europe since AD 1000: Data, Methods, Results and Consequences. Surv. Geophys. 2004, 25, 485–510. [Google Scholar] [CrossRef]
- Glaser, R.; Riemann, D.; Schönbein, J.; Barriendos, M.; Brázdil, R.; Bertolin, C.; Camuffo, D.; Deutsch, M.; Dobrovolný, P.; van Engelen, A. The variability of European floods since AD 1500. Clim. Change 2010, 101, 235–256. [Google Scholar] [CrossRef]
- Brázdil, R.; Glaser, R.; Pfister, C.; Dobrovolny, P.; Antoine, J.-M.; Barriendos, M.; Camuffo, D.; Deutsch, M.; Enzi, S.; Guidoboni, E. Flood Events of Selected European Rivers in the Sixteenth Century. Clim. Change 1999, 43, 239–285. [Google Scholar] [CrossRef]
- Sartor, J. Zur Hochwasserhistorie der deutschen und luxemburgischen Mosel. Korresp. Wasserwirtsch. 2020, 13, 604–608. [Google Scholar] [CrossRef]
- Mauna Loa CO2 Annual Mean Data. Available online: https://gml.noaa.gov/webdata/ccgg/trends/co2/co2_annmean_mlo.txt (accessed on 19 October 2025).
- Rubino, M.; Etheridge, D.M.; Trudinger, C.M.; Allison, C.E.; Battle, M.O.; Langenfels, R.L.; Steele, L.P.; Curran, M.; Bender, M.; White, J.W.C.; et al. A revised 1000 year atmospheric δ13C-CO2 record from Law Dome and South Pole, Antarctica. J. Geophys. Res. Atmos. 2013, 118, 8482–8499. [Google Scholar] [CrossRef]
- Hersbach, H.; Bell, B.; Berrisford, P.; Biavati, G.; Horányi, A.; Muñoz Sabater, J.; Nicolas, J.; Peubey, C.; Radu, R.; Rozum, I.; et al. ERA5 Hourly Data on Single Levels from 1940 to Present. Copernicus Climate Change Service (C3S) Climate Data Store (CDS). 2023. Available online: https://cds.climate.copernicus.eu/datasets/reanalysis-era5-single-levels?tab=overview (accessed on 3 May 2023). [CrossRef]
- Brázdil, R.; Kundzewicz, Z.W.; Benito, G.; Demarée, G.; Macdonald, N.; Roald, L.A. Historical Floods in Europe in the Past Millennium. In Changes in Flood Risk in Europe; Kundzewicz, Z.W., Ed.; IAHS Press: Wallingford, UK, 2012; pp. 121–166. [Google Scholar]
- Siegenthaler, C.; Sturm, M. Die Häufigkeit von Ablagerungen extremer Reuss-Hochwasser. Die Sedimentationsgeschichte im Urnersee seit dem Mittelalter. In Ursachenanalyse der Hochwasser 1987; Bundesamt für Umwelt (BAFU): Bern, Switzerland, 1991; pp. 127–139. [Google Scholar]
- Alexandre, P. Le climat en Europe au Moyen Age. In Contribution à L’histoire des Variations Climatiques de 1000 à 1425, D’après les Sources Narratives de l’Europe Occidentale; École des Hautes Études en Sciences Sociales: Paris, France, 1987. [Google Scholar]
- Herget, J.; Kapala, A.; Krell, M.; Rustemeier, E.; Wyss, A. The millennium flood of July 1342 revisited. Catena 2015, 130, 82–94. [Google Scholar] [CrossRef]
- Kiss, A. Introduction: Floods and Water-Level Fluctuations in Medieval (Central-)Europe. In Floods and Long-Term Water-Level Changes in Medieval Hungary; Kiss, A., Ed.; Springer International Publishing: Cham, Switzerland, 2019; pp. 1–50. [Google Scholar] [CrossRef]
- Jacobeit, J.; Glaser, R.; Luterbacher, J.; Wanner, H. Links between flood events in central Europe since AD 1500 and large-scale atmospheric circulation modes. Geophys. Res. Lett. 2003, 30, 1172. [Google Scholar] [CrossRef]
- Brázdil, R.; Kundzewicz, Z.W.; Benito, G. Historical hydrology for studying flood risk in Europe. Hydrol. Sci. J. 2006, 51, 739–764. [Google Scholar] [CrossRef]
- Glur, L.; Wirth, S.B.; Büntgen, U.; Gilli, A.; Haug, G.H.; Schär, C.; Beer, J.; Anselmetti, F.S. Frequent floods in the European Alps coincide with cooler periods of the past 2500 years. Sci. Rep. 2013, 3, 2770. [Google Scholar] [CrossRef] [PubMed]
- Hoffmann, T.; Lang, A.; Dikau, R. Holocene river activity: Analysing 14C-dated fluvial and colluvial sediments from Germany. Quat. Sci. Rev. 2008, 27, 2031–2040. [Google Scholar] [CrossRef]
- Hoffmann, T.; Erkens, G.; Gerlach, R.; Klostermann, J.; Lang, A. Trends and controls of Holocene floodplain sedimentation in the Rhine catchment. CATENA 2009, 77, 96–106. [Google Scholar] [CrossRef]
- Macklin, M.G.; Benito, G.; Gregory, K.J.; Johnstone, E.; Lewin, J.; Michczyñska, D.J.; Soja, R.; Starkel, L.; Thorndycraft, V.R. Past hydrological events reflected in the Holocene fluvial record of Europe. CATENA 2006, 66, 145–154. [Google Scholar] [CrossRef]
- Kalicki, T.; Sauchyk, S.; Calderoni, G.; Simakova, G. Climatic versus human impact on the Holocene sedimentation in river valleys of different order: Examples from the Upper Dnieper basin, Belarus. Quat. Int. 2008, 189, 91–105. [Google Scholar] [CrossRef]
- Benito, G.; Mackling, M.G.; Panin, S.; Fontana, A.; Jones, A.F.; Machado, M.J.; Matlakhova, E.; Mozzi, P.; Zielhofer, C. Recurring flood distribution patterns related to short-term Holocene climatic variability. Sci. Rep. 2015, 5, 16398. [Google Scholar] [CrossRef] [PubMed]
- Bond, G.; Kromer, B.; Beer, J.; Muscheler, R.; Evans, M.N.; Showers, W.; Hoffmann, S.; Lotti-Bond, R.; Hajdas, I.; Bonani, G. Persistent Solar Influence on North Atlantic Climate During the Holocene. Science 2001, 294, 2130–2136. [Google Scholar] [CrossRef]
- Berger, A.; Loutre, M.F. Insolation values for the climates of the last 10 million years. Quat. Sci. Rev. 1991, 10, 297–317. [Google Scholar] [CrossRef]
- Macklin, M.G.; Lewin, J. River sediments, great floods and centennial-scale Holocene climate change. J. Quat. Sci. 2003, 18, 101–105. [Google Scholar] [CrossRef]
- Notebaert, B.; Verstraeten, G. Sensitivity of West and Central European river systems to environmental changes during the Holocene: A review. Earth Sci. Rev. 2010, 103, 163–182. [Google Scholar] [CrossRef]
- Rădoane, M.; Chiriloaei, F.; Sava, T.; Nechita, C.; Rădoane, N.; Gâza, O. Holocene fluvial history of Romanian Carpathian rivers. Quat. Int. 2019, 527, 113–129. [Google Scholar] [CrossRef]
- Swierczynski, T.; Lauterbach, S.; Dulski, P.; Delgado, J.; Merz, B.; Brauer, A. Mid- to late Holocene flood frequency changes in the northeastern Alps as recorded in varved sediments of Lake Mondsee (Upper Austria). Quat. Sci. Rev. 2013, 80, 78–90. [Google Scholar] [CrossRef]
- Lauterbach, S.; Chapron, E.; Brauer, A.; Huls, M.; Gilli, A.; Arnaud, F.; Piccin, A.; Nomade, J.; Desmet, M.; von Grafenstein, U.; et al. A sedimentary record of Holocene surface runoff events and earthquake activity from Lake Iseo (Southern Alps, Italy). Holocene 2012, 22, 749–760. [Google Scholar] [CrossRef]
- Wirth, S.B.; Glur, L.; Gilli, A.; Anselmetti, F.S. Holocene flood frequency across the Central Alps—Solar forcing and evidence for variations in North Atlantic atmospheric circulation. Quat. Sci. Rev. 2013, 80, 112–128. [Google Scholar] [CrossRef]
- Heinrich, H. Origin and consequences of cyclic ice rafting in the northeast Atlantic Ocean during the past 130,000 years. Quat. Res. 1988, 2, 143–152. [Google Scholar] [CrossRef]
- Lynch-Stieglitz, J.; Schmidt, M.; Gene Henry, L.; Curry, W.B.; Skinner, L.C.; Mulitza, S.; Zhang, R.; Chang, P. Muted change in Atlantic overturning circulation over some glacial-aged Heinrich events. Nat. Geosci. 2014, 7, 144–150. [Google Scholar] [CrossRef]
- Davtian, N.; Bard, E. A new view on abrupt climate changes and the bipolar seesaw based on paleotemperatures from Iberian Margin sediments. Proc. Natl. Acad. Sci. USA 2023, 120, e2209558120. [Google Scholar] [CrossRef] [PubMed]
- Genty, D.; Combourieu-Nebout, N.; Peyron, O.; Blamart, D.; Wainer, K.; Mansuri, F.; Ghaleb, B.; Isabello, L.; Dormoy, I.; von Grafenstein, U.; et al. Isotopic characterization of rapid climatic events during OIS3 and OIS4 in Villars Cave stalagmites (SW-France) and correlation with Atlantic and Mediterranean pollen records. Quat. Sci. Rev. 2010, 29, 2799–2820. [Google Scholar] [CrossRef]
- Fuhrmann, F.; Seelos, K.; Sirocko, F. Eolian Sedimentation in Central European Auel Dry Maar from 60 to 13 Ka. Quat. Res. 2021, 101, 4–12. [Google Scholar] [CrossRef]
- Prud’homme, C.; Fischer, P.; Jöris, O.; Gromov, S.; Vinnepand, M.; Hatté, C.; Vonhof, H.; Moine, O.; Vött, A.; Fitzsimmons, K.E. Millennial-timescale quantitative estimates of climate dynamics in central Europe from earthworm calcite granules in loess deposits. Commun. Earth Environ. 2022, 3, 267. [Google Scholar] [CrossRef]
- Westaway, R.; Bridgland, D.R. Causes, consequences and chronology of large-magnitude palaeoflows in Middle and Late Pleistocene river systems of northwest Europe. Earth Surf. Process Landforms 2010, 35, 1071–1097. [Google Scholar] [CrossRef]
- Albert, J.; Sirocko, F. Evidence for an extreme cooling event prior to the Laschamp geomagnetic excursion in Eifel maar sediments. Quaternary 2023, 6, 14. [Google Scholar] [CrossRef]
- Hoch- und Niedrigwasser der Mosel. Available online: https://www.puenderich.de/puenderich/dorfchronik-und-geschichte/hochwasser-und-eisgang (accessed on 19 October 2025).
- Brunck, H.; Sirocko, F.; Albert, J. The ELSA-Flood-Stack: A reconstruction from the laminated sediments of Eifel maar structures during the last 60,000 years. Glob. Planet. Change 2016, 142, 136–146. [Google Scholar] [CrossRef]
- Sirocko, F.; Martinez-García, A.; Mudelsee, M.; Albert, J.; Britzius, S.; Christl, M.; Diehl, D.; Diensberg, B.; Friedrich, R.; Fuhrmann, F.; et al. Muted Multidecadal climate variability in central Europe over the past 60,000 years. Nat. Geosci. 2021, 14, 651–658. [Google Scholar] [CrossRef]
- Albert, J.; Zander, P.D.; Grosjean, M.; Sirocko, F. Fine-Tuning of Sub-Annual Resolution Spectral Index Time Series from Eifel Maar Sediments, Western Germany, to the NGRIP δ18O Chronology, 26–60 ka. Quaternary 2024, 7, 33. [Google Scholar] [CrossRef]
- Thorndycraft, V.R.; Benito, G.; Rico, M.; Sopea, A.; Sánchez-Moya, Y.; Casas, A. A long-term flood discharge record derived from slackwater flood deposits of the Llobregat River, NE Spain. J. Hydrol. 2005, 313, 16–31. [Google Scholar] [CrossRef]
- Büchel, G. Vulkanologische Karte der West-und Hocheifel; Landesvermessungsamt Rheinland-Pfalz: Koblenz, Germany, 1994. [Google Scholar]
- Förster, M.W.; Sirocko, F. The ELSA-Tephra-Stack: Volcanic activity in the Eifel during the last 500,000 years. Glob. Planet. Change 2016, 142, 100–107. [Google Scholar] [CrossRef]
- Seelos, K.; Sirocko, F.; Dietrich, S. A continuous high-resolution dust record for the reconstruction of wind systems in central Europe (Eifel, Western Germany) over the past 133 ka. Geophys. Res. Lett. 2009, 36, L20712. [Google Scholar] [CrossRef]
- Sirocko, F.; Albert, J.; Britzius, S.; Dreher, F.; Martínez-García, A.; Dosseto, A.; Burger, J.; Terberger, T.; Haug, G. Thresholds for the presence of Glacial megafauna in central Europe during the last 60,000 years. Sci. Rep. 2022, 12, 20055. [Google Scholar] [CrossRef]
- Britzius, S.; Dreher, F.; Maisel, P.; Sirocko, F. Vegetation Patterns during the Last 132,000 Years: A Synthesis from Twelve Eifel Maar Sediment Cores (Germany): The ELSA-23-Pollen-Stack. Quaternary 2024, 7, 8. [Google Scholar] [CrossRef]
- Sirocko, F.; Krebsbach, F.; Albert, J.; Britzius, S.; Schenk, F.; Förster, M.W. Relation between the central European climate change and Eifel volcanism during the last 130,000 years: The ELSA-23 Tephra Stack. Quaternary 2024, 7, 21. [Google Scholar] [CrossRef]
- Büchel, G.; Krawczyk, E. Zur Genese der Dauner Maare im Vulkanfeld der Westeifel. Mainzer Geowiss. Mitt. 1986, 15, 219–238. [Google Scholar]
- Heinz, T.; Rein, B.; Negendank, J.F.W. Sediments and basin analysis of Lake Schalkenmehrener Maar. In Paleolimnology of European Maar Lakes. Lecture Notes in Earth Sciences; Negendank, J.F.W., Zolitschka, B., Eds.; Springer: Berlin/Heidelberg, Germany, 1993; Volume 49. [Google Scholar] [CrossRef]
- Straka, H. Die spätquartäre Vegetationsgeschichte der Vulkaneifel. Beiträge Zur Landespfl. Rheinl.-Pfalz. 1975, 3, 1–163. [Google Scholar]
- Fritz, T. Varvenchronologie der Letzten 1000 Jahre Anhand Ausgewählter Eifelmaare (Holzmaar, Schalkenmehrener Maar, Ulmener Maar). Diploma Thesis, Johannes Gutenberg University, Mainz, Germany, 2011. [Google Scholar]
- Sirocko, F.; Knapp, H.; Dreher, F.; Förster, M.W.; Albert, J.; Brunck, H.; Veres, D.; Dietrich, S.; Zech, M.; Hambach, U.; et al. The ELSA-Vegetation-Stack: Reconstruction of Landscape Evolution Zones (LEZ) from laminated Eifel maar sediments of the last 60,000 years. Glob. Planet Change 2016, 142, 108–135. [Google Scholar] [CrossRef]
- Sirocko, F.; Dietrich, S.; Veres, D.; Grootes, P.; Schaber-Mohr, K.; Seelos, K.; Nadeau, M.-J.; Kromer, B.; Rothacker, L.; Röhner, M.; et al. Multi-Proxy-Dating of Holocene maar lakes and Pleistocene dry maar sediments in the Eifel, Germany. Quat. Sci. Rev. 2013, 62, 56–72. [Google Scholar] [CrossRef]
- Rasmussen, S.O.; Bigler, M.; Blockley, S.P.; Blunier, T.; Buchardt, S.L.; Clausen, H.B.; Cvijanovic, I.; Dahl-Jensen, D.; Johnsen, S.J.; Fischer, H.; et al. A stratigraphic framework for abrupt climatic changes during the Last Glacial period based on three synchronized Greeland ice-core records: Refining and extending the INTIMATE event stratigraphy. Quat. Sci. Rev. 2014, 106, 14–28. [Google Scholar] [CrossRef]
- Steinhilber, F.; Abreu, J.A.; Beer, J.; Brunner, I.; Christl, M.; Fischer, H.; Heikkilä, U.; Kubik, P.W.; Mann, M.; McCracken, K.G.; et al. 9400 years of cosmic radiation and solar activity from ice cores and tree rings. Proc. Natl. Acad. Sci. USA 2012, 109, 5967–5971. [Google Scholar] [CrossRef]
- Zander, P.D.; Böhl, D.; Sirocko, F.; Auderset, A.; Haug, G.; Martínez-García, A. Reconstruction of warm season temperatures in central Europe during the past 60,000 years from lacustrine GDGTs. Clim. Past 2023, 20, 841–864. [Google Scholar] [CrossRef]
- Monnin, E.; Indermühle, A.; Dällenbach, A.; Flückiger, J.; Stauffer, B.; Stocker, T.F.; Raynaud, S.; Barnola, J.-M. Atmospheric CO2 Concentrations over the Last Glacial Termination. Science 2001, 291, 112–114. [Google Scholar] [CrossRef]
- Monnin, E.; Steig, E.J.; Siegenthaler, U.; Kawamura, K.; Schwander, J.; Stauffer, B.; Stocker, T.F.; Morse, D.L.; Barnola, J.-M.; Bellier, B.; et al. Evidence for substantial accumulation rate variability in Antarctica during the Holocene, through synchronization of CO2 in the Taylor Dome, Dome C and DML ice cores. Earth Planet. Sci. Lett. 2004, 224, 45–54. [Google Scholar] [CrossRef]
- MacFarling Meure, C.; Etheridge, D.; Trudinger, C.; Steele, P.; Langernfelds, R.; van Ommen, T.; Smith, A.; Elkins, J. Law Dome CO2, CH4 and N2O ice core records extended to 2000 years BP. Geophys. Res. Lett. 2006, 33, L14810. [Google Scholar] [CrossRef]
- Marcott, S.A.; Bauska, T.K.; Buizert, C.; Steig, E.J.; Rosen, J.L.; Cuffey, K.M.; Fudge, T.; Severinghaus, J.P.; Ahn, J.; Kalk, M.L.; et al. Centennial-scale changes in the global carbon cycle during the last deglaciation. Nature 2014, 514, 616–619. [Google Scholar] [CrossRef]
- Bereiter, B.; Lüthi, D.; Siegrist, M.; Schüpbach, S.; Stocker, T.F.; Fischer, H. Mode change of millennial CO2 variability during the last glacial cycle associated with a bipolar marine carbon seesaw. Proc. Natl. Acad. Sci. USA 2012, 109, 9755–9760. [Google Scholar] [CrossRef]
- Ahn, J.; Brook, E.J. Siple Dome ice reveals two modes of millennial CO2 change during the last ice age. Nat. Commun. 2014, 5, 3723. [Google Scholar] [CrossRef]
- Naafs, B.D.A.; Hefter, J.; Grützner, J.; Stein, R. Warming of surface waters in the mid-latitude North Atlantic during Heinrich events. Paleoceanography 2013, 28, 153–163. [Google Scholar] [CrossRef]
- Naughton, F.; Sánchez-Goñi, M.F.; Landais, A.; Rodrigues, T.; Vazquez Riveiros, N.; Toucanne, S. Chapter 7—The Younger Dryas Stadial. In European Glacial Landscapes. The Last Deglaciation; Palacios, D., Hughes García-Ruiz, J.M., Hughes, P.D., Andrés, N., Eds.; Elsevier: Amsterdam, The Netherlands; Oxford, UK; Cambridge, MA, USA, 2022; pp. 51–57. [Google Scholar] [CrossRef]
- García-Ruiz, J.M. The effects of land uses on soil erosion in Spain: A review. Catena 2010, 81, 1–11. [Google Scholar] [CrossRef]
- Oktan, E.; Kezik, U.; Hacisalihoglu, S.; Yucesan, Z. Effects of Deforestation on Soil Erosion and Carbon Sequestration in the Soil. Fresenius Environ. Bull. 2022, 31, 2239–2249. [Google Scholar]
- Pedro, J.B.; Andersson, C.; Vettoretti, G.; Voelker, A.H.L.; Waelbroeck, C.; Dokken, T.M.; Jensen, M.F.; Rasmussen, S.O.; Sessford, E.G.; Jochum, M.; et al. Dansgaard-Oeschger and Heinrich event temperature anomalies in the North Atlantic set by sea ice, frontal position and thermocline structure. Quat. Sci. Rev. 2022, 289, 107599. [Google Scholar] [CrossRef]
- Sánchez Goñi, M.F.; Fourcade, T.; Salonen, S.; Lesven, J.; Frigola, J.; Swingedouw, D.; Sierro, F.J. Muted cooling and drying of NW Mediterranean in response to the strongest last glacial North American ice surges. GSA Bull. 2020, 133, 451–460. [Google Scholar] [CrossRef]
- Clark, P.U.; Dyke, A.S.; Shakun, J.D.; Carlson, A.E.; Clark, J.; Wohlfarth, B.; Mitrovica, J.X.; Hostetler, S.W.; Mc-Cabe, A.M. The Last Glacial Maximum. Science 2009, 325, 710–714. [Google Scholar] [CrossRef]
- Seguinot, J.; Ivy-Ochs, S.; Jouvet, G.; Huss, M.; Funk, M.; Preusser, F. Modelling last glacial cycle ice dynamics in the Alps. Cryosphere 2018, 12, 3265–3285. [Google Scholar] [CrossRef]
- Bekaert, D.V.; Blard, P.-H.; Raoult, Y.; Pik, R.; Kipfer, R.; Seltzer, A.M.; Legrain, E.; Marty, B. Last glacial maximum cooling of 9 °C in continental Europe from a 40 kyr-long noble gas paleothermometry record. Quat. Sci. Rev. 2023, 310, 108123. [Google Scholar] [CrossRef]
- Liakka, J.; Löfverström, M.; Colleoni, F. The impact of the North American glacial topography on the evolution of the Eurasian ice sheet over the last glacial cycle. Clim. Past 2016, 12, 1225–1241. [Google Scholar] [CrossRef]
- Fuhrmann, F.; Diensberg, B.; Gong, X.; Lohmann, G.; Sirocko, F. Aridity synthesis for eight selected key regions of the global climate system during the last 60,000 years. Clim. Past 2020, 16, 2221–2238. [Google Scholar] [CrossRef]
- Toucanne, S.; Soulet, G.; Freslon, N.; Silva Jacinto, R.; Dennielou, B.; Zaragosi, S.; Eynaud, F.; Bourillet, J.-F.; Bayon, G. Millennial-scale fluctuations of the European Ice Sheet at the end of the last glacial, and their potential impact on global climate. Quat. Sci. Rev. 2015, 123, 113–133. [Google Scholar] [CrossRef]
- McManus, J.; Francois, R.; Gherardi, J.M.; Keigwin, L.D.; Brown-Leger, S. Collapse and rapid resumption of Atlantic meridional circulation linked to deglacial climate changes. Nature 2004, 428, 834–837. [Google Scholar] [CrossRef]
- Schmittner, A.; Galbraith, E.D. Glacial greenhouse-gas fluctuations controlled by ocean circulation changes. Nature 2008, 456, 373–376. [Google Scholar] [CrossRef]
- Bard, E.; Rostek, F.; Turon, J.L.; Gendreau, S. Hydrological impact of Heinrich events in the subtropical northeast Atlantic. Science 2000, 289, 1321–1324. [Google Scholar] [CrossRef]
- Eynaud, F.; Malaizé, B.; Zaragosi, S.; de Vernal, A.; Scourse, J.; Pujol, C.; Cortijo, E.; Grousset, F.E.; Penaud, A.; Toucanne, S.; et al. New constraints on European glacial freshwater releases to the North Atlantic Ocean. Geophys. Res. Lett. 2012, 39, L15601. [Google Scholar] [CrossRef]
- Naughton, F.; Sánchez Goñi, M.F.; Kageyama, M.; Bard, E.; Duprat, J.; Cortijo, E.; Desprat, S.; Malaizé, B.; Joly, C.; Rostek, F.; et al. Wet to dry climatic trend in north western Iberia within Heinrich events. Earth Planet. Sci. Lett. 2009, 284, 329–342. [Google Scholar] [CrossRef]
- Naughton, F.; Toucanne, S.; Landais, A.; Rodrigues, T.; Vazquez Riveiros, N.; Sánchez-Goñi, M.F. Chapter 5—Heinrich Stadial 1. In European Glacial Landscapes. The Last Deglaciation; Palacios, D., Hughes García-Ruiz, J.M., Hughes, P.D., Andrés, N., Eds.; Elsevier: Amsterdam, The Netherlands; Oxford, UK; Cambridge, MA, USA, 2022; pp. 37–44. [Google Scholar] [CrossRef]
- Ritz, S.P.; Stocker, T.F.; Grimalt, J.; Menviel, L.; Timmermann, A. Estimated strength of the Atlantic overturning circulation during the last deglaciation. Nat. Geosci. 2013, 6, 208–212. [Google Scholar] [CrossRef]
- Obreht, I.; Wörmer, L.; Brauer, A.; Wendt, J.; Alfken, S.; De Vleeschouwer, D.; Elvert, M.; Hinrichs, K.-W. An annually resolved record ofWestern European vegetation response to Younger Dryas cooling. Quat. Sci. Rev. 2020, 231, 106198. [Google Scholar] [CrossRef]
- Schenk, F.; Väliranta, M.; Muschitiello, F.; Tarasov, L.; Heikkilä, M.; Björck, S.; Brandefelt, J.; Johansson, A.V.; Näslund, J.-O.; Wohlfarth, B. Warm summers during the Younger Dryas cold reversal. Nat. Commun. 2018, 9, 1634. [Google Scholar] [CrossRef]
- Müller, D.; Tjallingii, R.; Płóciennik, M.; Luoto, T.P.; Kotrys, B.; Plessen, B.; Ramisch, A.; Schwab, M.J.; Błaszkiewicz, M.; Słowiński, M.; et al. New insights into lake responses to rapid climate change: The Younger Dryas in Lake Gościąż, central Poland. Boreas 2021, 50, 535–555. [Google Scholar] [CrossRef]
- Brauer, A.; Haug, G.H.; Dulski, P.; Sigman, D.M.; Negendank, J.F.W. An abrupt wind shift in western Europe at the onset of the Younger Dryas cold period. Nat. Geosci. 2008, 1, 520–523. [Google Scholar] [CrossRef]
- Reinig, F.; Wacker, L.; Jöris, O.; Oppenheimer, C.; Guidobaldi, G.; Nievergelt, D.; Adolphi, F.; Cherubini, P.; Engels, S.; Esper, J.; et al. Precise date for the Laacher See eruption synchronizes the Younger Dryas. Nature 2021, 595, 66–69. [Google Scholar] [CrossRef]
- Rach, O.; Brauer, A.; Wilkes, H.; Sachse, D. Delayed hydrological response to Greenland cooling at the onset of the Younger Dryas in western Europe. Nat. Geosci. 2014, 7, 109–112. [Google Scholar] [CrossRef]
- Brisset, E.; Guiter, F.; Miramont, C.; Troussier, T.; Sabatier, P.; Poher, Y.; Cartier, R.; Arnaud, F.; Malet, E.; Anthony, E.J. The overlooked human influence in historic and prehistoric floods in the European Alps. Geology 2017, 45, 347–350. [Google Scholar] [CrossRef]
- Hamerow, H.; Zerl, T.; Stroud, E.; Bogaard, A. The cerealisation of the Rhineland: Extensification, crop rotation and the medieval ‘agricultural revolution’ in the longue durée. Germania 2022, 99, 157–184. [Google Scholar] [CrossRef]
Disclaimer/Publisher’s Note: The statements, opinions and data contained in all publications are solely those of the individual author(s) and contributor(s) and not of MDPI and/or the editor(s). MDPI and/or the editor(s) disclaim responsibility for any injury to people or property resulting from any ideas, methods, instructions or products referred to in the content. |
© 2025 by the authors. Licensee MDPI, Basel, Switzerland. This article is an open access article distributed under the terms and conditions of the Creative Commons Attribution (CC BY) license (https://creativecommons.org/licenses/by/4.0/).