1. Introduction
The term
“Named Entity” was first introduced in 1996 in the Sixth Message Understanding Conference (MUC-6) [
1] with relation to textual information extraction for commercial and defense purposes. In general, Named-Entity Recognition (NER) is concerned with the automatic scanning through unstructured digital text in order to locate
“entities” and classify them into categories/classes. In the linguistic domain, such classes can correspond to person names, organizations (e.g., companies), government organizations, committees, location names (e.g., cities or countries) or date/time expressions [
2].
In contrast, biomedical named-entity recognition (BioNER) involves different types of terms that correspond to biologically important entities. Such entities can range from genes/proteins, drugs/chemicals/toxins, diseases, organs, metabolites and species to adverse drug effects, SNPs (single-nucleotide polymorphisms), pathways, DNA/RNA sequences, mutations or MeSH (Medical Subject Headings) [
3]. NER started becoming prominent in biomedicine because the biological fields continue to produce a vast amount of digital data on online platforms as journal articles and biological databases [
4]. As of 2020, PubMed [
5] reports housing over 30 million citations and abstracts, while Medline [
6] claims to hold over 25 million references to life science and biomedicine articles in their databases. Undoubtedly, such large masses of literature can make it impossible for researchers to keep up, even in more specialized biomedical topics, such as the influence of diet on diseases. Furthermore, BioNER is also a primitive step in mining interactions and associations between biological entities, automated diagnosis systems, healthcare support chatbots and other biomedical text mining tasks [
7]. Hence, using computational methods to narrow down the search space through BioNER can reduce the tediousness of analyzing the digital biomedical literature.
There are currently several sophisticated BioNER tools that can tag biomedical entities such as genes, proteins, diseases, chemicals, species, cell types and cell lines. However, systems that can annotate articles for food and dietary constituents are scarce. Currently, there exist only a few food named-entity recognition tools for this task: namely, FoodIE [
8], NCBO Annotator [
9], and the UCREL Semantic Analysis System (USAS) [
10]. Even these systems are only capable of tagging general food names but not terms that relate to nutrition (e.g., calcium, iron, riboflavin, biotin) or phytochemicals (non-nutritive dietary constituents such as alkaloids, organosulfides, carotenoids and flavonoids). While general food NER applications might be content with simple food named-entity extraction, specific biomedical domain applications may need higher-level dietary constituent identification. For example, currently, there is much attention paid to understanding how dietary constituents such as phytochemicals can interact with chronic diseases such as diabetes [
11,
12] and cardiovascular disease [
13] and how different food constituents such as anti-oxidants can promote health benefits for general well-being [
14,
15,
16,
17,
18]. In order to explore such research areas, with the help of the biomedical literature, it is vital to have a food and dietary named-entity system capable of extracting both nutritive and non-nutritive constituents in food.
In general, modeling methods in BioNER can be divided into four categories: rule-based models, dictionary-based models, machine learning based models and hybrid models [
19]. However, in the last decade, the focus has shifted toward using either entirely machine learning approaches or hybrid models combining rules or dictionaries with machine learning methods. The main disadvantage of rule-based approaches is that, unlike decision trees or statistical modeling, rules are handcrafted from scratch, which is time-consuming, laborious and subjective. However, if the categories are well defined with low ambiguities, it is possible to create a meticulous and thorough rule-based system that produces high-quality results. Interestingly, the current state-of-the-art (SOTA) food annotator FoodIE [
8] also belongs to this model category. Specifically, FoodIE uses a rule-based approach to extract generic food named entities from food recipes. In this approach, the text is first tagged for part-of-speech (POS) using two taggers and then tagged for semantic tags using the UCREL Semantic Analysis System (USAS). Hence, FoodIE creates sets of rules to tag food entities using semantic tags.
In contrast, a dictionary-based method uses domain-specific taxonomy sources such as databases and ontologies to detect and extract named-entities. Widely used in hybrid SOTA biomedical NERs due to their simple design yet high precision, this approach only requires a well-developed biomedical entity dictionary and well-defined matching criteria. These dictionaries may contain direct terms, spelling variations, trigger words or access to ontologies to improve coverage. Furthermore, the matching criteria can be exact, partial or fuzzy to accommodate term variations. While precision is usually high in these systems, recall tends to depend on the dictionary’s quality and quantity used for the system. This is a general drawback of a dictionary approach [
20]. A prominent dictionary-based BioNER model that can tag several types of biological entities is Polysearch [
3]. It contains several thesauri instead of only dictionaries for each class of entities, such that term normalization is also possible using matching criteria. As an example that can also annotate food entities, the NCBO (National Center for Biomedical Ontology) Annotator [
9] is an ontology-based biomedical named entity tagger that can also tag food. This system allows the option to specify which ontology/UMLS (Unified Medical Language System) concept to use for the tagging. Furthermore, it includes several food-related ontologies to select from.
When it comes to machine learning approaches, supervised learning dominates the literature heavily, while few semi-supervised and unsupervised learning-based approaches can be found. The earliest machine learning approaches for BioNER focused on Support Vector Machines (SVM) [
21], Hidden Markov Models (HMM) [
22] and Naive Bayesian methods [
23]. However, most BioNER research currently focuses on hybrid models. Hence, such BioNER systems are primarily hybrids of machine learning with either rules or dictionaries [
7,
24]. Incidentally, the milestone publication by [
25] about Conditional Random Fields (CRFs) has presented one of the simplest yet most powerful approaches for named-entity recognition. CRFs are a class of conditionally trained finite state machines that result in graphical models similar to Hidden Markov Models (HMM). However, they differ from HMMs due to their undirected graph structure and the conditional probability that considers the dependencies between input data instead of assuming them to be independent as in the HMM learning approach. In general, it is known that CRFs perform well with sequential data [
26]. Interestingly, despite the recent interest in deep learning approaches, the only method for food entities is BuTTER [
27], which is based on a bidirectional long-short term memory (LSTM).
However, recently, there has been a general shift towards deep learning neural network models and hence in BioNER as well [
7,
28]. So far, feed-forward neural networks (FFNN) [
29], convolution neural networks (CNN) [
30] and recurrent neural networks (RNN) have been applied successfully in the BioNER domain. However, RNN models such as LSTMs and bidirectional LSTMs have been in the limelight recently because they perform well with sequential data and language modeling [
31]. Interestingly, recent approaches have also combined Bi-LSTM with CRF to produce models that can identify term boundaries [
32,
33,
34,
35,
36,
37]. In general, the majority of the SOTA BioNER tools are hybrid models using combinations of the three approaches mentioned above to annotate the text. Since dictionary and rule-set methods produce high precision and machine learning approaches show higher recall, a carefully designed hybrid approach can produce better F-scores.
In this paper, we introduce three BioNER models for food and dietary constituents named-entity recognition. Specifically, we study a dictionary-based model, a conditional random fields (CRF) model and a hybrid model, called FooDCoNER (Food and Dietary Constituents Named-Entity Recognition), which combines the former two models. We study these together with four deep language models: BERT, BioBERT, RoBERTa and ELECTRA. In addition, we compare our results with models from the literature, including FoodIE [
8], NCBO Annotator [
9] and BuTTER [
27]. These models cover the most frequent analysis paradigms for BioNER systems; i.e., dictionary-based, rule-based, machine learning-based and hybrid approaches. For all models, we conduct a comparative analysis. From estimating learning curves for the BioNER models, we obtain insights about the generalization error of the models and their learning efficiency with respect to the size of the training data [
38].
We organize the paper as follows. In the next section, we present our materials and methods, describing the model architectures for each model in detail, and further illustrate the steps used in the development of the models. The section following illustrates the results for the individual models, the hybrid model and the transfer learning models. Then, a discussion addresses the main observations and the outcome of all models, with our conclusion addressing possible future work.
2. Methods
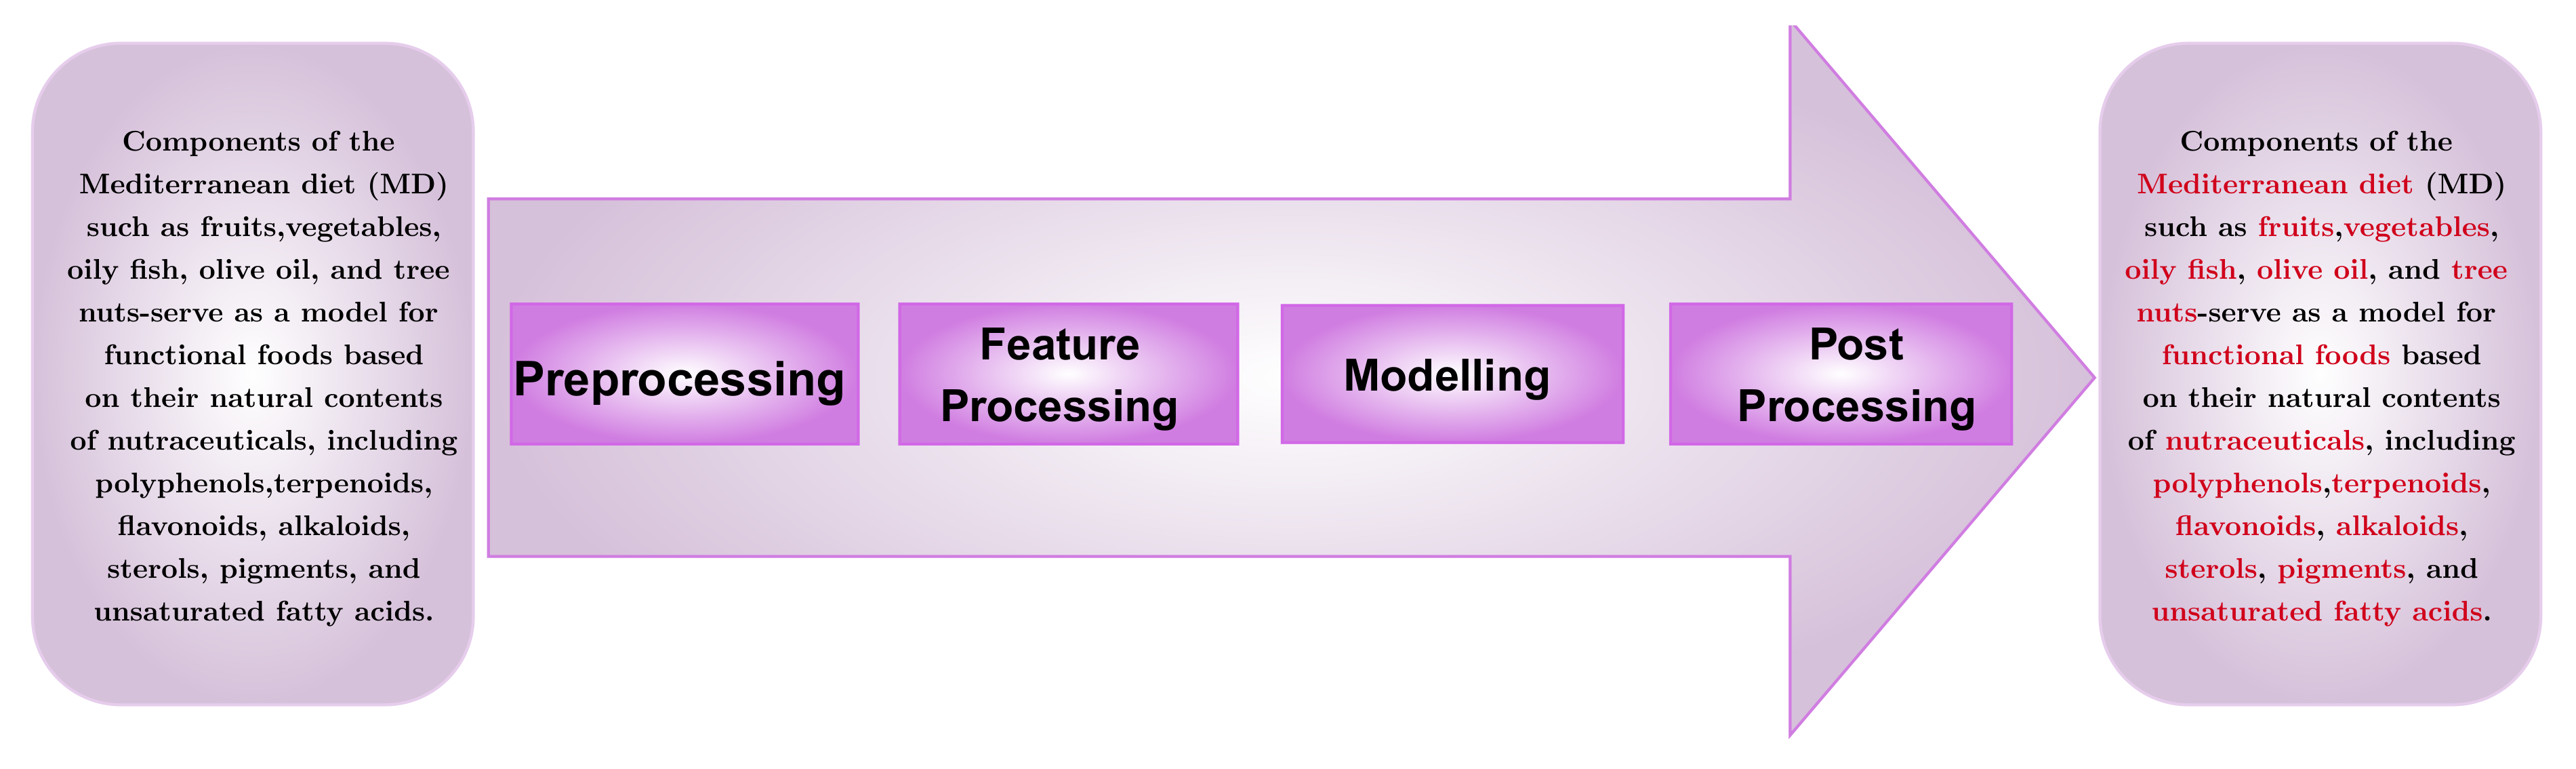
In this section, we discuss the data and models used for our analysis. Specifically, we start by discussing the data and then the error measures for assessing the models. Finally, we describe three different models we use as dietary named-entity recognition systems. The general overview of the analysis pipeline of a BioNER system is visualized in
Figure 1.
2.1. Data
For training the conditional random fields and for the overall evaluation of all BioNER systems, we used the FoodBase [
39] corpus. In order to create a dictionary with as many terms as possible, we selected three sources:
Food-Biomarker Ontology (FOBI) [
40]: The Food-Biomarker Ontology (FOBI) is an ontology composed of two inter-connected ontologies: food entities and their metabolic constituents or phytochemical bio-markers. The database contains 1197 terms in 13 food top-level classes and 11 biomarker top-level classes. We incorporated all the terms in our dictionary, including over 350 food item names.
Food database (FooDB) [
41]: The FooDB database claims to be the world’s largest and most comprehensive database on food and dietary constituents, with each food entry containing the composition, physiological and biochemical information of food. It is noteworthy to mention that this database contains 675 scientific food names and 797 food terms, both of which are included in our final dictionary. FooDB also houses a vast collection of terms for chemical and metabolic compounds found in food, with over 70,926 entries.
Food database (Food Data Central) [
42]: The Food Data Central database, managed by the United States’ Agricultural Research Services, is a database that includes information on food and nutrients in several categories including 159 foundation food terms, 7793 standard reference legacy food terms and 64 food and nutrient terms for dietary studies, all of which have been incorporated in our dictionary.
All of the chosen entities from these three databases were manually checked, cleaned and normalized to prevent repetitions and typos. Overall, our dictionary contains 20,000 entries, with 600 scientific terms, over 1000 generic food and flavor terms, 4500 phytochemical and nutrition terms and 14,000 chemical compound names identified in food collectively extracted from the above sources.
For training the machine learning model and to evaluate our entire BioNER system, we use the FoodBase corpus [
39] with 1000 annotated recipe articles. The dataset consists of 200 articles, each from five categories—namely,
appetizers and snacks,
drinks,
dessert,
dinner and
breakfast and lunch—with over 12,500 annotations and 2100 unique food items. It is considered a gold-standard for food-related machine learning tasks [
8,
39,
43].
Figure 2 shows the number of entities in the FoodBase corpus depending on their occurrence frequency. As one can see, the majority of entities occur less than 100 times.
2.2. Error Measures
In order to compare the models studied in this paper, we use various error measures. In the following, we describe some frequently used scoring metrics used for NER.
Specifically, F-score, precision and recall are general error measures for binary classification [
2,
44]. These metrics are defined as follows [
45]:
Despite the frequent usage of these error measures, it is known that in cases of unbalanced data, they lead to biased results. This is also of relevance for our study; e.g., for predicting boundaries of named entities in the IOB format. Here, the IOB format corresponds to (
Inside–
Outside–
Beginning) of named entities, giving a multi-segment representation. Naturally, the number of “O” (outside) segments is greater than “I” (inside) or “B” (beginning). Hence, the class numbers in “I”, “O” and “B” are strongly unbalanced. To alleviate this problem, one can use the
balanced accuracy for each class (I, O, B); i.e., one forms a binary classification predicting “one” against the “rest”. The balanced accuracy is defined as
Here, the sensitivity is the recall (or the true positive rate) of the system, and the specificity is the true negative (TN) rate of the system [
46]. The balanced accuracy gives a less biased overall score for the unbalanced problem in contrast to the F-score.
Interestingly, for assessing NER systems, there is an additional problem which is related to the “degree of correctness” of a prediction. Specifically, for a general classification problem, one can either have a true positive (TP), false positive (FP), false negative (FN) or true negative (TN). That means that a prediction leads only to one of these four entities but not multiple ones. However, for NER systems, the situation is a bit different. To illustrate this problem, let us consider the food named-entity “baked Parmesan chicken”. If we only require the system to return generic food items, returning a single term such as “Parmesan” or “chicken” would be considered a true positive. However, if we are concerned with the preparation of food—i.e., “baked chicken” vs. “fried chicken” for health purposes—then returning only “chicken” cannot be considered a true positive.
One solution to the above problem is to relax the matching criteria; e.g., allowing partial, left or right matching, depending on the requirements of our application [
47]. Practically, a multi-segment representation model can be used to detect term boundaries leading to a model that tags each word as
Inside,
Outside,
Beginning,
Ending,
Single,
Rear or
Front, to indicate where the named entities start and end. Previously used multi-segment representation models are IOB, IOBES, IOE, IOE or FROBES [
48,
49]. In this study, we use the IOB format.
2.3. Dictionary-Based Model
The dictionary-based method uses domain-specific taxonomy sources such as databases and ontologies to detect and extract named entities. Widely used in hybrid SOTA biomedical NERs due to their simple design yet high precision, this approach only requires a well-developed biomedical entity dictionary and well-defined matching criteria. These dictionaries may contain direct terms, spelling variations, trigger words or access to ontologies to improve coverage, whereas the matching criteria can be exact, partial or fuzzy to accommodate term variations. While precision is higher in these systems, recall tends to depend on the quality and quantity of the dictionary used for the system, which is one major drawback of the dictionary approach. The reason for implementing a dietary entity recognition system with a dictionary-based model first was encouraged by the current lack of labeled data sets with annotations for food constituents and nutrition information, as mentioned above.
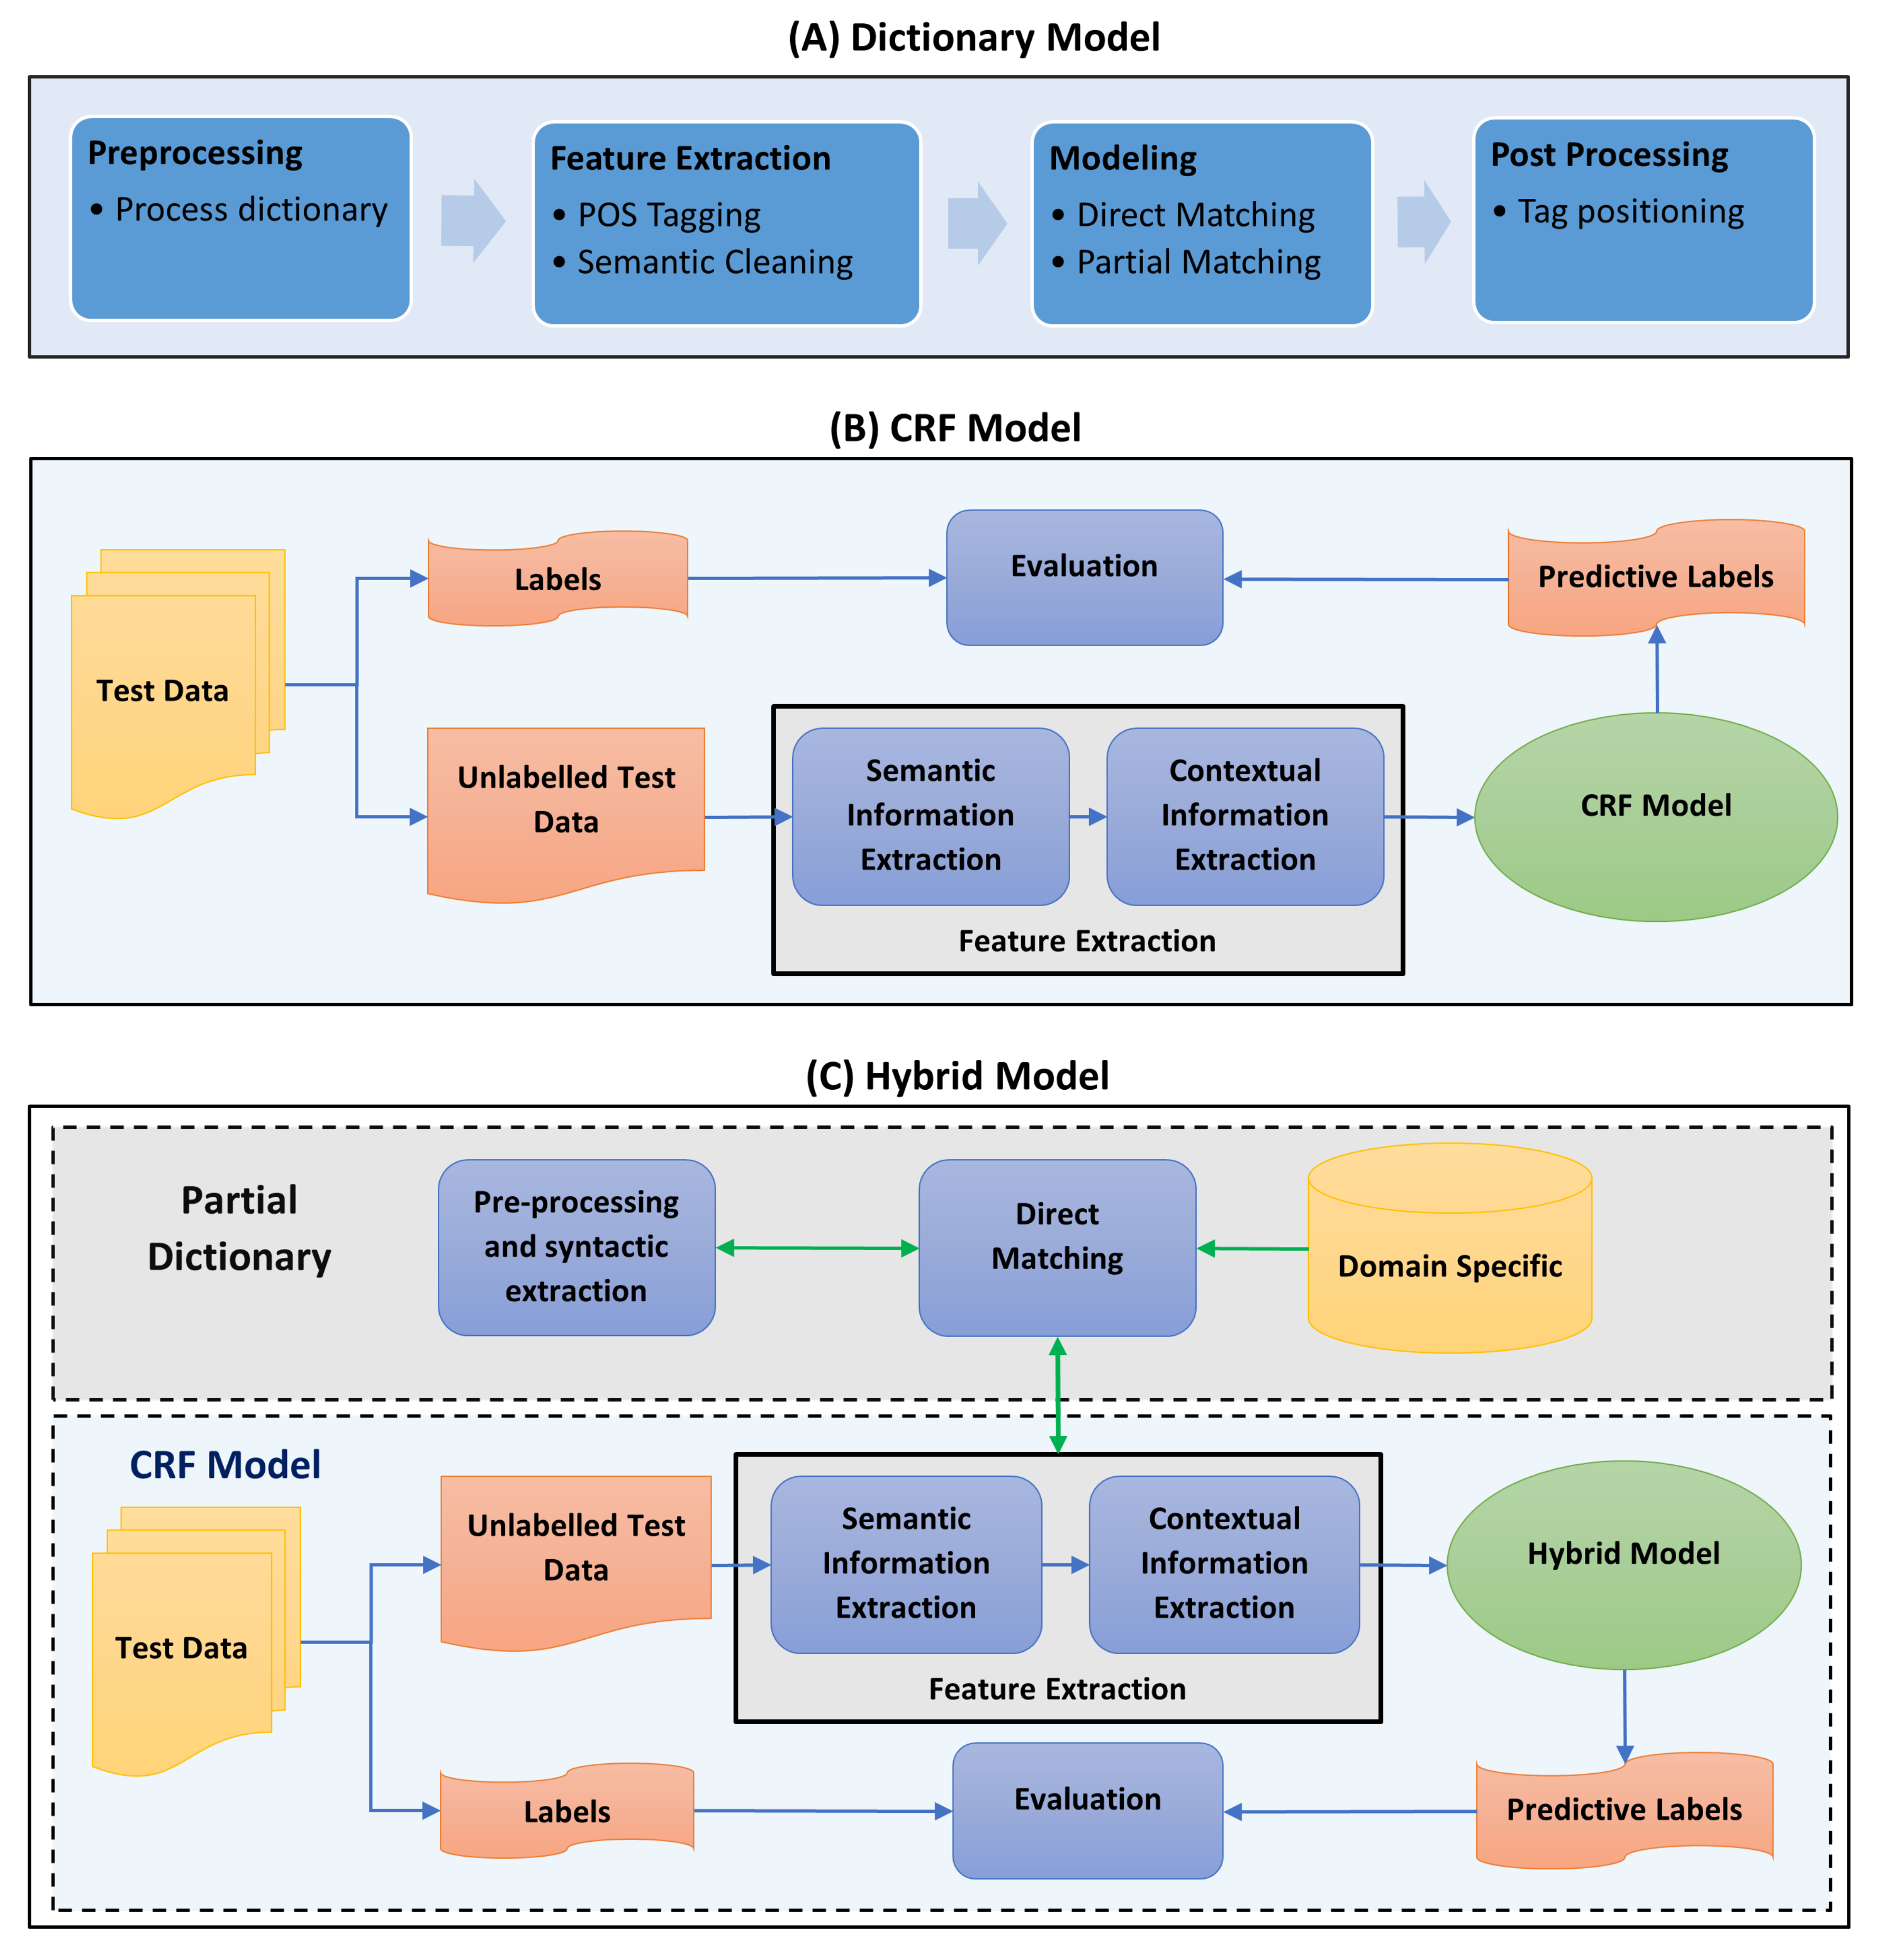
Figure 3 illustrates a summarized step-by-step look into the process used for the dictionary model.
As explained earlier, we first composed an exhaustive list of possible food and dietary constituents, including naturally available food ingredients (vegetables, fruits, herbs, grains) and their scientific names, natural food flavoring (such as garlic, ginger, vanilla beans), artificial generic and branded food ingredients (sweeteners, flavoring agents), prepared food and ingredients (such as sauces, dips, types of pasta, noodles, dishes and types of bread), nutritional constituents (such as vitamins and minerals) and organic food constituents (such as acids, sugars, tannin, carotene).
The pipeline structure for the model contains three feature extraction steps where rich text articles are cleaned, tagged for parts-of-speech (POS) labels and cleaned semantically. Since the corpus already contains sentence structures ideal for parts-of-speech analysis, the text cleaning step retains the majority of sentence syntax, including standard punctuation. It only removes unrecognizable characters and whitespaces (including tabs and newlines separating paragraphs) before converting the text into the lowercase format.
Next, the POS tags are extracted for the tokens using SpaCy [
50]—an industrial-strength open-source natural language processing (NLP) tool for python with a R wrapper
spacyr. Given that, generally, named entities tend to appear in the text as nouns or noun-phrases, we use SpaCy to extract common nouns, proper nouns and noun phrases in each document. Since extra-long noun phrases can result in false positive or false negative annotations, only noun phrases up to three-grams are used. By checking the FoodBase database, we find that
of the annotations are three-grams or shorter, and only 55 out of the 12,844 annotations are over three-grams. Hence, this filtering does not have a severe influence. Finally, we clean the extracted list of nominal phrases for stopwords using the English stopword list in the R package
quanteda [
51] and generate the lemma for each word using spacyr. Both original and lemmatized versions of the nominal phrases are then added to a nominal phrases list.
The modeling step for the dictionary model consists of defining the matching criteria between terms and dictionary items. Thus, we separate the matching step into two stages. First, the words in the nominal phrase list are directly matched with the dictionary items. The second step is slightly complicated in the sense that we try to see if the directly matched terms, in the above step, could still be partially available in the nominal phrase list. For example, if the noun cheese is a direct match, other expressions in the text such as cream cheese, provolone cheese, blue cheese, even if not matched directly to the dictionary, must be considered as an NE term. As such, partial matching assures that such terms are not missed. Unfortunately, at this point, the system does not resolve mismatches due to typos or different spelling.
The post-processing step here aims at resolving linguistic issues that occur during the feature extraction steps that otherwise might possibly lead to false positives. It also scans for named entities that have been discovered before but are not tagged in repeated locations. Finally, the model returns the text, with annotated terms and their positions, as a data frame.
2.4. Conditional Random Fields Model
Conditional random fields (CRFs) are discriminative graphical models that have shown excellent results for other biomedical entity recognition tasks [
52,
53]. For this reason, we implemented a CRF model for our food entity recognition task (used individually and as a hybrid model with dictionaries; see next section).
Assume that
represents the random variable of the data sequence to be labeled and
is the random variable representing the label sequence of
X.
Y is assumed to range over a all possible values of the labels
y. For example, if
X is a sequence of a natural language text, and
Y is the sequence of labels that defines the part-of-speech (POS) tag for each word in the text sequence, where
y will be all possible part-of-speech tags. As such, given a text sequence
and its corresponding POS tag
, the conditional probability of state
Y for a given
X can be expressed as
Here,
represents one of the POS tags in
y corresponding to a word in
(such as a proper noun or an adjective),
is the feature function and
is the weight vector of
. Ideally, the learned
for
must be positive for features that correlate to a target label, negative for non-correlation and zero for irrelevant features. Overall, the learning process for a given training set
(where
l is the label for each
X data instance and
n is the number of training instances) can be expressed as a log likelihood maximization problem given by
Here,
the is log likelihood for the training set
D. Using the modified Viterbi algorithm assigns respective labels for the new data after the training process [
25].
Figure 3B summarizes the steps involved in the training and evaluation of the CRF model. The raw data with recipe texts and an annotated entity list are used to create the training instances and corresponding labels in the form
, where
X represents the token, and
l represents the label for each token; e.g., “B”, “I” or “O”. Next, selected features (described below) are extracted for each instance, using which the CRF model is trained and evaluated. Depending on the evaluation, we further selected or removed features to improve the model error scores.
Due to the fact that a CRF model is a supervised learning model, one needs to use labeled data to train the model. Hence, the FoodBase corpus was used since it is the only available gold-standard corpora for food named-entities. However, the text corpus was available as XML nodes consisting of each recipe text with its set of annotations (and position indices within the text), without a direct training instance to label mappings. For training a machine learning model, we need training instances with a set of features and a corresponding label for each instance; therefore, we first transformed the annotations into a form that could be used for our supervised learning model. Specifically, we split the text into tokens of words and used each word as one training instance, thus splitting the 1000 articles results into nearly 108,000 instances. Each instance was labeled using the annotation position data from the XML nodes for cross-reference. Two types of corresponding labels were extracted: a multi-segment representation of the form IOB (Inside–Outside–Beginning), and binary labels where “0”s correspond to non-entity words and “1”s signify named-entity words.
Since most biomedical NER systems use rich features such as POS tags and dependency relations with CRFs, we also use both as primary features for our CRF model. Furthermore, we included two simple features: namely, words categorized as a noun POS and words that are part of a noun-phrase. This choice was motivated by our observation for the dictionary-based method, where nouns and noun-phrases played an important role in identifying named entities. Other features that signify contextual information including predecessor and successor tokens of each instance, two previous and next neighbors’ POS tags and finally the dependency type of the current token and its immediate dependents were added to the attribute list of the CRF model. Hence, in total, we used 12 features for training: namely “is a noun”, “if a nounphrase, the segments in IOB”, “current dependency relation”, “dependency relation of the preceding token”, “current (t) token text”, “previous (t − 1) token”, “next (t + 1) token”, “current (p) POS tag”, “previous (p − 1) POS tag”, “previous (p − 2) POS tag”, “next (p + 1) POS tag” and “next (p + 2) POS tag”.
For the implementation and the training of the model, we used the CRFSuite package [
54], because it provides an excellent training algorithm and an efficient implementation, resulting in fast training and tagging. CRFSuite uses a data frame as input, whereas the features correspond to columns and the labels to rows, and then learns a linear-chain CRF model using forward and backward learning to incorporate both current and previous context for the learning. We train the CRF models for 200 iterations with the limited-memory Broyden–Fletcher–Goldfarb–Shanno (LBFGS) algorithm [
55] and both L1 and L2 regularization because our numerical analysis showed that using both at
gives more stable and higher F-scores. In contrast, only using L1 gave worse results, and using only L2 gave higher standard errors. We set the minimum frequency of a feature value to two; i.e., features that occurred only once were not used for training the model (for example, if a POS tag, e.g., NOUN, PUNC, VERB, DET, CONJ or PROPN, only appeared in one training instance, it would not be used for the training of the CRF model).
2.5. Hybrid Model: FooDCoNER
Our final model, FooDCoNER (Food and Dietary Constituents Named Entity Recognition), used for our analysis is a hybrid model. FooDCoNER combines a CRF model with a dictionary plugged-in at the feature extraction step, indicating which terms are in the dictionary and which terms are not. The idea of using such a hybrid model was encouraged by tools such as Chemspot [
56], DNorm [
53] and Gimli [
52], because all of these use a CRF model with a taxonomy dictionary and they achieve remarkable performance results. The overall architecture of our hybrid model is illustrated in
Figure 3C. Specifically, there are two parallel layers in the model. The first (top layer in
Figure 3C) is for the dictionary feature extraction from the text using a partial dictionary model, and the second (bottom layer in
Figure 3C) is for the CRF model feature extraction and evaluation (similar to
Figure 3B). The dictionary features are plugged-in at the CRF features extraction step.
With the addition of the dictionary layer as a feature for the modeling pipeline, we are able to reduce the size of the feature space. Hence, the previous 12 features were reduced to 8: namely “if a noun/nounphrase, the segments in IOB”, “current (t) token text”, “previous (t − 1) token”, “next (t + 1) token”, “current (p) POS tag”, “previous (p − 1) POS tag”, “next (p + 1) POS tag” and “is domain specific term”. By using dictionary only as a feature and reducing feature space, the efficiency of our hybrid model improved, even slightly more than the CRF-only model, as indicated in Table 6.
The training of FooDCoNER model proceeds as follows. From the preprocessed data, which are in the form of training instances and corresponding labels (see
Figure 3B), the training instances—i.e., token text—are sent through the dictionary model pipeline. In this pipeline, the text is cleaned for irrelevant characters, converted to lowercase, and processed by stopword cleaning and lemmatizing steps. Then, we match the words in the training data exactly with the dictionary data, and the results are utilized as features for the training instances. Furthermore, we also process the data with the feature extraction steps as explained in the CRF section. Both dictionary and CRF features are then used for training the CRF in the FooDCoNER model. For this, the same parameters are used as for the individual CRF model.
2.6. Fine-Tuning of Language Models Based on Deep Learning
The last years have seen a rapid interest in developing deep learning-based language models that are applicable for a vast number of natural language understanding tasks. A language model, in general, is a predictive model that creates probability distributions of a given sequence of words to appear in a natural language. In this paper, we study BERT (Bidirectional Encoder Representations from Transformers) as well as two BERT-based models: RoBERTa and BioBERT. Additionally, we discuss the ELECTRA model, an extension of BERT that requires fewer resources than BERT. All of these models were fine-tuned using the same FoodBase corpus mentioned in
Section 2.1.
Bidirectional Encoder Representations from Transformers (BERT) [
57] is a deep bidirectional language representation model based on an attentive neural transformer architecture [
58]. There are two stages in the BERT framework: pre-training and fine-tuning. During the pre-training step, the model is trained on a large corpus of unlabeled text over different tasks to learn the representation of the sentence from both left and right context in all layers. The semi-supervised tasks used in the pre-training step are masked language modeling and next sentence prediction. During masked language modeling (MLM), 15% of the input tokens are randomly masked before pushing the sequences into the process. After being chosen, the token is masked with the [MASK] token 80% of the time, replaced with a random token 10% of the time, and unchanged in the remaining 10% of cases. The training data generator processes masked sentences and chooses 15% of the masked tokens to predict based on its context. BERT uses a next sentence prediction (NSP) objective to jointly pretrain text-pair representations. The model concentrates on two masked sentences, A and B, to learn the relationship between them. B is the next sentence to A in the original text 50% of the time and is replaced by a sentence that is randomly selected from the corpus the rest of the time. In the NER task, sentence B is the corresponding tag of the entities occurring in sentence A. BERT has been pre-trained using two corpora: English Wikipedia (2.500 billion words) and BooksCorpus (800 million words). In the fine-tuning stage, the input and output of the tasks are plugged into the model, and the pre-trained parameters are fine-tuned using labeled data.
RoBERTa is a derivation of the BERT model with modifications in the model structure and dataset used in the pre-training step [
59]. The model is trained longer using bigger batches and longer sequences. This model also uses a dynamic mask method, in which the masked token is dynamically generated every time a sentence is fed into the model to increase the number of masked tokens. In addition, the model uses alternative training formats instead of the next sentence prediction objective. RoBERTa was pre-trained using three corpora: BookCorpus, OpenWebText and a novel dataset, CC-NEWS, containing 63 million English news articles collected from the CommonCrawl News dataset.
BioBERT (Bidirectional Encoder Representations from Transformers for Biomedical Text Mining) [
60] is a domain-specific variation of the BERT model that is additionally pre-trained on two large-scale biomedical corpora: PubMed Abstracts (4.500 billion words) and PMC Full-text articles (13.500 billion words). Its model architecture and tasks are almost the same as for BERT. By being pre-trained on both general and biomedical corpora, this model can comprehend biomedical terms, which is a challenge for a general language model.
Efficiently Learning an Encoder that Classifies Token Replacements Accurately (ELECTRA) is a further modification based on the BERT model [
61]. ELECTRA proposes an alternative method for Masked language modeling objective called ‘replace token detection’ which makes the pre-training step more efficient. The chosen token is replaced by a token which is generated from a smaller masked language model. The model detects if the token is the original one in the corpus. Therefore, ELECTRA learns from all the inputs, instead of a subset of them.
For our analysis, we use the transformers library of HuggingFace for fine-tuning model. HuggingFace offers pre-training and fine-tuning scripts of transformer-based models, includes BERT, ELECTRA and RoBERTa [
62]. The model is optimized with a batch size of 32 sequences for 10 epochs with a learning rate of 4 × 10
. After each epoch, the model is evaluated, and the best performing checkpoint is used as the final prediction model. As the input for the BERT model, we use the FoodBase curated dataset—a corpus of 7840 input sentences. The corpus is separated into three subsets with the ratio of 8:1:1. The largest subset is used as the training set, while the others two sets are used for the model evaluation after each epoch and testing. Note that the corpus is split randomly, so the content of the subsets is different each time, but the number of sentences in each subset is constant. A maximum length of 64 tokens is applied for the model. Sentences that are longer than the limited length are split into separated input sequences for the network. This may occasionally split entities in a sentence into separated units.
3. Results
In this section, we present numerical results for a dictionary-based model, a conditional random fields model and a hybrid model we call FooDCoNER. Furthermore, we study four deep language models: BERT, BioBERT, RoBERTa and ELECTRA. For the evaluation of the models, use data from the FoodBase corpus, which consists of 1000 recipe articles with gold-standard annotations (for details, see Materials and Methods).
3.1. Dictionary-Based Model
For the dictionary-based model, the performance depends entirely on the quality and coverage of the data in the compiled dictionary. To assess how the quality and quantity of dictionary affects error metrics when evaluated with the FoodBase corpus, we performed two validation tasks. The first task evaluated the standard error of the system’s mean scores with respect to the variations in the test data. Hence, the FoodBase corpus was randomly split into 10 folds, and one fold at a time was used to evaluate the system’s precision, recall and F-score continuing through all 10 folds. We also assessed the stability of the dictionary model on two modified corpus instances with entities that occurred only once and were twice removed. The standard error was used to assess how stable the mean scores of the system were with respect to varying data. The second task was aimed at assessing how the size of the dictionary would affect system performance. Hence we tested the system using the whole test corpus for 12 dictionary sizes randomly sampled from the original dictionary as 1%, 2.5%, 5%, 10%, 20%, 30%, 40%, 50%, 60%, 70%, 80% and 90%. In order to estimate the variability of the results, each percentage was repeated 50 times, each time with a randomly sampled dictionary that was similar in size. Altogether, 600 instances were tested for precision, recall and F-score metrics and plotted in a boxplot graph, with the x-axis as dictionary size and y-axis as the evaluation metric.
In
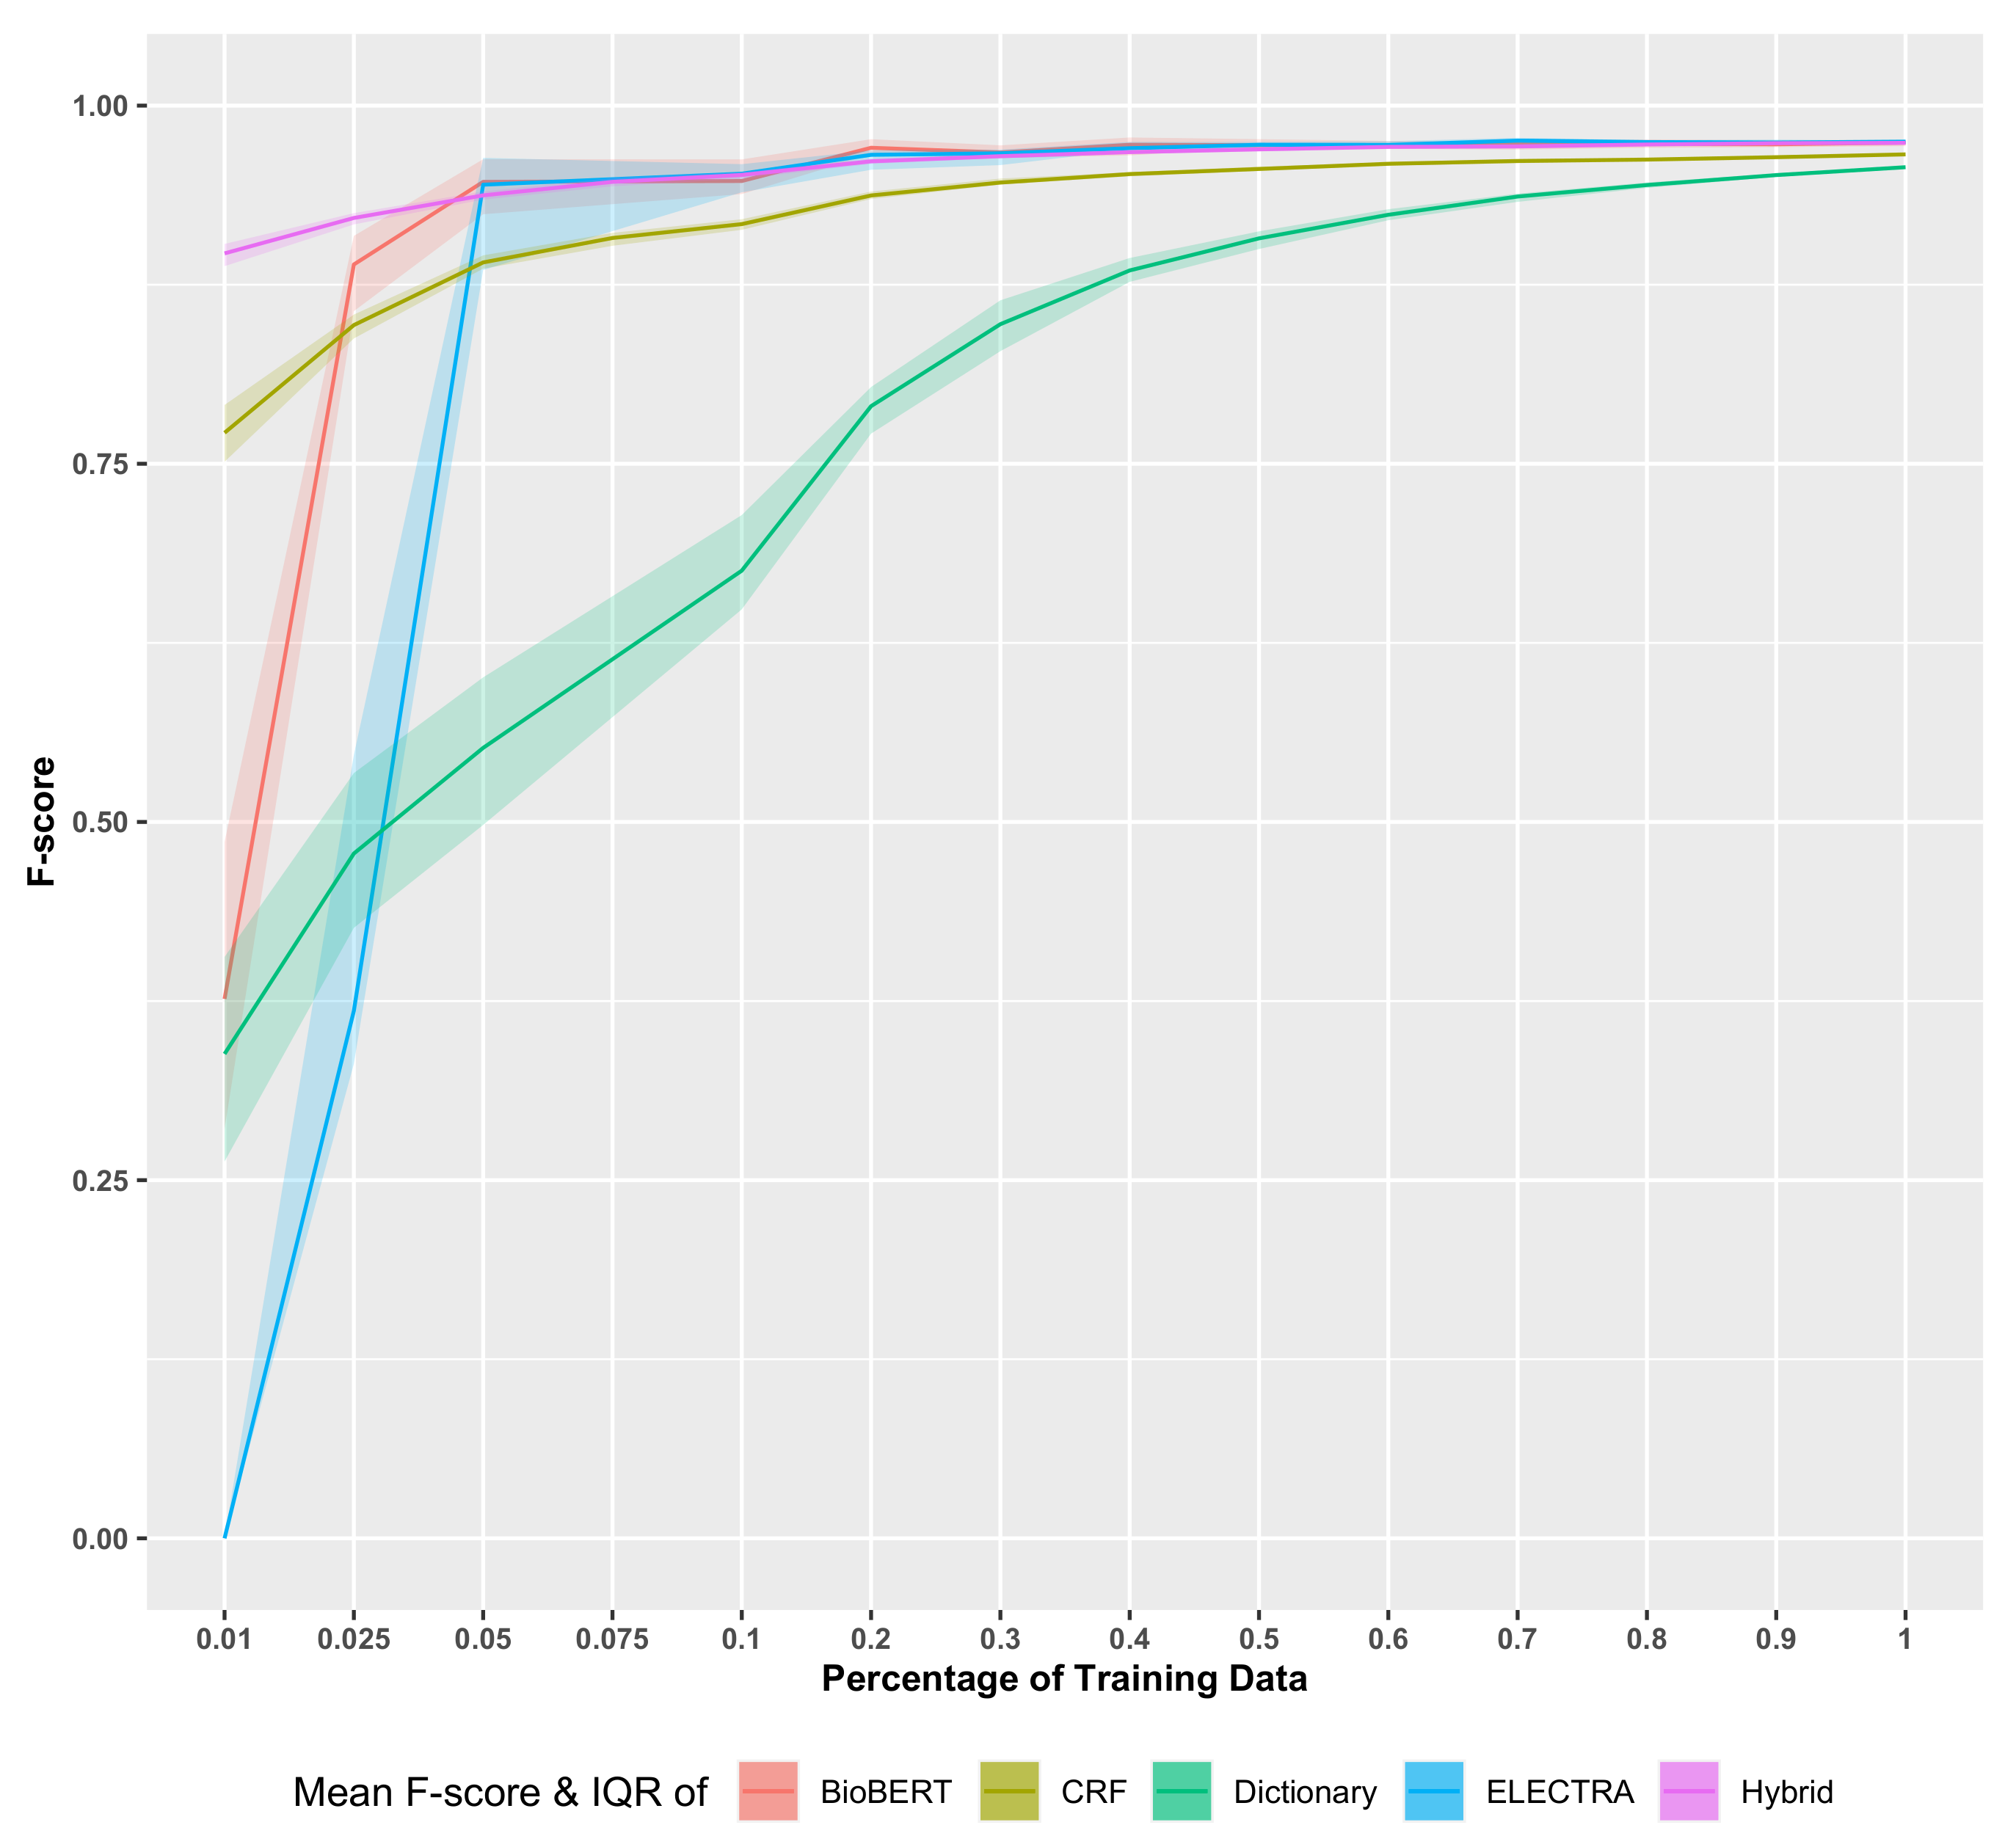
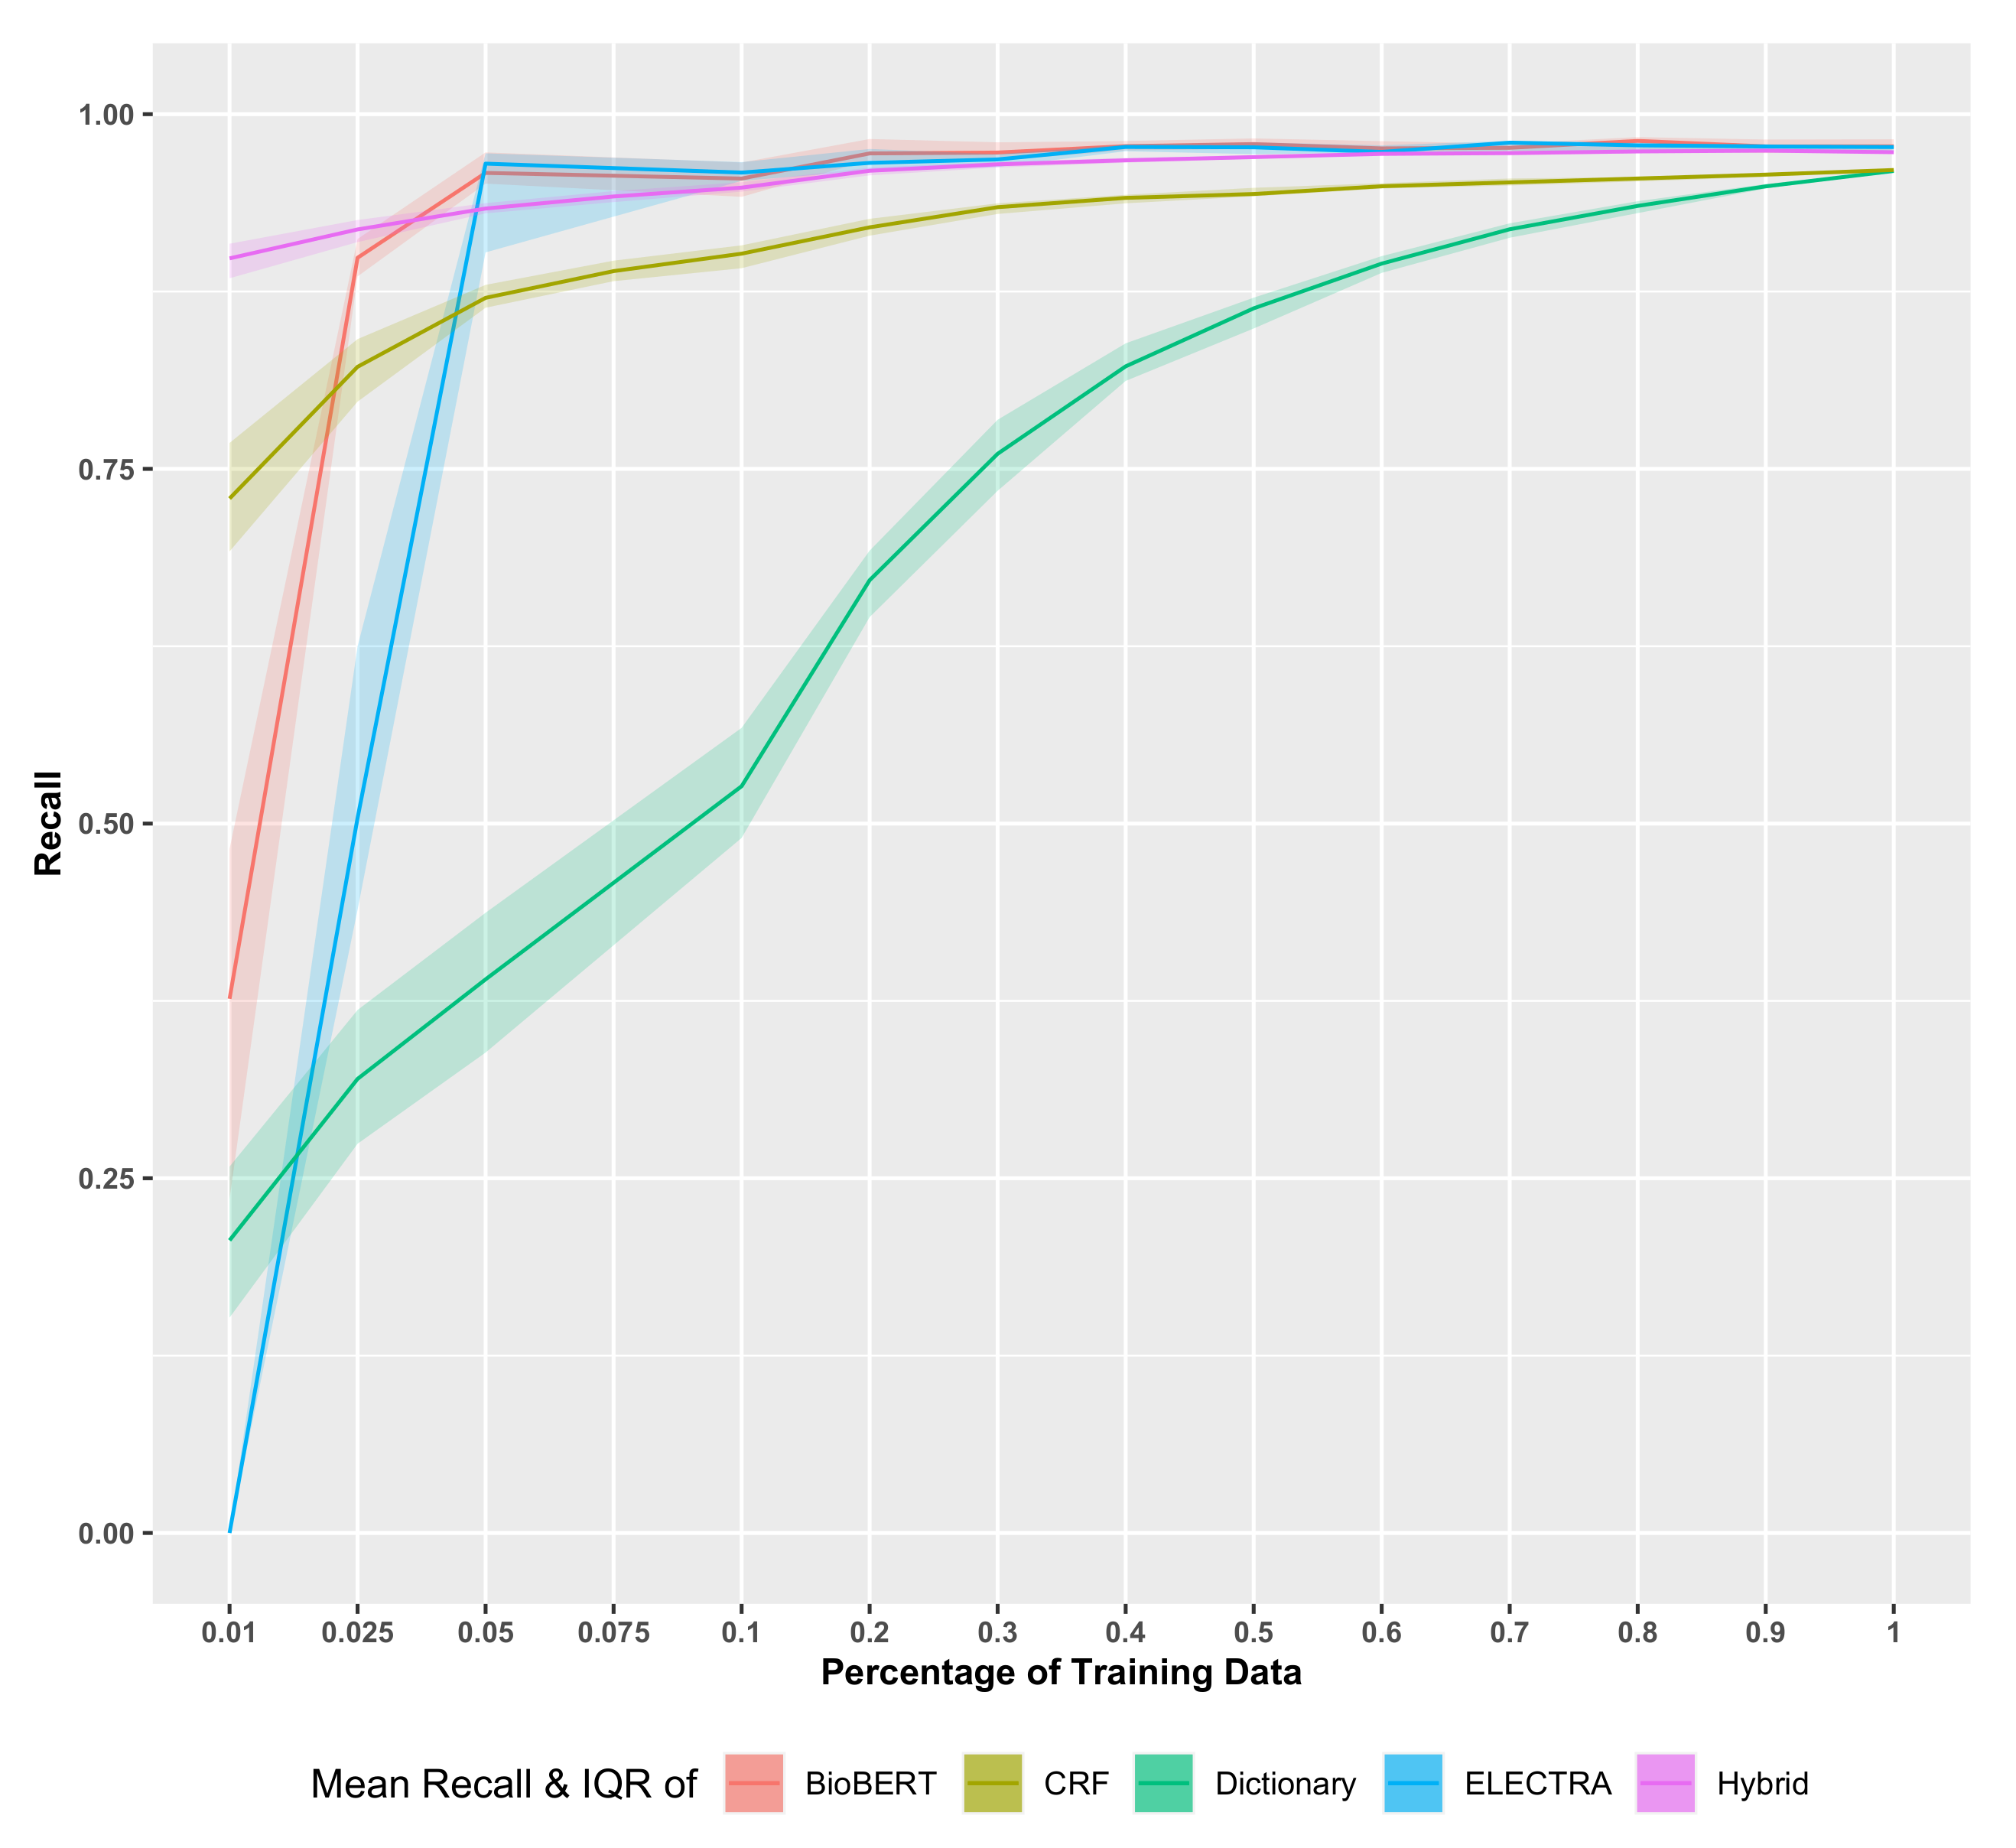
Figure 4,
Figure 5 and
Figure 6, we show the results for various scoring metrics depending on the percentage of dictionary terms. The median F-score and recall decrease steeply with a reduction in the dictionary size. The interquartile ranges (IQR) for both F-score and recall are higher where smaller dictionary sizes are used and converge as the dictionary reaches its maximal size. Interestingly, while the F-score well surpasses 0.95 (see also the summary in
Table 1), it never reaches 1. This can be explained by the fact that dictionary methods’ performance depends on the thoroughness of the dictionary and the accuracy of the matching criteria.
Since the “number of retrieved terms” and the “portion of relevant terms in retrieved terms” both reduce proportionally to the dictionary’s size, precision remains mostly stable despite the variations in the quality of the dictionary terms. Thus, the mean precision at all dictionary sizes remains over 0.95, which emphasizes the primary advantage of the dictionary-based methods: the high precision.
Table 1 shows a summary of results obtained for a number of different data sets. For all data sets, the entire dictionary was used; i.e., no subsampling has been applied. Specifically, results are shown for (i) the full data set, (ii) data where entities have been removed that appear just once and (iii) data where entities have been removed that appear just once or twice (see Materials and Methods for details). One can see that the dictionary-based model achieves over 0.95 precision, recall and F1-score for all three data sets. Importantly, removing rare words—i.e., words occurring once or twice in the corpus—improves the performance of the recall and the F-score, while the results for precision show a decline. Overall, the best results for the precision and F-score are obtained for data set (ii), whereas recall is best for data set (iii). However, the differences are small.
Furthermore, it is interesting to note that the mean precision of the model does not change much with the dictionary size, as one can see in
Figure 6, despite the IQR showing a similar behavior to before. This behavior can be explained using the equation for precision, given by;
The highest standard errors (SE) occur for the reduced corpora—i.e., data set (ii) and (iii)—indicating a higher variability in the resulting scores. This variability can be attributed to a main observation; when each reduced corpus is split into 10-folds randomly, the number of food entities in each fold of recipes can differ; i.e., one fold may have recipes with more entities while another fold may have less number of entities in its recipes. Since the data folds are smaller, this variability is more visible, especially when models are tested with one fold.
3.2. Conditional Random Fields Model
In contrast to the dictionary model, we evaluate model scores against the quantity and quality of the training data for the CRF model. First, to assess the effect of data quantity, we trained 15 CRF models using 900 recipes from FoodBase; each iteration uses a percentage of the training data from 1%, 2.5%, 5%, 7.5%, 10%, 20%, 30%, 40%, 50%, 60%, 70%, 80%, 90% and 100%. The training at each percentage was repeated 50 times with random sampling to reduce variance. All the 750 models were evaluated on the remaining 100 test recipes set apart at the beginning of the experiment. We plotted the F-score, precision and recall values in box plot graphs, with data percentages on the x-axis and evaluation statistics on the y-axis. In the second part of the evaluation, we assessed the effect of training data quality on the model scoring by performing 10-fold cross-validation. We calculated the standard error of precision, recall and F-score for the 10-folds to illustrate how the mean scores vary in proportion to data quality.
In
Figure 4,
Figure 5 and
Figure 6, we show the results for the CRF model. As one can see, the F-score and recall behave similarly as for the dictionary-based model. In contrast, the precision shows a steadily increasing performance for increasing amounts of training data. All three median scores increase proportionally when increasing the recipe counts, in a steady curve with wider IQRs at lower training data sizes and rapidly thinning IQRs as the data amount increases. The F-score, recall and precision values finally converge at 0.9683, 0.9667 and 0.9699, respectively, at full training data size. Focusing on the training data size 1%, which only includes 10 documents, the precision and recall vary the most at this instance, ranging from less than 0.75 to slightly over 0.90. This IQR range is indicative of how the quality of the training set affects the CRF modeling when there are less data for learning. However, the mean F-score remaining closer to 0.80 also illustrates how powerful the CRF modeling can be, even with fewer well-represented training instances.
In
Table 2, we summarize the 10-fold CV F-scores, recalls, precisions and their standard errors for eight versions of the FoodBase corpora: (i) the full data set, (ii) data with entities that appear just once are removed, (iii) data with entities that appear just once or twice are removed and (iv) appetizers and snacks, (v) breakfast and lunch, (vi) desserts, (vii) dinner and (viii) drinks. In contrast to the dictionary-based model, the highest recall, precision and F-score are all achieved when the full dataset is used. This is interesting because the results indicate that the CRF model can learn to perform with higher recall and F-scores even with rare terms in the corpus. Furthermore, it confirms that the CRF approach is more sensitive to the training data size than quality. Compared with the dictionary-based model, the standard error of the CRF model is smaller, indicating a reduced variability.
3.3. Hybrid Model: FooDCoNER (Food and Dietary Constituents Named Entity Recognition)
Finally, similar to the CRF model, we performed the training data quantity and quality versus error scores assessment for the hybrid model to investigate if adding the dictionary component improves the curves in
Figure 4,
Figure 5 and
Figure 6. Thus, the first evaluation trained 750 models of 15 training data sizes repeated 50 times, ranging from 1% to 100% (900 articles), similar to CRF evaluation. The resulting F-score, precision and recall values were plotted in box plot charts. The second evaluation assessed the effect of training data quality on the hybrid model. The 10-fold CV was performed on eight FoodBase corpus variations; (i) the full data set, (ii) data with entities that appear just once are removed, (iii) data with entities that appear just once or twice are removed and (iv) appetizers and snacks, (v) breakfast and lunch, (vi) desserts, (vii) dinner and (viii) drinks.
Figure 4,
Figure 5 and
Figure 6 show the results for the hybrid model called FooDCoNER. Here F-score, recall and precision are again shown depending on the size of the training data. Compared to the dictionary-based model and the CRF model, the most noteworthy difference is how stable the curves are, even for the smallest training sizes. Furthermore, the IQR was reduced significantly compared to the dictionary and CRF models. Importantly, the median error scores are always above
for all training sizes. Hence, the overall performance of the hybrid model improves over the dictionary-based model and the CRF model in all aspects.
In
Table 3, we show the results for FooDCoNER for eight different data sets: (i) full corpus data, (ii) data with entities that appear just once are removed, (iii) data with entities that appear just once or twice are removed and (iv) appetizers and snacks, (v) breakfast and lunch, (vi) desserts, (vii) dinner and (viii) drinks. One can see that combining a dictionary-based model with a CRF model improves the F-score, precision and recall for all eight data sets, resulting in noticeable improvements in the recalls. Interestingly, in contrast to the CRF model, FooDCoNER gives also better results for the F-score for dataset (ii) (entities that appear once in corpus removed). This improvement can be attributed to the dictionary features since the dictionary-based model also showed a significant improvement in F-score and recall for the removal of rare entities (see
Table 1). For the food category-specific data (datasets (iv) to (viii)), one can see that similar to the CRF model, the standard errors are slightly higher for the full dataset but show no significantly lower values than the CRF model for the same datasets, whereas the improvement of the model as a result of dictionary features is reflected in the food category-specific dataset as well, with higher mean F-score, precision and recall in all five datasets.
Similar to the CRF model, one can see that the standard error (SE) is lower for the full data corpus compared to the seven smaller corpora, thus confirming that the stability of the machine learning model improves with the size of the training data. However, overall, the SE values for F-score, recall and precision are significantly lower in the hybrid model in comparison to both the dictionary-based model and the CRF model.
Furthermore, in
Table 4, we show the results of the hybrid model for boundary detection in food named entities (NE) using a multi-segment NE representation model, as described in the
Error Measures used for Evaluation section. In this approach, each token is given a label indicating if it is part of named entity or not, using a combination of
Inside,
Outside,
Beginning,
Ending,
Single,
Rear or
Front. The labels enable the capture of boundaries of named entities comprised of several tokens.
Here, we focus on the IOB multi-segment representation of NE phrases, i.e., Inside (I), Outside (O) and Beginning (B), because these are the most informative labels. For general NER problems, the number of tokens labeled as “O” is much larger than the labels “B” or “I ”. This is causing an imbalance in the resulting classes and, hence, effects all error scores including the F-score. The reason for this is that the IOB labels can be considered as classes for which a label assignment, in form of a classification, is assessed. For this reason, we did not only estimate F-scores but also the balanced accuracy which compensates for the imbalance in the classes.
From analyzing FooDCoNER, we obtain the results for IOB as shown in
Table 4. Interestingly, the F-score for the “O” label is over
for all three datasets—i.e., (i), (ii), and (iii)—while the F-scores for “B” and “I” drop to
and
, respectively. As one can see, the results for “I” vary most with respect to the three datasets (i), (ii) and (iii). In order to see if these changes are due to the class imbalances, we repeat this analysis assessing the balanced accuracy (see Equation (
4)) instead of the F-score. As a result, the errors for the IOB labels are now more closely together (see
Table 4).
An additional noteworthy observation here is that when trained with corpora where rare entities are removed—i.e., dataset (ii)—FooDCoNER performs slightly better compared to the other datasets. This effect is even stronger for the “I” label and holds for the balanced and unbalanced errors. One possible explanation for this behavior is that some named entities containing several tokens are removed as rare, resulting in a higher boundary detection. For instance, “balsamic vinegar–root beer mixture” or “Amish Friendship Bread Starter” are two annotated named entities in the FoodBase corpus that appear only once, having five and four tokens, respectively, in the entity. By removing such terms, the model does not have to detect several “I”s that are following a “B”, thus improving the F-score and balanced accuracy for “I”.
In order to demonstrate that the FooDCoNER model also has the capability to extract nutritional constituents such as minerals and vitamins (zinc, calcium, folic acid, riboflavin) and non-nutritive phytochemicals (e.g., alkaloids, organosulfides, flavonoids), allowing it to be used, e.g., for identifying disease-diet networks for biomedical research, we perform one additional analysis. Specifically, for this reason, we manually annotated 50 PubMed abstracts with generic food, nutrition entities and dietary chemical constituents. In total, the data we generated this way consist of 519 annotations including 138 unique nutritional and dietary chemical names. As a result, we find that FooDCoNER extracts 102 of the 138 nutritional and dietary chemical entities and 410 out of the 519 total annotations. The overall F-score of the hybrid model for the 50 PubMed abstracts is with a recall of and a precision of (with 59 false positives). In summary, this demonstrates that FooDCoNER is capable of extracting nutritive and non-nutritive constituent names.
4. Discussion
General BioNER systems—e.g., for genes, proteins or disorders—have been widely studied, and there are abundant benchmark data available for such tasks [
7,
63]. However, for food, nutritive and non-nutritive bio-marker entities, the situation is different, and currently there are no established benchmark data. For this reason, we used the FoodBase [
39] corpus, having only annotations for food entities, to analyze BioNER methods for food and dietary constituents named-entity recognition. In addition, we manually annotated 50 PubMed abstracts to generate a data set containing information about nutritional and phytochemical entities and dietary chemical constituents.
In order to conduct a rigorous evaluation, we assessed all models with a 10-fold cross validation and various dedicated subsets of the FoodBase data. Specifically, we not only assessed the performance of the models for the full corpus but for meaningful food categories—e.g., appetizers, breakfast and dessert (see, e.g., dataset (iv), (v) and (vi) in
Table 2)—and subsampled training data, allowing us to quantify the impact of the size of training data on the performance via learning curves [
38]. Specifically, from analyzing the influence of the size of the training data on the F-score and the recall, we find that the hybrid model, FoodCoNER, is less sensitive with respect to size changes than the dictionary-based model and the CRF model, whereas the dictionary-based model is most sensitive. Furthermore, the IQR of the hybrid model is smaller compared to the other two models. Hence, the hybrid model benefits from the combination of a dictionary-based model and a CRF model, resulting in improved performance metrics. A particular improvement is obtained for very small training sizes—see the left-hand side of
Figure 4 and
Figure 5—because both the F-score and the recall assume values over
.
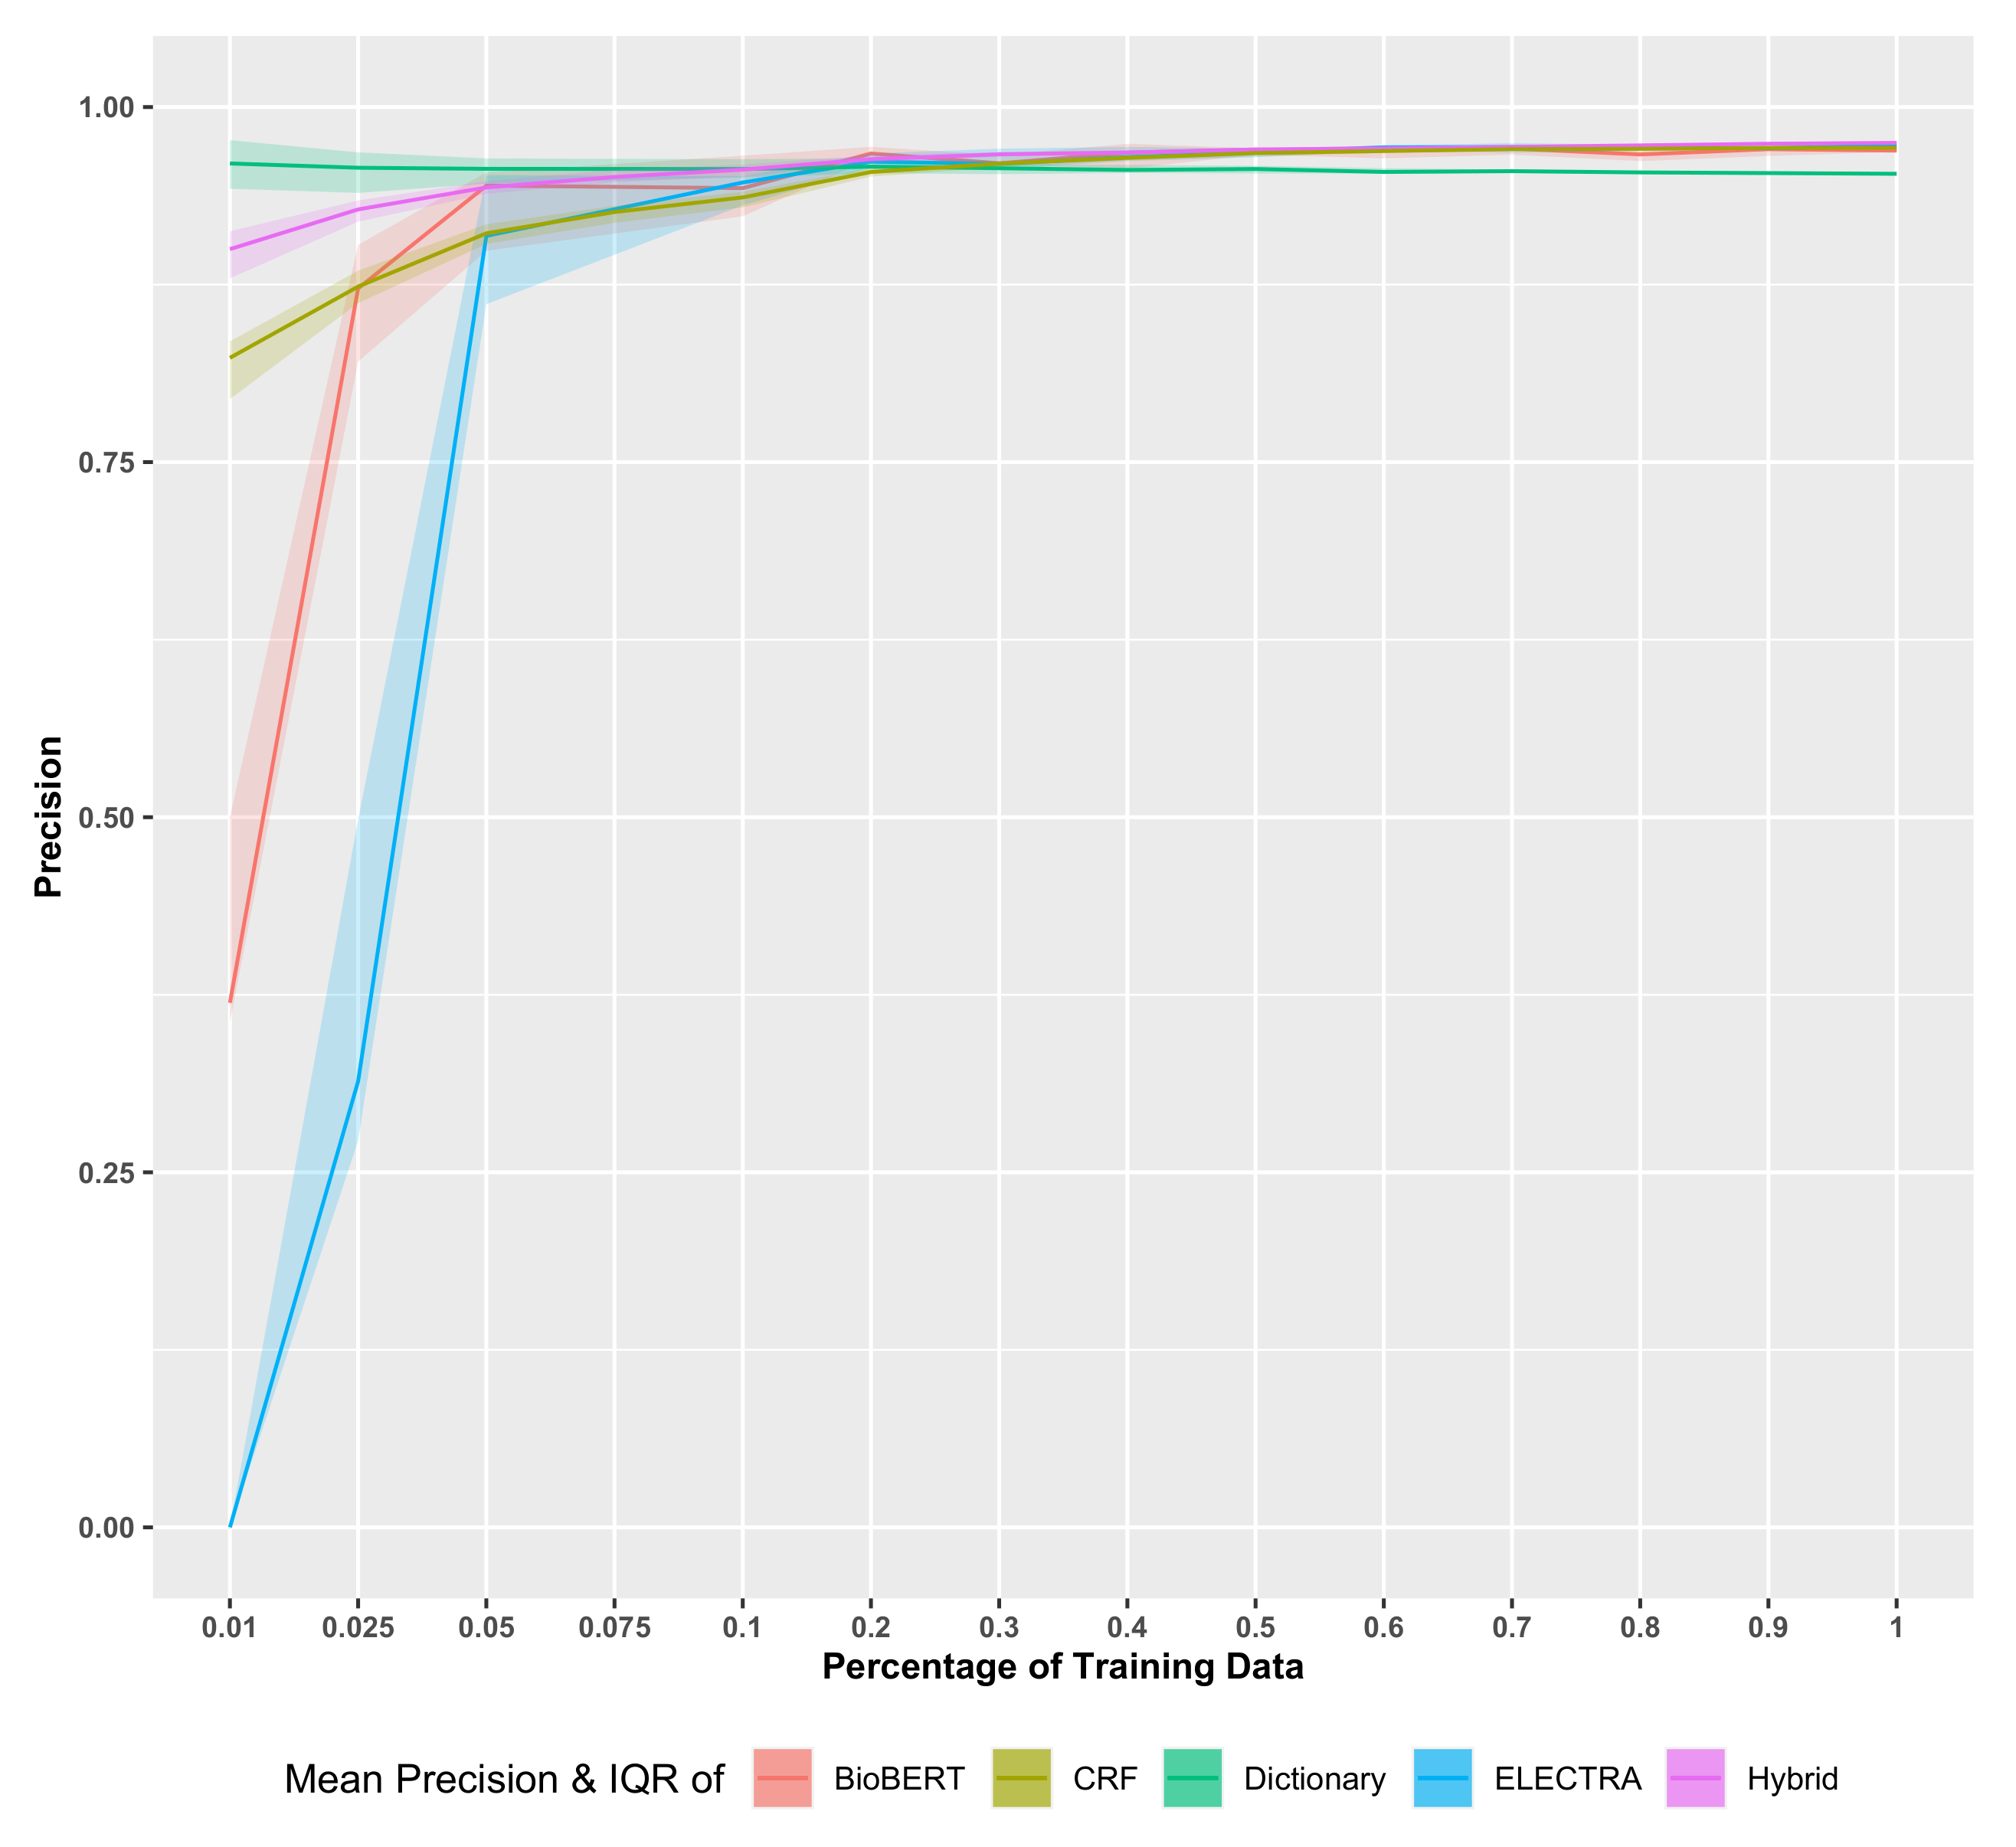
A comparison of the learning curves for the F-score in
Figure 4 allows the identification of several key differences. First, the convergence of the F-score with respect to the size of the training data is fastest for the hybrid model (FoodCoNER). As one can see, for the dictionary-based model, there is no strong convergence, which means the full size of the training data is needed. In contrast, for the CRF model and the hybrid model, percentages of
and
of the total size of the training data are sufficient. Another key difference is with respect to the IQR. Interestingly, the dictionary-based model and the CRF model have IQRs of a similar size, although for increasing sizes of the training data, the IQRs for the CRF model are slightly smaller. In contrast, the IQRs of the hybrid model are significantly smaller. For the deep language models (BioBERT and ELECTRA), one can see that they converge also to the best results, however, using larger sizes of the training data. That means that asymptotically, FooDCoNER, BioBERT, ELECTRA, BERT and RoBERTa (both are not shown in
Figure 4 in order to increase the clarity of the figure) perform similarly, but FooDCoNER is more efficient in dealing with small sample sizes of the training data.
While all three error scores (i.e., the F-score, recall and precision) increase with an increasing size of the training data, the precision of the dictionary-based model shows only a very small increase. As explained in the Results section, a decreasing number of the terms in the dictionary predominantly affects the number of false negatives but not the number of false positives or true positives. Since the precision is only estimated based on true positives and false positives, the precision remains in the same range while the recall and F-score can vary strongly. In contrast, the precision of the hybrid model shows the best results compared to the other two models.
An overall summary of our results for the FoodBase database is shown in
Table 5 and respective run time complexities in seconds are shown in
Table 6.
Table 5 shows the F-score, recall and precision for all models studied in this paper. In addition, we show results from the literature for BuTTER [
27] (which used five-fold CV for the evaluation), FoodIE and NCBO Annotator [
43], whereas FoodIE [
8] is currently the SOTA model providing the best results known. As one can see from
Table 5, FooDCoNER achieves the highest F-score together with RoBERTa and BioBERT, and also BERT and ELECTRA perform similarly. We would like to note that the numbers in brackets in
Table 5 correspond to the standard error (SE). As one can see, the standard errors are quite small, indicating that the performances of the different methods are not overlapping. Finally, it is worthwhile to note that also the simple dictionary-based model achieves respectable results, especially for the recall, and its F-score is even within one SE from FoodIE.
Regarding the deep learning model BuTTER [
27], which is based on a Bidirectional LSTM, it is interesting to see that this model underperforms compared to all other models except NCBO Annotator. A possible explanation for this may be that even the (full) training data set is still not large enough to learn the LSTM or that this architecture is less suited for the task, e.g., compared to the transformer-based BERT models. For completeness, we would like to note that all models in
Table 5 were trained and tested for the same data.
Aside from the performance results summarized in
Table 5, the run time of the models is also important. As one can see from
Table 6, FoodCoNER and the CRF model are fastest in training and testing. All the deep language models require much more time and resources for training, and the slowest model, RoBERTa, needs 96 times longer than FoodCoNER for the training. Interestingly, ELECTRA, the fastest deep learning model, is still 43 times slower than FoodCoNER for the training. We would like to highlight that the run time of the deep learning models does not even include time for the pre-training but only for fine-tuning. Hence, the overall differences are even larger because pre-training can take several days. Furthermore, it is interesting to note that the training time for FoodCoNER is even slightly shorter than for the CRF model because the number of features used by FoodCoNER is 8 while the CRF model uses 12. Hence, the CRF model and the CRF model that is part of the hybrid model are slightly different from each other.
The testing times show little differences with the exception of the dictionary model. It is clear that the dictionary model is much slower than all other models because each noun, noun phrase and their stem strings need to be directly or partially matched with the 20,000 elements in the dictionary. The reason why FoodCoNER is much faster than the dictionary model despite the fact that it contains also a dictionary is similar to the reason given above for the CRF model. The dictionary model is different to the dictionary used by FoodCoNER, which is only a partial dictionary (hence it is much smaller). This is accomplished by simpler string matching criteria by giving more weight to terms that are food domain-specific. Overall, this leads to a reduction in the search space upon which the hybrid model is based compared to both the CRF model and the dictionary model.
5. Conclusions
In this paper, we introduced a new hybrid model, called FooDCoNER, to capture food, nutrition and phytochemical entities and their boundaries. We conducted an in-depth comparative analysis with a dictionary-based model for a baseline comparison, a CRF model and four deep language models (BERT, BioBERT, RoBERTa and ELECTRA) to study characteristics of the corresponding models and to understand their behavior in different situations.
For our analysis, we considered three main metrics: (1) performance of a model (measured by the F-score, precision and recall), (2) run time of a model (time needed for training/fine-tuning and validation) and (3) training size requirement of a model (studied via learning curves). Considering all metrics, we found that FooDCoNER is the best performing model because (1) its performance is on par with the deep language models, (2) its run time is fastest together with the CRF model and (3) its training size requirement is best compared to all studied models. This makes FooDCoNER a suitable model for food NER problems where only a limited sample size is available and when execution time is crucial without compromising the prediction performance.
On a more fundamental level, our results shed light on differences between classical machine learning models and recent deep language models. While our results underline the well-known competitiveness of general deep learning models regarding their prediction performance, they also show that this is not the only metric. With respect to NER problems and general text mining tasks, our results might indicate a niche for classical machine learning models when it comes to the run time requirements and sample size limitations of the training data.


