1. Introduction
Machine learning (ML) models have enabled automated decision making in a variety of fields, ranging from lending to hiring to criminal justice. However, the data often used to train these ML models contain many societal biases. These biased models have the potential to perpetuate stereotypes and promote discriminatory practices, therefore giving privileged groups undue advantages. As a result, it has become increasingly important for ML researchers and engineers to work together in eliminating this algorithmic unfairness.
Despite an awareness of the need for these fair models, there still exist many examples of models exhibiting prevalent biases, such as the following:
In 2016, ProPublica reported that the ML models used by judges to decide whether to keep criminals in jail were discriminatory against African-American males, labeling them with relatively high recidivism (tendency to re-offend) scores [
1].
Amazon discovered that its automated recruiting system was biased against female job applicants, rendering them far less successful in the application process [
2].
A healthcare algorithm evaluated on 200 million individuals to predict whether patients needed extra medical care was highly discriminatory against African Americans while prioritizing white individuals [
3].
One particular domain where bias mitigation has become especially crucial is mortgage lending. It has been reported that over 3.2 million mortgage loan applications and 10 million refinance applications exhibited bias against Latin and African American lenders [
4]. In another study, it was shown that minority groups were charged significantly higher interest rates (by 7.9 basis points) and were rejected 13% more often than their privileged counterparts [
5]. These biases, when trained upon, lead to discriminatory loan classifiers that can cause greater gaps in suitable housing, wealth, and property between unprivileged (African Americans) and privileged (White and Asian American) groups. This problem becomes exacerbated as companies rely on these biased models in making real-life decisions. Additionally, these biased models are unlawful under the Equal Credit Opportunity Act (ECOA) of the United States, which forbids the discrimination of individuals based upon sensitive attributes (e.g., race, gender, national origin, and ethnicity) by any private or public institution. It has thus become the moral and legal duty for researchers and software developers to find a solution to this problem of “algorithmic unfairness”.
Fortunately, work has been done in approaching this bias. There are currently three ways in which bias mitigation has been approached, correlating with before, in, and after the data usage pipeline:
Pre-processing—the transformation of data (e.g., the alteration of balancing distributions) to “repair” inherent biases [
6,
7,
8,
9].
lIn-processing—the use of classifier optimization or fairness regularization terms to affect model learning and maximize a model’s fairness [
10,
11,
12].
lPost-processing—the manipulation of model output to improve performance and fairness metrics [
13].
While prior works gained relatively high fairness and performance metrics using one or more of these mitigation techniques, the current literature contains three main problems that hamper their adaptability and deployment: (1) more work can be done on extending mitigation techniques to situations with intersectional fairness, (2) an accuracy and fairness trade-off still exists, and (3) an absence of accepted fairness metrics for data with multiple sensitive parameters and sensitive options. For point 1, it may be important to clarify that in our study, intersectional fairness extends from its current definition by acknowledging the existence of “joint” as a valid sensitive option under various sensitive parameters since the category is commonplace in the realm of financial documents (e.g., mortgage loan applications and tax returns).
Our Contributions: In this paper, we target all three of the previously stated problems to develop a novel and real-world applicable fair ML classifier in the mortgage-lending domain that obtains relatively high fairness and accuracy metrics. Through this process, we coin a bias mitigation pipeline called DualFair (a pre-processing strategy), which approaches intersectional fairness through data sampling techniques, and solves problems hindering the growth of the “Fairness, Accountability, and Transparency”, or FAT, field.
More concretely, the main insights we provide within this paper include the following:
Creating a bias mitigation strategy coined DualFair targeted toward the mortgage domain, which debiases data through oversampling and undersampling techniques that target the root causes of bias.
Extending our mitigation approach to intersectional fairness by subdividing datasets and then balancing by class and labels.
Developing a novel fairness metric called AWI (alternate world index) that is generalizable to intersectional fairness and an accurate representation of model fairness.
Eliminating the accuracy–fairness trade-off by debiasing our mortgage lending data using DualFair.
Creating a fair loan classifier that achieves relatively high fairness and accuracy metrics and can potentially be used by practitioners.
The rest of this paper is structured as follows:
Section 2 provides an overview of the prior work and contributions in the FAT field, particularly in relation to our own.
Section 3 explains fairness terminology and metrics used throughout our paper.
Section 4 gives a detailed outline of our data, debiasing strategy, novel fairness metric AWI, and experimental design.
Section 5 summarizes the results of our bias mitigation pipeline and documents the success of our approach, compared to the previous state-of-the-art based upon
accuracy, precision, false alarm rate, recall, F1 score and AWI. In
Section 6, we give a brief overview on the potential directions for future work. Finally,
Section 7 concludes the paper.
2. Related Work
Fairness in ML models is a largely explored topic within the AI community. Recently, major industries have begun to put a greater priority on AI fairness. IBM developed AI Fairness 360, which is a fairness toolkit that contains commonly used fairness metrics and debiasing techniques to aid researchers working in ML fairness [
14]. Microsoft has established FATE [
15], a research group dedicated to fairness, accountability, transparency, and ethics in AI. Google [
16], Microsoft [
17], IEEE [
18], and The European Union [
19] each respectively published on ethical principles in AI, which are general guidelines on what the companies define as “responsible AI”. Facebook created bias detection tools for its own internal AI systems [
20]. The research community has started to take an interest in fair AI as well. ASE 2019 and ICSE 2018 hosted workshops on software fairness [
21]. Mehrabi et al. studied various notions of fairness and fundamental causes of bias [
22]. ACM established the FAccT ‘21 as a conference to spearhead work on fairness and transparency of ML algorithms [
23].
Thus far, achieving algorithmic fairness has been addressed through pre-processing, in-processing, and post-processing approaches. Prior work has proposed a variety of bias-mitigating methods.
Optimized pre-processing [
9] is a pre-processing method that seeks to achieve group fairness by altering labels and features, using probabilistic transformations. Zhang et al. presented the in-processing approach,
adversarial debiasing [
24], which increases accuracy and strips away an adversary’s ability to make decisions based upon protected attributes using GANs.
Reject option classification [
25] is a post-processing strategy that translates favorable outcomes from the privileged group to the unprivileged group and unfavorable outcomes from the unprivileged group to the privileged group based upon a certain level of confidence and uncertainty. Chakraborty et al. proposed
Fair-SMOTE [
26], a pre-processing and in-processing approach, which balances class and label distributions and performs
situation testing (i.e., testing individual fairness through alternate “worlds”).
Our experience has shown, however, that these approaches lack mainly in their ability to extend to intersectional fairness. Chakraborty et al. noted that the consideration of intersectional fairness would divide data into unmanageable small regions [
27]. Salerio et al. attempted to approach intersectional fairness by creating AEQUITIS, a fairness toolkit, that uses parameter-specific fairness metrics to systematically view bias within one sensitive parameter at a time [
28]. Gill et al., Chakraborty et al., and Kusner et al. approached fairness in their own separate domains by using a singular sensitive parameter, designating one privileged group and one unprivileged group as a way to compare mitigation results [
6]. Ghosh et al. introduced a new intersectional fairness metric coined the worst-case disparity framework that finds the largest difference in fairness between two subgroups and then minimizes this difference by utilizing existing single-value fairness metrics [
29]. We refrain from using this approach in our work because it relies on previous single-value metrics that require the designation of unprivileged and privileged groups. Through our experience with DualFair, we argue that it is possible to debias data with multiple sensitive parameters and sensitive options, given a proper pipeline, approach, and data. This allows for deployability and scalability within real-world systems. We also show that given this type of data, one could devise a fairness metric (AWI), which considers bias from all parameters and options cohesively.
The mortgage domain has seen its own work in the realm of AI fairness as well. Fuster et al. and Bartlet et al. showed disparity in over 92% of loans, spanning origination, interest rate charges, and preapprovals across the United States on the basis of sex, race, and ethnicity [
5,
30]. Gill et al. built upon these conclusions and proposed a state-of-the-art machine learning workflow that can mitigate discriminatory risk in singular sensitive parameter and sensitive option mortgage data while maintaining interpretability [
31]. This framework was used to create a fair loan classifier. Lee et al. also presented a theoretical discussion of mortgage domain fairness through relational trade-off optimization [
32]. That is, the paper discussed a method to achieve a balance between accuracy and fairness within the
accuracy–fairness trade-off on mortgage lending data rather than maximizing both.
Our work builds on the foundation created by these previous works in mortgage lending and bias mitigation in AI systems at large. It is important to note that the literature varies in two main aspects, however: (1) finding bias and (2) mitigating bias.
While most prior work has centralized on finding bias, our study seeks to mitigate bias through creating a debiasing pipeline and training a fair loan classifier.
3. Fairness Terminology
In this section, we outline the fairness terminology that will be used within this work. An unprivileged group is one that is discriminated against by a ML model. Privileged groups are favored by a ML model due to some sensitive parameter. These groups usually receive the favorable label (i.e., the label wanted), which, for our purposes, is a mortgage loan application being accepted. A sensitive parameter, also known as a protected attribute, is a feature that distinguishes a population of people into two groups, an unprivileged group and a privileged group. This parameter was historically discriminated against (e.g., race and sex). Sensitive options are sub-groups, or options, within sensitive parameters (e.g., for race: White, Black, or Asian). The distribution of all sensitive parameters and sensitive options (e.g., White males, Black males, White females, Black females) is referred to as a class distribution. The distribution of favorable outcomes and unfavorable outcomes for a particular group as represented by the ground truth is its label balance. Label bias is a type of societal bias which can shift the label balance (e.g, a mortgage underwriter subconsciously denying reliable African-American lenders for loans). Selection bias is another type of bias that is created when selecting a sample. For example, suppose that researchers are collecting car insurance data for a particular location. However, the particular location they are collecting data from has historical discrimination that causes it to have a low annual income per person. The insurance data collected in this location, therefore, would contain implicit economic biases. Fairness metrics are a quantitative measure of bias within a specific dataset.
Finally, there are two main types of fairness denoted within the literature:
individual fairness and
group fairness [
22].
Individual fairness is when similar individuals obtain similar results.
Group fairness is when the unprivileged and privileged groups, based upon a particular sensitive parameter, are treated similarly.
Before beginning our discussion on DualFair, we would like to note that in this work, we use a binary classification model for all of our inferences and methods of achieving these notions of fairness. Future work could make an effort of looking into algorithmic fairness with regression models instead.
4. Materials and Methods
4.1. Mortgage Data
Previous domain-specific ML studies have faced many challenges in acquiring large-scale datasets for comprehensive work. The mortgage domain conveniently offers a solution to this problem. For our study, we use the HMDA dataset, which was publicly made available by the Home Mortgage Disclosure Act (HMDA) of 1975 [
33]. HMDA data have been used in various studies to outline and understand recent mortgage trends. They span 90% of all loan origination and rejections in the United States and contain over 21 distinct features (e.g., race, sex, and ethnicity).
It is important to note that HMDA has prevalent racial and gender prejudices within the data.
Table 1 shows a quantitative distribution of these biases through particular sensitive, or biased, features. Our evaluation shows that features, such as loan amount, income, and interest rate, already give certain groups an undue advantage. For instance, females are given higher mean and median interest rates, lower loan amounts, and lower property values compared to those of males. This is a primary indication of bias against females applicants when compared to male applicants. The following issue will be dealt downstream during DualFair’s bias mitigation pipeline.
In this study, we use HMDA national data from 2018 to 2020 and 2020 data from two small states (<150,000 rows of data), two medium states (>150,000 to <250,000 rows of data), and two large states (>250,000 rows of data). These data are unique compared to past years’, as, in 2018, the Dodd–Frank Wall Street Reform and Consumer Protection Act (Dodd–Frank) mandated more expansive updates to mortgage loan data from all applicable institutions. Dodd–Frank led to the addition of features such as credit score, debt-to-income ratio, interest rate, and loan term, providing a more comprehensive review of loan applicants and studies for algorithmic fairness. In our work, we build a fair ML classifier on the HMDA data using DualFair, where our classifier predicts whether an individual originated (i.e., y = 1) or was denied (i.e., y = 0) a loan. The following steps are taken to facilitate the creation of this classifier and analysis of HMDA data:
755,000 loan records were randomly sampled without replacement from each year 2018–2020 to form a combined HMDA dataset, spanning over 2.2 million loan applications, for analysis.
Features with more than 25% data missing, exempt, or not available were removed during data pre-processing. When deciding upon this value, we tested the threshold values 20%, 25%, 30%, 35%, and 40%. We found that setting the threshold value to 25% produced the best accuracy. It is essential to note that this value was most optimal for our data and prediction model. However, it is important to tune this value when using alternative methods or materials.
Only White, Black, and joint labels from the race category, male, female, and joint labels from the sex category, and Non-Hispanic or Latino, Hispanic or Latino, and joint labels from the ethnicity category were used in the study.
Note: Joint is defined as a co-applicant sharing a different feature option than the main applicant. For instance, a White male applicant and a Black co-applicant would be joint for race. Future research is highly encouraged in implementing all sensitive parameters and sensitive options.
4.2. Debiasing
It has been shown that data bias mainly derives from two factors:
label bias and
selection bias [
34,
35]. In this section, we eliminate both of these biases from our dataset in the debiasing process through a novel pre-processing approach that we coin DualFair. More concretely, DualFair removes the
accuracy–fairness trade-off and increases the algorithmic fairness metrics by approaching the task of selection bias and label bias through balancing at the class and label levels.
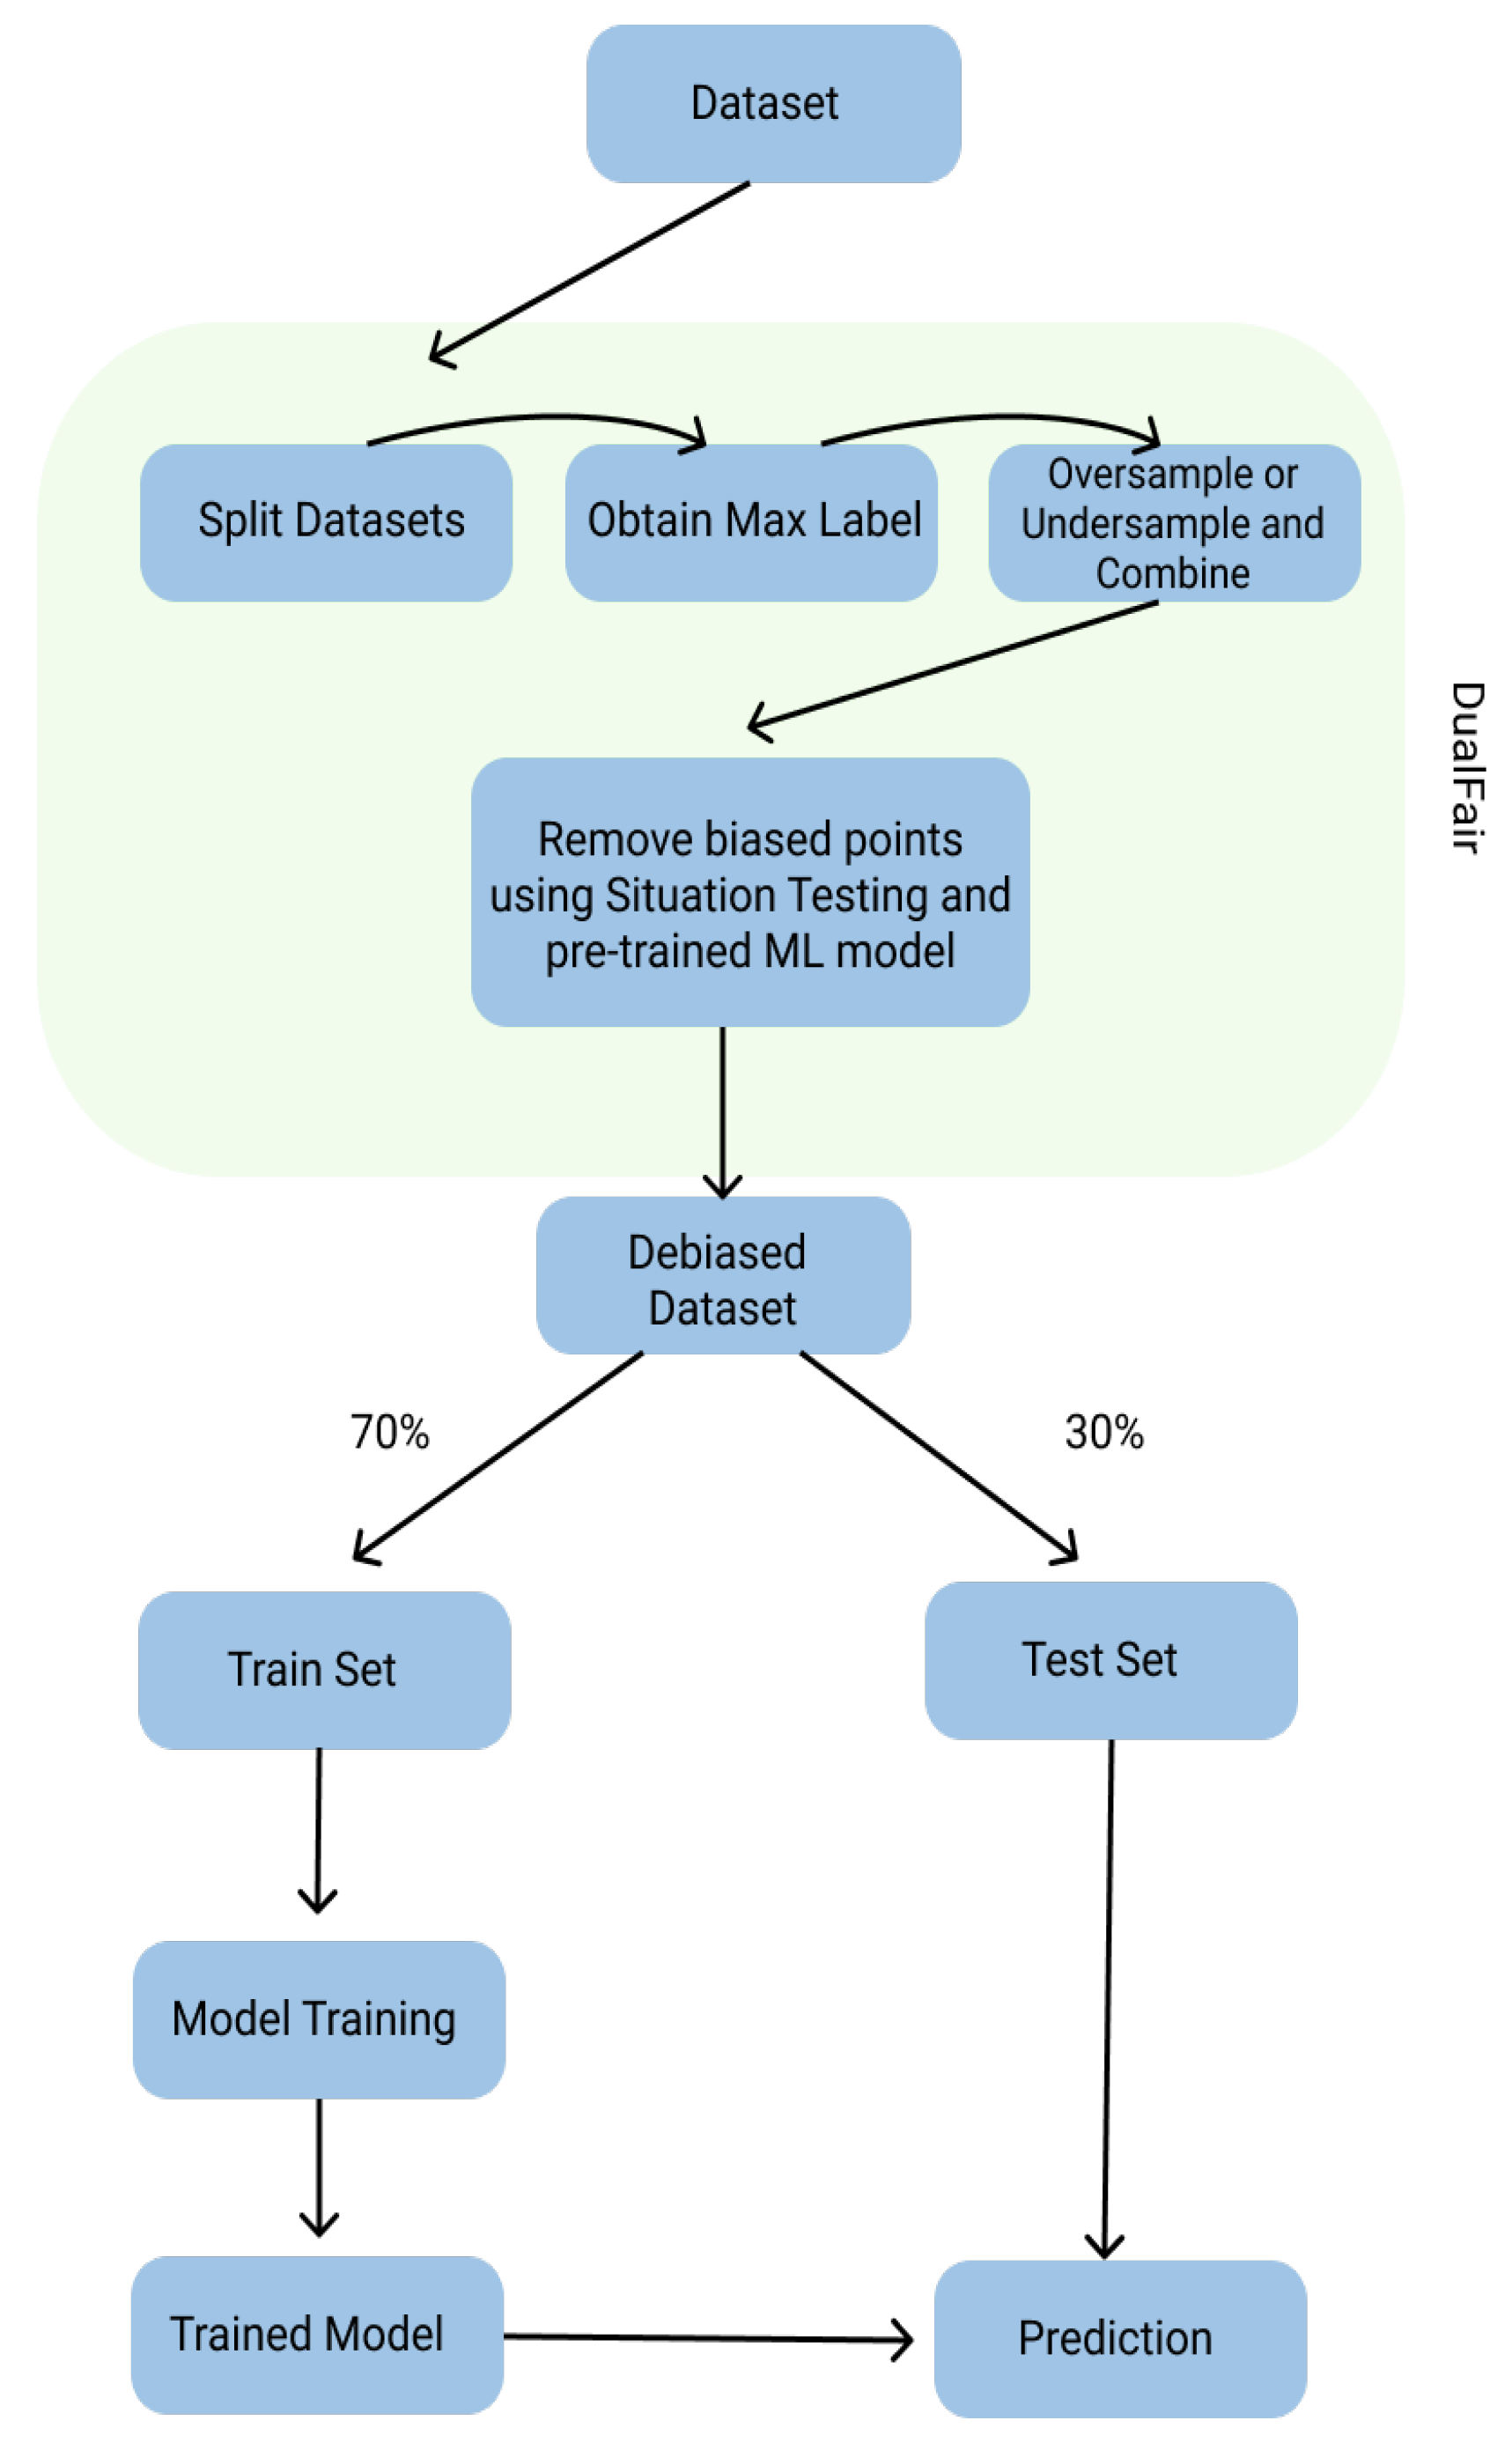
At first, DualFair splits the central dataset into sub-datasets based upon all combinations of sensitive parameters and sensitive options. The following methodology is used to designate the sub-datasets: suppose a dataset contains two sensitive parameters, sex and race. Additionally, suppose that there are only two sensitive options for each sensitive parameter, male (M) or female (F) and Black (B) or White (W). After being split, the dataset is broken into four distinct sub-datasets WM (White males), BM (Black males), WF (White females), and BF (Black females).
In the case of HMDA, DualFair results in 27 sub-datasets. We start with three sensitive parameters: race, sex, and ethnicity. Then upon each parameter, there is a division by sensitive options, where each sensitive parameter has three different options. For race, an individual could be White, Black, or joint; for sex, individuals could be male, female, or joint; and, lastly, for ethnicity, individuals could be Non-Hispanic or Latino, Hispanic or Latino, or joint. Through the combination of these sensitive parameters and options, a total of 27 unique datasets (i.e., groups) are formed and utilized extensively throughout the pipeline.
We can generate an equation to represent the count of sub-datasets given by multiplying each sensitive option count,
, of a sensitive parameter:
In our case, and each is 3; therefore, multiplication (i.e., ) gives us 27 sub-datasets.
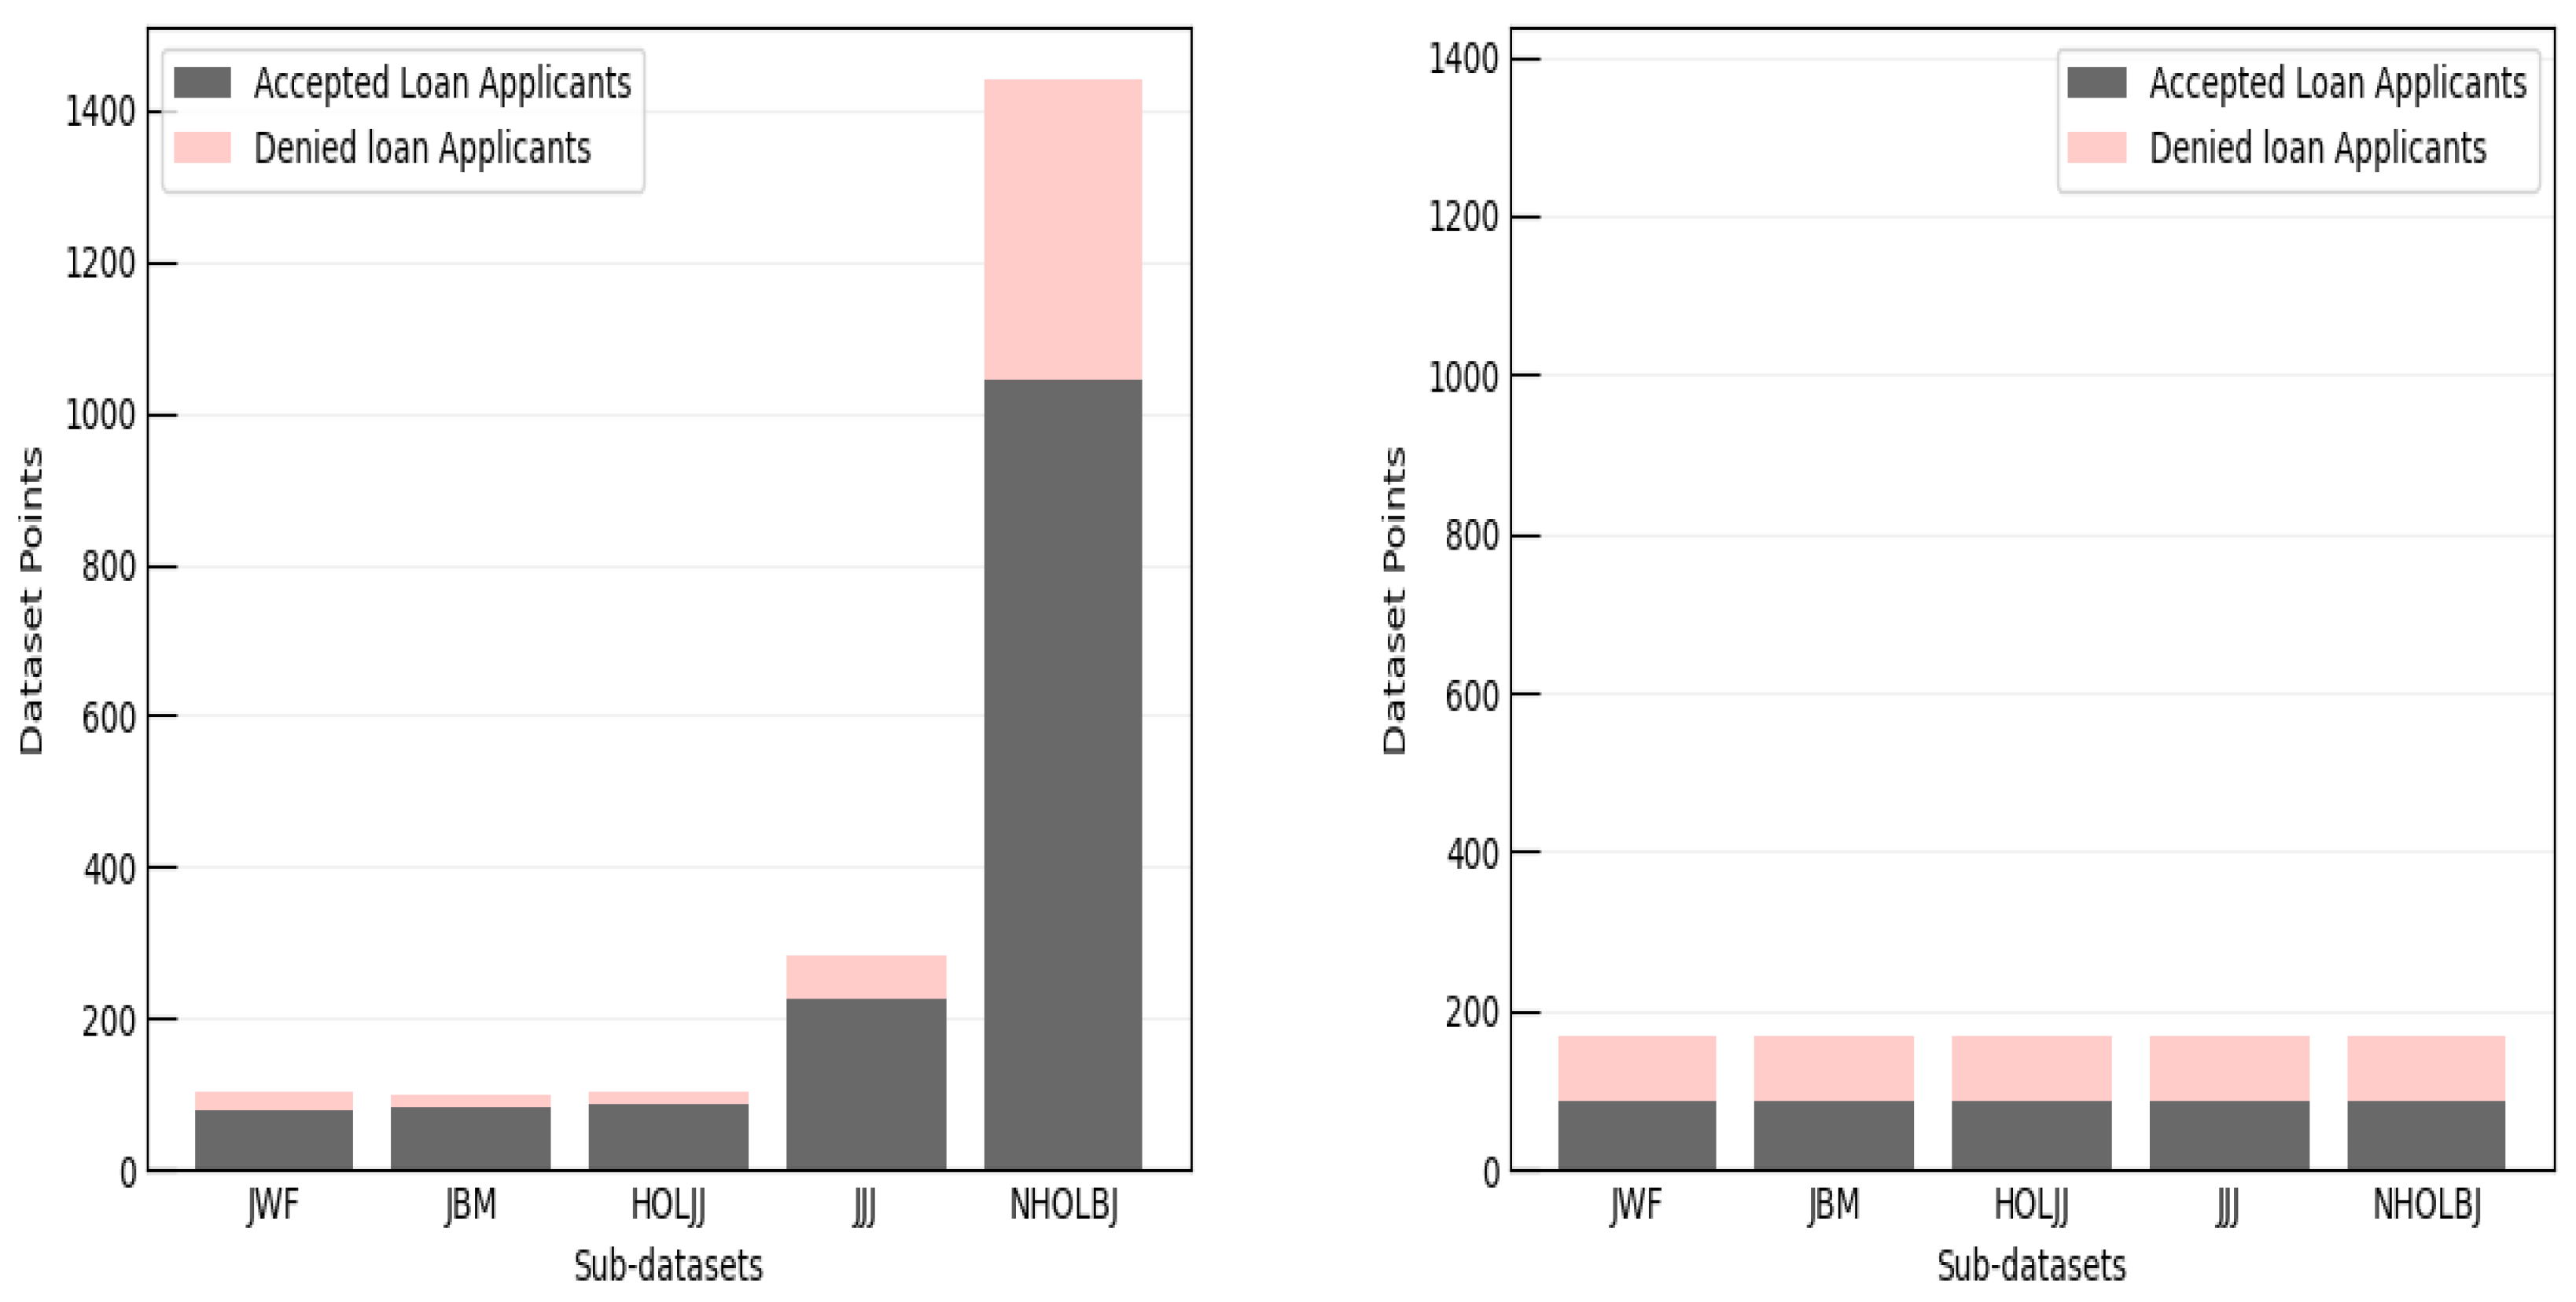
After dividing into sub-datasets, in each subset of data, we obtain the number of accepted () and rejected () labels. We take the median number of accepted and rejected labels in all subsets of data and synthetically oversample or undersample each class in the sub-datasets to that value, using SMOTE (synthetic minority oversampling technique) or RUS (random undersampling). The result of this process is a class-balanced HMDA dataset that has no selection bias.
Figure 1 captures the class and label distributions before and after selection bias are removed. Observing the figure, it can be seen that HMDA is unbalanced within the class distributions (i.e., between different subsets of data) and label distribution (i.e., balance of accepted and rejected labels within a class). Some sub-datasets are far more common in the data, while others are less represented. Thus, there is a huge imbalance that propagate root biases when trained on a model, which need to be taken into account. In the after class and label balance figure (right graph), it is shown that all sub-datasets have become balanced at both the label and class distribution level. This strips away selection bias by regulating the way that the model perceives the data. That is, the data are repaired so that no class is overly trained upon and each group has an equivalent amount of favorable labels.
In using oversampling techniques to achieve this equal distribution, we follow the general guidelines taken from Chakraborty et al. Thus, we preserve valuable associations between values when oversampling. When creating data, we make sure they are close to the neighboring examples. This allows for the average case association that may be between two particular variables. We use two hyperparameters called “mutation amount” (f) and “crossover frequency” () to carefully use SMOTE. These parameters lie in between [0, 1]. “Mutation amount” controls the probability the new data point is different from the parent point, while “crossover frequency” denotes the probability of how different the new data point is to its paternal point. When tuning, we determine that from the options of 0.2, 0.5, and 0.8, using 0.8 (80%) as the value for both of these parameters provides the best results for data generation in regards to preserving vital associations.
After balancing, our debiasing process uses a method known as situation testing, coined by Chakrabokty et al., to reduce label bias [
27]. Situation testing finds biased points within the training data by probing all combinations of sensitive options. More clearly, situation testing will test all combinations of sensitive options on an ML model trained on the balanced dataset. If all combinations of sensitive option do not result in the same prediction, then that data point is removed. For instance, given that sex is a sensitive parameter, if changing a mortgage loan applicant’s sex from male to female alters the mortgage loan approval prediction, then that data point is considered biased. This process removes biased data points from the dataset and decreases label bias.
The use of balancing and situation testing is illustrated by the DualFair process outlined in
Figure 2. After removing label and selection bias from our dataset, we have a debiased dataset that can be used in our testing framework for yielding metrics. DualFair removes the accuracy–fairness trade-off within this debiasing process, as it creates fair data to evaluate and train from. Fairness metrics are shown before and after DualFair in
Section 5.1.
4.3. Novel Fairness Metrics
Although there is a significant amount of fairness metrics proposed by the literature, all of the fairness metrics lack in one general area: non-applicability to data with multiple sensitive parameters and sensitive options. We remedy this issue by creating a new fairness metric, the alternate world index (AWI), based upon computational truths and previous literature.
Let us begin by defining fairness. Because of varying definitions of fairness in prior work, for our purposes, we will define fairness as having different sensitive groups (e.g., male group and female group) being treated equivalently and similar individuals (i.e., possess similar statistics) being treated equivalently. For this definition of fairness to occur, both group fairness and individual fairness must be met.
Mathematically, this fairness is defined as being similar to , where is the underprivileged groups, is the privileged groups, and represents the desired outcome.
Using our previous definition of fairness, we can generate a metric that satisfies the interpretation of the previous requirements for intersectional fairness work; we coin this metric AWI (alternate world index).
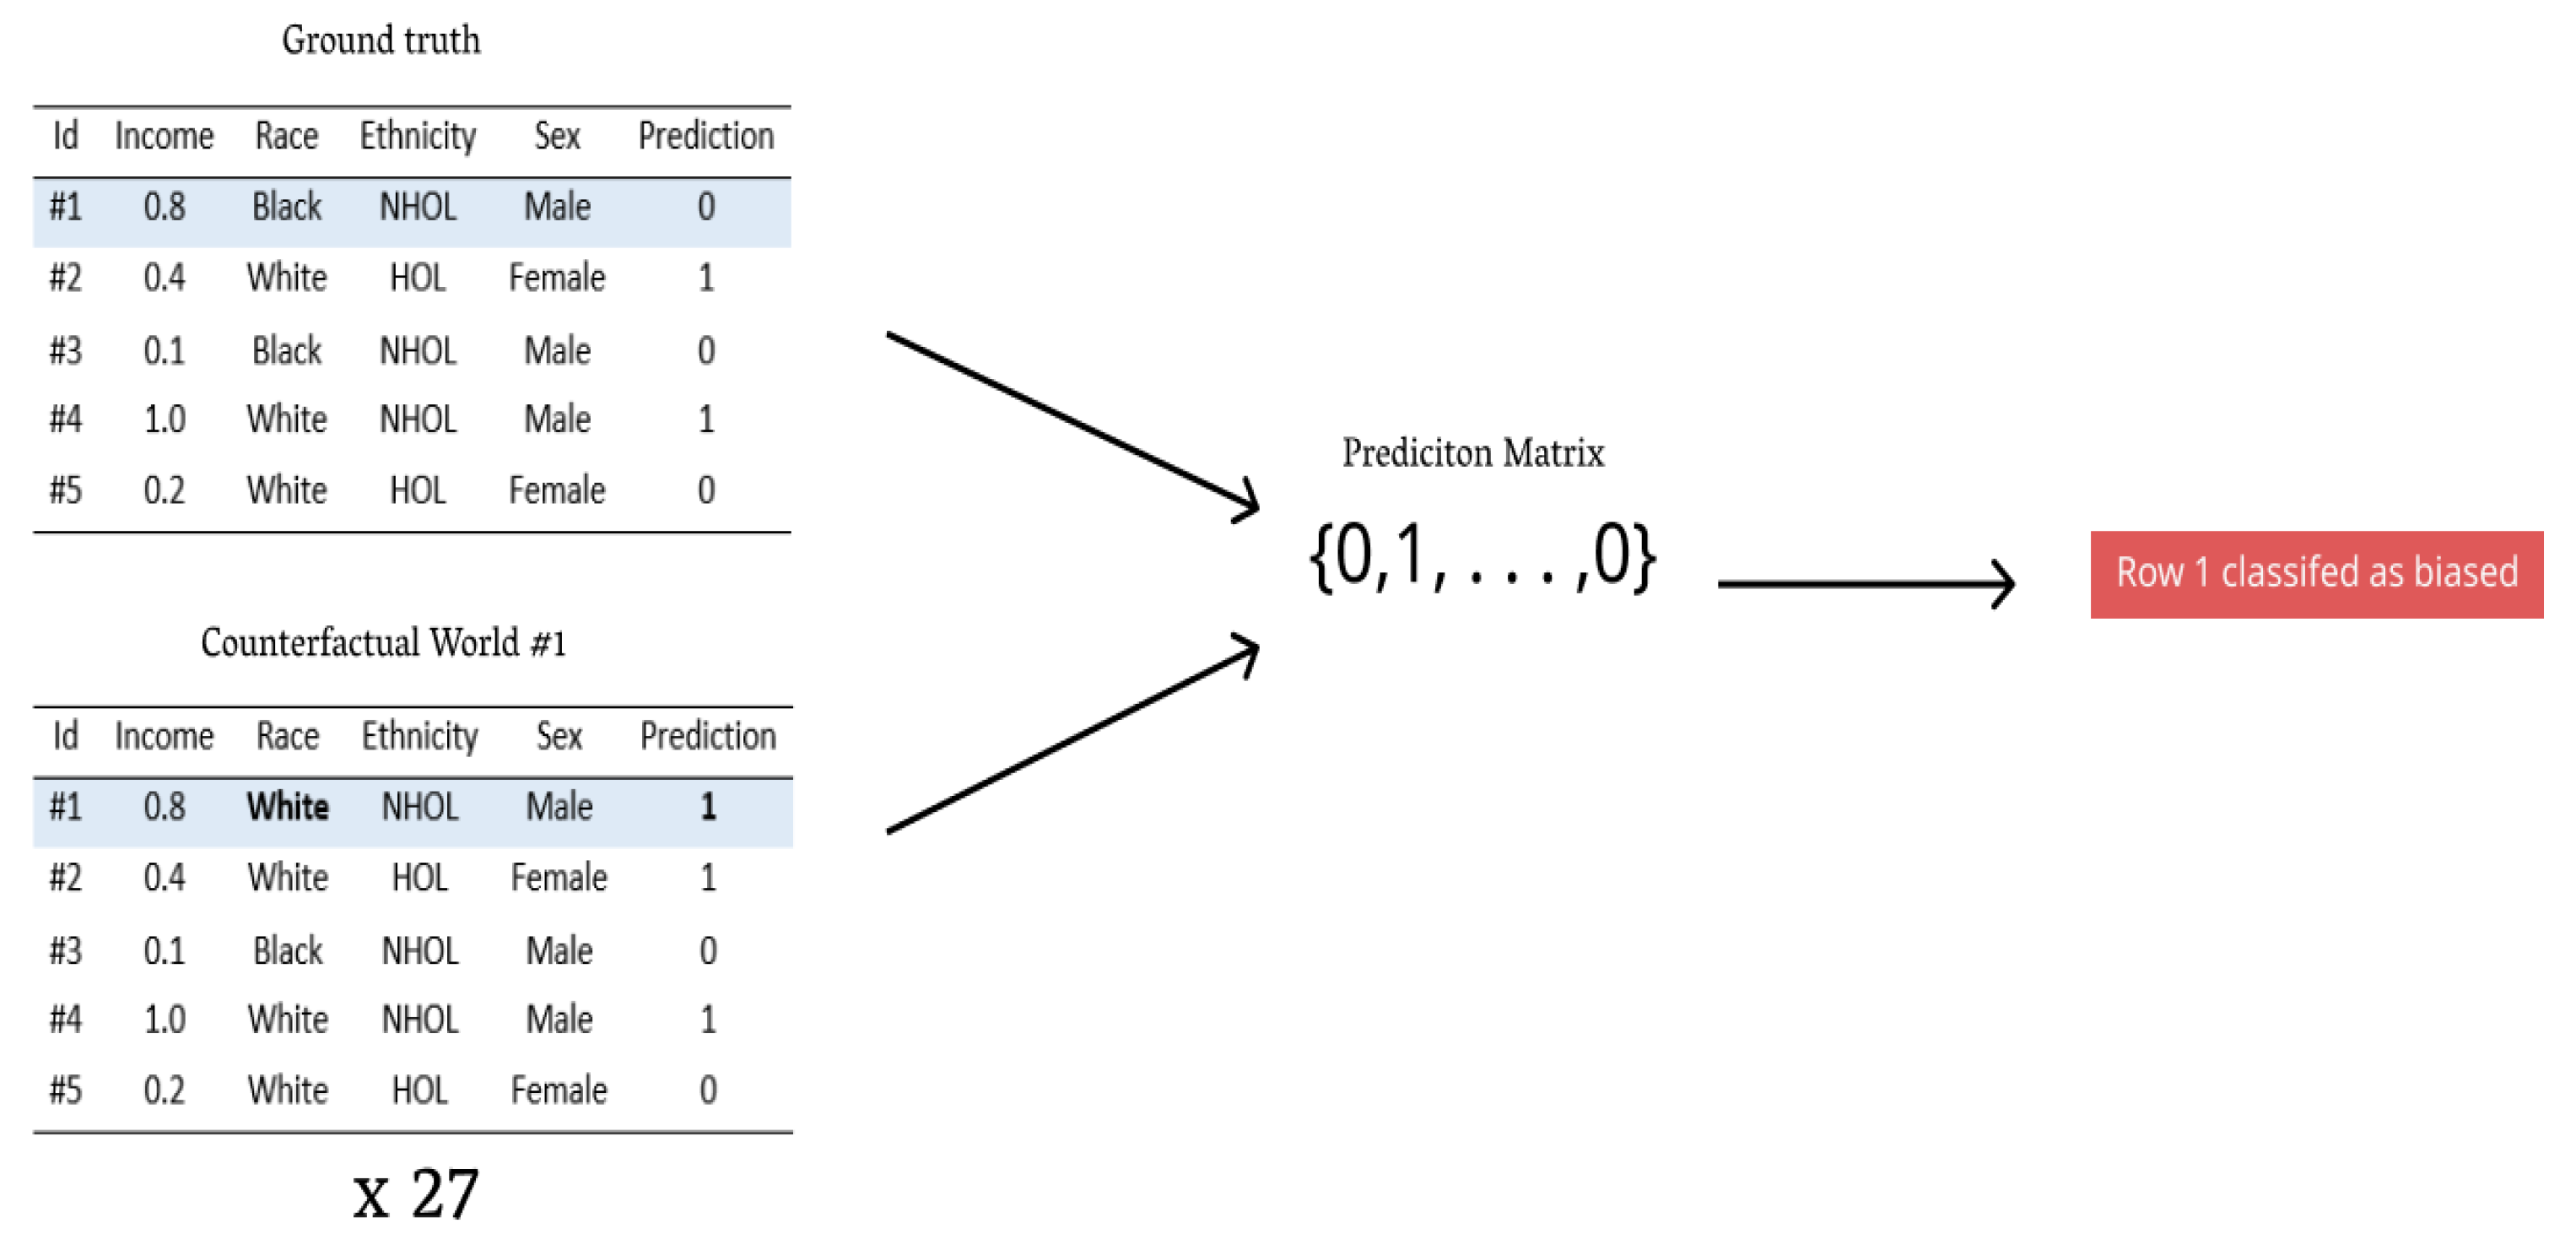
Specifically, AWI is a count of the number of biased points within a dataset normalized by the dataset size. A biased point is identified by iterating a point through all respective counterfactual worlds (i.e., similar individuals with different sensitive parameters and options) and evaluating prediction constancy with the model in use. If, under all counterfactuals, the model prediction is constant, we call this point devoid of bias; however, if one situation yields a unique result, the point is marked as ambiguous (biased).
Figure 3 illustrates this procedure. After repeating this process for all points in the test dataset, we use the count of total bias points normalized by the total dataset points to yield AWI. AWI captures model bias by inferring all biased points as synonymous to biased predictions the model made. In our study, we report AWI to be 10 times larger than its value to more accurately represent its difference, whether beneficial or harmful.
AWI extends the fairness metrics to the realm of intersectional fairness by quantifying the biased predictions within a dataset using counterfactuals. By doing this, we solve two major problems when applying fairness metrics to data with multiple sensitive parameters and sensitive options: (1) an unequal amount of privileged to unprivileged group and (2) the lack of one holistic fairness value for an entire dataset.
AWI takes a pragmatic approach to fairness evaluation, specifically targeting similar individuals and their different realities. It is a versatile metric for any work looking to achieve individual or group fairness with or without multiple sensitive parameters and sensitive options. One pitfall of AWI is its computational expense, especially with large volumes of data, as all class distributions must be predicted upon. Future research could look for directions in optimization.
Since AWI is a metric of our own creation, we utilize the average odds difference (
AOD), a method of equalized odds fairness from Chakraborty et al., as a method of comparison in testing [
26].
AOD measures the average of difference in false positive rates (
FPR) and true positive rates (
TPR) for unprivileged and privileged groups [
27]. Mathematically,
AOD represents the following:
Two major flaws with AOD for our work is that (1) an unprivileged and privileged group must be designated and (2) AOD can only account bias for one sensitive parameter at a time (i.e., cannot collectively handle data with multiple sensitive parameters and sensitive options). Point 1 serves an issue when using multiple option datasets (i.e., datasets including multiple options, such as White, Black, and joint for a parameter such as race) because only two options can be designated as privileged and unprivileged. To circumvent this issue, we refrain from including joint in all of our AOD testing calculations. Point 2 raises the issue that all biases within a dataset are not measured at once. However, for our use case, we attempt to deal with this issue by measuring three AOD metrics simultaneously, , , and , for all runs.
4.4. Experimental Design
Here, we describe the process we used to prepare our data for our experiments. Our study used the 2020 HMDA data for the training and testing set and logistic regression (LSR) as the classification model. We decided to use logistic regression with default settings as our classification model because it is a simple model that does not require a large amount of high-dimensional data, which is not a common occurrence in the fairness domain due to the process of debiasing datasets. Furthermore, due to the model’s simplicity and interoperability, previous literature has frequently used the model for classification problems and, in most cases, concluded it to be the best performing classifier for their task. For each experiment, the dataset is split using 5-fold cross validation (train—70%, test—30%). This step is repeated 10 times with a random seed and then the median is reported. The feature columns that have at most 25% of the values as missing or not applicable are kept, but any rows containing said values that are missing or not applicable are removed. Additionally, non-numerical features are converted to numerical (e.g., female—0, male—1, and joint—2) values. It is important to note that any data points that do not contain White, Black or joint as the race are removed. Finally, all feature values are normalized between 0 and 1.
Now, we describe how we obtained the results for each of our experiments. In DualFair, the training and testing data are both repaired during the bias mitigation pipeline. We evaluated AWI, , , and fairness metrics before and after the bias mitigation process for comparison. To do this, we first trained a classification model on the training data (i.e., either before or after DualFair) and then measured its fairness and accuracy on testing data. Our accuracy was measured in terms of recall, specificity, accuracy, and F1 score. Fairness was measured in AWI, , , and . Recall, specificity, accuracy, and F1 score are better at larger values (i.e., closer to 1), while AWI, , , and are better at smaller values (i.e., closer to 0).
In this work, we perform experiments using DualFair on 2020 state-level data from two small states (<150,000 rows of data), two medium states (>150,000 to <250,000 rows of data), and two large states (>250,000 rows of data). We also perform an experiment using DualFair on 2018–2020 nationwide HMDA (2,265,000 rows of data). For this experiment, we randomly sample 755,000 rows from each year and then apply DualFair. For selecting our two small, medium, and large states, we group all states according to category and randomly sample two states from each group.
5. Results
We structure our results around three central research questions (RQ).
5.1. RQ1: How Well Does DualFair Create an Intersectional Fair Loan Classifier?
RQ1 explores the performance of our pipeline in debiasing mortgage data and creating a fair loan classifier. It is reasonable to believe that a fair loan classifier should perform two things proficiently: prediction and fairness. Accordingly, we test DualFair for both performance metrics (e.g., accuracy, recall, precision, and F1 score) and fairness metrics (e.g., AWI,
,
, and
). A summary of all the metrics we use can be found in
Table 2.
In
Table 3, we give the performance and fairness before and after the DualFair pipeline. We run seven different trials from a range of small, medium, and large states as well as nationwide. Columns 1, 2, 3, 4, 5, 6, and 7 summarize the results of DualFair on the trials. Measured in terms of AWI, DualFair is successful in increasing fairness for 5 of 7 states varying in data size. Measured in terms of
,
, and
, DualFair is successful in increasing fairness for 7 of 7 states. A state is considered successful if a majority of the
AOD metrics show improvement. In terms of transitions (i.e., changes between before and after the pipeline),
,
, and
increase fairness in 18 of 21 transitions. It is important to note that AWI,
,
, and
are all multiplied by 10 to more accurately represent their differences before and after the bias mitigation pipeline. In addition to fairness, DualFair benefits precision and specificity on all occasions while damaging recall and F1 score only slightly.
We hypothesize that medium states, columns 4 and 5, falter in their ability to improve fairness, AWI, as their median oversampling and undersampling value tends to be small compared to counts of individuals in certain classes. For robustness, taking an average rather than a median for the oversampling and undersampling value may provide improved results in the future.
Thus the answer to RQ1 is “DualFair establishes an intersectional fair loan classifier that achieves both high levels of accurate prediction and fairness”. That is, DualFair can mitigate bias within data with multiple sensitive parameters and sensitive options while maintaining high levels of accuracy. This is one of the biggest achievements of our work and is pivotal toward real-world applicability.
5.2. RQ2: Does DualFair Eliminate the Accuracy–Fairness Trade-off?
RQ2 seeks to consider if DualFair effectively removes the accuracy–fairness trade-off. That is, we hope to explore if our pipeline resulted in consistent accuracy while increasing fairness simultaneously.
In all our testing, including our seven rigorous trials in
Table 3, we found that our accuracy remained consistent prior to debiasing. It also remained stagnate after debiasing, albeit showing an increase in fairness metrics. We hypothesize that the reason for this derives from our pipeline which “repairs” both training and testing data. We believe the repair process ensures that a fair model is evaluated upon fair data. This leads the model performance to remain equivalent both prior to and after DualFair.
Hence, the answer to RQ2 is “Yes, DualFair simultaneously removes the accuracy–fairness trade-off while achieving individual fairness”.
5.3. RQ3: Is DualFair Capable of Capturing All Sensitive Parameters and Sensitive Options in HMDA Data?
To answer RQ3, we analyzed DualFair’s time complexity with increasing multiple sensitive parameters and sensitive options for HMDA data. The literature has suggested that all sensitive parameters and sensitive options may not be both computationally and logically feasible due to data division into very small, unmanageable regions.
Our analysis of DualFair’s time complexity tells us that it is possible for DualFair to scale to all sensitive parameters and sensitive options. We determined that although DualFair’s computational expense compounds at a rate of , our mitigation strategy is still adequate at scaling with the demand of more sensitive parameters or options for HMDA data, as it only contains about six sensitive parameters with an average of three sensitive options, each.
One limitation of this conclusion is that adequate data must be provided. That is, at least two individuals from all sub-datasets of the original data must be present. In addition, each sub-dataset must contain at least a rejected individual (y = 0) and an accepted individual (y = 1) to generate oversamples, using SMOTE. Thus, there arises a problem with the data fragmentation into small sub-datasets when large data with multiple sensitive parameters and sensitive options may not be readily available.
Overall, DualFair has the capacity to scale to all of HMDA, given its limited quantity of sensitive parameters and options and large dataset size that can provide adequate data.


