Abstract
This study investigates the effect of rice husk content (0–60 wt.%) on the thermal, mechanical and rheological properties of polypropylene composites prepared by extrusion and injection molding. A temperature-invariant approach was applied to analyze the viscoelastic properties, allowing the combination of data obtained at different temperatures. The results show that as the husk content increases, the elastic modulus and hardness rise linearly, while the impact strength and elongation at break significantly decrease. Composites with 40–50% filler exhibit a balanced combination of strength and stiffness, as confirmed by the summary data in the table (provide references). The application of the temperature-invariant viscosity method confirmed its effectiveness in evaluating the flow properties of composite melts. The obtained results have practical significance for the development of eco-friendly polymer materials with natural fiber fillers.
1. Introduction
In the conditions of depletion of fossil sources of raw materials, increased environmental pollution and other negative factors [], the urgent task is to develop mechanisms for sustainable development based on the use of renewable sources of raw materials and effective technologies for their processing. One of the promising directions is the utilization of agricultural waste, the volumes of which are increasing every year []. The husks of seeds of some cereal crops are of considerable interest among the little-used natural wastes that have no food value. Various natural fillers are widely used in the production of polymer composite materials. Studies are devoted to the study of such fillers as wood flour, sunflower husk, flax, jute, sisal, coconut fiber, banana fibers, coffee grounds and others [,,,,,].
Of particular value is the use of agricultural production wastes, such as rice husk (RH), in the creation of polymer composites [,,,]. The advantages of such materials are their low cost and annual reproducibility of the raw material base, which makes them attractive for industrial applications. The volume of rice husk in the world, as a by-product of rice processing [], is about 80 million tons per year []. The chemical composition of husk is close to wood: cellulose (28–48%), hemicellulose (23–28%), lignin (12–16%) and up to 19% silica. Silicon dioxide gives the material thermal and chemical resistance as well as abrasive properties []. Cellulose and hemicellulose provide strength and flexibility, while lignin provides stiffness and bioresistance [,].
Countries with large rice production, such as China and India, have developed technologies for using rice husk as filler for polymer composites. However, the hydrophilicity of the fillers and the hydrophobicity of the matrix cause compatibility problems []. To solve them, additives [] such as polyolefins modified with maleic anhydride [,,,], as well as various types of modification involving exposure to radio waves, ultraviolet and charged particle streams [,,] are used. In earlier works [,,], biochemical methods of modification of natural fillers for polypropylene based composites were investigated. The study showed that biochemical modification improves the performance characteristics of the composite.
Polymer composites with RH can be used in the automotive industry [,], in the construction industry for insulation panels and building materials due to their high resistance to biodegradation [,,], and in the consumer goods industry to create biocomposites suitable for the production of tableware, containers, various types of durable packaging and other durable products [,]. However, large-scale utilization of MS is limited due to lack of awareness of processing methods and economic difficulties. These problems require the development of processing technologies to reduce costs and increase the value of this raw material.
Polypropylene (PP) based composites with the addition of rice husk (RH) at different concentrations have been studied in a number of studies. Extrusion and injection molding methods were used in the works presented below. In a study by Raghu et al. [] composites containing 10, 20, 40 and 50 wt.% rice husk were blended using an extruder with a segmented screw configuration. It was found that increasing the filler fraction up to 50 wt.% resulted in a tensile strength reduction of about 40 wt.% compared to samples containing 10 wt.% of RH. The analysis conducted by Aridi et al. [], involved the study of composites with rice husk content ranging from 35 to 55% at particle sizes of 100–500 μm. The results showed that the specimens with 50 wt.% filler exhibited optimum tensile and flexural strength characteristics as well as maximum flexural modulus. In another study, authors Razavi et al. [] considered composites in which the RH content was expressed in parts per 100 parts of polymer (0–40 parts). At a dosage of 40 parts, a 33% increase in tensile modulus and an almost two-fold increase in flexural modulus were observed. However, the yield strength and strength properties of the composites remained lower than those of the original polymer matrix. Miguel A. et al. [] investigated composites with filler content of 10, 20 and 30 wt.%. The experimental data showed that the tensile and flexural modulus of elasticity increased by 63% and 75%, respectively, compared to pure polypropylene, while the relative elongation at break decreased with increasing RH concentration. A similar study was conducted by Korean scientists [], who studied composites with 150–170 μm filler at a concentration of 0–40%. Their results showed that at 40% rice husk content the tensile strength decreased by 15% compared to pure polymer. Similar results were obtained in other studies [,,,], confirming the influence of rice husk content on the mechanical properties of polypropylene composites. It should be noted, according to the results of the research works, that the increase in the size of rice husk particles over 500 μm reduces the adhesion of the filler with the polymer matrix, while particles less than 100 μm are prone to agglomeration, which worsens the dispersion of the filler.
The analysis of scientific literature has shown that studies of PP/RH composites demonstrate considerable interest in this subject, but have a number of limitations. The main problem is the narrow range of investigated filler dosages, which makes it difficult to generalize the data and develop universal recommendations for industrial applications. In addition, most of the studies are carried out on laboratory equipment, which limits their applicability in conditions of large-scale production []. Differences in composite preparation methods and technological parameters significantly affect the mechanical properties of materials, creating difficulties in the transition from experimental samples to mass production [,]. Another limitation is insufficient attention to the operation of materials; the issues of long-term moisture absorption, thermal resistance and rheological properties at different temperatures are not always studied. This makes it difficult to predict the behavior of such composites in real operating conditions.
This study is distinguished by its experimental approach and scope, which address key gaps in prior work. In particular, it employs a semi-industrial twin-screw extrusion and injection molding setup to closely simulate large-scale production conditions, ensuring high reproducibility and industrial relevance of the results. Moreover, the research introduces a temperature-invariant viscosity characterization technique that allows unified analysis of rheological behavior across different processing temperatures. By examining polypropylene composites with a broad range of rice husk filler loadings (0–60 wt.%), the study provides comprehensive insights into how filler content affects mechanical, thermal and rheological properties under realistic conditions, something not achieved in earlier studies limited to narrower filler ranges and laboratory-scale processes. These innovations collectively constitute the scientific novelty of the work, enabling more generalizable conclusions and practical guidance for sustainable PP/RH composite development.
2. Materials and Methods
2.1. Materials
As the polymer matrix, extrusion-grade polypropylene PP H250 GP/3 produced by SIBUR Holding (Tobolsk, Russia) was used. This material is a general-purpose polypropylene homopolymer characterized by a high melt flow rate of 25 g/10 min (230 °C/2.16 kg, GOST 11645 [], equivalent to ISO 1133), an optimal stabilization system, and balanced physico-mechanical properties. The physico-mechanical properties of the material include a tensile strength of 30 MPa and elongation at break of 10% (GOST 11262 [], equivalent to ISO 527-2), a flexural modulus of 1300 MPa (GOST 9550 [], equivalent to ISO 178), and a notched Izod impact strength of 2.0 kJ/m2 at 23 °C (GOST 19109 [], equivalent to ISO 180). The thermal properties of PP H250 GP/3 polypropylene demonstrate a Vicat softening temperature of 155 °C (10 N, GOST 15088 [], equivalent to ISO 306) and a heat deflection temperature of 80 °C at a load of 0.45 MPa (GOST 12021 [], equivalent to ISO 75). The material is designed for injection molding and compounding. The manufacturer confirms compliance with the REACH regulation, stating that the monomers and additives used are registered in accordance with EU legislation.
In this study, rice husk (RH) produced by LLC “Agrodar” (Krasnodar, Russia) was used as the filler. The RH particles had an average size of 160 μm with an aspect ratio ranging from 1:1 to 1:3 (length-to-thickness ratio). Particle size distribution analysis showed that 85% of the particles were between 140 and 200 μm in size, while the remaining fraction (15%) consisted of smaller particles (50–140 μm). The selected particle size range (up to 200 μm) was chosen based on a literature review to ensure optimal dispersion and adhesion to the polymer matrix surface. To increase the heat resistance of polymers during processing, the antioxidant Irganox 1010 produced by BASF Societas Europaea (Ludwigshafen, Germany) was used.
2.2. Preparation of the Composition
As part of the study of PP/RH composites, different dosages ranging from 0% to 60% were determined. This choice is due to the fact that if the dosage increases above 60%, the quality of the samples deteriorates, making them unsuitable for further use. The materials were mixed on a semi-industrial twin-screw extruder ZE 25*60 manufactured by KraussMaffei (Parsdorf, Germany), at 400 rpm and die pressure of 15 bar. The extruder includes a number of functional zones, each of which fulfills a specific role in the mixing process. The extruder design and functional zones are shown in Figure 1.
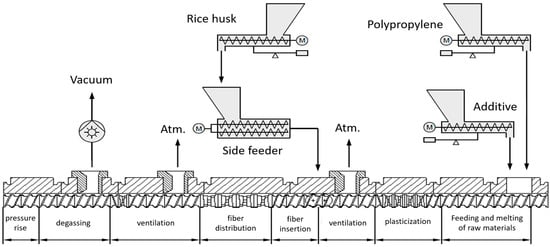
Figure 1.
Extruder design.
Correspondence of Temperature Zones to Functional Sections of the Extruder:
T1 = 50 °C—Feeding and melting of raw materials. The low temperature is due to the initial loading of polypropylene (PP) and additives. T2 = 100 °C, T3 = 100 °C—Plasticization. Gradual heating to soften the polymer. T4 = 160 °C, T5 = 160 °C—Ventilation. Moderate heating to remove volatile components. T6 = 160 °C—Fiber insertion. The temperature increases to prepare for the loading of rice husk (RH) through the side feeder. T7 = 170 °C, T8 = 180 °C—Fiber distribution. Optimal temperatures for homogeneous mixing of RH with the PP melt. T9 = 190 °C, T10 = 190 °C—Degassing. Maximum heating to remove residual gases and moisture. T11 = 190 °C, T12 = 190 °C, T13 = 190 °C—Pressure rise / Forming. Maintaining high temperature to ensure the fluidity of the mixture before exiting through the die.
The formulation of composites is presented in Table 1.

Table 1.
Formulation of PP/RH composites with different filler dosages.
The ClassiX CX 50-180 injection molding machine manufactured by KraussMaffei (Parsdorf, Germany) was used to produce specimens for physical and mechanical tests. Technological parameters were as follows: injection pressure—80 MPa; temperature zones—T0 = 80 °C, T1 = 180 °C, T2 = 185 °C, T3 = 190 °C, T4 = 195 °C and T5 = 200 °C; the temperature of the matrix during the injection process into the mold was 200 °C. Before testing, the specimens were additionally held at 23 °C and 50% relative humidity for at least 40 h.
2.3. Measurements
2.3.1. Infrared Spectroscopy
Infrared (IR) spectroscopy was performed to evaluate the presence of PP degradation after mixing. The studies were conducted using a Perkin Elmer Spectrum 100 FTIR spectrometer (PerkinElmer, Inc., Shelton, CT, USA) equipped with an ATR (attenuated total reflection) accessory at room temperature in absorption mode. IR spectra were recorded from 550 cm−1 to 4000 cm−1 with a resolution of 1 cm−1, and ten scans were performed to improve the accuracy of the analysis. Background spectra were obtained before testing the samples in an empty chamber to minimize the influence of moisture and carbon dioxide (CO2) present in the air on the results.
2.3.2. Differential Scanning Calorimetry
Differential scanning calorimetry (DSC) analysis was performed using a differential scanning calorimeter DSC204 F1 Phoenix (Netzsch, Waldkraiburg, Germany). Samples from the prepared tensile samples were placed in a standard aluminum crucible with a volume of 40 μL, closed with a lid with a hole diameter of 0.07 mm. The experiments were carried out in an argon atmosphere of 150 mL/min at a heating rate of 10 K/min in the temperature range from 25 °C to 200 °C. The DSC was calibrated according to the manufacturer’s recommendations by measuring six standard compounds (Hg, In, Sn, Bi, Zn and CsCl). Each value (temperature and peak area) was determined three times. Using the mean value, calibration curves were constructed. The errors of temperature and enthalpy determination, were 0.1 K and 1%, respectively.
2.3.3. Extraction
Composite extraction was carried out to quantify the percentage of filler residue in the sample using a Soxhlet apparatus. Samples weighing 2 g were mechanically sliced beforehand and placed in cellulose bags to ensure efficient extraction. Orthoxylene was chosen as the solvent. The extraction process was carried out at 144 °C for 10 h. To increase the reliability and reproducibility of the obtained results, three parallel experiments were conducted, each of which was carried out under strictly identical conditions.
2.3.4. Scanning Microscope
Two types of microscopy were used to evaluate the surface of the investigated materials: scanning electron microscopy with magnification up to 100× on an electron scanning microscope model REM-100U (ZAO NPP REM, Moscow, Russia), at an accelerating electromagnetic field voltage of 30 kV and imaging mode SE—secondary electrons, as well as light microscopy with magnification up to 100× using an optical microscope model JENAVAL by ZEISS (Oberkochen, Germany), designed for observations in both transmitted and reflected light. Sample preparation included pre-cooling to ensure structural integrity during crack formation and to minimize plastic deformation at the fracture sites. The specimens were placed in an Exal 2223T thermal chamber manufactured by Climats (Aubière, France) at −60 °C where they were incubated for 2 h to achieve uniform cooling throughout. After cooling, the specimens were mechanically fractured to create the desired fractures.
2.3.5. Synchronous Thermal Analysis
Thermogravimetric analysis (TGA) and differential thermal analysis (DTA) were performed to determine the thermal stability of the samples at elevated temperatures. The studies were carried out using a PerkinElmer (Waltham, MA, USA) STA 6000 synchronous thermal analyzer. During the experiment, the mass loss of the sample (% of the initial mass) was measured during heating at a rate of 5 °C/min in the temperature range from 30 °C to 400 °C in an oxidizing environment (air).
2.3.6. Determination of Physical and Mechanical Properties
Experimental studies of the mechanical properties of materials were conducted on a universal testing machine UGT-AI7000-M (manufactured by Gotech Testing Machines Inc., Taiwan) equipped with a high-precision HM2D4-C3-5.0t-5B6 strain gauge force sensor with a maximum load capacity of 50 kN. The testing system was controlled, and data were recorded using specialized software “Universal Testing Machine TPM Tochline” (version x.x.129.2), which ensures load parameter control, data acquisition and processing of experimental data in accordance with applicable standards.
The investigation of tensile strength properties was carried out in compliance with the ISO 527-2:2012 standard. The strain rate for determining tensile strength was 10 mm/min, while for measuring tensile modulus, it was 1 mm/min. The specimen dimensions in the study corresponded to Type 1A, with a gauge length of 75 mm and an initial grip separation of 115 mm. The testing temperature was (23 ± 2)°C. To ensure result reproducibility, at least 10 specimens were tested for each preparation.
The bending strength properties were determined in accordance with the requirements of ISO 178:2019. The tests were carried out according to a three-point loading scheme with a distance between the supports of 64 mm (ratio L/h = 16). A strain gauge of HM2D4-C3-5.0t-5B6 brand was used with a force measurement range up to 50 kN. at a strain rate of 5 mm/min. To estimate the bending modulus of elasticity, a highly sensitive strain gauge H3-C3-100 kg-3B-D41 with a measuring range up to 1 kN was used, as well as an extensometer LGF-0525ZL-B with an operating range from 0.5 μm to 25 mm). The strain rate for bending elastic modulus was 1 mm/min. To ensure the reproducibility and statistical significance of the results, each experiment was performed at least ten times. The test temperature was (23 ± 2) °C. For reproducibility of results, at least 10 samples were tested for each formulation.
Shore hardness was measured using a TVR-AC durometer (Vostok-7, Novosibirsk, Russia) and an OS-2 operating stand (Hildebrand, Bonn, Germany) in accordance with ISO 868 (scale D). For Shore hardness measurements, washer-shaped specimens were molded on the ClassiX CX 50-180 injection molding machine described previously. The specimens are 6 mm thick and have sufficient surface area to accommodate a measuring tip, at least 50 × 50 mm, in accordance with ISO 868. The test temperature was (23 ± 2) °C.
To determine the impact strength by the Charpy method in accordance with ISO 179-1: 2010, a GT-7045-MDL impactor manufactured by Gotech (Taiwan) was used. The pendulum energy amounted to 5 J, the velocity at the time of impact was 3.46 m/s. The tests were carried out on rectangular samples with a size of 80 × 10 × 4 mm. The pendulum was struck into the rib of the sample. The test temperature was (23 ± 2) °C, which corresponded to standard laboratory conditions. For reproducibility of results, at least 10 samples were tested for each formulation.
2.3.7. Determination of Melt Flow Index
To evaluate the melt flow index of the PP/RH composites, a temperature of 190 °C was selected. This is below the standard temperature of 230° C specified for pure polypropylene in ISO 1133-1: 2011 and specified in the product specification for PP H250 GP/3. The temperature decrease was due to the low heat resistance of the material. The melt flow rate was determined by method A (by weight) using a Smartest MFI-2322S semi-automatic device manufactured by Inteltest LLC (Moscow, Russia) at a load of 5 kg and a 5 min preheating of the sample. The measurements were carried out using a capillary with a hole diameter of 2 mm.
2.3.8. Thermo-Oxidative Aging
Thermal and oxidative aging is one of the key factors determining the durability and performance of polymer materials. In this work, the samples were subjected to thermo-oxidative aging in an air environment at a temperature of 150 °C for 100 h using a thermostating chamber with forced convection. The parameters were monitored in accordance with ASTM D3045-92.
2.3.9. Rheological Properties
The dependence of the viscosity of PP/RH composites on the flow conditions in a wide range of temperatures and strain rates was studied in the present work. For this purpose, a temperature-invariant viscosity characteristic was applied, which is based on the principle of superposition of the time–temperature scale. This method allows to reduce the data obtained at different temperatures to a single dependence using the temperature shift coefficient []. This approach provides a universal model of viscosity change, which can be used to predict the behavior of materials in processing, including injection molding and extrusion.
The rheological properties of the compositions were investigated using a Smart RHEO 1000 capillary rheometer produced by CEAST (Pianezza, Italy), equipped with a 1400 bar load cell. Measurements were carried out at three processing temperatures (180 °C, 190 °C and 200 °C) in the continuous shear deformation mode at shear rates ranging from 20 to 1000 [1/s], using a 40 mm long capillary with a hole diameter of 2 mm. Each sample was measured at least three times, and the data were analyzed using CestView 5.94.4D software.
2.3.10. Determination of Water Absorption
To assess the moisture-absorbing properties of the PP/RH composite, samples in the form of a washer with a diameter of 30 mm and a thickness of 5 mm were immersed in distilled water at room temperature (23 ± 2 °C) for 60 days. The readings on the first day were more frequent, as the water absorption rate was higher at the initial stage. To study absorption, the samples were taken out and soaked after each period of time to remove excess water, and the final weight was immediately measured using an electronic scale (error ± 0.0001 g). The composite samples were again immersed in distilled water to continue the water absorption process. Each moisture absorption measurement procedure took less than 1 min, so evaporation of water on the surface was negligible. The mass fraction of absorbed water for each sample was calculated using the formula:
m2 is the mass of the sample after soaking in water, grams (g).
m1 is the mass of the sample after initial drying and before immersion in water, grams (g).
As a test result, the arithmetic means of three indicators obtained with the same duration of exposure to water is taken.
3. Results and Discussion
Investigating the degradation of PP/RH composite is key to understanding its stability during processing and operation. Since polypropylene is susceptible to thermo-oxidative degradation, it is important to study how temperature exposure time affects its structure and properties. This paper focuses on analyzing the formation of carbonyl groups as indicators of degradation, as well as evaluating the effect of heating time on the degree of oxidation of the material.
To evaluate the possible degradation of PP/RH composite during processing, IR analysis was carried out in this study. Considering that the temperature exposure time during mixing in the twin-screw extruder and in the injection molding machine did not exceed 10 min, thermal exposure conditions at 190 °C for 1, 5, 10, 15 and 20 min were selected in this work.
It is well known that oxidative degradation of polypropylene is an autocatalytic radical-chain process proceeding through the following sequence of stages: initiation, development, branching and chain breakage []. The main factors inducing degradation are thermal exposure, UV radiation and molecular oxygen acting as an active oxidizing agent. Of particular interest is the formation of carbonyl groups (C=O), which predominantly occurs at the branching stage of the chain. This process is due to the β-splitting of alkoxyl radicals formed by the decomposition of hydroperoxides. The detailed mechanism of thermo-oxidative degradation of polypropylene is considered in the works of Bolland and Gijsman [,].
The analysis of IR spectra (Figure 2) revealed the dependence of structural changes in the samples on the duration of thermal exposure at 190 °C during mixing. In the spectra of samples subjected to mixing for 5 min and more, the appearance of characteristic absorption bands at 1750 cm−1 corresponding to the valence vibrations of the carbonyl group (C=O) was observed.
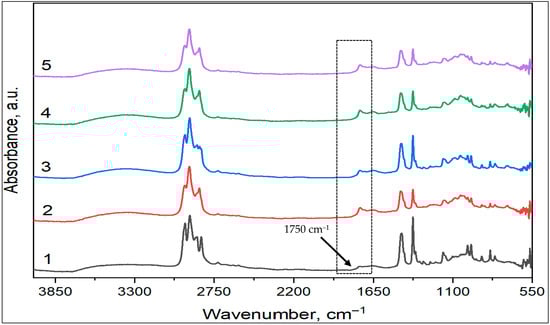
Figure 2.
Infrared spectra of PP/RH composite after mixing at 190 °C: 1—sample after 1 min, 2—sample after 5 min, 3—sample after 10 min, 4—sample after 15 min, 5—sample after 20 min. The absorption bands at 1750 cm−1 are marked with a black dashed line.
At the same time, it can be seen that in the spectrum of the sample after 1 min of mixing, the intensity of the carbonyl bands is lower compared to the other samples, which may be due to a lower degree of oxidation or degradation at the early stages of processing. The obtained data are consistent with the generally accepted ideas about the mechanism of thermal decomposition of polypropylene and indicate that even a short-term thermal effect in processing conditions can lead to oxidative degradation of the polymer with the formation of carbonyl groups in the polymer chain.
To assess the effect of filler dosage on the degree of crystallinity of PP-based composites, DSC analysis was performed. The initial DSC curves are presented in File S1 Determining the degree of crystallinity requires knowledge of the reference enthalpy of fusion for 100% crystalline polypropylene. According to the literature [], this value is = 147 kJ/kg (147 J/g). The degree of crystallinity was calculated using the following formula:
—heat of melting (J/g) for the entire mass of the composite,
—mass fraction of PP in composite,
—the reference heat of melting for 100% crystalline PP.
Table 2 shows the measured values of the heat of melting of composites, the mass fraction of the polymer, and the calculated degree of crystallinity , %.
Table 2.
The results of calculations of the degree of crystallinity.
It has been experimentally established that an increase in the filler dosage reduces the degree of crystallinity of the polymer composite. This is due to the fact that filler particles physically reduce the volume available for crystallite growth. They also disrupt the ordered packing of macromolecules and limit their mobility. At high concentrations, the filler forms spatial meshes, further hindering crystallization. As a result, the size of crystalline regions decreases and the proportion of defects in the crystal structure increases []. The highest degree of crystallinity is observed in the control sample (68.8%), where the polymer contains no filler. When 10% filler is added, the crystallinity decreases slightly to 63.6%. However, a further increase in filler content to 60% results in a significant reduction in crystallinity, down to 51.0%.
The thermal stability of PP/RH composites with different filler contents was evaluated based on thermogravimetric analysis (TG-DTA, Figure 3). The graph shows thermogravimetric curves (TG, solid lines, upper part) and differential thermal analysis curves (DTA, dashed lines, lower part). The correspondence between the line colors and filler concentrations is indicated in the legend (left side of the figure). The TG curves show that in the low temperature region (29–240 °C), mass loss is observed for all samples, which increases with increasing rice husk content. This is due to moisture evaporation and decomposition of thermolabile components of rice husk (cellulose, hemicelluloses, organic impurities), the content of which increases with the increase in the filler fraction in the composite. The maximum mass loss in this interval is 4.50% for the sample with 50% and 60% filler, and the minimum is 0.30% for the control sample with 10% filler, which is probably due to evaporation of moisture and volatile components. In the temperature range of 240–400 °C, intensive mass loss begins, the total value of which also decreases with increasing proportion of rice husk. The highest mass loss in this interval (92.77%) was recorded for the sample with 10% of filler, and the lowest—72.4%—for the sample with 60%. The conducted thermogravimetric analysis shows that the thermal stability of the composites depends on the rice husk content. At the same time, the mass loss upon heating indicates that a high filler concentration reduces the degradation rate of the matrix in the high-temperature region. This suggests a thermal stabilizing effect of the filler; however, for more accurate conclusions about the mechanisms of its influence, it is necessary to consider not only mass changes but also other factors of thermal decomposition. Nevertheless, the observed dependence confirms the possibility of improving the material’s heat resistance by adjusting the composition.
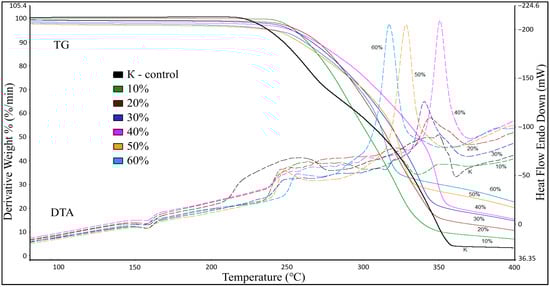
Figure 3.
TG-DTA curves of polypropylene samples filled with rice husks with different dosages.
The DTA curves show that in all samples, within the temperature range of 150–177 °C, a minor endothermic effect with a maximum around 165–166 °C is observed, corresponding to the melting of polypropylene. The filler does not significantly influence this process. In the temperature range of 215–290 °C, complex exothermic effects are observed, associated with the oxidation and initial decomposition of organic components. However, in this range, the peaks are weakly pronounced and broad, without distinct maxima. Upon further heating above 290 °C, broad exothermic effects corresponding to thermal decomposition are observed for the control sample and the sample with 10% rice husk. Starting from 20% filler content, the exothermic effect becomes more resolved, with a distinct peak in the range of 300–320 °C. As the filler content increases to 30–60%, the peak maximum shifts toward lower temperatures (290–310 °C) and becomes narrower, indicating accelerated thermal decomposition due to the flammability of rice husk. Based on the obtained data, it can be concluded that for the deposition of polymer composites containing rice husk at elevated temperatures (>200 °C), formulations with a rice husk content of 20–40% are preferable, as they exhibit an optimal balance between thermal stability and resistance to degradation.
Since the particle dosage after treatment can vary significantly from the initial amount, in this study, extraction of samples with different filler dosages was carried out (Table 3).
Table 3.
Results of the percentage of residue after extraction of PP/RH composites with different filler dosages.
The obtained data indicate a linear increase in the content of unextractable residue with increasing proportion of rice husk in the composite. Thus, if for the control sample (pure PP) the mass fraction of the residue was only 1.75%, which may be due to the presence of trace amounts of stabilizers or technological impurities, then for composites with 10–60% RH, a regular increase in this index was observed up to 10.28–60.70%, respectively. It is important to note that the experimentally determined values of the mass fraction of the residue after extraction statistically reliably correspond to the nominal content of rice husk introduced into the formulation at the mixing stage. This confirms the absence of significant losses of filler during processing and indicates the stability of the composite structure.
To analyze the filler distribution in the polymer matrix, a visual analysis of the surfaces of PP/RH composites obtained at negative temperature was performed. The main focus was to quantify the area of microcracks formed along the interfacial boundaries. Initial microphotographs are presented in File S2, while the main part of the paper contains images with highlighted defects (black lines) (Figure 4).
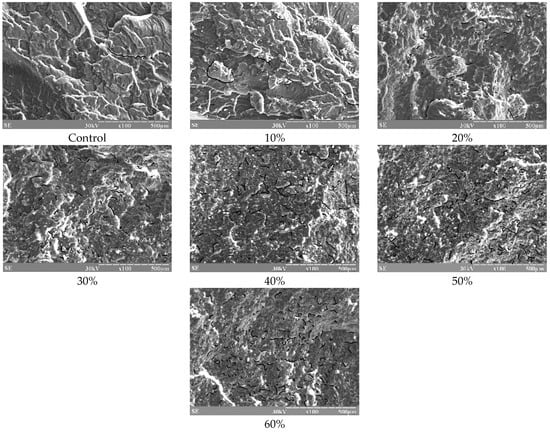
Figure 4.
Microphotographs of the surfaces of PP/RH composites with different filler dosages at 100× magnification.
The results of the study indicate that the cohesive strength of the polymer matrix is significantly higher than the adhesive strength of the bond with the filler. It was found that when the mass fraction of relative humidity increases from 10% to 60%, the area of microcracks increases from 0.59% to 3.22%, which corresponds to an almost six-fold increase. This dynamic indicates a significant decrease in interfacial adhesion, which leads to the formation of a branched network of microcracks. The obtained quantitative data are presented in Table 4.
Table 4.
Results of quantitative analysis of microcracks: the ratio of the total area of defects to the total area of the investigated surface according to microphotographic examination data.
Within the study of composite material surfaces, the spatial distribution of filler particles in the PP/RH system was analyzed (File S3). The obtained results demonstrate a clear correlation between the filler content and its surface concentration. As shown in Figure 5, an increase in the mass fraction of RH leads to a statistically significant rise in the number of particles in the surface layer of the composite.
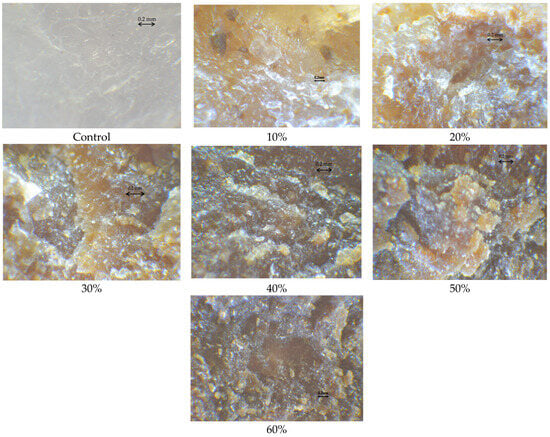
Figure 5.
Microphotographs of the surfaces of PP/RH composites with different filler dosages at 100× magnification.
The microstructure analysis revealed that the filler particles range in size from 50 μm to 200 μm. At low and medium filler concentrations, the particles are distributed relatively uniformly within the polymer matrix. However, when the threshold of 20 wt.% is exceeded, pronounced local agglomerations begin to form, which can significantly affect the material’s mechanical properties.
Further in this study, the physical and mechanical properties of PP/RH composites with different filler dosages were investigated. In the physical and mechanical test figures, the standard deviation for each specimen was represented as “whiskers”. The results show the dependence of the mechanical properties of the material on the additive content, varying from 0% (control) to 60%. Both positive and negative trends were observed.
Experimental studies showed a pronounced dependence of the mechanical characteristics of the material on the dosage of RH. The highest values of tensile strength (Figure 6) and relative elongation (Figure 7) were observed in the control sample without filler.
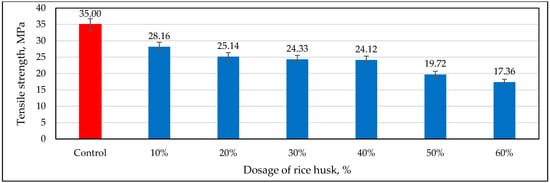
Figure 6.
Influence of rice husk dosage on the tensile strength.
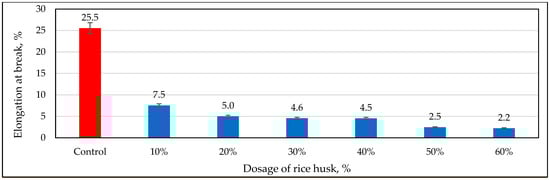
Figure 7.
Influence of rice husk dosage on elongation at break.
However, a sharp deterioration of these parameters was observed already at the minimum RH content (10%). With increasing dosage of RH up to 40%, the strength characteristics stabilized, while the ductility of the material continued to decrease. In the region of high filler concentrations (50–60%), there was an additional decrease in both strength and deformation capacity. Figure 8 shows the specimens before and after tensile tests. The data obtained show a clear trend; with increasing filler content, the material gradually loses plasticity and enters the brittle state. The dependence of tensile strength on the composition of the composite is detailed in File S4.
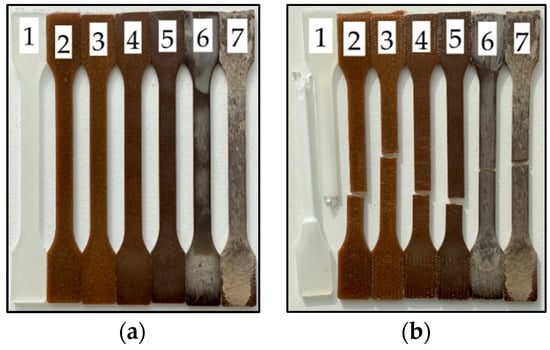
Figure 8.
Polypropylene/rice husk tensile strength specimens with different dosage sizes before (a) and after (b) testing: 1—Control, 2—10%, 3—20%, 4—30%, 5—40%, 6—50%, 7—60%.
The impact toughness of the composite gradually decreases with increasing RH filler content (Figure 9). The highest value is observed in the control sample (2.44 kJ/m2), while the addition of 10% filler causes a slight decrease to 2.40 kJ/m2. However, a further increase in RH concentration leads to a more significant drop in impact toughness—down to 1.84 kJ/m2 at 50% and 1.66 kJ/m2 at 60% filler.
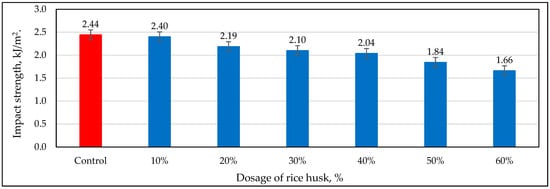
Figure 9.
Influence of rice husk dosage on Charpy notched impact strength at +23 °C.
This change in mechanical properties is explained by a combination of factors related to the composite’s morphology. Analysis of the composite surface images shows that at concentrations above 30%, RH particles begin to form agglomerates, which disrupts the material’s structural homogeneity. At the same time, adhesion at the matrix–filler interface deteriorates due to the limited compatibility of polypropylene with the surface groups of RH. This reduces the material’s ability to undergo plastic deformation and leads to the formation of stress concentration zones under impact loading.
Shore hardness measurements show the expected increase in the composite’s stiffness as the filler content rises. However, this increase does not compensate for the loss of impact toughness, as it is primarily due to the material’s increased brittleness. The observed trend is typical for filled polymer systems, where, at high filler concentrations, its negative effect on the matrix’s plastic properties becomes dominant.
As the filler dosage increases, a decrease in flexural strength at maximum load is observed (Figure 10). The highest flexural strength is recorded in composites with a 10% filler content, while the lowest value is noted at 60% filler content. As shown in Figure 11, samples with a filler content of up to 30% retain plasticity, demonstrating the ability to bend without breaking. This indicates a higher deformability of the material at low filler concentrations, whereas an increase in filler content leads to greater brittleness of the composite.
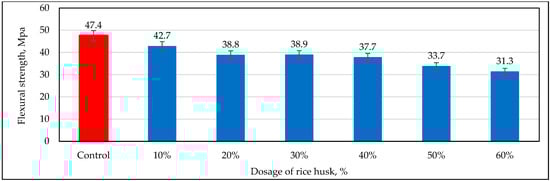
Figure 10.
Influence of rice husk dosage on the flexural strength.
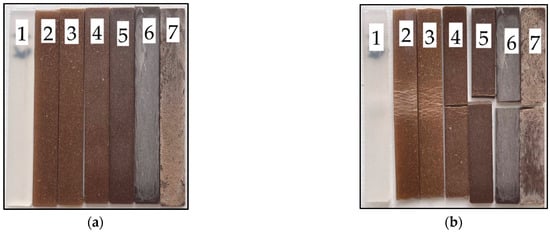
Figure 11.
Polypropylene/rice husk specimens with different filler dosages for flexural strength before (a) and after (b) testing: 1—Control, 2—10%, 3—20%, 4—30%, 5—40%, 6—50%, 7—60%.
The experimental data indicate a consistent increase in the elastic modulus under tension (Figure 12, File S5) and bending (Figure 13) with an increase in the filler concentration (RH). The introduction of 10% RH does not lead to significant changes in the tensile modulus (0.55 GPa); however, a further increase in the filler content to 60% raises it to 1.12 GPa. A similar trend is observed for the flexural modulus; in the control sample (0% RH), its value is 1.38 GPa, while at 10% RH, it increases to 1.43 GPa, and at 60%, it reaches 3.36 GPa.
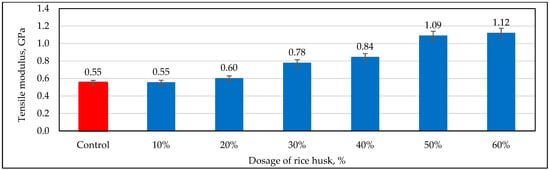
Figure 12.
Influence of rice husk dosage on tensile modulus.
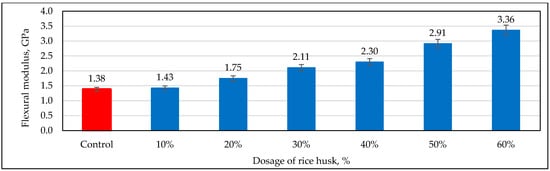
Figure 13.
Influence of rice husk dosage on flexural modulus.
A comparative analysis revealed a systematic 2–3 times higher flexural modulus compared to the corresponding tensile modulus across the entire studied concentration range. For instance, in the control sample, the modulus ratio (flexural/tensile) is 2.5 (1.38 GPa vs. 0.55 GPa), while at the maximum filler content (60%), the difference reaches a three-fold value (3.36 GPa vs. 1.12 GPa). This indicates a significantly higher stiffness of the composite material under bending load, which is attributed to the non-uniform stress distribution in the sample under this type of mechanical loading.
The observed increase in the elastic modulus with rising RH content is consistent with the literature data [,,] and is explained by the high stiffness of rice husk particles, which contain crystalline cellulose and silicon dioxide (SiO2). The mechanical reinforcement of the composite is achieved through the formation of a rigid structural framework that restricts the mobility of the polymer matrix and promotes efficient stress transfer.
The key factor determining the difference in material behavior under tension and bending is the specific distribution of stresses under different types of loading. In the case of bending, maximum deformations are concentrated in the surface layers, where the rigid filler particles most effectively resist external influence. At the same time, improved interfacial interaction between the matrix and the filler promotes more uniform transfer of mechanical stresses, further enhancing the system’s stiffness. The particularly significant increase in the elastic modulus under bending compared to tension is explained by the synergistic effect of these factors, which is most pronounced under the non-uniform stress state characteristic of bending loads.
A study of the hardness (Figure 14) and density of composites has shown that these characteristics increase with increasing filler concentration. The Shore hardness increases from 63 con. units for the control sample to 76 con. units with a rice husk content of 60%. PP/RH composites form a “core–shell” structure, where rigid filler particles are distributed in a plastic polymer matrix [,]. The increase in Shore hardness is explained by the fact that hard rice husk particles located near the surface additionally limit deformation, reducing indenter penetration [].
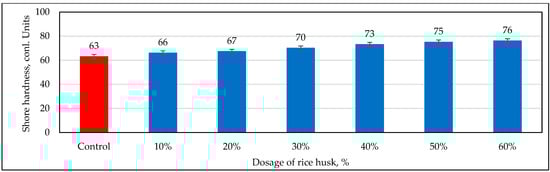
Figure 14.
Influence of rice husk dosage on the Shore hardness.
The material density (Figure 15) also increases from 0.91 g/cm3 (control sample) to 1.19 g/cm3 at the highest filler content. This is due to the increased proportion of rigid filler in the composite, which leads to a reduction in the amorphous phase of the polymer and limits its mobility [,]. Additionally, the higher material density is explained by the increase in the filler content, which has a higher specific mass compared to the polymer matrix.
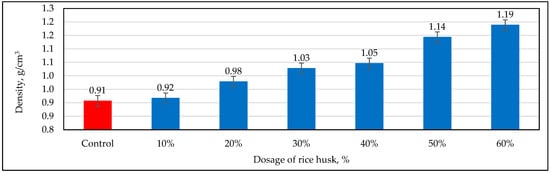
Figure 15.
Influence of rice husk dosage on the density.
As the RH content in the polymer matrix increases, a significant reduction in MFR is observed (Figure 16). For the control sample, the MFR is 49.2 g/10 min, whereas with 60% filler content, it reaches a minimum value of 5.4 g/10 min. Such a decrease in MFR is associated with the restriction of polymer chain mobility due to the presence of a rigid dispersed filler. In particular, larger particles and their agglomerates within the polymer matrix create additional mechanical resistance, hindering the free flow of the melt.
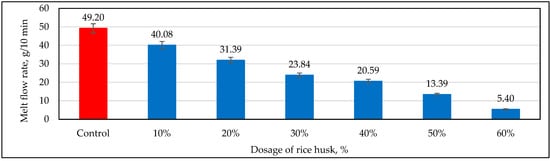
Figure 16.
The influence of RH dosage on the melt flow index.
Thermal oxidative aging of PP/RH composites at 150 °C for 100 h demonstrates the multidirectional effects of thermal exposure on the physical and mechanical properties of the material. Figure 17 shows that the control sample (pure PP) showed a slight increase in strength from 35.00 to 36.28 MPa, which may be due to additional crystallization of the polymer under the influence of temperature compared to the sample without temperature exposure. However, for composites with filler, the changes remained within the error of the experiment.
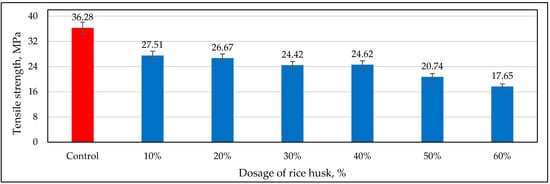
Figure 17.
Influence of rice husk dosage on tensile strength (after thermal exposure).
Thermal oxidative aging had a more significant effect on the ductility of the material. As can be seen from Figure 18, the elongation at break of the control sample decreased more than two-fold (from 25.54% to 12.34%), indicating the degradation of the polymer matrix. For the filled composites, the decrease in deformation characteristics was less pronounced, especially at low RH concentrations (10%—from 7.55% to 6.87%). At high filler contents (50–60%), the changes were insignificant.
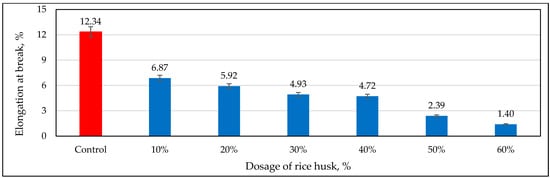
Figure 18.
Influence of rice husk dosage on elongation at break (after thermal exposure).
When analyzing the stiffness of the composites after thermal oxidation (Figure 19), it was found that the largest increase in elastic modulus was observed for the control sample (from 1.38 to 1.53 GPa). For the filled systems, the stiffness growth was more pronounced; for example, at 20% RH, the modulus increased from 1.75 to 2.16 GPa, and at 60%, from 3.36 to 3.53 GPa.
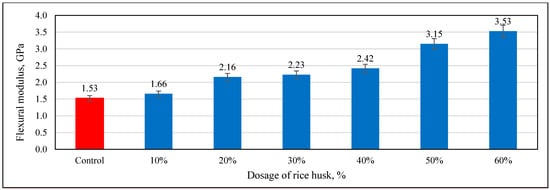
Figure 19.
Influence of rice husk dosage on flexural modulus (after thermal exposure).
The study thus shows that thermo-oxidative exposure at 150 °C for 100 h has a complex effect on the mechanical properties of PP/RH composites. An increase in stiffness with some decrease in ductility is observed, while the strength properties show a variable behavior depending on the filler content. The obtained data indicate a relatively high thermal stability of the system, especially at high dosages of RH.
To study the rheological properties, viscosity versus shear rate graphs were constructed for samples with different filler dosages (Figure 20). According to previous studies [], an increase in the filler dosage directly affects the rheological behavior of composites, increasing their viscosity and reducing their flowability during processing. The data analysis revealed that an increase in rice husk content in the polymer composition leads to a consistent rise in viscosity at all studied temperatures. This effect is explained by the fact that the introduction of RH increases internal friction and resistance to the flow of the polymer matrix, which results in an increase in the system’s viscosity. As the test temperature increases, the viscosity of the composites decreases, which is related to the reduction in cohesive interactions between the polymer macromolecules and a decrease in the structural rigidity of the system. The lowest viscosity was observed in unfilled samples and those with 10 wt.% RH, likely due to the dominant polymer matrix and weaker structural network. At the same time, the highest viscosity values are observed for samples with 60 wt.% filler, which is due to the high concentration of rice husk particles that hinder the free flow of the melt.
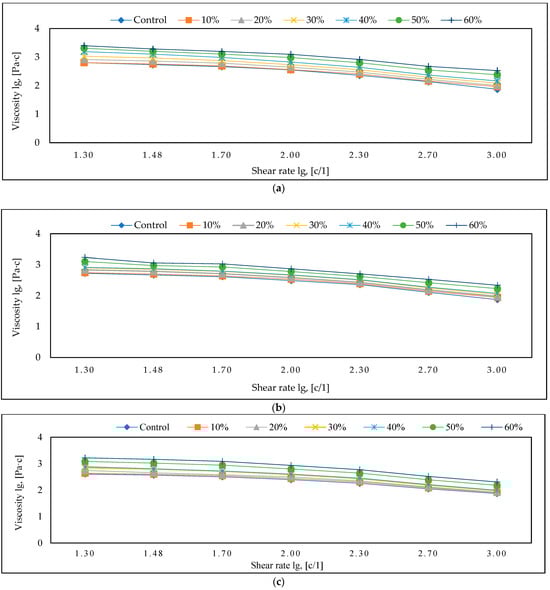
Figure 20.
Dependence of viscosity on the shear rate of PP/RH composites with different dosages at temperatures of 180 °C (a), 190 °C (b), 200 °C (c).
The obtained results confirm that an increase in the proportion of RH significantly alters the rheological behavior of the composites, which must be considered when developing processing technologies for these materials.
The Kelvin–Voigt model was used to describe the viscoelastic behavior of composites, accounting for both the elastic and viscous response of the material.
where σ is stress, ϵ is strain, E is the elastic modulus, η is viscosity.
To obtain information about the state of polymers under steady shear flow conditions, a temperature-invariant viscosity characteristic is used, allowing for the correct interpretation of the material’s rheological behavior at different temperatures and shear stresses. This method is based on constructing the log(ηr) − log(γr) dependency, where ηr is the reduced viscosity, which is calculated as the ratio of the measured viscosity to the minimum Newtonian viscosity, according to the formula ηr = η/η0, and γr is the reduced shear rate, defined as the product of the true shear rate and the minimum Newtonian viscosity: γr = η0γ.
The use of this characteristic enables a generalized analysis of viscosity independent of specific temperature conditions, simplifying the comparison of different composites. This is particularly important for modeling material processability and evaluating their behavior during injection molding or extrusion.
Table 5 presents the values of the minimum Newtonian viscosity, which plays a key role in data normalization and defines the lower viscosity limit of the system under given experimental conditions. This parameter is a crucial characteristic that reflects the material’s flowability and its processability depending on the filler content and processing temperature.
Table 5.
Minimum Newtonian viscosity (Pa·s) at a shear rate of 1.30 s−1 for PP/RH composites at different temperatures.
To construct a generalized viscosity curve, the time–temperature superposition method was used. This method allows combining data at different temperatures into a single master curve through horizontal shifting (shift factor, aₜ). This approach is based on the principle of thermorheological simplicity, where a change in temperature is equivalent to a change in the observation time scale. The shift factors were calculated using the Williams–Landel–Ferry model.
where Tref is the reference temperature, C1 and C2 are empirical constants.
Figure 21 shows the dependence of the reduced viscosity (ηr = η/η0) on the reduced shear rate (γr = η0·γ). Normalizing the viscosity eliminates the influence of temperature and allows for comparison of the behavior of different composites in unified coordinates. The overlap of the curves with a deviation of ±8% confirms that all systems follow the same flow mechanism, and the increase in viscosity with higher filler content is associated with enhanced interparticle interactions and the formation of a network structure.
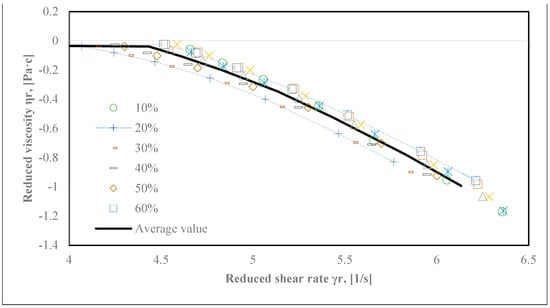
Figure 21.
Graph of the dependence of the reduced viscosity on the reduced shear rate for samples with filler dosages.
As the filler dosage increases, the viscosity of the composites rises significantly. This phenomenon is attributed to the fact that a higher rice husk content enhances the internal resistance mechanisms to material flow, including interactions between filler particles and the polymer matrix. At high filler concentrations, intensified particle agglomeration occurs, leading to additional resistance to melt flow. These results underscore the need to optimize filler content to balance rheological properties and processability in practical applications.
Due to its porous structure and the presence of hydrophilic groups in the cellulose, rice husk actively absorbs water. Literature data have shown that rice husk can absorb up to 159.6% of its dry weight in 1 h of soaking []. In contrast, polypropylene, which is a hydrophobic polymer, practically does not interact with water. According to researchers, water absorption is up to 0.03% [] even after a long period of time. When studying the effect of rice husk (RH) dosage on water absorption (Figure 22), the results show minimal changes in water uptake during the first few days. However, as the testing period extends, water absorption increases, becoming particularly noticeable after 21 days. Composites with higher filler dosages (e.g., 50% and 60%) exhibit significantly greater water absorption compared to the control sample and composites with lower filler concentrations. It is worth noting that the control sample, composed entirely of polypropylene, demonstrated the lowest water absorption at all testing stages.
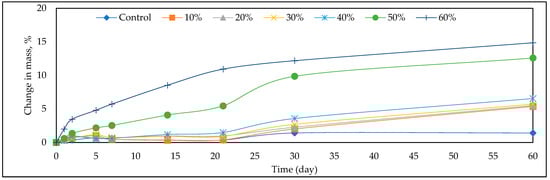
Figure 22.
Influence of water absorption of composites.
The increase in water absorption of filled composites is explained by the hydrophilic nature of rice husk, which facilitates interaction with water molecules [], the pores in the rice husk fibers retain a significant amount of moisture, preventing their evaporation [], and the microchannels formed by rice husk particles in the polypropylene matrix facilitate water penetration [].
4. Conclusions
The results obtained in this study demonstrate that the dosage of rice husk significantly affects the integrated performance of polypropylene-based composites. A filler content of 40–50 wt.% offers an optimal compromise between mechanical strength, thermal stability and processability. The application of temperature-invariant viscosity characterization proved effective for predicting composite behavior under extrusion and injection molding conditions. While higher filler loadings increase stiffness and hardness, they also lead to a decrease in impact resistance and ductility. These findings highlight the potential of using agricultural waste as sustainable fillers in composite formulations. Future work should focus on interfacial modification techniques and long-term performance evaluation under real-life service conditions.
Table 6 presents the standardized profile property indicators. Based on the provided data, it can be concluded that polypropylene-based composite materials with a 50% rice husk content comply with the requirements of all the examined standards.
Table 6.
Profile property indicators.
Supplementary Materials
The following supporting information can be downloaded at: https://www.mdpi.com/article/10.3390/jcs9080443/s1, Files S1: Microscopy (raster images); Files S2: Microscopy (optical images); File S3: Tensile strength; File S4: DSC; File S5: Tensile modulus of elasticity.
Author Contributions
Conceptualization, I.F. and S.V.; methodology, I.F., S.V. and A.G.; validation, I.F., A.N. and N.A.; formal analysis, I.F., A.G., S.V., A.N. and N.A.; investigation, I.F. and S.V.; resources, I.F., S.V., A.N. and N.A.; data curation, A.G., S.V., G.Z., S.U., A.N. and N.A.; writing—original draft preparation, A.G., I.F. and A.N.; writing—review and editing, A.G., S.V., I.F., A.N. and N.A.; visualization, A.G., S.V., G.Z., S.U., A.N. and N.A.; supervision, S.V.; funding acquisition, G.Z. and S.U. All authors have read and agreed to the published version of the manuscript.
Funding
The work was supported by the Department of Chemistry and Technology of Elastomer Processing, Kazan National Research Technological University (Grant No. 01-06-24) granted by the Non-Profit Joint Stock Company “Korkyt Ata Kyzylorda University”.
Institutional Review Board Statement
Not applicable.
Data Availability Statement
Data are contained within the article.
Conflicts of Interest
The authors declare no conflicts of interest.
References
- Huo, J.; Peng, C. Depletion of Natural Resources and Environmental Quality: Prospects of Energy Use, Energy Imports, and Economic Growth Hindrances. Resour. Policy 2023, 86, 104049. [Google Scholar] [CrossRef]
- Koul, B.; Yakoob, M.; Shah, M.P. Agricultural Waste Management Strategies for Environmental Sustainability. Environ. Res. 2022, 206, 112285. [Google Scholar] [CrossRef] [PubMed]
- Väisänen, T.; Das, O.; Tomppo, L. A Review on New Bio-Based Constituents for Natural Fiber-Polymer Composites. J. Clean. Prod. 2017, 149, 582–596. [Google Scholar] [CrossRef]
- Pickering, K.L.; Efendy, M.G.A.; Le, T.M. A Review of Recent Developments in Natural Fibre Composites and Their Mechanical Performance. Compos. Part A Appl. Sci. Manuf. 2016, 83, 98–112. [Google Scholar] [CrossRef]
- Russo, P.; Pagliarulo, V.; Bianco, V.; Simeoli, G.; Cimino, F.; Ferraro, P. Characterization of ‘Green’ Composite Laminates after Flexural Tests by Speckle Interferometry. Opt. Eng. 2020, 59, 102416. [Google Scholar] [CrossRef]
- Suppakarn, N.; Jarukumjorn, K. Mechanical Properties and Flammability of Sisal/PP Composites: Effect of Flame Retardant Type and Content. Compos. Part B Eng. 2009, 40, 613–618. [Google Scholar] [CrossRef]
- Leão, R.M.; Luz, S.M.; Araujo, J.A.; Novack, K. Surface Treatment of Coconut Fiber and Its Application in Composite Materials for Reinforcement of Polypropylene. J. Nat. Fibers 2015, 12, 574–586. [Google Scholar] [CrossRef]
- Ichazo, M.N.; Albano, C.; González, J.; Perera, R.; Candal, M. Polypropylene/Wood Flour Composites: Treatments and Properties. Compos. Struct. 2001, 54, 207–214. [Google Scholar] [CrossRef]
- Arefieva, O.D.; Sedinkina, E.S.; Zemnukhova, L.A.; Smitskih, K.V. Ecological and Economic Assessment of the Integrated Rice Husk Processing Scheme. Vestn. Far East Branch Russ. Acad. Sci. 2020, 6, 91–98. [Google Scholar]
- Sadritdinov, A.R.; Zakharova, E.M.; Psyanchin, A.A.; Khusnullin, A.G.; Zakharov, V.P. Influence of the Processing Method on the Heat Resistance of the Secondary Block Copolymer of Propylene and Ethylene Filled with Rice Hulls. Perspekt. Mater. 2021, 11, 32–38. [Google Scholar] [CrossRef]
- Shukla, S.S.; Chava, R.; Appari, S.; A, B.; Kuncharam, B.V.R. Sustainable Use of Rice Husk for the Cleaner Production of Value-Added Products. J. Environ. Chem. Eng. 2022, 10, 106899. [Google Scholar] [CrossRef]
- Halip, J.A.; Lee, S.H.; Tahir, P.M.; Chuan, L.T.; Selimin, M.A.; Saffian, H.A. A Review: Chemical Treatments of Rice Husk for Polymer Composites. Biointerface Res. Appl. Chem. 2021, 11, 12425–12433. [Google Scholar] [CrossRef]
- Mansaray, K.G.; Ghaly, A.E. Physical and Thermochemical Properties of Rice Husk. Energy Sources 1997, 19, 989–1004. [Google Scholar] [CrossRef]
- Wu, J.; Elliston, A.; Le Gall, G.; Colquhoun, I.J.; Collins, S.R.A.; Wood, I.P.; Dicks, J.; Roberts, I.N.; Waldron, K.W. Optimising Conditions for Bioethanol Production from Rice Husk and Rice Straw: Effects of Pre-Treatment on Liquor Composition and Fermentation Inhibitors. Biotechnol. Biofuels 2018, 11, 62. [Google Scholar] [CrossRef] [PubMed]
- Bisht, N.; Gope, P.C. Wear Characteristics of Silica-Reinforced Rice Husk-Epoxy Hybrid Bio-Composite. In Advances in Materials Engineering and Manufacturing Processes; Springer: Berlin/Heidelberg, Germany, 2020; pp. 51–57. [Google Scholar]
- Anamika; Ahmad, S.A.R.; Jatawa, S.; Selvi, V.A.; Tiwari, A. Value-Added Products of Rice Husk in Various Disciplines. Int. J. Res. Appl. Sci. Eng. Technol. 2022, 10, 594–608. [Google Scholar] [CrossRef]
- Cherezova, E.; Karaseva, Y.; Nakyp, A.; Nuriev, A.; Islambekuly, B.; Akylbekov, N. Influence of Partially Carboxylated Powdered Lignocellulose from Oat Straw on Technological and Strength Properties of Water-Swelling Rubber. Polymers 2024, 16, 282. [Google Scholar] [CrossRef]
- Olonisakin, K.; Fan, M.; Xin-Xiang, Z.; Ran, L.; Lin, W.; Zhang, W.; Wenbin, Y. Key Improvements in Interfacial Adhesion and Dispersion of Fibers/Fillers in Polymer Matrix Composites; Focus on PLA Matrix Composites. Compos. Interfaces 2022, 29, 1071–1120. [Google Scholar] [CrossRef]
- Korčušková, M.; Petruš, J.; Lepcio, P.; Kučera, F.; Jančář, J. Novel Approaches for Functionalization of Polypropylene by Maleimides. Polymer 2022, 238, 124398. [Google Scholar] [CrossRef]
- Hao, W.; Wang, M.; Zhou, F.; Luo, H.; Xie, X.; Luo, F.; Cha, R. A Review on Nanocellulose as a Lightweight Filler of Polyolefin Composites. Carbohydr. Polym. 2020, 243, 116466. [Google Scholar] [CrossRef]
- Volfson, S.I.; Fayzullin, I.Z.; Musin, I.N.; Fayzullin, A.Z.; Grachev, A.N.; Pushkin, S.A. The Physicomechanical and Rheological Characteristics of Wood–Polymer Composites Based on Thermally and Mechanically Modified Filler. Int. Polym. Sci. Technol. 2017, 44, 49–54. [Google Scholar] [CrossRef]
- Fayzullin, I.Z.; Musin, I.N.; Volfson, S.I.; Nikiforov, A.A. Glass-Filled Wood-Polymer Composites Based on Polypropylene. Key Eng. Mater. 2019, 816, 197–201. [Google Scholar] [CrossRef]
- Shkuro, A.; Chernysheva, A.; Krivonogov, P.; Artemov, A. Studying the Modificability of Wood-Polymer Composites by UV Radiation. Bull. Univ. Technol. 2019, 22, 84–87. [Google Scholar]
- Shpejzman, V.V.; Yakushev, P.N.; Smolyanskij, A.S. Method for Radiation-Chemical Modification of Wood-Polymer Composites. RU2707936C1, 2 December 2019. [Google Scholar]
- Cherezova, E.N.; Karaseva, Y.S.; Nakyp, A.M. Evaluation of the Durability of Limited Swelling Rubber Filled with Modified Powdered Cellulose from Cotton Waste. Polym. Sci. Ser. D 2023, 16, 681–686. [Google Scholar] [CrossRef]
- Gorbachev, A.V.; Fayzullin, I.Z.; Wolfson, S.I.; Kanarsky, A.V.; Zakharov, I.V.; Kazakov, Y.M. Composite Material Based on Polyolefins and Modified Vegetable Fillers. Plast. Massy 2023, 1, 48–52. [Google Scholar] [CrossRef]
- Fayzullin, I.; Gorbachev, A.; Volfson, S.; Serikbayev, Y.; Nakyp, A.; Akylbekov, N. Composite Material Based on Polypropylene and Modified Natural Fillers. Polymers 2024, 16, 1703. [Google Scholar] [CrossRef] [PubMed]
- Golubchikova, K.; Fayzullin, I.; Volfson, S. Light-Diffusing Composite Material Based on Polystyrene and Hollow Glass Microspheres. J. Thermoplast. Compos. Mater. 2021, 34, 1692–1700. [Google Scholar] [CrossRef]
- Faruk, O.; Bledzki, A.K.; Fink, H.-P.; Sain, M. Biocomposites Reinforced with Natural Fibers: 2000–2010. Prog. Polym. Sci. 2012, 37, 1552–1596. [Google Scholar] [CrossRef]
- Morales, M.; Atencio Martinez, C.; Maranon, A.; Hernandez, C.; Michaud, V.; Porras, A. Development and Characterization of Rice Husk and Recycled Polypropylene Composite Filaments for 3D Printing. Polymers 2021, 13, 1067. [Google Scholar] [CrossRef]
- Roy, S.B.; Shit, S.C.; Sengupta, R.A.; Shukla, P.R. A Review on Bio-Composites: Fabrication, Properties and Applications. Int. J. Innov. Res. Sci. Eng. Technol. 2014, 03, 16814–16824. [Google Scholar] [CrossRef]
- Suhot, M.A.; Hassan, M.Z.; Aziz, S.A.; Md Daud, M.Y. Recent Progress of Rice Husk Reinforced Polymer Composites: A Review. Polymers 2021, 13, 2391. [Google Scholar] [CrossRef]
- Arjmandi, R.; Hassan, A.; Majeed, K.; Zakaria, Z. Rice Husk Filled Polymer Composites. Int. J. Polym. Sci. 2015, 2015, 501471. [Google Scholar] [CrossRef]
- Laftah, W.A.; Wan Abdul Rahman, W.A. Rice Waste–Based Polymer Composites for Packaging Applications: A Review. Polym. Polym. Compos. 2021, 29, S1621–S1629. [Google Scholar] [CrossRef]
- Raghu, N.; Kale, A.; Chauhan, S.; Aggarwal, P.K. Rice Husk Reinforced Polypropylene Composites: Mechanical, Morphological and Thermal Properties. J. Indian Acad. Wood Sci. 2018, 15, 96–104. [Google Scholar] [CrossRef]
- Aridi, N.A.M.; Sapuan, S.M.; Zainudin, E.S.; AL-Oqla, F.M. Mechanical and Morphological Properties of Injection-Molded Rice Husk Polypropylene Composites. Int. J. Polym. Anal. Charact. 2016, 21, 305–313. [Google Scholar] [CrossRef]
- Razavi, N.M.; Jafarzadeh, D.F.; Ouroumiehei, A.A.; Ershad, L.A. Mechanical Properties and Water Absorption Behaviour of Chopped Rice Husk Filled Polypropylene Composites. Iran. Polym. J. 2006, 15, 757–766. [Google Scholar]
- Hidalgo-Salazar, M.A.; Salinas, E. Mechanical, Thermal, Viscoelastic Performance and Product Application of PP- Rice Husk Colombian Biocomposites. Compos. Part B Eng. 2019, 176, 107135. [Google Scholar] [CrossRef]
- Yang, H.-S.; Kim, H.-J.; Son, J.; Park, H.-J.; Lee, B.-J.; Hwang, T.-S. Rice-Husk Flour Filled Polypropylene Composites; Mechanical and Morphological Study. Compos. Struct. 2004, 63, 305–312. [Google Scholar] [CrossRef]
- Khalil, R.; Chryss, A.G.; Jollands, M.; Bhattacharya, S. Effect of Coupling Agents on the Crystallinity and Viscoelastic Properties of Composites of Rice Hull Ash-Filled Polypropylene. J. Mater. Sci. 2007, 42, 10219–10227. [Google Scholar] [CrossRef]
- Ndiaye, D.; Verney, V.; Askanian, H.; Commereuc, S.; Tidjani, A. Morphology, Thermal Behavior and Dynamic Rheological Properties of Wood Polypropylene Composites. Mater. Sci. Appl. 2013, 04, 730–738. [Google Scholar] [CrossRef][Green Version]
- Santoso, T.B.; Aryanti, F.I.; Sitanggang, T.D.A. Characterization of Mechanical, Thermal, and Physical Properties of Polypropylene Composites with Rice Husk Filler Using Coupling Agent Maleic Anhydride. J. Teknol. Kim. Unimal 2023, 12, 216–230. [Google Scholar] [CrossRef]
- Rashiddy Wong, F.; Al-Biruni Mohd Adnan, U.I. Mechanical Properties of Rice Husk-Recycled Polypropylene Composite. J. Mech. Eng. 2023, 12, 45–61. [Google Scholar] [CrossRef]
- Choi, J.Y.; Jeon, J.H.; Lyu, J.H.; Park, J.; Kim, G.Y.; Chey, S.Y.; Quan, Y.-J.; Bhandari, B.; Prusty, B.G.; Ahn, S.-H. Current Applications and Development of Composite Manufacturing Processes for Future Mobility. Int. J. Precis. Eng. Manuf. Technol. 2023, 10, 269–291. [Google Scholar] [CrossRef]
- Meegan, J. Some of the Challenges Faced by the Composites Industry in Its Bid to Become More Sustainable. RSC Sustain. 2023, 1, 1737–1742. [Google Scholar] [CrossRef]
- Lokesh, K.S.; Ramachandra, C.G.; Mayya, D.S. Challenges Faced in Processing of Composites. In Structural Composite Materials; Springer: Berlin/Heidelberg, Germany, 2024; pp. 277–290. [Google Scholar]
- GOST 11645-2021; Plastics. Methods for Determination of the Melt Flow Rate of Thermoplastics. Interstate Council for Standardization, Metrology and Certification (ISC): Minsk, Belarus, 2021.
- GOST 11262-2017 (ISO 527-2:2012, MOD); Plastics. Tensile Testing Method for Molding and Extrusion Plastics. (Modified Adoption of ISO 527-2:2012). Interstate Council for Standardization, Metrology and Certification (ISC): Minsk, Belarus, 2012.
- GOST 9550-81; Plastics. Methods for Determination of Elastic Modulus in Tension, Compression and Bending. Interstate Council for Standardization, Metrology and Certification (ISC): Minsk, Belarus, 1981.
- GOST 19109-2017 (ISO 180:2000, MOD); Plastics. Determination of Izod Impact Strength. (Modified Adoption of ISO 180:2000). Interstate Council for Standardization, Metrology and Certification (ISC): Minsk, Belarus, 2017.
- GOST 15088-2014 (ISO 306:2004, MOD); Plastics. Method for Determination of Vicat Softening Temperature for Thermoplastics. (Modified Adoption of ISO 306:2004). Interstate Council for Standardization, Metrology and Certification (ISC): Minsk, Belarus, 2014.
- GOST 12021-2017 (ISO 75-2:2013); Plastics and Ebonite. Method for Determination of Deflection Temperature Under Load. Interstate Council for Standardization, Metrology and Certification (ISC): Minsk, Belarus, 2017.
- Volfson, S.I.; Musin, I.N. Theoretical Foundations of Polymer Processing; Kazan State Technological University: Kazan, Russian, 2005. [Google Scholar]
- Bolland, J.L.; Gee, G. Kinetic Studies in the Chemistry of Rubber and Related Materials. III. Thermochemistry and Mechanisms of Olefin Oxidation. Trans. Faraday Soc. 1946, 42, 244. [Google Scholar] [CrossRef]
- Gijsman, P.; Fiorio, R. Long Term Thermo-Oxidative Degradation and Stabilization of Polypropylene (PP) and the Implications for Its Recyclability. Polym. Degrad. Stab. 2023, 208, 110260. [Google Scholar] [CrossRef]
- Nasir, A.; Yasin, T.; Islam, A. Thermo-oxidative Degradation Behavior of Recycled Polypropylene. J. Appl. Polym. Sci. 2011, 119, 3315–3320. [Google Scholar] [CrossRef]
- Godovsky, Y.K. Thermophysical Methods for Studying Polymers; Springer: Berlin/Heidelberg, Germany, 1992. [Google Scholar]
- Piorkowska, E. Crystallization in Polymer Composites and Nanocomposites. In Handbook of Polymer Crystallization; Wiley: Hoboken, NJ, USA, 2013; pp. 379–398. [Google Scholar]
- Ignatov, I.; Mosin, O. Composition and Structural Properties of Fullerene Analogous Mineral Shungite. Mathematical Model of Interaction of Shungite with Water Molecules. Available online: https://cyberleninka.ru/article/n/sostav-i-strukturnye-svoystva-prirodnogo-fullerensoderzhaschego-minerala-shungita-matematicheskaya-model-vzaimodeystviya-shungita-s (accessed on 30 April 2014).
- Rosa, S.M.L.; Santos, E.F.; Ferreira, C.A.; Nachtigall, S.M.B. Studies on the Properties of Rice-Husk-Filled-PP Composites: Effect of Maleated PP. Mater. Res. 2009, 12, 333–338. [Google Scholar] [CrossRef]
- Shirvanimoghaddam, K.; Balaji, K.V.; Yadav, R.; Zabihi, O.; Ahmadi, M.; Adetunji, P.; Naebe, M. Balancing the Toughness and Strength in Polypropylene Composites. Compos. Part B Eng. 2021, 223, 109121. [Google Scholar] [CrossRef]
- Chen, X.; Li, Z.; Qiu, B.; Shi, J. Prediction and Evolution of Core-Shell Morphology and Their Effect on Mechanical Properties of PP Blends. J. Reinf. Plast. Compos. 2023, 44, 7–8. [Google Scholar] [CrossRef]
- Nandiyanto, A.B.D.; Hofifah, S.N.; Girsang, G.C.S.; Putri, S.R.; Budiman, B.A.; Triawan, F.; Al-Obaidi, A.S.M. The Effects of Rice Husk Particles Size as A Reinforcement Component on Resin-Based Brake Pad Performance: From Literature Review on the Use of Agricultural Waste as A Reinforcement Material, Chemical Polymerization Reaction of Epoxy Resin, to Experiments. Automot. Exp. 2021, 4, 68–82. [Google Scholar] [CrossRef]
- Fayzullin, I.Z.; Musin, I.N.; Wolfson, S.I. Effect of Filler Particle Size on the Properties of Wood-Polymer Composites. Bull. Kazan Technol. Univ. 2013, 16, 106–109. [Google Scholar]
- Ahn, G.C.; Jang, S.S.; Kwak, H.J.; Lee, S.R.; Oh, Y.K.; Park, K.K. Characteristics of Rice Hulls, Sawdust, Wood Shavings and Mixture of Sawdust and Wood Shavings, and Their Usefulness According to the Pen Location for Hanwoo Cattle. Asian-Australas. J. Anim. Sci. 2016, 29, 599–605. [Google Scholar] [CrossRef] [PubMed]
- Deng, H.; Reynolds, C.T.; Cabrera, N.O.; Barkoula, N.-M.; Alcock, B.; Peijs, T. The Water Absorption Behaviour of All-Polypropylene Composites and Its Effect on Mechanical Properties. Compos. Part B Eng. 2010, 41, 268–275. [Google Scholar] [CrossRef]
- Wang, L.; Guo, Y.; Chen, Y.; Chen, T.; Zhu, S.; Zhang, T.; Liu, S. Enhanced Mechanical and Water Absorption Properties of Rice Husk-Derived Nano-SiO2 Reinforced PHBV Composites. Polymers 2018, 10, 1022. [Google Scholar] [CrossRef]
- GOST R 59555-2021; National Standard of Russian Federation. Profile Products from Wood-Polymer Composite. Technical Specifications. Interstate Council for Standardization, Metrology and Certification (ISC): Minsk, Belarus, 2021.
- GB/T 24508-2020; Wood-Plastic Composite Flooring. Standard Category: B70 (Artificial Board). Standardization Administration of China (SAC): Beijing, China, 2020.
Disclaimer/Publisher’s Note: The statements, opinions and data contained in all publications are solely those of the individual author(s) and contributor(s) and not of MDPI and/or the editor(s). MDPI and/or the editor(s) disclaim responsibility for any injury to people or property resulting from any ideas, methods, instructions or products referred to in the content. |
© 2025 by the authors. Licensee MDPI, Basel, Switzerland. This article is an open access article distributed under the terms and conditions of the Creative Commons Attribution (CC BY) license (https://creativecommons.org/licenses/by/4.0/).