Abstract
Fused filament fabrication of thermoplastic composites, despite its recyclability, increased strength, and efficiency, faces structural limitations under elevated temperatures. The literature on heat treatments for improving the thermal resilience of accessible 3D printed composites is limited. Therefore, this study comprehensively presents the efficacy of annealing on carbon fiber reinforced polyamide (PAHT-CF). The methodology includes uniaxial tensile testing of 200 samples across a wide temperature range (25–150 °C) and five different infill orientations, annealed as per the Technical Data Sheet (80 °C, 12 h). Scanning electron microscopy (SEM) of the fracture surfaces revealed the microstructural changes responsible for the improved properties after annealing. At 25 °C, annealing led to a 50% strength increase (63.88 MPa) and a 70% lower strain (2.65%). At 150 °C, the material maintained a 17.5% strength advantage (23.62 MPa) and a 17.5% reduction in strain (12.67%). The 0°, 90°, and 0/90° orientations exhibited the highest improvements, while the remainder displayed lower strengths and higher deformation beyond the glass transition temperature (70 °C). Overall, annealed PAHT-CF demonstrates high-temperature resilience, comparable to previously analyzed materials like carbon fiber reinforced polyether–ether–ketone (PEEK-CF). This makes it a potentially accessible alternative for the aerospace and automotive sectors. However, practical applications must consider the trade-off between its enhanced mechanical properties and the increased lead time from annealing.
1. Introduction
Polymer composites, widely used in the automotive and aerospace industries [1], combine multiple materials to achieve properties superior to those of the individual components [2,3]. These materials consist of a thermoplastic/thermoset matrix that ensures composites’ flexibility [4] engulfing reinforcement to provide directional rigidity [5,6,7]. Their advantages include superior toughness, strength-to-weight ratio, flame retardancy, non-corrosion resistance, and durability [8]. However, manufacturing processes such as hand layup or resin transfer molding involve intricate tooling and hazardous conditions for the thermoset composites [9]. Additive manufacturing techniques like selective laser sintering (SLS), vat photopolymerization (VP), or fused filament fabrication (FFF) address these challenges. These methods eliminate costly tooling, while allowing shape complexity, making 3D printing a dimensionally stable manufacturing process while offering a plethora of reinforced polymers [10,11].
Conventional composites manufacturing methods have limitations. Consequently, fused filament fabrication (FFF) of thermoplastic composites is a promising alternative. Its advantages include recyclability and the ability to use commercial equipment [12]. Despite its advantages, FFF thermoplastic composites require precise thermal control [13,14]. Additionally, their structural performance can be compromised by porosity or poor inter-laminar adhesion [14]. Therefore, failure occurs via two major mechanisms: intra-laminar tractive failure, which initiates cracks, followed by inter-laminar tear propagation [15,16,17]. Thus, their application is restricted to temperatures below the glass transition temperature (Tg), where the polymer chain motion ceases [14,18]. Composites are increasingly used in high-temperature applications within competitive and sustainability-focused fields like aerospace (thermal shields for aircraft engines) [19] and automotive (bearing housings) [20]. Therefore, it is crucial to address the thermal resilience of thermoplastic composites.
Post-manufacturing heat treatments address the structural limitations of FFF-produced thermoplastic composites while also expanding their range of application temperatures [13,21]. Heat treatments, typically performed above the glass transition temperature (Tg) offer several benefits. First, they improve matrix crystallinity and reduce residual stress by rearranging polymer chains [22,23]. Second, they reduce voids at the reinforcement–matrix interface and enhance interlaminar bonding through better infiltration and diffusion [24]. A resulting consequence of these changes is a more brittle fracture behavior [20]. Moreover, annealed composites delivered consistently superior Tg [22]. Although these processes extend production time, their effects proved to be significantly improved tensile properties of the composites. Limited to room temperature testing (RT), Kumar et al. [25] studied additively manufactured nylon–short carbon fiber (SCF) in a single raster configuration (90/45/0/−45°) concluding a moderate 20% increase in the ultimate tensile strength (σ UTS) post-annealing (120 °C, 4 h). Alternatively, Nassar et al. [24] studied polylactic acid (PLA) − SCF and acrylonitrile butadiene styrene (ABS) − SCF, in 0° raster angle with annealing applied at three temperatures (50, 120, 150 °C) for 10 min. The study claimed that the heat treatment enhanced σ UTS by almost 50% and the elastic modulus (E) by up to 12.5% at RT. When tested by Li et al. [26] at RT, with the polyethylene–ether–ketone (PEEK)–SCF printed at a ±45° raster angle and annealed at 260 °C for 1 h, the σUTS and E of the annealed displayed increased values of 20% and 10%, respectively. Tested at temperatures under Tg (80 °C), a 37.5% strength improvement was observed, while retaining 45% of its strength at RT over Tg (220 °C). These results are explained by rougher fracture surfaces due to extended deformation potential [27]. However, these studies were limited either in temperature range, material type, or infill orientations.
Comprehensive research on the high-temperature tensile behavior of accessible and recyclable 3D printed composites is lacking, despite existing studies on annealing effects at room temperature (RT). This study aims to address this gap by examining the effects of annealing on carbon-fiber reinforced polyamide (PAHT-CF). The analysis was conducted across a broad spectrum of temperatures and infill patterns, extending previous research [28]. This study provides a comprehensive analysis of tensile properties using the supplier’s recommended conditions (80 °C for 12 h). However, it does not examine other critical mechanical properties (like fatigue or impact resistance) or different annealing settings. This research could potentially expand the use of these more affordable and recyclable composites in high-temperature applications in aerospace, automotive, and other industries, offering a more sustainable alternative to current materials.
Section 2 details the material properties, specimen preparation, and high-temperature tensile testing methodology. Section 3 examines the impact of infill configuration and annealing on tensile performance and the combined effects of thermal conditions and annealing on each bead orientation. The results (σUTS, ε, and E) are correlated with failure mechanism analysis using scanning electron microscopy (SEM). Section 4 compares the principal findings with the existing literature, suggesting further study directions.
2. Materials and Methods
2.1. Material Properties
As this study focuses on high-temperature resilient accessible 3D printing composites, commercial materials are of interest. Table 1 summarizes the polymers analyzed in Section 1 based on their manufacturer technical data sheets (TDS). PAHT − CF, sourced from Bambulab (Shenzhen, China), was chosen as the most effective material. Although more costly than PLA-CF and ABS-CF, its far superior heat deflection temperature (HDT) and tensile characteristics, position PAHT-CF as an affordable alternative to PEEK-CF in high-temperature applications. The specimens (100% relative infill, ±45° infill orientation) were tested as per ISO 527 [29]. PAHT-CF consists of a polyamide 12 matrix with 15% mass reinforcement of SCF (0.1 mm diameter, 1 mm length), delivered as a 1.75 mm filament. As shown in [28], it demonstrates a visibly enhanced interface, with reinforcement oriented along the extrusion direction. For limiting void formation during process due to steam formation [30], material drying (80 °C, 12 h) prior to manufacturing and storing in dehumidified environment are required. PAHT-CF has several key advantages: its tensile properties show reduced degradation from moisture (12–18%), it has low water absorption (0.88%), and it resists oils and organic solvents. These features make it an affordable and reliable alternative for use in high-temperature, humid environments like those in aerospace or automotive cooling systems [31].

Table 1.
Supplier material characteristics. Adapted from [31,32,33,34], under CC-BY agreement.
2.2. Tensile Specimen Design and Manufacturing
The tensile specimens were designed according to ISO 23529 Type 1 [35] (Figure 1a) with respect to the standard for the available tensile apparatus, manufactured in a flat orientation using an FFF-enclosed equipment, the high-speed mono-extruder Bambulab X1 Carbon [36] with building dimensions of 256 × 256 × 256 mm, and a dehumidified automated material system (AMS). The infill orientations used in this analysis, identified in the literature and our prior study [28], are graphically represented in Figure 1b. The manufacturing parameters (Table 2) were the same for all samples and consistent with those used to generate the supplier data in Table 1. This study validated the supplier-recommended annealing protocol (80 °C continuously for 12 h), carried out for all specimens. This protocol serves as a baseline for the thermal treatment of PAHT-CF. Future investigations should systematically explore the effects of varying annealing conditions on the tensile behavior of PAHT-CF. All the specimens were cooled to RT by natural convection in a vacuum-sealed dehumidified container as a practical method for regular manufacturing. The material was dried according to the supplier’s conditions. However, post-analysis revealed a rough surface (Figure 1c). This roughness might be caused by humidity, which could lead to porosity from steam formation during the printing process [37]. A quantitative analysis of porosity was not performed due to equipment constraints and to maintain the study’s primary focus on the thermal-tensile behavior across different infill patterns. However, the qualitative observations from SEM are used to correlate microstructural differences with mechanical performance.

Figure 1.
Specimen design and manufacturing: dimensions (a); infill angles (b); surface aspect (c).

Table 2.
Manufacturing parameters for the tensile specimens. Adapted from [28,31]. Under CC-BY.
2.3. High-Temperature Tensile Testing Methodology
Testing temperatures spanned from 25 to 150 °C to provide an extensive thermal tensile characterization of annealed accessible composites, addressing a known gap in the literature. Consequently, the first series of tests were performed below the glass transition temperature (Tg), which is the typical functioning range for thermoplastic composites due to the stable viscosity; 25 °C for RT, generally provided in all composites’ specifications; at 50 °C, the Tg of additively manufactured neat polyamide [38] to evaluate the reinforcement influence. The second category involved tensile analysis above Tg, with 100 °C selected as the midpoint between Tg and the crystallization temperature (Tc). The third series assessed the specimens above Tc, at 150 °C. Based on the proximity of HDT, it can be deduced that properties above 150 °C result in abrupt reduction in strength, which represents no further interest for mechanical applications.
The high-temperature uniaxial tensile testing methodology (standard for the available experimental apparatus) adhered to ISO 37 [39] and was consistent with the conditions outlined in ISO 527 [29] used in the TDS. These tests were performed using an Instron 5967 Dual-Column Universal Machine (Norwood, MA, USA) [40], presented in Figure 2a, which was fitted with a 2580–10 KN/131510 force sensor and a 2663-901 extensometer from the same manufacturer, operating at a standard displacement (10 mm/s). The specimens were tested post-annealing (completely cooled to RT). Prior to testing, they were placed at the corresponding testing temperature for 30 min within the thermally controlled chamber of the testing machine (Instron 3119-610). A total of 200 samples were tested, comprising five specimens for each unique combination of infill orientation, temperature, and annealing condition. A two-way ANOVA of all samples was performed in Python 3.12 (statsmodels) for each tensile parameter to evaluate the effects of annealing, temperature, and their interaction. Degrees of freedom (df = k − 1) were determined from the number of factors (total df = 7), with residual error df = 32. Post hoc comparisons were conducted with Tukey’s HSD. The effect was quantified by ANOVA (p < 0.001) as eta-squared (η2) and Cohen’s d for pairwise contrasts (small ≈ 0.2, medium ≈ 0.5, large ≥ 0.8).
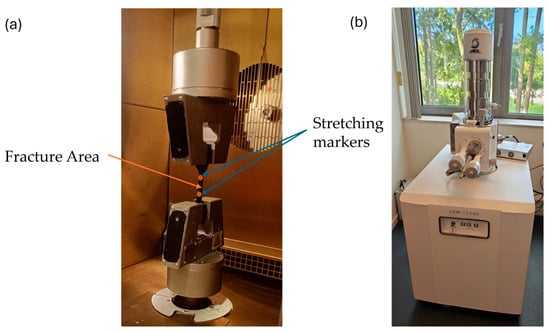
Figure 2.
High-temperature tensile testing setup (a); SEM apparatus (b).
3. Results and Discussions
3.1. Influence of Annealing for Constant Infill Orientation
The effect of annealing and testing temperature on the tensile behavior of PAHT-CF at each bead configuration was examined, using conditioned specimens as reference. Stress–strain curves were compared visually, and median values of σUTS, ε, and secant E with their standard deviations (Table A1, Table A2 and Table A3) and statistical analysis (Table A4, Table A5 and Table A6) were analyzed to motivate the observed gradients. Fracture surfaces were examined using a JEOL IT200LA SEM (Akishima, Tokyo, Japan) shown in Figure 3a at ×75 magnification, using a 200 µm scale. Due to material roughness and plasticity, particularly at elevated temperatures, fracture surfaces were irregular, and gold coating did not improve resolution. Micrographs were interpreted according to established fracture classifications from the literature: cross-laminar (multiple layers fracturing together on transversal section), intra-laminar (adjacent bead delamination), inter-laminar (adjacent layer sheer), with the sheer planes being represented in Figure 3b [16,17,28].
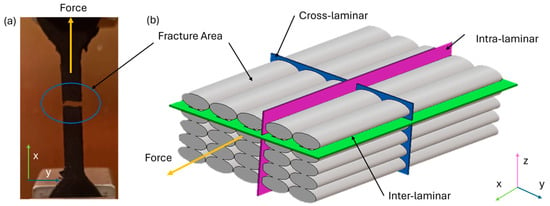
Figure 3.
Fracture area: macroscopically (a); microscopically (b).
3.1.1. Fiber-Dominant Orientations
The 0° (reference) and 0/90° patterns were analyzed together as they represent fiber-dominant orientations, where the load is transferred along the primary axis of the reinforcement. It was hypothesized that annealing would yield the most significant gains for these specimens by strengthening the matrix and improving stress transfer. The interaction between annealing and temperature was significant, as confirmed by statistical analysis (Table A4, Table A5 and Table A6). Specifically, this interaction displayed a 9.2% variance in strength (η2 = 0.092) and 2% in ε (η2 = 0.02) for the 0° pattern and 7.8% (η2 = 0.078) and 3.4% in ε (η2 = 0.034) for the 0/90° pattern. The stiffness was consequential. This is visually substantiated by the interaction plots (Figure 4b and Figure 5b) with persistent separation of the trend lines for strength across all temperatures, while the effect on strain dampened over Tg.
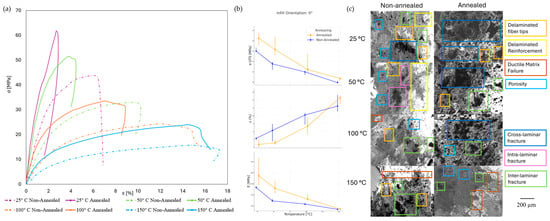
Figure 4.
Thermal influence on the tensile behavior of the 0° infill: stress–strain curves (a); annealing–temperature interaction plot including error bars for all results (b); fracture area (c).
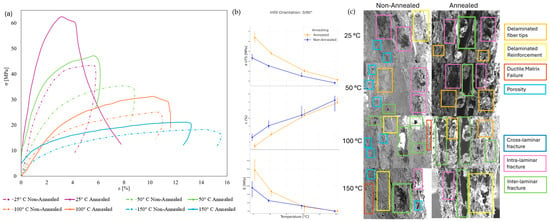
Figure 5.
Thermal influence on the tensile behavior of the 0/90° infill: stress–strain curves (a); annealing–temperature interaction plot including error bars for all results (b); fracture area (c).
Below Tg (25–50 °C), for both the 0° and 0/90° patterns, the annealed specimens displayed steeper stress–strain curves compared to their non-annealed counterparts (Figure 4a and Figure 5a), indicating a significant increase in stiffness and a more brittle behavior. At RT, both patterns displayed both significant increases in strength and stiffness and reductions in strain. The most remarkable effect was observed for the 0/90° infill, which exhibited a strength increase of approximately 50% (Table 3). At 50 °C, the effects of annealing on strength uniformized, while 0/90° remained less plastic. The underlying cause for these improvements is the heat treatment, which allows polymer chains to rearrange into a more ordered, crystalline structure. This increased crystallinity restricts chain mobility, leading to a stiffer, stronger matrix. This explains both the increased stiffness and the observed brittle behavior. The enhanced matrix integrity in annealed samples is visible on the fracture surfaces (Figure 4c and Figure 5c), which show a denser structure with reduced porosity compared to the non-annealed counterparts. This reduction in voids is a known benefit of annealing. Consequently, annealing brought failures characterized by reinforcement tips delamination and irregular matrix shear, indicating a stronger bond that requires more energy to break, rather than failure initiating from pre-existing voids. The superior performance of the 0/90° configuration is attributed to the 90° layers that act as crack propagation barriers and the void distribution, forcing the fracture to re-initiate [41].

Table 3.
Influence of annealing on the mechanical characteristics for 0° and 0/90° infill.
Beyond Tg (100–150 °C), the annealed specimens displayed visually comparable stress–strain profiles to the non-annealed specimens tested at the previous step (Figure 4a and Figure 5a). This indicates that annealing effectively raises the material’s operational temperature window by approximately 50 °C for a given strength requirement. The strength benefits of annealing on PAHT-CF for these infill orientations persisted, though they became more moderate (Figure 4b and Figure 5b). For the 0° infill at 100 °C, the results (Table 3) showed that the annealing effect showed lower increase in strength accompanied by significant stiffness advantage and strain reduction. In contrast, the 0/90° orientation showed a steady 20% strength increase after annealing. However, the changes in strain and stiffness were minor at this temperature, confirmed by uniform total reinforcement delamination and porosity observed in the SEM pictures (Figure 4c and Figure 5c). At 150 °C, well above the Tc, both fiber-dominant orientations (0° and 0/90°) exhibited a consistent 20% increase in strength after annealing. While annealing typically reduces strain, the 0° pattern exhibited a notable 17.5% increase in strain post-annealing at 150 °C (Table 3). This is in stark contrast to the 0/90° pattern, which showed a 15% decrease. This anomalous behavior in the 0° samples is attributed to a thermally activated mechanism of crystal slip and chain unfolding within the more ordered, annealed matrix. The hypothesis is supported by SEM analysis (Figure 4c), where a ductile matrix fracture with no visible reinforcement was observed. This phenomenon was also noted in previous studies [22]. The general strength and stiffness gains were supported by the fracture analysis. The non-annealed specimens, with a softer matrix, failed via inter-laminar tearing over Tg. In contrast, the annealed samples exhibited a more resilient cross-laminar (0° infill) or intra-laminar fracture within the 90° layers across all temperatures for the 0/90° infill, forcing the fracture to propagate through the beads, which requires more energy.
In conclusion, for fiber-dominant load paths like the 0° and 0/90° patterns, annealing is a highly effective method for boosting high-temperature tensile performance. By enhancing matrix crystallinity, reducing voids, and promoting more resilient failure modes, the heat treatment unlocks the material’s potential, making it a viable candidate for structural applications where both directional strength and thermal stability are critical.
3.1.2. Matrix-Dominant and Shear-Driven Orientations
In the 90° orientation, where the matrix-sheer mechanism predominated, annealed specimens showed more ductile stress–strain profiles than the 0° infill (Figure 6a). Statistical analysis and the interaction plots (Figure 6b) confirmed that while temperature was the dominant factor influencing tensile properties, the contribution from annealing was consistent across the thermal range. The results from Table 4 showed that annealing yielded moderate strength improvements of approximately 12.5% below Tg and more significant gains of 22.5–25% above it. This was accompanied by an opposite tendency of plasticity: there was a progressive reduction in ductility, with strain decreasing by 45% at RT down to 15% at 150 °C. SEM analysis (Figure 6c) supports these findings, revealing that annealing reduced porosity and prompted a failure mode of localized bead delamination rather than the purely intra-laminar tearing seen in non-annealed samples. Overall, the 90° infill demonstrated consistently lower strength values and a stronger trade-off between stiffness gains and ductility loss than 0° infill, highlighting its use for inferior structures, while annealing has consistent effects across all temperatures.
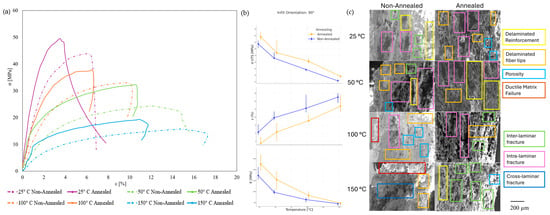
Figure 6.
Thermal influence on the tensile behavior of the 90° infill: stress–strain curves (a); annealing–temperature interaction plot including error bars for all results (b); fracture area (c).

Table 4.
Influence of annealing on the mechanical characteristics for 90°, 45°, and ±45° infill.
The 45° and its alternating variant, ±45°, represent shear-driven orientations where failure is governed by matrix-dominated shear and bead slipping. Consequently, both patterns exhibited high ductility and plasticity, with stress–strain profiles showing reduced gradients compared to fiber-dominant infills (Figure 7a and Figure 8a). Statistical analysis and the interaction plots (Figure 7b and Figure 8b) confirmed that temperature was the primary driver of variance in their tensile properties, while the net benefits from annealing were limited, especially at elevated temperatures. The 45° orientation showed the weakest overall benefit from annealing, comparable with 90° configuration below Tg, and inferior to the others beyond it, although keeping strain reductions uniform across all the thermal range. Critically, annealing had a detrimental effect at 150 °C, reducing strength by 8.5%. The ±45° variant initially showed more promise, mirroring the reference configuration at room temperature with a 20% increase in strength and stiffness. However, this effect diminished drastically above RT; at 50 °C, the strength gain was only 2.5%, and at 150 °C, annealing reduced strength by 3%. Strain variation was negative below Tg, while becoming increasingly positive above it. SEM analysis (Figure 7c and Figure 8c) provides insight into this limited heat-treatment efficacy. For the 45° infill, annealing shifted the failure from the ductile intra-laminar fracture to inter-laminar failure at high temperatures. For the ±45° pattern, non-annealed samples exhibited distinct voids at the inter-bead junctions, which act as crack-initiation sites. In contrast, the annealed counterparts show a denser, more consolidated structure with significantly reduced porosity. This reduction in voids, a known benefit of annealing, contributes to a stronger bond that requires more energy to break, and indeed a higher strength at RT. Above 50 °C, inter-laminar fractures propagated within the layers regardless of their heat-treatment condition, being remarked a cross-laminar crack propagation. The reinforcement delamination (total for non-annealed and partial for annealed) below Tg explained the plasticity gap for 45° infill, while for the ±45° it was the cross-laminar propagation of inter-laminar cracks. Overall, the microstructural enhancements from annealing could not overcome the inherent mechanical disadvantage, particularly as the matrix softened above its glass transition temperature, making annealing an inefficient strategy for improving their high-temperature performance.
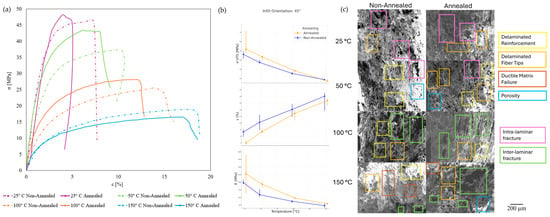
Figure 7.
Thermal influence on the tensile behavior of the 45° infill: stress–strain curves (a); annealing–temperature interaction plot including error bars for all results (b); fracture area (c).
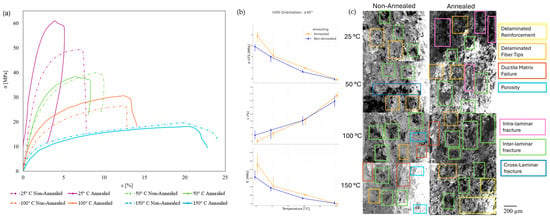
Figure 8.
Thermal influence on the tensile behavior of the ±45° infill: stress–strain curves (a); annealing–temperature interaction plot including error bars for all results (b); fracture area (c).
To summarize this section, annealing improved strength while reducing strain across all infill orientations by enhancing matrix crystallinity and inter-laminar bonding. However, the extent of these benefits was strongly dependent on the load-bearing mechanism dictated by the bead alignment:
- For the 0° and 0/90° patterns, where the load mechanism is direct fiber tension, the strengthened matrix improved stress transfer to the fibers, resulting in the most pronounced strength gains (35–50%), especially below Tg.
- For the 90° orientation, where the matrix and inter-bead bonds are crucial due to the perpendicular load path, improvements were more moderate.
- For the 45° and ±45° infills, failure is governed by matrix-dominated shear and bead slipping. Consequently, annealing had a limited effect on these orientations, especially above Tg where the matrix softens [42].
The annealing effect on PAHT-CF, especially printed in 0° and 0/90°, displayed similar improvements with PLA-CF and ABS-CF (0° infill) [24] tested at RT, while retaining slightly lower (7.5%) strength gain at elevated temperature than PEEK-CF (±45° infill) [26].
3.2. Influence of Infill Orientation for Similar Thermal Conditions for Conditioned Specimens
A comparative analysis at each thermal step was performed to identify optimal uses for PAHT-CF. The room temperature tensile results are presented in Table 5, serving as the reference for the analysis. The detailed version (Table A1, Table A2 and Table A3) presented the results in relation to the 0° infill, used as the reference.

Table 5.
Room temperature tensile results for the annealed specimens.
Overall, the highest σUTS (Figure 9a, Table A1) was for the 0° infill, except at RT, where 0/90° samples had a 2.5% increased strength that could be attributed to manufacturing variations, followed alternatively by the ±45° (25 °C) and 45° (50 °C) samples below Tg and 90° above Tg, while the lowest values were registered for 90° under Tg and 45° over it. The variation with infill for each thermal step started at approximately 20% (RT), increased to 28% at 50 °C, reduced drastically at 100 °C to 10%, and returned to 28% at 150 °C. Regarding plasticity, the 0° bead orientations displayed the lowest ε values (Figure 9b, Table A2) at all temperatures except 150 °C, where the 90° samples exhibited the lowest values. This was followed by 0/90° below Tg and 90° infill from 100 °C onwards, while ±45° achieved the maximum ε irrespective of temperature. The strain variation increased significantly from 80% to 125%, from 25 to 50 °C, stabilizing at approximately 75% by surpassing the Tg. In terms of the elastic modulus(Figure 9c, Table A3), the 0° specimens exhibited maximum values, alternating between 0/90° (25 °C), 45° (50 °C and 150 °C), and ±45° (100 °C). The variation steadily increased from 33% (RT) by 10% between the first three temperatures, whereas above Tc, it decreased by 35% compared to the previous testing conditions.
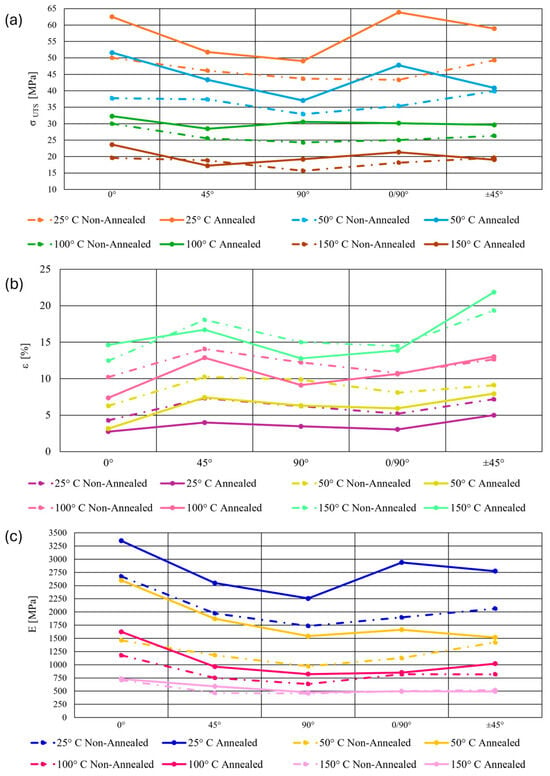
Figure 9.
Tensile results for annealed/non-annealed composite specimens: ultimate tensile strength (a); strain at failure (b); elastic modulus (c).
The results for the reference at 25 °C (Table 5, Figure 9) were compared with the values from Table 1. The results showed decreases in σUTS (25%), strain (67.5%), and E (7.5%) compared to the supplier’s data. The deviation is likely due to the material’s high sensitivity to ambient humidity. This sensitivity can cause issues even when standard drying procedures are followed. This highlights a critical practical challenge: achieving ideal properties in a typical manufacturing environment requires exceptionally stringent moisture control and extended drying times. Although annealing reduces porosity, its effects might be insufficient for the voids resulted from filament humidity. While respecting the prescriptions of the TDS, the annealed samples displayed higher standard deviation. To simulate conditions representative of common, accessible 3D printing workflows, specimens were cooled to RT via natural convection, although potentially causing variable crystallinity [43]. This approach was chosen to assess the material’s performance under practical conditions, not idealized laboratory ones. While a controlled furnace-cooling protocol could further be explored, this method provides a realistic baseline for industrial and hobbyist applications.
4. Conclusions and Further Studies
This study comprehensively analyzed the annealing effect on the tensile properties of additively manufactured PAHT-CF across various infills and a broad thermal range:
- Annealing significantly improved strength and elastic modulus by enhancing matrix properties. The benefits were most pronounced and temperature-resistant in the 0° and 0/90° patterns, where the load is carried by the fibers.
- In contrast, matrix-dominated orientations (45°, ±45°) showed limited benefits, directly linking the printing scheme to the efficacy of the heat treatment.
- The annealing effect varied with temperature, with the most significant improvements observed below the glass transition temperature. Above Tg, the effects were less pronounced but still notable.
- Annealed PAHT-CF showed superior performance to other analyzed materials like Nylon-CF and PLA-CF at room-temperature and slightly inferior to PEEK-CF at elevated temperatures.
This study demonstrates that annealing significantly enhances the high-temperature resilience of PAHT-CF, establishing it as a promising and affordable alternative to PEEK-CF for aerospace and automotive applications. However, tensile behavior is only one aspect of material performance. Future research should fully validate the material’s suitability by characterizing other critical mechanical properties, such as fatigue resistance and impact toughness. Furthermore, a quantitative porosity analysis and a parametric study of the annealing process are imperative for understanding the structure–property relationship and ensuring long-term structural integrity in extreme environments.
Author Contributions
Research Concept: T.F.Z. and M.C.D.; Resources: T.F.Z.; Original and Draft Preparation: T.F.Z.; Review and Editing: M.C.D.; Supervision: M.C.D. All authors have read and agreed to the published version of the manuscript.
Funding
This research received no external funding.
Data Availability Statement
Dataset available on request from the authors.
Acknowledgments
We express our gratitude to Apollo Tyres Global R&D for unconditionally supporting the experimental activities.
Conflicts of Interest
Author T.F. Zach was employed by Apollo Tyres Global R&D, and this study was outside of any business scope of the company, the investigation not being conditioned in any way. The remaining authors declare that the research was conducted in the absence of any commercial or financial relationships that could be construed as a potential conflict of interest.
Appendix A

Table A1.
Ultimate tensile strength results for the non-annealed/annealed composite specimens.
Table A1.
Ultimate tensile strength results for the non-annealed/annealed composite specimens.
| Temperature | Annealed | Orientation | σUTS [MPa] | Standard Deviation | Reference Gap |
|---|---|---|---|---|---|
| 25 °C | non-annealed | 0° | 50.05 | 1.69 | Reference |
| 45° | 46.11 | 2.84 | −7.87% | ||
| 90° | 43.68 | 2.06 | −12.73% | ||
| 0/90° | 43.32 | 2.77 | −13.45% | ||
| ±45° | 49.29 | 2.8 | −1.52% | ||
| annealed | 0° | 62.51 | 4.8 | Reference | |
| 45° | 51.79 | 9.76 | −17.15% | ||
| 90° | 49.04 | 2.26 | −21.55% | ||
| 0/90° | 63.88 | 3.6 | 2.19% | ||
| ±45° | 58.91 | 3.44 | −5.76% | ||
| 50 °C | non-annealed | 0° | 37.73 | 3.27 | Reference |
| 45° | 37.37 | 1.59 | −0.95% | ||
| 90° | 32.9 | 2.2 | −12.92% | ||
| 0/90° | 35.35 | 1.02 | −7.23% | ||
| ±45° | 39.91 | 2.42 | 6.17% | ||
| annealed | 0° | 51.59 | 6.91 | Reference | |
| 45° | 43.35 | 2.06 | −15.97% | ||
| 90° | 37.04 | 4.57 | −28.20% | ||
| 0/90° | 47.79 | 0.72 | −7.37% | ||
| ±45° | 40.87 | 4.59 | −20.78% | ||
| 100 °C | non-annealed | 0° | 30 | 1 | Reference |
| 45° | 25.53 | 1.28 | −14.90% | ||
| 90° | 24.29 | 0.77 | −19.03% | ||
| 0/90° | 25 | 2.1 | −16.67% | ||
| ±45° | 26.29 | 1.39 | −12.37% | ||
| annealed | 0° | 32.27 | 7.11 | Reference | |
| 45° | 28.45 | 0.44 | −11.84% | ||
| 90° | 30.54 | 1.58 | −5.36% | ||
| 0/90° | 30.14 | 1.28 | −6.60% | ||
| ±45° | 29.64 | 0.72 | −8.15% | ||
| 150 °C | non-annealed | 0° | 19.59 | 0.89 | Reference |
| 45° | 19.17 | 0.41 | −3.98% | ||
| 90° | 15.68 | 0.73 | −19.96% | ||
| 0/90° | 18.13 | 1.1 | −7.45% | ||
| ±45° | 19.64 | 1.04 | 0.26% | ||
| annealed | 0° | 23.62 | 1.07 | Reference | |
| 45° | 18.81 | 1.04 | −27.10% | ||
| 90° | 17.22 | 0.58 | −18.84% | ||
| 0/90° | 21.32 | 1.21 | −9.74% | ||
| ±45° | 19.03 | 0.67 | −19.43% |

Table A2.
Strain at failure values for the non-annealed/annealed composite specimens.
Table A2.
Strain at failure values for the non-annealed/annealed composite specimens.
| Temperature | Annealed | Orientation | ε [%] | Standard Deviation | Reference Gap |
|---|---|---|---|---|---|
| 25 °C | non-annealed | 0° | 4.29 | 0.27 | Reference |
| 45° | 7.31 | 0.93 | 70.40% | ||
| 90° | 6.23 | 1.3 | 45.22% | ||
| 0/90° | 5.2 | 0.75 | 21.21% | ||
| ±45° | 7.18 | 1.33 | 67.37% | ||
| annealed | 0° | 2.75 | 1.45 | Reference | |
| 45° | 3.99 | 0.55 | 45.09% | ||
| 90° | 3.47 | 0.72 | 26.18% | ||
| 0/90° | 3.04 | 0.53 | 10.55% | ||
| ±45° | 4.99 | 0.81 | 81.45% | ||
| 50 °C | non-annealed | 0° | 6.28 | 1.76 | Reference |
| 45° | 10.23 | 1.69 | 62.90% | ||
| 90° | 9.86 | 0.84 | 57.01% | ||
| 0/90° | 8.09 | 0.77 | 28.82% | ||
| ±45° | 9.1 | 1.58 | 44.90% | ||
| annealed | 0° | 3.15 | 0.59 | Reference | |
| 45° | 7.42 | 0.6 | 135.56% | ||
| 90° | 6.3 | 1.69 | 100.00% | ||
| 0/90° | 5.94 | 0.38 | 88.57% | ||
| ±45° | 7.94 | 0.97 | 152.06% | ||
| 100 °C | non-annealed | 0° | 10.2 | 1.25 | Reference |
| 45° | 14.07 | 1.52 | 37.94% | ||
| 90° | 12.23 | 1.69 | 19.90% | ||
| 0/90° | 10.75 | 1.21 | 5.39% | ||
| ±45° | 12.65 | 1.28 | 24.02% | ||
| annealed | 0° | 7.37 | 1.9 | Reference | |
| 45° | 12.87 | 1.16 | 74.63% | ||
| 90° | 9.11 | 0.7 | 23.61% | ||
| 0/90° | 10.64 | 0.79 | 44.37% | ||
| ±45° | 13.01 | 1.05 | 76.53% | ||
| 150 °C | non-annealed | 0° | 12.46 | 1.55 | Reference |
| 45° | 18.07 | 2.11 | 45.02% | ||
| 90° | 15 | 0.92 | 20.39% | ||
| 0/90° | 14.49 | 1.5 | 16.29% | ||
| ±45° | 19.34 | 1.56 | 55.22% | ||
| annealed | 0° | 14.63 | 0.83 | Reference | |
| 45° | 16.7 | 0.86 | 14.15% | ||
| 90° | 12.77 | 2.05 | −12.71% | ||
| 0/90° | 13.86 | 0.6 | −5.26% | ||
| ±45° | 21.85 | 0.91 | 49.35% |

Table A3.
Elastic modulus values for the unconditioned/conditioned composite specimens.
Table A3.
Elastic modulus values for the unconditioned/conditioned composite specimens.
| Temperature | Annealed | Orientation | E [MPa] | Standard Deviation | Reference Gap |
|---|---|---|---|---|---|
| 25 °C | non-annealed | 0° | 2674.32 | 84.53 | Reference |
| 45° | 1973.85 | 117.56 | −26.19% | ||
| 90° | 1734.85 | 223.45 | −35.13% | ||
| 0/90° | 1897.22 | 348.03 | −29.06% | ||
| ±45° | 2064.35 | 200.32 | −22.81% | ||
| annealed | 0° | 3349.36 | 1148.72 | Reference | |
| 45° | 2548.18 | 965.46 | −23.92% | ||
| 90° | 2255.39 | 283.54 | −32.66% | ||
| 0/90° | 2938.59 | 463.68 | −12.26% | ||
| ±45° | 2773.4 | 409.63 | −17.20% | ||
| 50 °C | non-annealed | 0° | 1461.95 | 79.09 | Reference |
| 45° | 1181.37 | 191.39 | −19.19% | ||
| 90° | 970.04 | 81.27 | −33.65% | ||
| 0/90° | 1127.06 | 80.34 | −22.91% | ||
| ±45° | 1421.84 | 118.77 | −2.74% | ||
| annealed | 0° | 2599.33 | 428.65 | Reference | |
| 45° | 1871.5 | 154.53 | −28.00% | ||
| 90° | 1541.6 | 312.3 | −40.69% | ||
| 0/90° | 1664.33 | 173.71 | −35.97% | ||
| ±45° | 1518.18 | 265.06 | −41.59% | ||
| 100 °C | non-annealed | 0° | 1179.7 | 61.06 | Reference |
| 45° | 751.89 | 73.66 | −36.26% | ||
| 90° | 635.01 | 77.22 | −46.17% | ||
| 0/90° | 820.21 | 95.78 | −30.47% | ||
| ±45° | 818.65 | 49.22 | −30.61% | ||
| annealed | 0° | 1625.35 | 243.6 | Reference | |
| 45° | 964.35 | 37.21 | −40.67% | ||
| 90° | 821.85 | 126.23 | −49.44% | ||
| 0/90° | 852.14 | 276.25 | −47.57% | ||
| ±45° | 1020.1 | 51.39 | −37.24% | ||
| 150 °C | non-annealed | 0° | 708.16 | 55.88 | Reference |
| 45° | 465.38 | 96.06 | −34.28% | ||
| 90° | 455.3 | 46.52 | −35.71% | ||
| 0/90° | 495.03 | 61.42 | −29.22% | ||
| ±45° | 521.82 | 74.68 | −26.31% | ||
| annealed | 0° | 732.08 | 48.81 | Reference | |
| 45° | 590.44 | 25 | −19.35% | ||
| 90° | 477.12 | 47.16 | −34.83% | ||
| 0/90° | 501.25 | 66.6 | −32.38% | ||
| ±45° | 493.14 | 34.66 | −32.64% |

Table A4.
Two-way ANOVA results on strength on the effect of temperature and annealing.
Table A4.
Two-way ANOVA results on strength on the effect of temperature and annealing.
| Infill Orientation | η2 (σUTS) | Temperature Range | Cohen’s d on σUTS |
|---|---|---|---|
| 0° | 0.092 | 25–50 °C | 3 |
| 100 °C | 1 | ||
| 150 °C | 3.5 | ||
| 90° | 0.085 | 25–50 °C | 2.5 |
| 100 °C | 1.2 | ||
| 150 °C | 2.8 | ||
| 0/90° | 0.078 | 25 °C | 3.2 |
| 50 °C | 2.9 | ||
| 100–150 °C | 2.3 | ||
| 45° | 0.07 | 25–50 °C | 1.8 |
| 100 °C | 1.0 | ||
| 150 °C | −0.9 | ||
| ±45° | 0.065 | 25 °C | 2.2 |
| 50 °C | 1.5 | ||
| 100 °C | 2.5 | ||
| 150 °C | −0.8 |

Table A5.
Two-way ANOVA results on strain on the effect of temperature and annealing.
Table A5.
Two-way ANOVA results on strain on the effect of temperature and annealing.
| Infill Orientation | η2 (ε) | Temperature Range | Cohen’s d on ε |
|---|---|---|---|
| 0° | 0.02 | 25–50 °C | −2.0 |
| 100 °C | −0.9 | ||
| 150 °C | 3.0 | ||
| 90° | 0.025 | 25 °C | −2.8 |
| 50 °C | −1.5 | ||
| 100–150 °C | −1.0 | ||
| 0/90° | 0.018 | 25 °C | −3.0 |
| 50 °C | −2.0 | ||
| 100 °C | 0.1 | ||
| 150 °C | 1.1 | ||
| 45° | 0.015 | 25–50 °C | −1.5 |
| 100 °C | −0.8 | ||
| 150 °C | 0.7 | ||
| ±45° | 0.017 | 25 °C | −2.0 |
| 50 °C | −1.2 | ||
| 100–150 °C | 0.6 |

Table A6.
Two-way ANOVA results on elastic modulus on the effect of temperature and annealing.
Table A6.
Two-way ANOVA results on elastic modulus on the effect of temperature and annealing.
| Infill Orientation | η2 (E) | Temperature Range | Cohen’s d on E |
|---|---|---|---|
| 0° | 0.112 | 25–50 °C | 3.6 |
| 100 °C | 1.2 | ||
| 150 °C | 0.75 | ||
| 90° | 0.098 | 25–50 °C | 3.0 |
| 100 °C | 1.8 | ||
| 150 °C | 1.0 | ||
| 0/90° | 0.085 | 25 °C | 3.5 |
| 50 °C | 2.5 | ||
| 100–150 °C | 1.2 | ||
| 45° | 0.077 | 25–50 °C | 2.0 |
| 100 °C | 1.1 | ||
| 150 °C | 0.8 | ||
| ±45° | 0.073 | 25 °C | 2.5 |
| 50 °C | 1.5 | ||
| 100 °C | 0.9 | ||
| 150 °C | −0.9 |
References
- Zach, T.F.; Dudescu, M.C. The Three-Dimensional Printing of Composites: A Review of the Finite Element/Finite Volume Modelling of the Process. J. Compos. Sci. 2024, 8, 146. [Google Scholar] [CrossRef]
- Abdalla, H.M.A. Review of rules of mixture for effective elastic properties in fibrous and particulate composite materials. Compos. Struct. 2025, 367, 119216. [Google Scholar] [CrossRef]
- Oladele, I.O.; Oki, V.O.; Omotosho, T.F.; Adebanjo, M.B.; Ayanleye, O.T.; Adekola, S.A. Sustainable polymer and polymer-based composite materials for extreme conditions and demanding applications—A review on pushing boundaries in materials science. Next Mater. 2025, 8, 100775. [Google Scholar] [CrossRef]
- Zhang, X.; Sun, G.; Wang, C.; Li, H.; Zhou, S. A review of structural topology optimization for fiber-reinforced composites. Compos. Part B Eng. 2025, 299, 112393. [Google Scholar] [CrossRef]
- Ajayi, N.E.; Rusnakova, S.; Ajayi, A.E.; Ogunleye, R.O.; Agu, S.O.; Amenaghawon, A.N. A comprehensive review of natural fiber reinforced Polymer composites as emerging materials for sustainable applications. Appl. Mater. Today 2025, 43, 102666. [Google Scholar] [CrossRef]
- Mylsamy, B.; Aruchamy, K.; Shanmugam, S.K.M.; Palanisamy, S.; Ayrilmis, N. Improving performance of composites: Natural and synthetic fibre hybridisation techniques in composite materials—A review. Mater. Chem. Phys. 2025, 334, 130439. [Google Scholar] [CrossRef]
- Wielhorski, Y.; Mendoza, A.; Rubino, M.; Roux, S. Numerical modeling of 3D woven composite reinforcements: A review. Compos. Part A Appl. Sci. Manuf. 2022, 154, 106729. [Google Scholar] [CrossRef]
- Wickramasinghe, S.; Manalo, A.; Alajarmeh, O.; Sorbello, C.D.; Weerakoon, S.; Ngo, T.D.; Benmokrane, B. Advancing polymer composites in civil infrastructure through 3D printing. Autom. Constr. 2025, 177, 106311. [Google Scholar] [CrossRef]
- Ziegmann, G.; Oehl, G.; Hefft, L.T. 1—Recent trends in “conventional” manufacturing of composites. In Additive Manufacturing of Polymer-Based Composite Materials; Touchard, F., Sarasini, F., Eds.; Woodhead Publishing: Cambridge, UK, 2024; pp. 1–36. [Google Scholar] [CrossRef]
- Tuli, N.T.; Khatun, S.; Bin Rashid, A. Unlocking the future of precision manufacturing: A comprehensive exploration of 3D printing with fiber-reinforced composites in aerospace, automotive, medical, and consumer industries. Heliyon 2024, 10, e27328. [Google Scholar] [CrossRef]
- Blanco, I. The use of composite materials in 3D printing. J. Compos. Sci. 2020, 4, 42. [Google Scholar] [CrossRef]
- Bernatas, R.; Dagreou, S.; Despax-Ferreres, A.; Barasinski, A. Recycling of fiber reinforced composites with a focus on thermoplastic composites. Clean. Eng. Technol. 2021, 5, 100272. [Google Scholar] [CrossRef]
- Liu, G.; Xiong, Y.; Zhou, L. Additive manufacturing of continuous fiber reinforced polymer composites: Design opportunities and novel applications. Compos. Commun. 2021, 27, 100907. [Google Scholar] [CrossRef]
- Sun, B.; Dong, W.; Liu, C.; Xing, Y.; Sun, J.; Liang, X.; Duan, H.; Jia, X. A critical review on additive manufacturing of continuous fiber-reinforced polymer composites: Materials, fabrication, structural design and novel functions. Thin-Walled Struct. 2025, 215, 113491. [Google Scholar] [CrossRef]
- Racz, L.; Dudescu, M.C. Numerical evaluation of the infill pattern upon mechanical proprieties of 3D printed materials. Procedia Struct. Integr. 2024, 56, 3–10. [Google Scholar] [CrossRef]
- Yavas, D. High-temperature fracture behavior of carbon fiber reinforced PEEK composites fabricated via fused filament fabrication. Compos. Part B Eng. 2023, 266, 110987. [Google Scholar] [CrossRef]
- Grasso, M.; Azzouz, L.; Ruiz-Hincapie, P.; Zarrelli, M.; Ren, G. Effect of temperature on the mechanical properties of 3D-printed PLA tensile specimens. Rapid Prototyp. J. 2018, 24, 1337–1346. [Google Scholar] [CrossRef]
- Beyler, C.L.; Hirschler, M.M. Chapter 7: Thermal Decomposition of Polymers. In SFPE Handbook of Fire Protection Engineering; National Fire Protection Association: Quincy, MA, USA, 2002; pp. 111–131. [Google Scholar]
- Agarwal, N.; Rangamani, A.; Bhavsar, K.; Virnodkar, S.S.; Fernandes, A.A.A.; Chadha, U.; Srivastava, D.; Patterson, A.E.; Rajasekharan, V. An overview of carbon-carbon composite materials and their applications. Front. Mater. 2024, 11, 1374034. [Google Scholar] [CrossRef]
- Lv, X.; Yang, S.; Pei, X.; Zhang, Y.; Wang, Q.; Wang, T. Enhanced mechanical and tribological properties of 3D printed short carbon fiber reinforced polyether ether ketone composites. Polym. Compos. 2024, 45, 8840–8860. [Google Scholar] [CrossRef]
- Fu, Y.-T.; Li, J.; Guo, F.-L.; Li, Y.-Q.; Fu, S.-Y. Micro-structure and tensile property analyses of 3D printed short carbon fiber reinforced PEEK composites. Compos. Commun. 2023, 41, 101655. [Google Scholar] [CrossRef]
- Bright, B.M.; Binoj, J.S.; Abu Hassan, S.; Wong, W.L.E.; Suryanto, H.; Liu, S.; Goh, K.L. Feasibility study on thermo-mechanical performance of 3D printed and annealed coir fiber powder/polylactic acid eco-friendly biocomposites. Polym. Compos. 2024, 45, 6512–6524. [Google Scholar] [CrossRef]
- Bianchi, I.; Forcellese, A.; Simoncini, M.; Vita, A. Effect of in situ and furnace thermal annealing on the mechanical properties and sustainability of 3D printed carbon-peek composites. Proc. Inst. Mech. Eng. Part B J. Eng. Manuf. 2023, 238, 1794–1804. [Google Scholar] [CrossRef]
- Nassar, A.; Younis, M.; Elzareef, M.; Nassar, E. Effects of heat-treatment on tensile behavior and dimension stability of 3D printed carbon fiber reinforced composites. Polymers 2021, 13, 4305. [Google Scholar] [CrossRef] [PubMed]
- Kumar, S.; Yoo, D.-H.; Song, J.-S.; Kim, H.-S. Effect of geometric configurations and heat treatment on the tensile properties, joint performance, and failure behavior of 3D-Printed carbon and glass fiber composites. Compos. Part B Eng. 2025, 304, 112693. [Google Scholar] [CrossRef]
- Li, J.; Fu, Y.; Pi, W.; Li, Y.; Fu, S. Improving mechanical performances at room and elevated temperatures of 3D printed polyether-ether-ketone composites by combining optimal short carbon fiber content and annealing treatment. Compos. Part B Eng. 2023, 267, 111067. [Google Scholar] [CrossRef]
- Yu, W.; Wang, X.; Yin, X.; Ferraris, E.; Zhang, J. The effects of thermal annealing on the performance of material extrusion 3D printed polymer parts. Mater. Des. 2023, 226, 111687. [Google Scholar] [CrossRef]
- Zach, T.F.; Dudescu, M.C.; Bere, P. High-Temperature Tensile Performance of Fused Filament Fabricated Discontinuous Carbon Fiber-Reinforced Polyamide. Polymers 2025, 17, 1732. [Google Scholar] [CrossRef]
- ISO 527-4:2023; Plastics—Determination of Tensile Properties. Part 4: Test Conditions for Isotropic and Orthotropic Fibre-Reinforced Plastic Composites. British Standards Institution: London, UK, 2023.
- Alarifi, I.M. A performance evaluation study of 3D printed nylon/glass fiber and nylon/carbon fiber composite materials. J. Mater. Res. Technol. 2022, 21, 884–892. [Google Scholar] [CrossRef]
- Bambulab. Technical Data Sheet—PAHT-CF. Available online: https://eu.store.bambulab.com/en-nl/products/paht-cf (accessed on 15 September 2025).
- CarbonX CF PEEK: Techincal Data Sheet. Available online: https://cdn.shopify.com/s/files/1/0625/4185/6821/files/CarbonX_CF_PEEK_TDS_v3.pdf (accessed on 15 September 2025).
- CarbonX CF PLA: Technical Data Sheet. Available online: https://cdn.shopify.com/s/files/1/0625/4185/6821/files/CarbonX_CF_PLA_TDS_v3.pdf?v=1723942765 (accessed on 15 September 2025).
- CarbonX CF-ABS: Technical Data Sheet. Available online: https://cdn.shopify.com/s/files/1/0625/4185/6821/files/CarbonX_CF_ABS_TDS_v3.pdf?v=1723942765 (accessed on 15 September 2025).
- ISO 23529:2016; Rubber—General Procedures for Preparing and Conditioning Test Pieces for Physical Test Methods. International Organization for Standardization: Vervier, Switzerland, 2024.
- Bambulab. Bambu Lab X1 Carbon. Available online: https://bambulab.com/en-eu/x1 (accessed on 15 September 2025).
- Friedrich, L.M.; Gunther, R.T.; Seppala, J.E. Suppression of Filament Defects in Embedded 3D Printing. ACS Appl. Mater. Interfaces 2022, 14, 32561–32578. [Google Scholar] [CrossRef]
- Told, R.; Kardos, K.; Paari-Molnar, E.; Szabo, G.; Ujfalusi, Z.; Sahai, N.; Szabo, P.; Maroti, P. Comparative Analysis of Mechanical and Thermal Characteristics of 3D-Printed Polyamide using Material Extrusion and Powder Bed Fusion Process with Industrial and Desktop Printers. Macromol. Mater. Eng. 2024, 310, 2400293. [Google Scholar] [CrossRef]
- ISO 37:2024; Rubber, Vulcanized or Thermoplastic—Determination of Tensile Stress-Strain Properties. International Organization for Standardization: Vervier, Switzerland, 2024.
- Instron. 5900 Series—Premier Testing Solutions. 2016. Available online: https://www.instron.com/wp-content/uploads/2024/07/5900-series-general-brochure-3.pdf (accessed on 16 September 2025).
- Papon, E.A.; Haque, A. Fracture toughness of additively manufactured carbon fiber reinforced composites. Addit. Manuf. 2019, 26, 41–52. [Google Scholar] [CrossRef]
- Dress, G.A.; Woldemariam, M.H.; Redda, D.T. Influence of Fiber Orientation on Impact Resistance Behavior of Woven Sisal Fiber Reinforced Polyester Composite. Adv. Mater. Sci. Eng. 2021, 2021, 6669600. [Google Scholar] [CrossRef]
- Rodzeń, K.; McIlhagger, A.; Strachota, B.; Strachota, A.; Meenan, B.J.; Boyd, A. Controlling Crystallization: A Key Factor during 3D Printing with the Advanced Semicrystalline Polymeric Materials PEEK, PEKK 6002, and PEKK 7002. Macromol. Mater. Eng. 2023, 308, 2200668. [Google Scholar] [CrossRef]
Disclaimer/Publisher’s Note: The statements, opinions and data contained in all publications are solely those of the individual author(s) and contributor(s) and not of MDPI and/or the editor(s). MDPI and/or the editor(s) disclaim responsibility for any injury to people or property resulting from any ideas, methods, instructions or products referred to in the content. |
© 2025 by the authors. Licensee MDPI, Basel, Switzerland. This article is an open access article distributed under the terms and conditions of the Creative Commons Attribution (CC BY) license (https://creativecommons.org/licenses/by/4.0/).