You are currently viewing a new version of our website. To view the old version click .
Journal of Composites Science
  • Article
  • Open Access

1 November 2025

Low-Velocity Impact Modeling of Fiber-Reinforced Composites Using Shell Elements: A Benchmark Study

and
1
Department of Mechanical Engineering, University of Maine, 75 Long Road, Orono, ME 04469, USA
2
Advanced Structures and Composites Center, University of Maine, 35 Flagstaff Road, Orono, ME 04469, USA
*
Author to whom correspondence should be addressed.
This article belongs to the Special Issue Characterization and Modeling of Composites, 4th Edition

Abstract

Composite laminates are used in aerospace and wind energy applications, where they are often subjected to low-velocity impact (LVI) that can cause barely visible damage, compromising their structural integrity. The finite element method helps predict the impact behavior of composite laminates under LVI; however, achieving accuracy and computational efficiency remains challenging. Conventional shell elements (CSEs) are efficient alternatives to solid elements due to their reduced degrees of freedom. This study aims to establish modeling guidelines for LVI modeling of composite laminates using CSEs in Abaqus. A mesh convergence study using contact force, displacement, and stress is proposed and evaluated across five experimental case studies. While contact force and displacement converge quickly, stress is sensitive to element size and number of through-the-thickness section points. A parametric study of seven projectile modeling techniques shows that a deformable projectile combined with a kinematic algorithm reliably predicts LVI behavior. Furthermore, comparing artificial strain energy across three hourglass algorithms shows that the enhanced algorithm outperforms in controlling hourglass mode with minimal numerical stiffening. Finally, the applicable thickness range of CSE is quantified, indicating accurate prediction for thickness-to-width ratios below 0.04. These findings highlight the strength and limitations of CSEs in LVI modeling of composite laminates and serve as a benchmark for future analyses.

1. Introduction

1.1. Background and Motivation

Fiber-reinforced composites are widely used in aerospace, wind turbine blades, marine, and automotive applications due to their high specific strength, stiffness, and tailored anisotropy []. However, these materials are susceptible to damage from transverse loads, particularly impact [,,]. While high-velocity impact is often associated with extreme events leading to penetration and perforation of composite structures [], low-velocity impact (LVI) is characterized by barely visible impact damage (BVID), e.g., delamination [], which is difficult to detect and can compromise structural integrity (refer to Appendix A for the definition of the terms used in this paper). Frequent LVI events, such as tool drop during maintenance [] or bat impact in service [], can drastically reduce the load-carrying capacity of composite structures. LVI can result in up to a 30% loss in flexural strength and a 70% loss in compressive strength after LVI []. These concerns have motivated extensive research to understand, characterize, and predict the impact behavior of composites subjected to LVI [,,,,].
Typically, LVI refers to impact events with impact velocities lower than 10 m/s [,]. LVI involves a range of energy absorption mechanisms (EAMs); among them, matrix cracking, delamination, and fiber breakage are the most frequent [,,]. Various parameters can affect the impact behavior of composites under LVI, including impact scenario parameters (e.g., projectile’s shape and velocity, impact angle, as well as boundary condition, and preloading condition), material parameters (e.g., fiber, matrix, stacking sequence, fabric architecture), and environmental parameters (e.g., temperature and moisture) [,]. The complex and multi-aspect nature of LVI necessitates a comprehensive study of a series of different impact events to identify the most critical ones. This makes experimental testing alone insufficient, especially at the component and full-scale levels, where tests are costly and limited in scope. Consequently, numerical methods, such as the finite element method (FEM), have been developed in response to the challenges and limitations of experimental campaigns, serving as a complementary method. FEM is capable of predicting the impact behavior of composites from coupon-level to full scale, offering flexibility in modeling complexity while reducing the cost and experimental testing requirements.

1.2. Finite Element Modeling Techniques of Unidirectional Fiber-Reinforced Composites

FEM is a powerful tool to analyze the mechanical behavior and failure mechanisms of composites across different length scales. At the mesoscale (1–10 mm) and macroscale (100–1000 mm) [,], FEM is widely used due to its robustness in handling complex geometries and boundary conditions. FEM is also applicable to microscale phenomena (10 μm) [], where it enables modeling interactions between fibers, matrix, and their interface [,]. Table 1 summarizes different modeling techniques for multiscale finite element (FE) modeling of unidirectional fiber composites, highlighting the level of fidelity, characteristic(s), advantage(s), and disadvantage(s) of every modeling technique, with a focus on fiber and matrix failure and delamination as the primary EAMs.
Table 1. Summary of different multiscale FE modeling techniques of unidirectional composites with an emphasis on fiber and matrix failure and delamination EAMs (* representative volume element, virtual crack closure technique).
Low-fidelity models, such as layer-wise, rely on ad hoc assumptions from plate and shell theories. These models are efficient in capturing the overall structural response; however, they fall short in providing a detailed analysis of EAMs and stress prediction. In contrast, high-fidelity models, summarized in Table 1, are typically composed of solid and cohesive elements, providing detailed insights into EAMs and their interactions. However, these models are computationally expensive, and their complexity limits their practical application to large-scale composite structures and parametric studies. Bridging the gap between the low- and high-fidelity models, conventional shell elements (CSEs), such as S4R elements—a four-node quadrilateral CSE with reduced integration and a large-strain formulation—in the commercial code Abaqus, offer a balance between computational efficiency and acceptable accuracy []. CSEs use simplified geometry, have reduced degrees of freedom (DOF), and rely on section points through the thickness, avoiding the need for through-the-thickness discretizations. The use of section points enables CSEs to avoid the issue of small stable time increments associated with solid elements in explicit solvers []. Solid elements—with small through-thickness discretizations—and cohesive elements—due to their small thickness—govern the stable time increment, resulting in longer runtimes in explicit solvers. This is because the smallest element dimension governs the stable time increment in explicit solvers. These advantages make CSE attractive to parametric studies [], submodeling [], and cyclic load []. Furthermore, CSEs, combined with suitable damage models such as the Hashin failure criterion and cohesive elements, enables the prediction of intralaminar (matrix cracking and fiber breakage) and interlaminar (delamination) damage with reasonable accuracy []. A comprehensive review of various techniques for combined CSEs and cohesive elements in LVI modeling of composite laminates is provided in [].

1.3. The Need for a Benchmark Study of Conventional Shell Elements

Several studies have established FE modeling guidelines for LVI of composite laminates, particularly using CSEs. An excellent benchmark for LVI modeling of composite laminates with linear elastic material behavior based on shell modeling techniques in Abaqus was established in []. It was found that continuum shell elements (SC8R), despite higher computational cost, provided more accurate predictions of contact force and displacement than CSEs (S4R). Their study showed that the deformable projectile exhibited more realistic results than a rigid projectile, despite increased computational time. They further compared Abaqus/Implicit and Abaqus/Explicit solvers and concluded that both solvers could handle dynamic problems. However, Abaqus/Explicit resulted in longer runtime for small problems due to the small stable time increment, which is driven by the element dimension. LVI modeling of composite laminate, including the boundary conditions and material damage using the Hashin failure criterion and the continuum damage model, was studied in []. The results indicated that the fully clamped boundary condition resulted in a higher peak contact force and more extensive matrix cracking compared to the simply supported boundary condition. In contrast, ref. [] reported that the choice of boundary condition had a negligible effect on the contact force response when the laminate was modeled as linear elastic. The effect of hourglass control algorithms on the force–displacement plot was studied in []. They reported negligible differences in the contact force response using the continuum shell elements. Furthermore, it was shown that small values of mass scaling, such as 1.5%, could reduce computational time by 92%. Nevertheless, the mass scaling could lead to an overestimated delamination size.
Despite the widespread application of CSEs in LVI modeling of composite laminates, the most recent comprehensive benchmark study was published in 2011 []. Since then, Abaqus has remained one of the leading commercial FE codes due to its capabilities in handling linear and nonlinear analyses, complex material modeling, and a user-friendly interface []. CSEs, particularly S4R elements in Abaqus, have become attractive due to their computational efficiency and ease of modeling. However, the absence of updated modeling guidelines and a systematic benchmark study that identifies the best practices, quantifies limitations, and assesses the reliability of CSE—particularly in the presence of damage—raises concerns regarding their predictive accuracy and applicable thickness range in LVI modeling of composite laminates. This paper, therefore, aims to (I) establish a benchmark for accurate and computationally efficient LVI modeling of composite laminates using CSEs and (II) identify the thickness limit within which CSEs remain valid. To achieve these goals, we develop a three-phase methodology in this paper to establish the best modeling practices for CSEs in Abaqus. These phases include preprocessing, finite element analysis (FEA), and postprocessing, as illustrated in Figure 1. In the preprocessing phase, we systematically vary the key modeling parameters—including the contact constraint algorithm, different projectile modeling techniques, hourglass control algorithms, and laminate thickness—to assess their effect on solution accuracy. The FEA phase includes two stages: verification and validation. During verification, three criteria—including contact force, displacement, and stress—are used for the mesh convergence study. During validation, the verified FE models are then benchmarked against experimental results from the literature. Finally, the postprocessing phase provides best-practice recommendations for LVI modeling of composite laminates using CSEs, including optimal parameter combinations and the applicable thickness limit of CSEs.
Figure 1. An overview of the methodology used in this paper.

1.4. Novelty and Structure of the Paper

The novelty of this paper lies in presenting a comprehensive parametric study on LVI modeling of composite laminate using CSEs in Abaqus, with a focus on best practices and identifying their limitations. (I) A novel mesh convergence study is proposed that incorporates stress, in addition to the commonly used contact force and displacement, addressing the gap in the previous literature [,,,]. The proposed mesh convergence study further investigates the effect of the number of section points through the laminate thickness on the solution accuracy. This is particularly important because many widely used failure criteria for composites, such as Hashin [,], Puck [,], and LaRC [,], are stress-based. (II) The influence of different hourglass algorithms is assessed through the energy history plots to capture their cumulative effect on the solution accuracy. (III) Finally, we establish a thickness range within which CSEs can be reliably used for LVI modeling of composites. This paper is structured as follows: First, we present the key parameters and procedures in Section 2. This includes an explanation of the case studies included in this paper, the preprocessing parameters for FEA, and the proposed mesh convergence study, as well as the rationale for studying hourglass control and the applicable thickness range of CSEs. Section 3 discusses the FEA results. Finally, concluding remarks are provided in Section 4.

1.5. Study Limitations

This paper focuses on LVI modeling of composite laminates using the S4R element unique to Abaqus. The S4R element enforces the first-order shear deformation theory (FSDT) and is suitable for applications where transverse shear deformations are nonnegligible, such as impact []. This paper is limited to nonrepeated, hard-body impact (i.e., drop-weight impact test) at velocities less than 10 m/s. The oblique impact often leads to shear-driven delamination [] and sliding at the contact interface [], which requires a separate parametric study to account for the different impact angles. While such analyses are of great practical relevance, the normal impact is considered the most serious impact event on the composite structures []. Therefore, this paper is limited to normal impact events, where the projectile impacts the laminate at an angle of 90° (normal to the laminate surface, along the laminate thickness direction). Although interlaminar damage (i.e., delamination) is a frequent failure mechanism in composite laminates during LVI, this paper only considers intralaminar damage (i.e., fiber and matrix failure). The constitutive damage model is based on the Hashin failure criterion and continuum damage model (CDM) in Abaqus. Assumptions and limitations of these damage models are discussed in Appendix B. Despite using the Hashin failure criterion, we do not quantify the damage initiation and evolution. Instead, we focus on the overall laminate response and convergence study. The proprietary nature of Abaqus limits the depth of the mathematical explanation, with the interpretation focusing on qualitative observations rather than fundamental algorithmic details. While the methodology and procedures are general, results may vary depending on impact velocity, projectile shape and mass, laminate stacking sequence, geometry, constituent materials, and environmental conditions. Furthermore, all the analyses in this paper are conducted at the coupon scale. While the findings provide valuable insight into the accuracy and limitations of CSEs, the scale-up from coupon level to structural scale may require additional numerical verification and experimental validation. The conclusions and best practices presented in this paper are based on the surveyed literature provided in Table 2, and the scope limitations should be considered when interpreting the results. Overall, this paper establishes a benchmark for the LVI modeling of composite laminates using CSEs in Abaqus, highlighting both the best practices and limitations, and providing guidelines for future research. Furthermore, the Abaqus files developed in this paper are publicly available on GitHub.

2. Methodology

2.1. Description of Case Studies Included in This Paper

The validation phase of this paper (see Figure 1) relies on five experimental case studies from the existing literature. The literature used in this paper is listed in Table 2, covering impact velocities less than 10 m/s, with impact energies ranging from 10 to 35 J, and laminate thicknesses from 2 to 12 mm reinforced with unidirectional carbon fiber, and given stacking sequence. All the case studies conform to the ASTM D7136 [] standard to ensure consistency in test configuration and boundary conditions. This consistency facilitates a systematic assessment of the accuracy and limitations of CSEs, particularly the S4R elements in Abaqus.
Table 2. Summary of the experimental literature used in the validation stage of the FEA phase.
Case
Study
Impact
Velocity
[m/s]
Kinetic
Energy
[J]
Projectile
Diameter
[mm]
Laminate
Thickness
[mm]
Fiber
Reinforcement
Stacking
Sequence
Reference
#13.30034.4712.74.65T800H/3900-2 [45/90/−45/0] 3 s []
#23.19715.0016.02.00TENAX-E HTS40
F13 12K
[∓45/0/90]s[]
#32.36410.0016.04.46Unidirectional
carbon
[±45/0 2 /90/0] 2 s []
#43.41635.0016.06.00TENAX-E HTS40
F13 12K
[∓45/0/90/±45/
90/0/∓45/0/90] s
[]
#53.41635.0016.012.00TENAX-E HTS40
F13 12K
[∓45/90/0/±45/0/
90/∓45/90/0/∓45/0/
90/±45/90/0/∓45/0/90] s
[]
These five case studies are selected to cover the two main objectives of this paper. Case study #1 is used to assess the influence of projectile modeling techniques on contact force response and the effect of hourglass control algorithms on the artificial energy of CSEs. Case studies #2 to #5, with identical length and width, are used to investigate the applicable thickness limit of CSEs in LVI modeling of composite laminates. Note that the impact properties in Table 2, including projectile velocities, kinetic energy, and projectile diameter, are obtained directly from the experimental literature cited in the reference column. In all case studies, the deformable projectile is modeled as an isotropic, linear elastic material with an elastic modulus of 210 GPa and Poisson’s ratio of 0.3, representative of steel. While the kinetic energy of case studies #1, #4, and #5 is around 35 J, the corresponding impact velocities are still below 10 m/s, consistent with our definition for LVI in Section 1.1. Note that there is no universally accepted classification of low-, intermediate-, and high-velocity impact in the literature (see, for example, [,,,]); however, this paper follows the commonly used definition for LVI as events with velocities less than 10 m/s. Furthermore, the kinetic energies of these case studies fall within the range (20–70 J) frequently reported as LVI in the literature [,,,,]. The corresponding material properties for case study #1 are listed in Table A1, for case studies #2, #4, and #5 in Table A2, and for case study #3 in Table A3; all tables are provided in Appendix C. The diversity in impact energy, stacking sequence, and thickness provides a comprehensive assessment of the predictive accuracy and limitations of CSEs in LVI modeling of composite laminates.

2.2. Finite Element Analysis: Preprocessing

2.2.1. Projectile Modeling Techniques

Abaqus offers multiple projectile modeling techniques, each providing different levels of control over geometry (solid or shell), mesh generation, element type (rigid, solid, or shell), and the extent of deformation (rigid or deformable). In this paper, we evaluate four distinct projectile modeling techniques to assess their impact on solution accuracy and behavior. These techniques are illustrated in Figure 2 and include (a) analytical rigid, (b) discrete rigid, (c) rigid body constraint (RBC), and (d) deformable. The first three techniques model the projectile as a rigid body, assuming the projectile deformation is negligible compared to the composite laminate. In contrast, the deformable technique allows for the realistic modeling of projectile deformation by assigning material properties, making it suitable for impact. The following provides a brief overview of these four projectile modeling techniques in Abaqus.
Figure 2. Different projectile modeling techniques used in this paper. (a) Analytical rigid: (I) geometry and (II) meshed configuration. (b) Discrete rigid: (I) geometry. Meshed configuration with (II) free and (III) sweep mesh control. (c) (I) RBC-solid and (II) RBC-solid meshed configuration. (III) RBC-shell geometry. RBC-shell meshed configuration with (IV) free and (V) sweep mesh control. (d) Deformable: (I) geometry and (II) meshed configuration.
a.
Analytical rigid—This technique requires minimal user input, where the projectile is modeled as a shell, representing the geometry with an associated reference point (RP), as illustrated in Figure 2a(I). In this technique, the user does not explicitly assign the mesh; instead, the element type is internally handled by Abaqus, as shown in Figure 2a(II). All the projectile attributes, e.g., velocity and boundary conditions, are linked to RP.
b.
Discrete rigid—Similar to the analytical rigid, the geometry consists of a shell and an RP, as shown in Figure 2b(I). However, the discrete rigid provides more flexibility over the analytical, particularly in element type and mesh control. The projectile can be meshed as free, as shown in Figure 2b(II), or sweep, as shown in Figure 2b(III), using R3D4 elements, which are three-dimensional rigid elements with four nodes. These options are provided to accommodate meshing various geometric complexities. Free mesh is intended for irregular geometries, while sweep mesh is suitable for regular geometries.
c.
RBC—In this technique, depending on the specific requirements of the numerical model, the projectile geometry can be modeled as a solid, see Figure 2c(I), or a shell, see Figure 2c(III). In this paper, the former is referred to as RBC-solid and the latter as RBC-shell. In this technique, the rigidity is applied through a rigid body constraint in the interaction module of Abaqus by transforming the existing geometry (or part) into a rigid body, where its behavior and DOF are attributed to an RP. Element type can vary depending on the geometry. In this paper, the C3D8R element—an 8-node hexahedral element with full reduced formulation—is chosen for the RBC-solid projectile with solid geometry, and the S4R element is selected for the RBC-shell projectile with shell geometry []. The meshed configuration for RBC-solid is shown in Figure 2c(II), while the RBC-shell projectiles with free and sweep mesh controls are illustrated in Figure 2c(IV) and Figure 2c(V), respectively. RBC is a more flexible alternative to the discrete rigid projectile. The RBC projectile offers more control over the complex geometry, mesh control, and element type, making it a quicker and convenient option for projectile modeling.
d.
Deformable—This technique realistically models the projectile as deformable by using a solid geometry, as illustrated in Figure 2d(I), and assigning material properties, making it suitable for dynamic analysis. The C3D8R element is selected for the deformable projectile in this paper []. The meshed configuration is shown in Figure 2d(II).
A summary comparison of these projectiles’ key characteristics is provided in Table 3 The table highlights the variation geometry definition, element type, mesh control, deformability, and level of user control over modeling flexibility. While some of these projectile modeling techniques share similar features, such as element type, they differ in terms of modeling complexity and the accuracy with which they capture contact interactions. In this paper, all four projectiles are systematically compared to examine their effect on the contact force response and compatibility with different contact algorithms.
Table 3. Summary of the key characteristics of different projectile modeling techniques used in this paper (* reference point).

2.2.2. Damage Model, Contact Definition, and Solver

Damage initiation is governed by the Hashin failure criterion [], and damage evolution follows CDM proposed in []. This damage model only captures intralaminar damage, i.e., damage to the fiber and matrix within layers and does not account for interlaminar damage, i.e., delamination. To avoid numerical instabilities during damage evolution, a maximum degradation level of 0.98 is applied, meaning that the elements are deleted once their stiffness reaches 0.2% of the undamaged state. This damage model is discussed in detail in Appendix B.
The contact behavior is defined as hard contact, in which the surface interactions are applied through a contact–overclosure relationship that transmits contact pressure when surfaces are in contact and separates when the contact pressure becomes zero. The hard contact minimizes the penetration of the composite laminate surface into the projectile, allowing for separation without resistance, which is critical for accurately modeling hard-body impact where the projectile and composite laminate do not adhere to each other [].
Contact interactions are modeled using two methods: (I) contact pairs, with either a kinematic or penalty contact algorithm, and (II) general contact, which defaults to the penalty contact algorithm. Contact pairs require prior knowledge of the contact surfaces, as the user must explicitly define potential contact surfaces. Using the contact pairs could increase the risk of missing unintended contact if the contact surfaces are not defined. In contrast, general contact automatically detects and manages all potential contact surfaces within the model, reducing the likelihood of missing contact definitions. This makes general contact suitable for complex models or when the contact surfaces are not known in advance. In both methods, contact discretization is set to surface-to-surface to provide improved accuracy over the node-to-surface, especially under large deformations []. The surface-to-surface formulation ensures that contact is enforced across the element surface, rather than at the discrete nodal points []. Contact tracking is set to finite sliding, allowing for continuous change in contact status between contact surfaces and accommodating large translations and rotations [,]. A more detailed discussion between the contact algorithms is provided in Section 3.3.
All FEAs are conducted using Abaqus/Explicit, which is well suited for highly nonlinear and transient problems, such as LVI []. Unlike the Abaqus/Implicit, Abaqus/Explicit does not perform an iterative convergence check at each time increment. Instead, it uses an explicit time integration scheme, enabling it to handle problems involving complex contact interactions with large deformations and material failure [].

2.2.3. Boundary Conditions

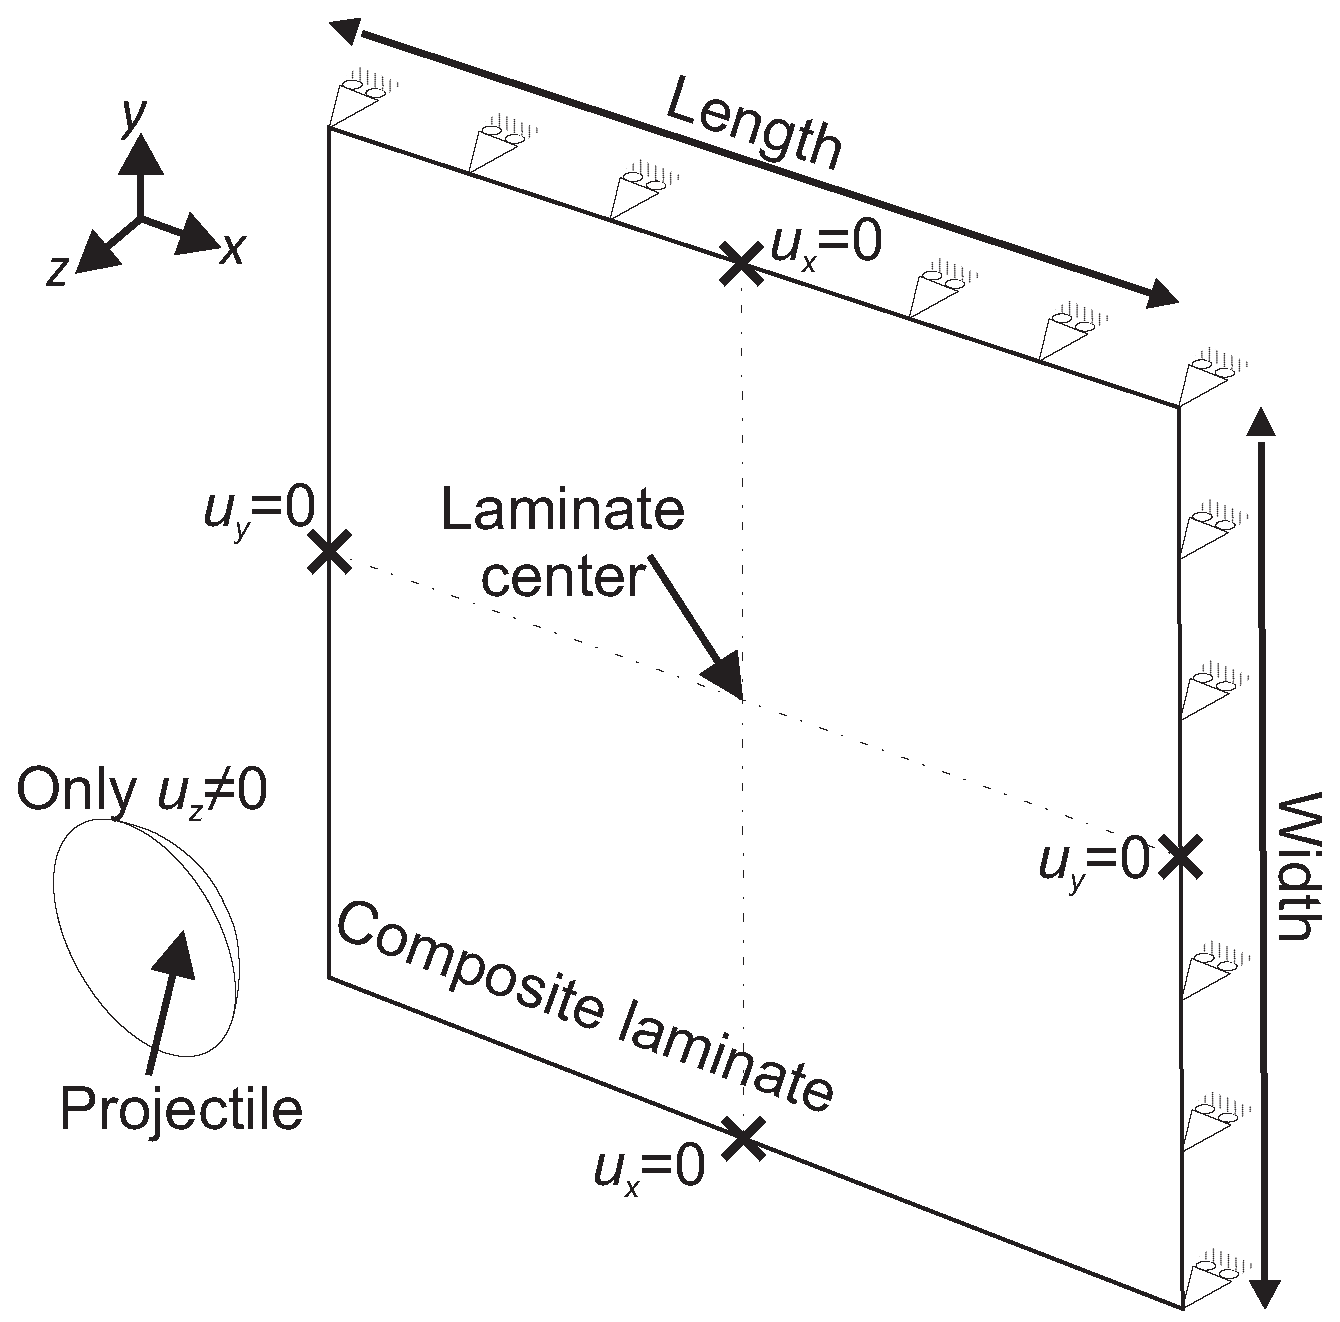
Figure 3 illustrates the coordinate system and boundary conditions adopted for the projectile and composite laminate for all case studies (see Table 2) in this paper. The projectile is only allowed to move normal to the composite laminate in the z-direction, similar to the drop-weight impact test. The laminate is constrained along its edges in the z-direction. To suppress the rigid body motion of the composite laminate, displacement, u, is further constrained: (I) in the y-direction on the middle of the vertical edges ( u y = 0) and (II) in the x-direction on the middle of the horizontal edges ( u x = 0). This boundary condition enables the composite laminate to deform freely at the edges without acting overstiff [,]. Furthermore, it minimizes the Poisson’s effect—the coupling between strain components whereby a deformation in one direction causes lateral deformations []—by allowing the laminate to expand and contract freely at the edges, which is essential for accurately modeling the impact of highly anisotropic materials, such as composite laminates [,]. Note that in all the analyses in this paper, the x-axis is the principal axis with respect to which the fibers are oriented.
Figure 3. Schematic of the coordinate system, projectile, composite laminate, and boundary conditions. u is the displacement, and subscripts x, y, and z represent the directions of the coordinate system.

2.3. A Three-Criteria Mesh Convergence Study for Conventional Shell Elements

A mesh convergence study is necessary to ensure accurate and reliable FEA results. In this study, we conduct a mesh convergence analysis only for the case involving a composite laminate with a deformable projectile. The case is selected as the reference because it involves meshing both the laminate and projectile and represents the most physically realistic scenario for an impact event []. The mesh convergence results from this case are subsequently applied to other projectile modeling techniques described in Section 2.2.1. This study considers three criteria for mesh convergence: (I) the out-of-plane contact force (or contact force), (II) the out-of-plane displacement (or displacement), and (III) the stress. The first two criteria are commonly used in the literature [,] and typically exhibit convergence as the element size reduces. However, stress convergence requires a more rigorous approach due to the complexity of localized deformation, regions of high stress gradient—particularly on the impacted side and laminate back face—as well as the influence of stress prediction on the accuracy of damage initiation and evolution. The mesh convergence study is detailed below.
The contact force is extracted directly from the contact interaction between the projectile and composite laminate, representing the resultant force from the contact pressure distributed over the projectile–laminate interaction area. The out-of-plane displacement is obtained in the z-direction at the laminate center (see Figure 3), representing the maximum deflection of the laminate during impact. A stress convergence study is conducted at the laminate back face rather than the impacted side. This is due to the highly nonlinear and localized deformation at the impacted side, which complicates the convergence. A schematic of the projectile and a five-layer composite laminate, as well as the definition of the impacted side and laminate back face, is illustrated in Figure 4a. Note that the five-layer laminate shown in Figure 4 is only a schematic to explain the modeling approach, mesh convergence study, and section points distribution and does not represent the actual laminate used in the analyses. In this paper, the mesh convergence study comprises two steps:
Step 1: In-plane element size—This step focuses on the determination of the in-plane element size for the composite laminate, as illustrated in Figure 4b. The in-plane element size refers to the element size used to discretize the geometry of the composite laminate. This step is a common step for all three convergence criteria: contact force, displacement, and stress.
Step 2: Number of section points—This step specifically addresses the stress convergence by determining the optimal number of through-the-thickness section points within each layer. The section points are used to predict the stress variation through the laminate thickness, as indicated by crosses (×) in Figure 4c. This step is crucial for the stress mesh convergence, as the stress is a localized phenomenon that depends on accurately capturing through-the-thickness behavior rather than overall laminate response.
Figure 4. (a) Schematic of a five-layer composite laminate subjected to LVI. (b) Illustration of the area of interest for the stress convergence. (c) The finite element model of a five-layer composite laminate modeled using CSEs (S4R element) with five section points (×) per layer.
Step 1: In-plane element size. The first step of mesh convergence study begins with a relatively coarse mesh, e.g., 0.6 mm, selected to ensure the difference between the averaged and nonaveraged stress components remains below 5%. Although no universally accepted limit exists, a 5% error margin serves as the initial in-plane element size for all three mesh criteria, providing a balance between computational efficiency and accuracy. While contact force is extracted from the contact interaction area between the projectile and composite laminate, and the displacement is obtained from the laminate center, the stress convergence is confined to a square area located at the laminate center with a length of three times the projectile radius, r, as indicated in Figure 4b. This square area is sufficiently large to capture the localized stress while remaining far enough from the boundary conditions [,]. Within this square area, nonaveraged maximum tensile and compressive stress components are extracted from the bottommost section point at the laminate back face, as shown in Figure 4c. The extracted values for each of the three mesh convergence criteria are then used to calculate the approximated error according to Equation (1) [].
Approximated error [ % ] = A ( k + 1 ) A ( k ) A ( k + 1 ) × 100
where A represents one of the mesh convergence criteria: contact force, displacement, or the stress components, i.e., σ 11 , σ 12 , and σ 22 . A ( k ) is the value of the mesh convergence criterion at mesh refinement level k, and A ( k + 1 ) corresponds to the same criterion at the next mesh refinement level. For instance, if two in-plane element sizes are considered, e l = 0.6 mm and e l = 0.4 mm, then k = 1 refers to the coarser mesh e l = 0.6 mm and k + 1 = 2 denotes the finer mesh e l = 0.4 mm.
During the first step, the number of section points is kept constant at five per layer (see Figure 4c), recommended for nonlinear analysis []. The approximated error is then checked between subsequent mesh refinement levels and the in-plane element size with the smallest or a reasonable error is selected for the composite laminate. The projectile is meshed with a relatively coarser element size, as recommended [], i.e., 0.8 mm. This element size is sufficient for this study, as the focus is on the composite laminate response rather than the projectile. A smaller element size is typically used where the projectile behavior is of interest []. Overall, conducting the mesh convergence study on contact force, displacement, and stress provides a comprehensive approach to determine the in-plane element size of the composite laminate.
Step 2: Number of section points. The second step is specific to stress convergence studies, where the number of section points through the laminate thickness per layer is determined. Figure 4c illustrates the FE representation of a five-layer composite laminate using CSEs, specifically the S4R element. This model consists of a surface representing the geometry of the composite laminate, with each layer containing section points. An example with five section points per layer is shown in Figure 4c. These points are used to determine the stress variation through the thickness of each layer, with the topmost and bottommost section points corresponding to the impacted side and laminate back face, respectively. Abaqus recommends three section points for linear analysis, five for nonlinear analyses, and nine for highly nonlinear analyses []. Although recommended for isotropic materials, these values can be adopted as a starting point for composite laminates. Throughout this step of stress mesh convergence, the number of section points is varied among three, five, and nine, while the in-plane element size obtained in the first step is kept constant. The approximated error is computed using Equation (1), where k now refers to each increment in the number of section points per layer (i.e., from three to five to nine section points). The two-step stress convergence study to determine the in-plane element size and the number of section points provides a thorough and systematic approach to verify the accuracy of FEA using CSEs. This is particularly important in energy history plots and predicting the initiation and evolution of damage.

2.4. Hourglass Control

First-order elements are generally preferred for contact problems, as they produce consistent equivalent force direction under pressure. Second-order elements, however, can lead to nonphysical results in contact problems. The second-order elements, due to their FEM implementation, can lead to inconsistent equivalent force directions at nodes under uniform pressure. For instance, under uniform pressure, the corner nodes experience forces in the opposite direction of the pressure (positive z-direction) []. This is illustrated for a second-order shell element in Figure 5a. The force direction at corner nodes violates the nature of contact, where pressure should always act to compress the interacting surfaces. This inconsistent equivalent force direction in the second-order elements complicates the detection of nodes involved in clearance or overclosure, compromising solution accuracy. First-order elements, however, result in a consistent equivalent force direction, with all nodes experiencing forces in the direction of the pressure (negative z-direction), aligning with the physics of the contact. This is illustrated for a first-order shell element in Figure 5b.
Figure 5. (a) Schematic of equivalent nodal force due to a uniform pressure, p (applied in the negative z-direction) over the area of element, A for a second-order shell element. (b) Schematic of equivalent nodal force due to a uniform pressure, p over the area of element, A for a first-order shell element. (c) Illustration of hourglass mode (adapted from []).
A major drawback of the first-order elements with reduced integration formulation, such as S4R, is the hourglass mode—a nonphysical deformation mode that results in no strain—as illustrated in Figure 5c. During hourglass, the length of the horizontal and vertical lines intersecting the center of the element and their angle remains unchanged. Consequently, no strain is detected at the integration point. Hourglass mode is often referred to as the zero-energy mode, as it does not generate strain energy and can lead to spurious deformation in elements and numerical instabilities []. Hence, hourglass control algorithms are developed to suppress this nonphysical deformation mode. Hourglassing can be amplified during contact problems due to severe deformation of elements, manifesting as unrealistic deformation, spikes in the energy history, or solution divergence, and even termination. Abaqus offers several hourglass control algorithms, including relax stiffness, pure stiffness, and enhanced. Although all three algorithms are stiffness-based, they differ in their implementation and method. While the first two algorithms use user-defined stiffness coefficients to resist the hourglass mode, the enhanced algorithm automatically computes these coefficients from element formulation to control hourglassing during sudden dynamic loads, such as impact. A comprehensive review of these algorithms is provided in [].
In Abaqus/Explicit, artificial energy due to hourglassing is tracked using the artificial energy variable. To ensure solution accuracy, it is recommended that the artificial energy-to-internal energy ratio remains below 1% []. Exceeding this limit may indicate nonphysical behavior due to excessive hourglassing. Therefore, a comparative study of hourglass control algorithms in Abaqus is conducted in this paper to assess their influence on the artificial energy-to-internal energy ratio. This comparison aims to quantify the range within which CSE can reliably predict impact behavior by assessing the agreement with the experimental results.

2.5. Applicable Thickness Range of Conventional Shell Elements

While the majority of composite laminates in engineering structures are relatively thin, certain structures—particularly aerospace and pressure vessels—are thick, with thicknesses reaching up to 30 mm [,]. Thick composites are often used where high load-carrying capacity, stiffness, and limited design space are essential []. Examples include the inner wing spar and the central wing box of an aircraft []. Furthermore, from a numerical perspective, analyzing thick composite laminates with solid elements can be challenging due to the notable increase in the problem size []. CSEs in Abaqus offer a potential alternative, as they can be used to model thick laminates with a reasonably reduced number of DOF while still capturing key impact response, e.g., maximum contact force or displacement, though CSEs’ ability to represent interlaminar damage is limited.
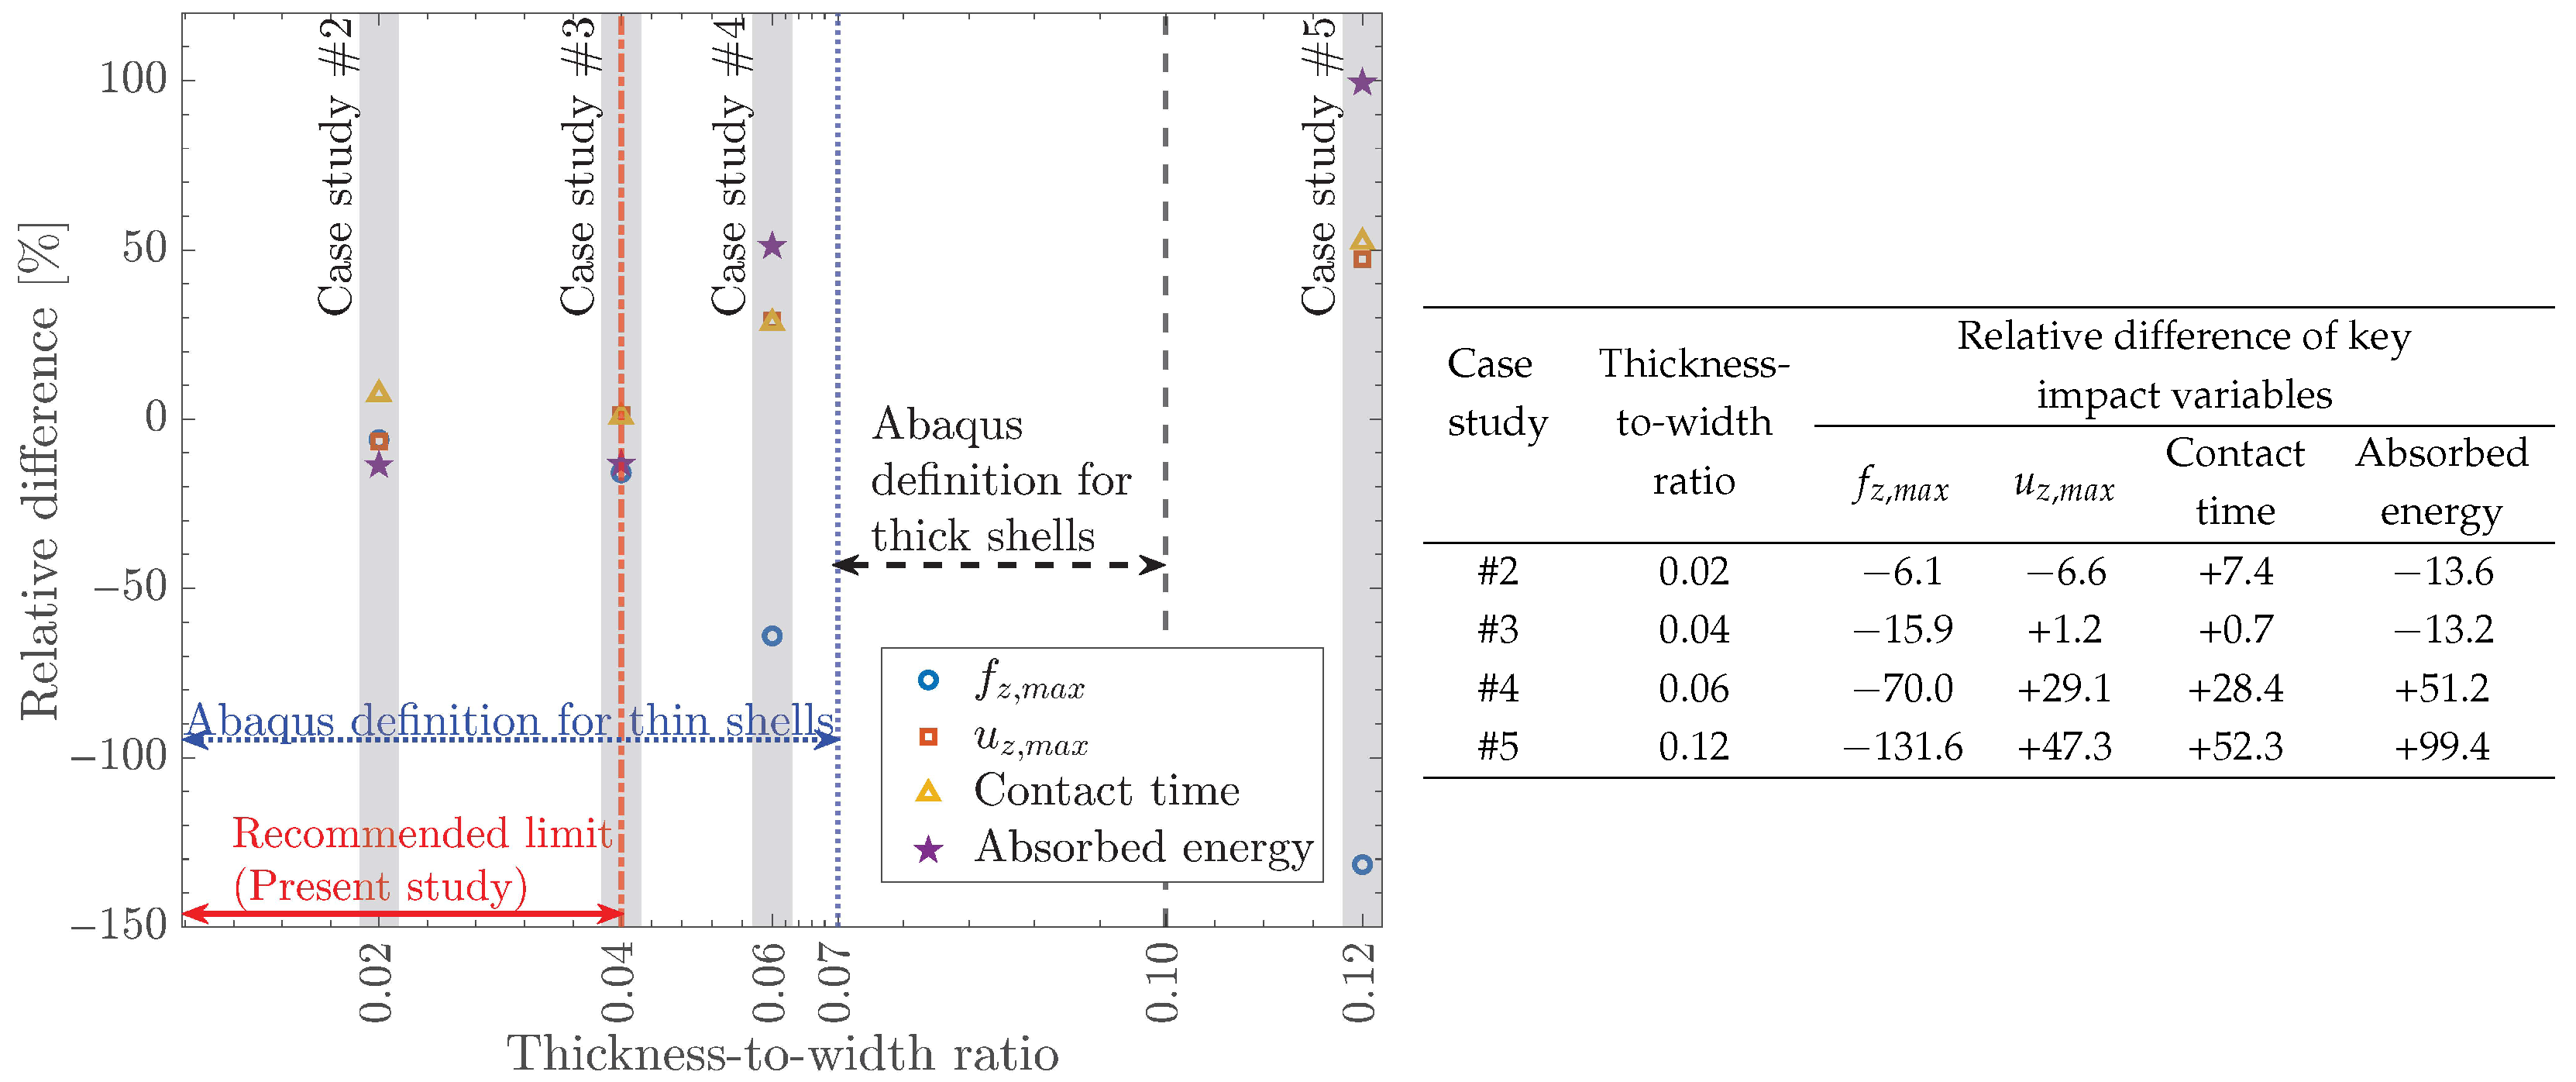
Abaqus provides a general guideline for distinguishing between thin and thick shells based on the thickness-to-width ratio, in which a shell is generally considered thin if its thickness-to-width ratio is below 1/15 (approximately 0.07) and thick if this ratio is between 1/15 and 1/10 []. Although these guidelines are intended for isotropic materials [], they serve as a useful approximation to determine the applicable thickness range of CSEs for LVI of composite laminates. To determine this thickness range in this paper, four key impact response variables from numerical analyses are compared against the experimental results from case studies #2 to #5 in Table 2 These variables include the maximum contact force and displacement, contact time, and absorbed energy [,]. Laminates with four thicknesses, 2 mm, 4.46 mm, 6 mm, and 12 mm, and exact width (100 mm) and length (150 mm) are selected to represent a broad range of typical structural applications. To quantify the findings across various thicknesses, each laminate thickness is normalized by its width. This results in a dimensionless thickness-to-width ratio, which provides a consistent basis for comparing the aforementioned key impact variables across these laminates.

3. Results and Discussion

3.1. Mesh Convergence Study

This section presents the results from the previously proposed mesh convergence study in Section 2.3. While the proposed mesh convergence study is applicable to all cases listed in Table 2, the results are provided for a representative case (case study #1) to illustrate its effectiveness. A comprehensive summary of mesh convergence results for all cases is presented in Table 5. Note that in this study, the frequency of recorded data points for each mesh convergence criterion is adopted based on the storage requirement and computational feasibility. For all the case studies in Table 2, contact force and displacement are output at 200 evenly spaced time increments, while the stress is output at only 20 evenly spaced time increments throughout the whole analysis. The relatively higher frequency of recorded contact force and displacement data points is feasible because the contact force is extracted directly from the contact interaction between the projectile and composite laminate and the displacement is recorded at the laminate center—both generating small output files. In contrast, the stress output frequency is limited, as the Abaqus/Explicit uses extremely small time increments, typically in the range of 10 7 10 10 s, to proceed with the solution and avoid numerical instabilities []. Consequently, continuous stress output for all elements, each with multiple section points, at each time increment results in prohibitively large files, making post-processing impractical. Therefore, a 20 evenly spaced increment for the stress values is adopted in this study, generating sufficient results for the stress convergence study while maintaining the file sizes manageable.

3.1.1. Contact Force and Displacement Convergence

Figure 6 shows mesh convergence for the out-of-plane contact force, f z , across different in-plane element sizes, e l . The experimental contact force response from [] is also provided for reference. The experimental contact force response exhibits three distinct stages: (I) 0–1 ms: initial contact and an approximately linear increase, (II) 1–2.6 ms: a plateau with oscillations, and (III) 2.6–5.4 ms: a gradual oscillatory decrease. Each stage presents distinct convergence behavior, offering insights into the effect of in-plane element size on the contact force response. During stage (I), all in-plane element sizes exhibit an approximated error below 2%. This indicates that the linear contact force response is governed primarily by the global structural response rather than localized effects, such as stiffness degradation []. A sharp spike at approximately 1 ms is also observed for the coarsest— e l = 0.6 mm and e l = 0.4 mm—and finest— e l = 0.25 mm and e l = 0.2 mm—in-plane element sizes, suggesting the occurrence of a phenomenon associated with the transition from stage (I) to (II). Towards the end of stage (I) and in stage (II), the approximated error escalates remarkably, with a notable jump between e l = 0.6 mm and e l = 0.4 mm, where the approximated error increases to approximately 15%. The approximated error, for the smaller in-plane element sizes, remains below 10%, indicating improved convergence, although a clear monotonic reduction in approximated error cannot be observed. Stage (III) proves to be the most challenging for mesh convergence. The approximated error for the largest element sizes— e l = 0.6 mm and e l = 0.4 mm—exhibits a drastic growth, reaching up to 1200% towards the end of the analysis. Note that the very large approximated error is not caused by the large mismatch in the contact force but rather due to the separation of projectile and composite laminate, causing the contact force values to approach zero. Hence, this amplification in the approximated error in Equation (1) is a numerical artifact and does not represent an absence of convergence in the contact force. Overall, decreasing the in-plane element size beyond e l = 0.4 mm negligibly decreases the approximated error, indicating that e l = 0.4 mm is sufficient for contact force convergence.
Figure 6. Out-of-plane contact force mesh convergence study for different in-plane element sizes, e l . Results correspond to case study #1 in Table 2 using a deformable projectile with an element size of 0.8 mm, kinematic contact algorithm, relax stiffness hourglass algorithm, and five section points per layer [].
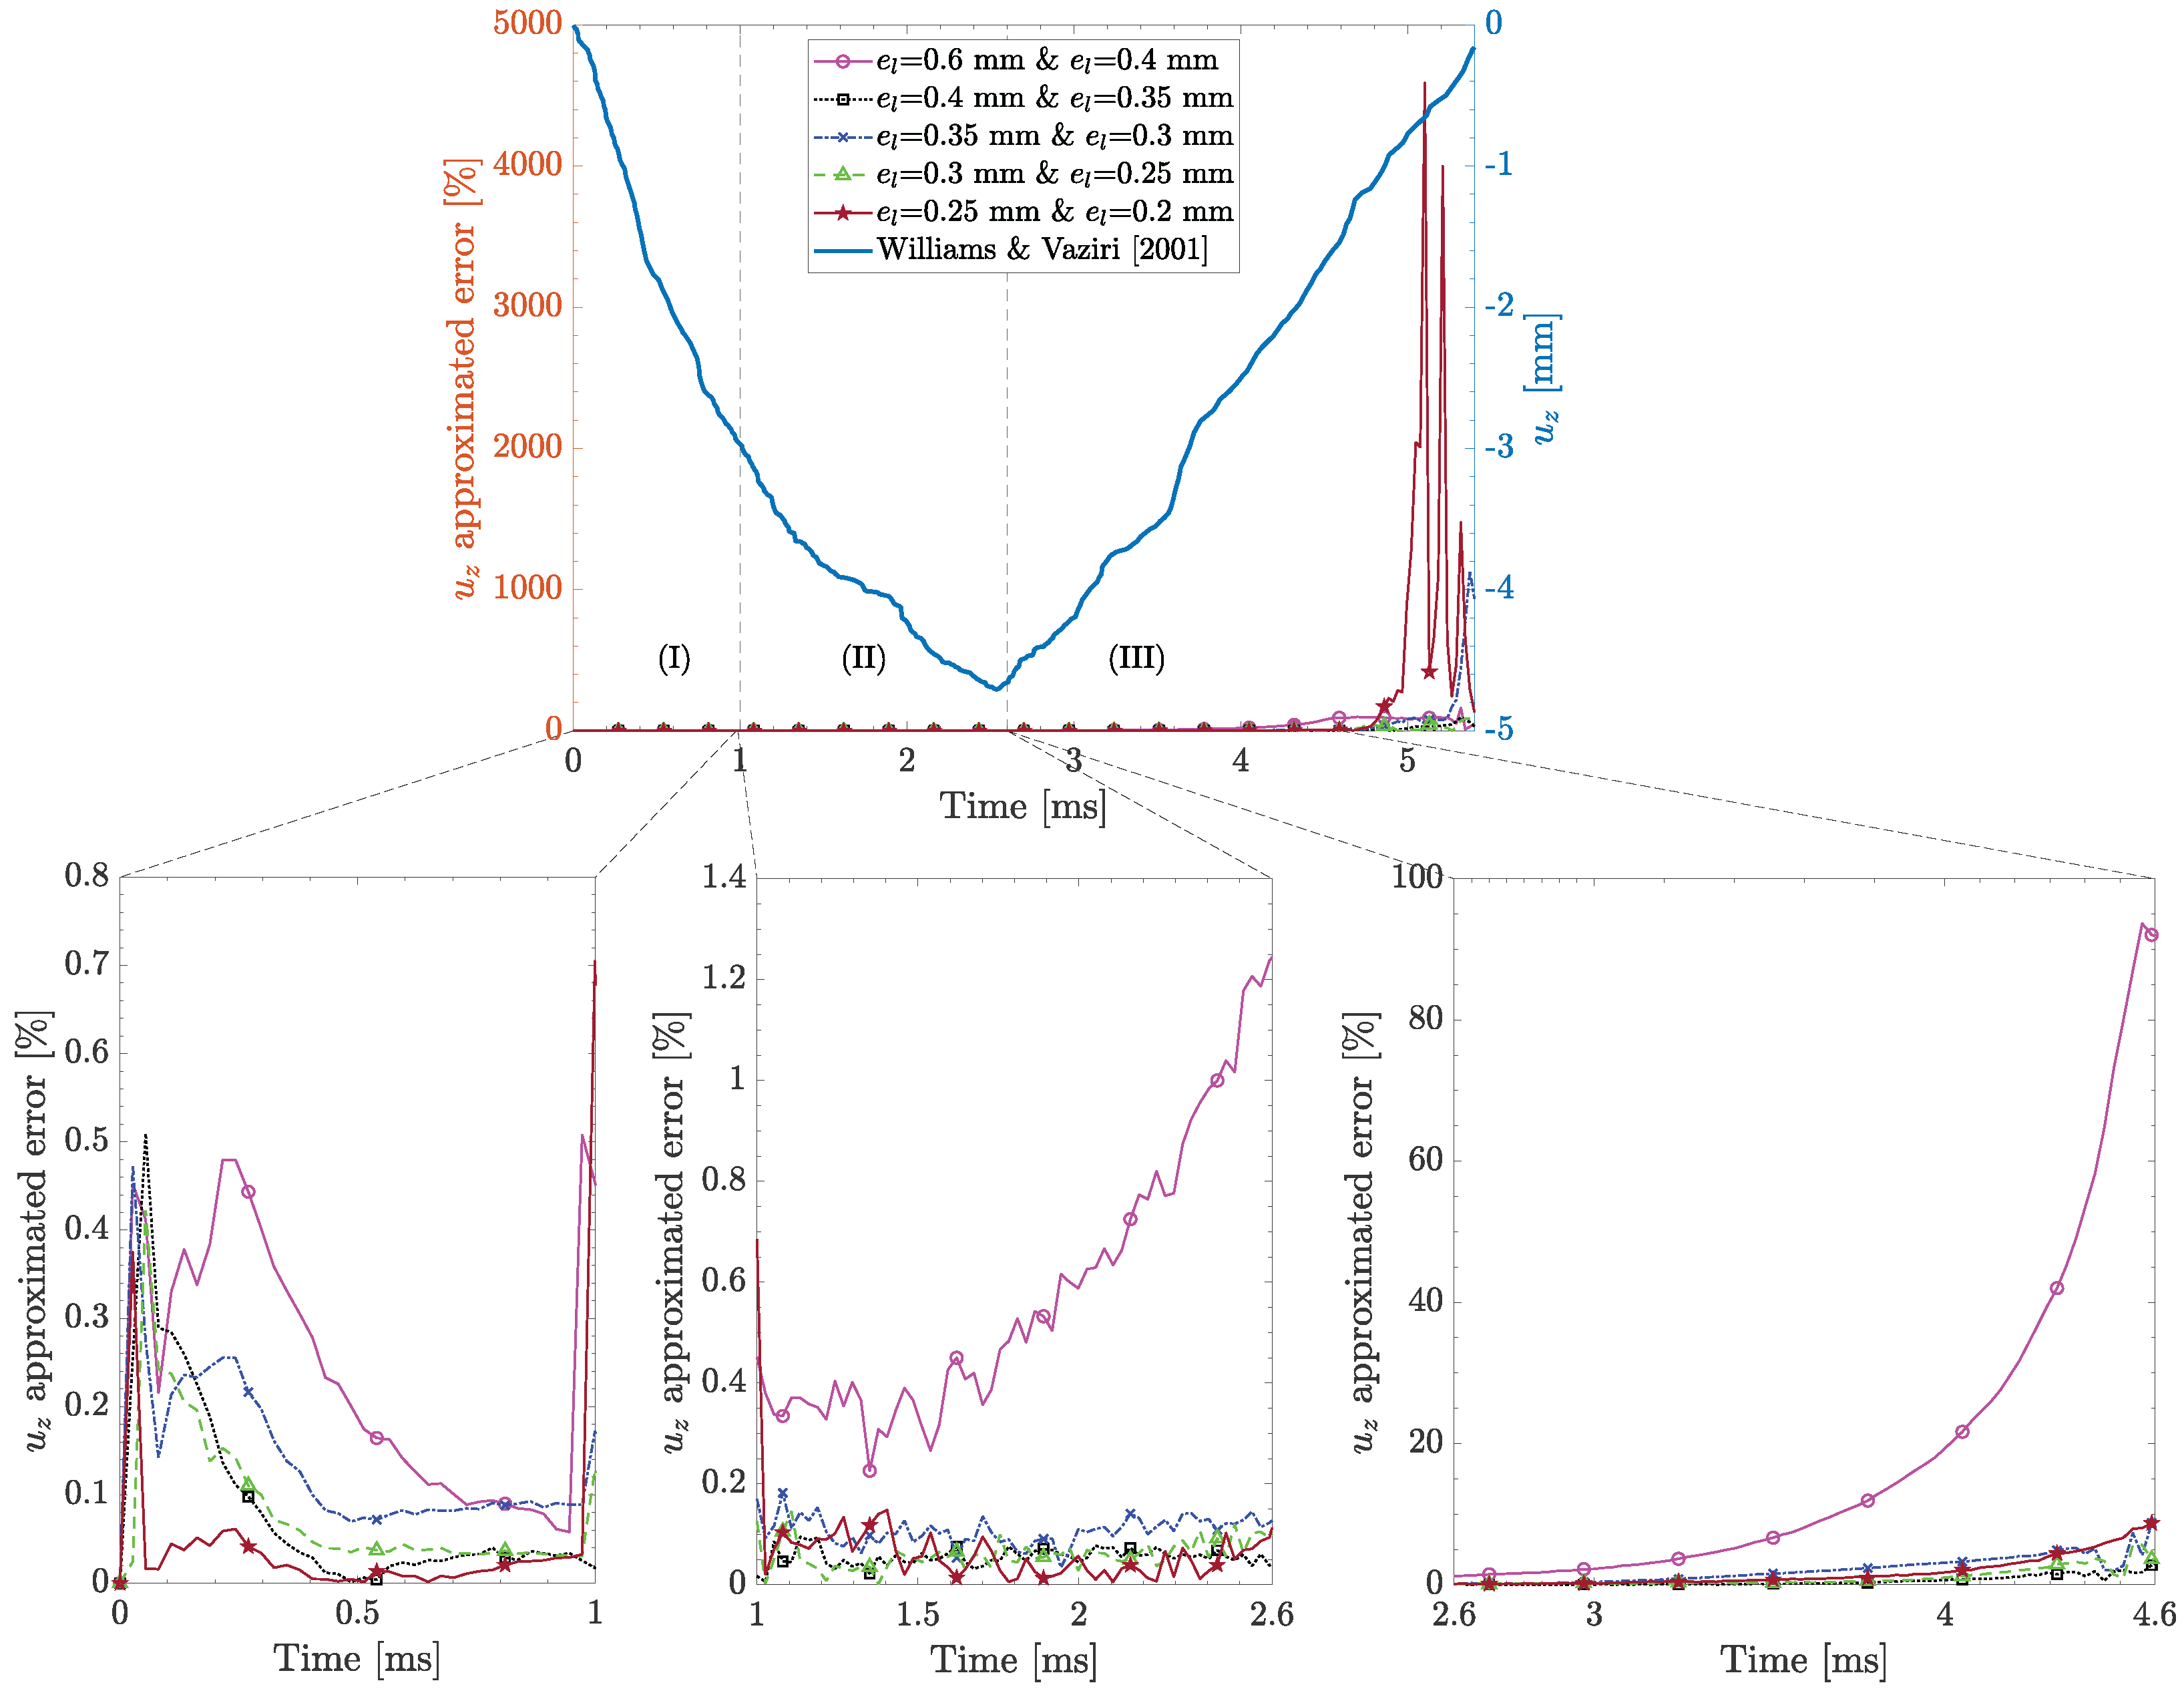
Figure 7 shows the out-of-plane displacement, u z , at the laminate center for the exact range of in-plane element sizes, together with the experimental result from []. A similar trend to contact force convergence can be recognized. During stage (I), the approximated error for all the in-plane element size remains below 1%. Similar to the contact force convergence (see Figure 6), a sharp spike at around 1 ms for the exact in-plane element sizes is observed, although its value remains below 0.8%. The largest in-plane element sizes— e l = 0.6 mm and e l = 0.4 mm—exhibit a gradual increase in the approximated error during stage (II), though it remains below 1.3%. For the smaller in-plane element sizes, the approximated error remains below 0.2%. Notable discrepancies occur during stage (III). For e l = 0.6 mm and e l = 0.4 mm, the approximated error monotonically increases up to approximately 100%, while it remains below 10% for the smaller in-plane element sizes. An abrupt increase in the approximated error is also observed for the smallest in-plane element sizes— e l = 0.25 mm and e l = 0.2 mm—after approximately 4.6 ms. Note that this abrupt increase is not caused by the absolute deviation in displacements but rather by the extremely small displacement values between e l = 0.25 mm and e l = 0.2 mm. Consequently, even a moderate absolute difference in Equation (1) results in a disproportionately large error, reflected as spikes seen in Figure 7. Overall, reducing the in-plane element size beyond e l = 0.4 mm results in negligible improvement in the approximated error, confirming that e l = 0.4 mm is an appropriate in-plane element size for displacement convergence.
Figure 7. Out-of-plane displacement mesh convergence study at laminate center for different in-plane element sizes, e l . Results correspond to case study #1 in Table 2 using a deformable projectile with an element size of 0.8 mm, kinematic contact algorithm, relax stiffness hourglass algorithm, and five section points per layer [].

3.1.2. Stress Convergence: In-Plane Element Size

Figure 8a shows mesh convergence for the maximum nonaveraged in-plane longitudinal stress, σ 11 , m a x , at the bottommost section point at the laminate back face across the investigated element sizes. The nonaveraged stress refers to stress values computed at the integration points, without averaging them across adjacent elements that share a node []. Nonaveraged stress represents the element-level variation of stress, making it suitable for mesh convergence studies. The approximated error between e l = 0.6 mm and e l = 0.4 mm reveals notably higher values throughout the analysis compared to other smaller in-plane element sizes, with a peak reaching 90% toward the end of the analysis. During stages (I) and (II), the approximated error remains below 10% for most of the in-plane element sizes. However, the approximated error increases in stage (III), escalating to 20–25%. The mesh convergence for the minimum nonaveraged in-plane longitudinal stress, σ 11 , m i n , at the exact location is shown in Figure 8b. The comparison between e l = 0.6 mm and e l = 0.4 mm reveals a substantially higher approximated error, with a peak between 70 and 95% for the majority of the analysis. For smaller in-plane element sizes, e.g., e l = 0.4 mm and e l = 0.35 mm, σ 11 , m i n has several notable characteristics that distinguish it from σ 11 , m a x . During stages (I) and (II), the approximated error remains below 20%. A distinctive spike around 1 ms can be observed across all in-plane element sizes, although the mesh refinement gradually reduces this spike. This spike is also pronounced in the smallest element sizes, e l = 0.25 mm and e l = 0.2 mm, indicating persistent challenges in capturing localized stress. Similar to Figure 8a, the mesh convergence for σ 11 , m i n becomes challenging during stage (III), with the approximated error decreasing to approximately 45% throughout the analysis for the smallest element sizes.
Figure 8. Approximated error of nonaveraged in-plane longitudinal stress, σ 11 , at the bottommost section point at the laminate back face for different in-plane element sizes. Results correspond to case study #1 in Table 2 using a deformable projectile with an element size of 0.8 mm, kinematic contact algorithm, relax stiffness hourglass algorithm, and five section points per layer.
Figure 9 shows mesh convergence for the maximum nonaveraged in-plane transverse stress σ 22 , m a x , at the bottommost section point at the laminate back face for different in-plane element sizes. Overall, the convergence exhibits a similar behavior to maximum σ 11 , m a x in Figure 8a. The approximated error remains below 10% during stages (I) and (II) for all element sizes and stays below 20% during stage (III) for the smallest element sizes, i.e., e l = 0.25 mm and e l = 0.2 mm. Figure 9b shows the mesh convergence for the minimum nonaveraged in-plane transverse stress, σ 22 , m i n , at the exact location. σ 22 , m i n exhibits pronounced spikes—especially during stage (III)—in comparison to σ 22 , m a x , with peaks reaching up to 350% and 300% for the intermediate element sizes, i.e., e l = 0.4 mm and e l = 0.35 mm, and e l = 0.35 and e l = 0.3 mm. Despite these peaks, the overall convergence remains ambiguous, as the approximated error does not consistently reduce with decreasing in-plane element sizes. This makes it difficult to identify a clear trend for the mesh convergence of σ 22 , m i n .
Figure 9. Approximated error of nonaveraged in-plane transverse stress, σ 22 , at the bottommost section point at the laminate back face for different in-plane element sizes. Results correspond to case study #1 in Table 2 using a deformable projectile with an element size of 0.8 mm, kinematic contact algorithm, relax stiffness hourglass algorithm, and five section points per layer.
The mesh convergence for the maximum nonaveraged in-plane shear stress, σ 12 , m a x , at the bottommost section point at the laminate back face is shown in Figure 10a. During stages (I) and (II), the approximated error remains below 20% for in-plane element sizes smaller than 0.4 mm. The approximated error falls below 15% for the smallest element sizes, i.e., e l = 0.25 mm and e l = 0.2 mm. However, during stage (III), σ 12 , m a x exhibits more pronounced spikes in the approximated error, with values fluctuating between 20% and 80%, irrespective of the in-plane element size. Figure 10b shows mesh convergence for the minimum nonaveraged in-plane shear stress, σ 12 , m i n , at the exact location. In general, during stages (I) and (II), the approximated error remains below 10% for in-plane element sizes smaller than 0.4 mm. Nevertheless, it is difficult to observe a reduction in the approximated error as the in-plane element size decreases. In stage (III), the σ 12 , m i n approximated error becomes increasingly spiky, although it remains below 40%.
Figure 10. Approximated error of nonaveraged in-plane shear stress, σ 12 , at the bottommost section point at the laminate back face for different in-plane element sizes. Results correspond to case study #1 in Table 2 using a deformable projectile with an element size of 0.8 mm, kinematic contact algorithm, relax stiffness hourglass algorithm, and five section points per layer.
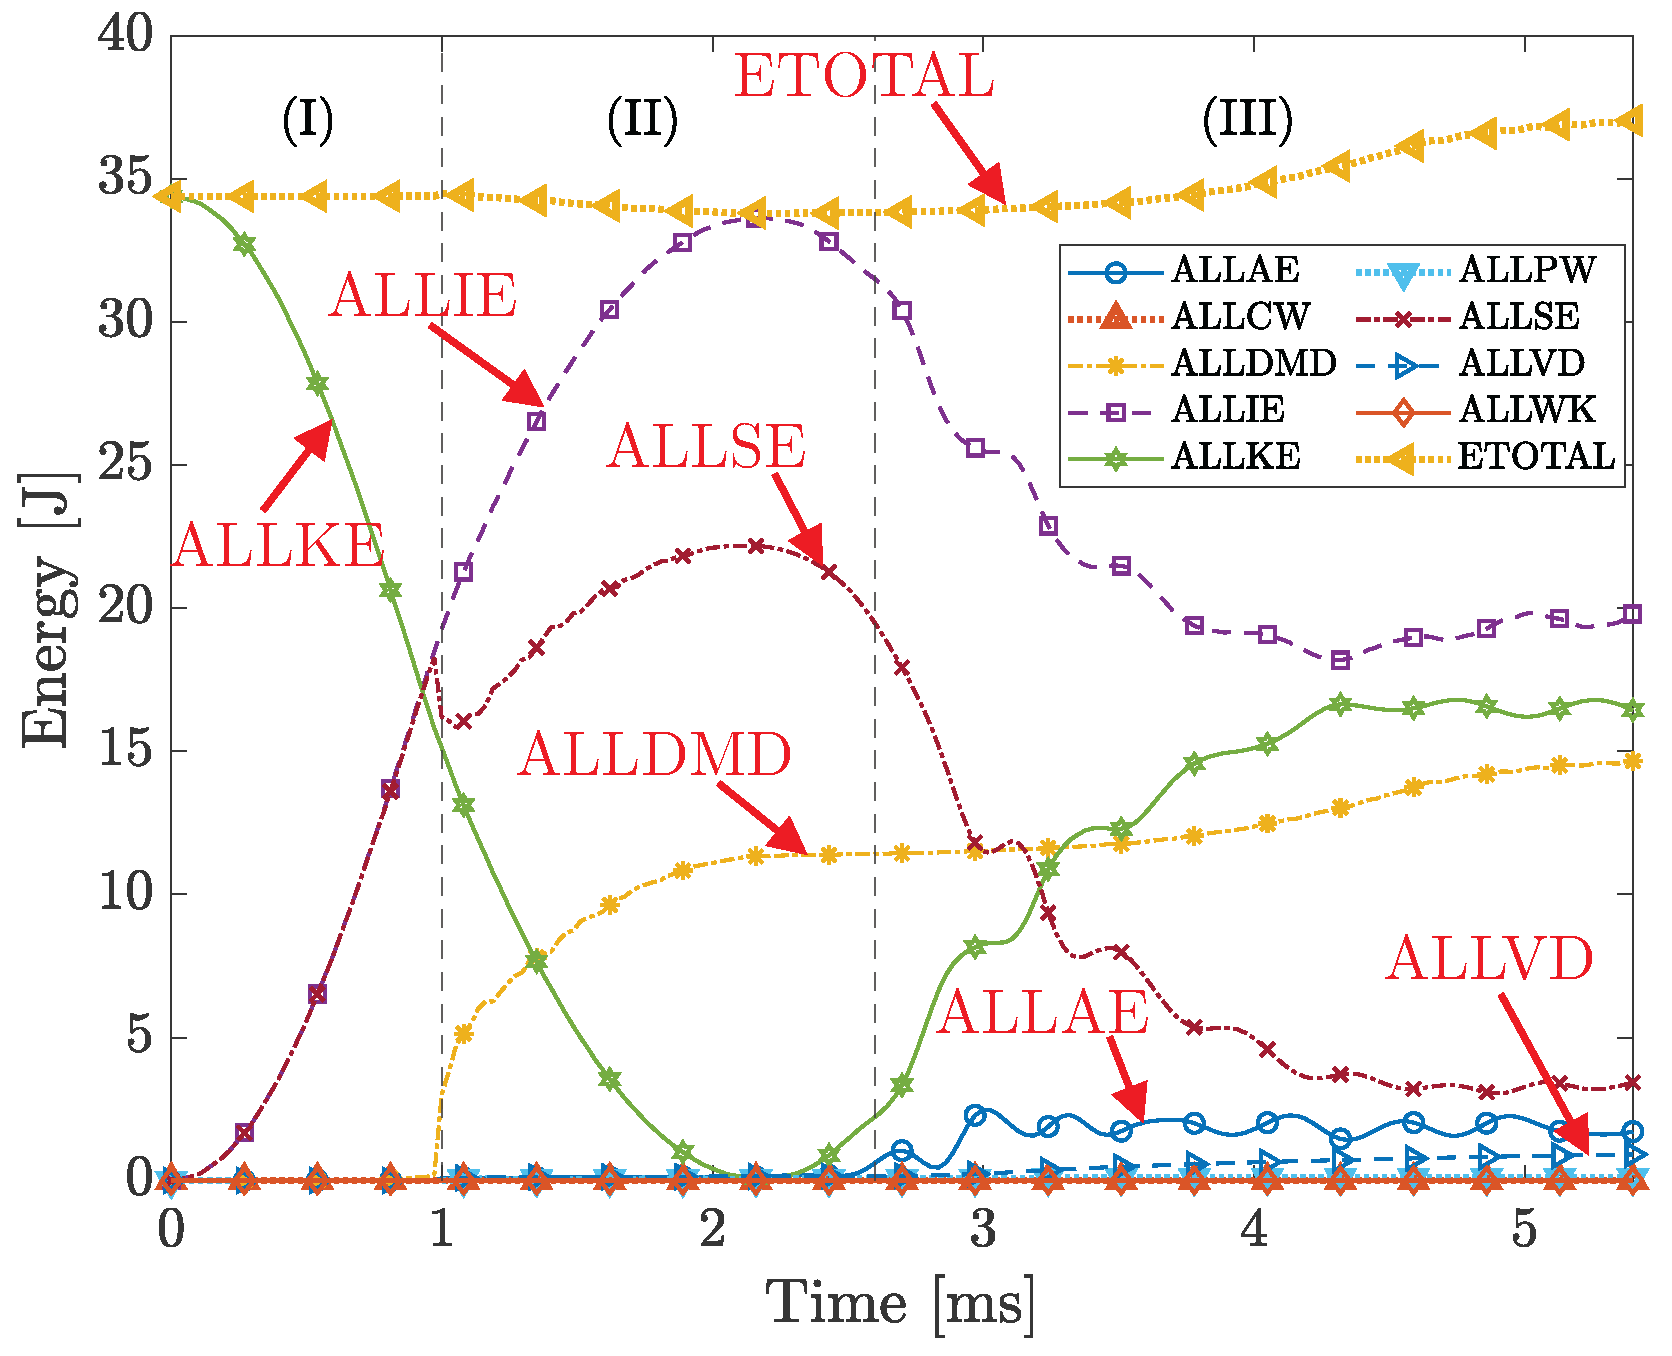
The results in Figure 8, Figure 9 and Figure 10 show the complexity and difficulty of stress mesh convergence during a highly nonlinear analysis, specifically the impact. While not all the spikes and large deviations observed in stress mesh convergence can be fully explained due to the complexity and limitations of the numerical model, the correlation with the energy history plot may provide insight into some of the underlying observations in stress mesh convergence. To better understand the source of these spikes, the energy history plots for the representative element size e l = 0.25 mm are shown in Figure 11. This is because e l = 0.25 mm results in smaller stress approximated errors and provides a practical balance between numerical accuracy and computational cost. Although e l = 0.2 mm can lead to higher analysis accuracy, the marginal improvement does not justify the substantially higher computational cost. These energy variables and their definitions are also listed in Table 4.
Figure 11. Energy history plot. Results correspond to case study #1 in Table 2 using a deformable projectile with an element size of 0.8 mm, kinematic contact algorithm, relax stiffness hourglass algorithm, and five section points per layer.
Table 4. Relevant energy variables in Abaqus and their definition [].
The energy history plots in Figure 11 exhibit three distinct stages, similar to the contact force response plot in Figure 6:
I.
Initial contact (0–1 ms)—Energy is conserved during this stage, as the total energy (ETOTAL) remains constant. During this stage, the kinetic energy (ALLKE) is converted to internal energy (ALLIE), which, due to the absence of damage, almost entirely consists of elastic strain energy (ALLSE). Contributions from other energy dissipation mechanisms, including work conducted by the external forces (ALLWK), contact penalties (ALLPW), constraint penalties (ALLCW), artificial energy (ALLAE), and viscous dissipated energy (ALLVD), are negligible.
II.
Damage initiation and evolution (1–2.6 ms)—The damage initiates at the beginning of this stage, where the difference between ALLIE and ALLSE becomes evident. This is captured by the increasing dissipated damage energy (ALLDMD), which gradually evolves and stabilizes between 2 and 2.6 ms. Despite the presence of damage, the total energy remains almost constant, indicating conservation of energy and a stable solution.
III.
Damage evolution and numerical instability (2.6–5.4 ms)—This stage is characterized by notable damage evolution and numerical instabilities due to severe element deformation. The oscillatory behavior of ALLAE indicates the activation of the hourglass control algorithm, which controls the hourglass mode. Additionally, the increase in ALLVD shows continuous added damping to the solver, helping maintain solution stability. The pronounced oscillations in ALLKE, ALLIE, and ALLSE, along with the gradual increase in ETOTAL—due to the cumulative effect of ALLAE and ALLVD—indicate numerical instabilities and the absence of energy conservation during this stage.
The abrupt increase in the approximated error at 1 ms—notably in Figure 8b, Figure 9b, and Figure 10b—could be attributed to the damage initiation at the beginning of stage (II) in Figure 11. The complexity of stress redistribution due to damage likely contributes to this discrepancy, especially since CSEs, e.g., S4R elements, use section points to capture through-the-thickness stress. During stage (III), numerical instabilities induced by damage evolution and severe element deformation lead to an increasing approximated error, even for the smallest in-plane element sizes. Therefore, it can be concluded that the predicted stress using S4R elements at 1 ms (damage initiation) and during the load stage (III) is inaccurate, and a more sophisticated FE modeling technique, such as solid elements, is required for an accurate prediction of stress.
Additionally, the energy history of the composite laminate can provide insight into the accuracy of the solution []. The ratios of artificial energy to internal energy (ALLAE/ALLIE) and viscous dissipated energy to internal energy (ALLVD/ALLIE) can serve as quantitative measures to check the solution accuracy. Although the literature recommends ratios below 1% [] for ALLAE/ALLIE and 5% for ALLVD/ALLIE [], a 10% limit is adopted for both ratios in this paper. This is due to the transient and highly nonlinear nature of LVI, which can amplify the artificial and viscous damping energy to proceed the solution. These ALLAE/ALLIE and ALLVD/ALLIE ratios for e l = 0.25 mm with five section points are 4.51% and 1.62%, respectively. Therefore, e l = 0.25 mm is deemed a suitable trade-off between the solution accuracy and computational cost for case study #1. This element size is used in the subsequent section to determine the number of section points.

3.1.3. Stress Mesh Convergence: Number of Section Points

Figure 12a shows the mesh convergence for nonaveraged σ 11 , m a x for different numbers of section points—three, five, and nine—for e l = 0.25 mm at the laminate back face. During stages (I) and (II), the approximated error for successive section points remains negligible (below 1%). In stage (III), however, a moderate increase in the approximated error compared to the earlier two stages is observed, likely due to the damage evolution and numerical instabilities, as previously discussed in Figure 11. Increasing the number of section points from three to five and then from five to nine reduces the approximated error, with values remaining below 3%, achieving a mesh convergence. Figure 12b presents the mesh convergence for nonaveraged σ 11 , m i n using the same in-plane element size and location. Similar to σ 11 , m a x , the approximated error remains below 1% during the first two stages. During stage (III), the approximated error rises; however, increasing the number of section points reduces the approximated error to less than 4% for five and nine section points.
Figure 12. Approximated error of nonaveraged in-plane longitudinal stress, σ 11 , at the bottommost section point at the laminate back face for different numbers of section points. Results correspond to case study #1 in Table 2 using a deformable projectile with an element size of 0.8 mm, an in-plane element size of 0.25 mm for the composite laminate, kinematic contact algorithm, and relax stiffness hourglass algorithm.
Figure 13a presents the stress convergence for nonaveraged σ 22 , m a x for e l = 0.25 mm at the laminate back face across different section points. During stages (I) and (II), the stress predictions remain nearly identical across different section points, indicating minimal sensitivity during these stages. However, during stage (III), the approximated error shows a marked increase between three and five section points, while it remains below 2% between five and nine section points throughout the analysis. Figure 13b shows the stress convergence for nonaveraged σ 22 , m i n for the same in-plane element size and location. Negligible difference is observed across different section points during stages (I) and (II). Nevertheless, during stage (III), the approximated error rises sharply between three and five section points, peaking at approximately 33% due to damage evolution and numerical instabilities. In contrast, the approximated error between five and nine section points reveals substantially smaller values, remaining below 5% throughout the analysis, highlighting the importance of using nine section points under complex load and damage.
Figure 13. Approximated error of nonaveraged in-plane transverse stress, σ 22 , at the bottommost section point at the laminate back face for different numbers of section points. Results correspond to case study #1 in Table 2 using a deformable projectile with an element size of 0.8 mm, an in-plane element size of 0.25 mm for the composite laminate, kinematic contact algorithm, and relax stiffness hourglass algorithm.
The stress convergence for nonaveraged σ 12 , m a x for e l = 0.25 mm at the laminate back face among the investigated number of section points is provided in Figure 14a. During stages (I) and (II), the approximated error remains negligible across all section points. However, in stage (III), the approximated error between three and five section points increases to 10%. In contrast, the approximated error between five and nine section points remains below 7%, indicating improved accuracy with an increasing number of section points. Figure 14b presents the stress convergence for nonaveraged σ 12 , m i n for the same in-plane element size and location. During the first two stages, the approximated error remains largely unaffected, with only a minor 2% deviation at 1.89 ms between five and nine section points. This deviation could be attributed to localized stress variations that are not fully captured using fewer section points, i.e., between three and five section points. During stage (III), the approximated error between the three and five section points increases, peaking at 19%. However, the approximated error remains below 5% throughout the analysis between five and nine section points.
Figure 14. Approximated error of nonaveraged in-plane shear stress, σ 12 , at the bottommost section point at the laminate back face for different numbers of section points. Results correspond to case study #1 in Table 2 using a deformable projectile with an element size of 0.8 mm, an in-plane element size of 0.25 mm for the composite laminate, kinematic contact algorithm, and relax stiffness hourglass algorithm.
Based on the mesh convergence results presented in Figure 12, Figure 13 and Figure 14, it can be concluded that nine section points for case study #1 ensure a low approximated error across all stress components, particularly during stage (III), where damage evolution is more dominant.

3.2. Mesh Convergence Study: Summary

A comprehensive mesh convergence study was conducted for case study #1 in Table 2 to assess the effectiveness of the proposed mesh convergence study outlined in Section 2.3. The results indicate that the contact force and displacement converge more rapidly than the stress. The stress convergence requires a smaller in-plane element size due to localized deformation and the presence of damage. These effects, combined with the challenges of controlling hourglass mode—especially under severe element deformation—and the addition of numerical damping to aid in simulation progress, often lead to numerical instabilities and inaccurate stress predictions. Overall, while S4R elements can reasonably predict contact force and displacement, they demonstrate limitations in predicting stress under severe deformation and damage.
Table 5 summarizes the mesh convergence results for all case studies in this paper. For each case, the in-plane element size ( e l ), number of section points, and energy ratios—artificial energy to internal energy (ALLAE/ALLIE) and viscous dissipated energy to internal energy (ALLVD/ALLIE)—are reported. The results show that both the in-plane element size and the number of section points vary depending on the specific case. While five section points are generally adequate for stress prediction, cases including severe element deformation and damage require nine section points. The observed variations in energy ratios indicate differences in hourglass energy dissipation and viscous dissipated energy, which are affected by element deformation, damage severity, and the nonlinear nature of contact problems. In summary, mesh convergence is case-dependent and needs to be adjusted according to the analysis objectives. Coarser in-plane element sizes with five section points may suffice for contact force and displacement predictions, while finer in-plane element sizes with nine section points are essential for reliable stress predictions, particularly in capturing localized effects and damage.
Table 5. Summary of mesh convergence study for all case studies in this study. Results are obtained using a deformable projectile with element size of 0.8 mm, kinematic contact algorithm, and relax stiffness hourglass algorithm (* a value less than 10% is considered acceptable for the purpose of this study).
Case
Study
e l [mm]Section
Points
ALLAE
/ALLIE * [%]
ALLVD
/ALLIE * [%]
#10.2594.511.62
#20.2555.797.00
#30.3052.218.15
#40.2590.852.00
#50.3530.560.03

3.3. Effect of Projectile Modeling Technique on Contact Force Response of Conventional Shell Elements

This section examines the impact of the projectile modeling technique, as outlined in Section 2.2.1, on the contact force response of S4R elements for various contact algorithms—specifically, the kinematic and penalty formulations. For each algorithm, multiple analyses using various projectiles are conducted, and results are benchmarked against case study #1 in Table 2 to assess the predictive accuracy. Note that mesh convergence depends on several input parameters, including the projectile modeling technique, contact algorithm, and interactions, such as contact pairs or general contact. Conducting mesh convergence for every combination is computationally tedious. Hence, to ensure consistency in mesh configuration while maintaining acceptable accuracy, an in-plane element size of 0.4 mm and five section points are adopted across all the analyses in this section. This choice is justified based on the results in Section 3.1, which show a negligible difference in the contact force—the primary variable of interest in this section—for in-plane element sizes smaller than 0.4 mm. Furthermore, the primary objective of this section is not a detailed stress analysis but rather to provide insight into how projectile modeling techniques and contact algorithms affect the contact force response of S4R elements.
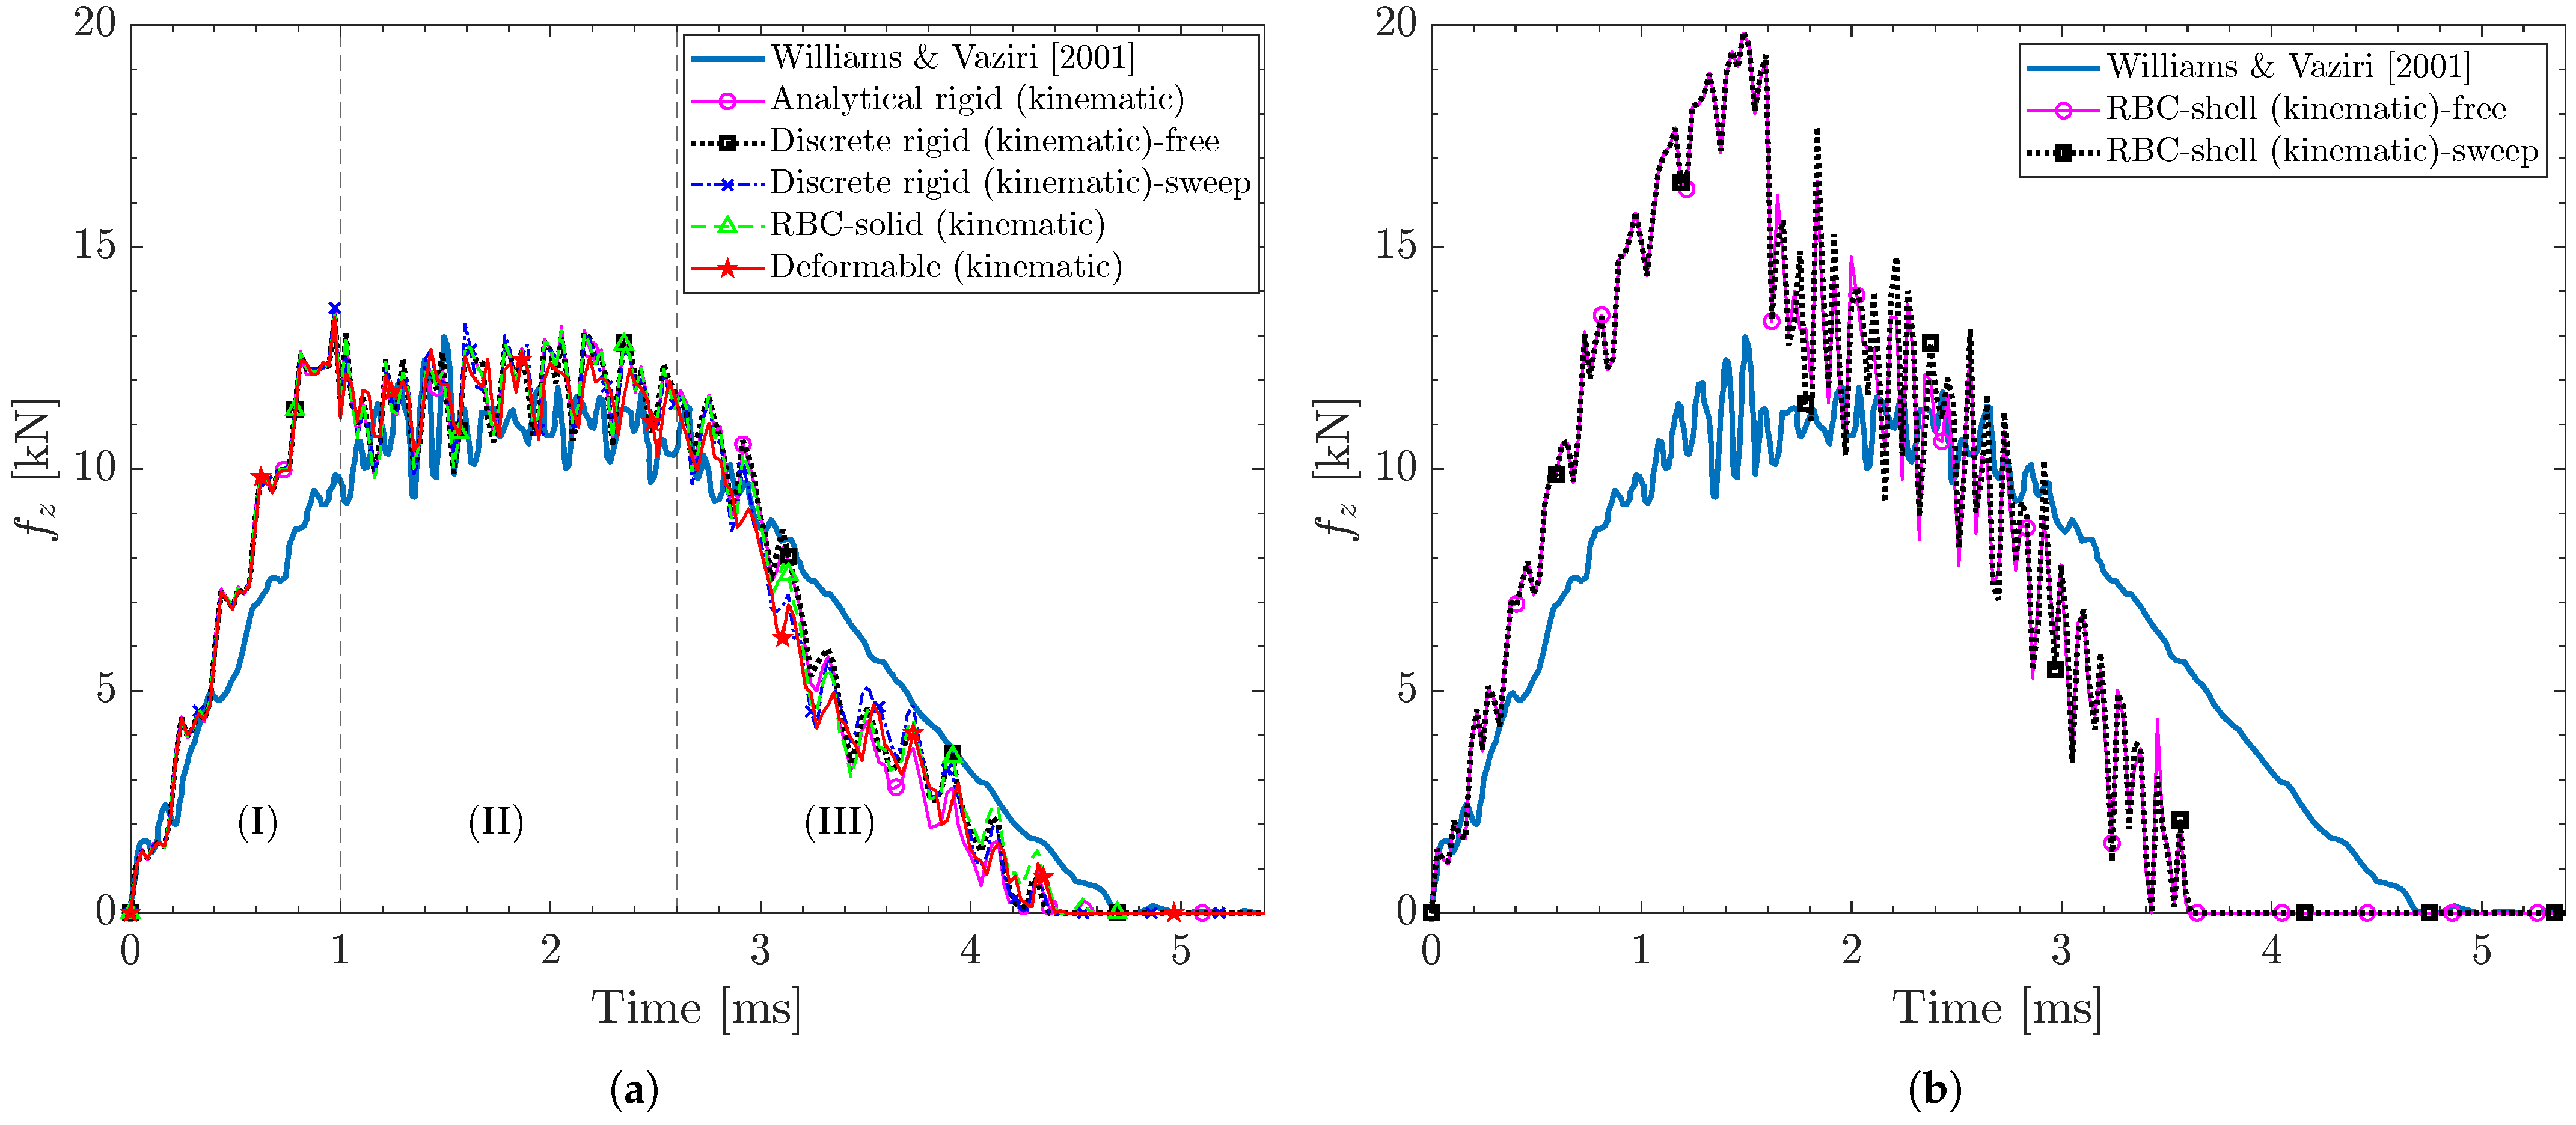
Kinematic contact algorithm: Figure 15 shows the contact force history obtained using the kinematic contact algorithm for different projectile modeling techniques, along with the experimental result for case study #1 in Table 2. As seen in Figure 15a, all projectile modeling techniques—analytical rigid, discrete rigid (with free and sweep mesh controls), RBC-solid, and deformable—predict similar contact force responses and follow the expected three-stage response discussed in Section 3.1: (I) an initial increase, (II) a plateau with oscillations, (III) and a gradual decline to zero. Nevertheless, FEA slightly overpredicts the peak force. This overprediction may be attributed to the stiff behavior of S4R elements [], limited damage modeling, and uncertainties in the input damage parameters, i.e., variability in the experimentally determined or literature-sourced material properties, such as strength values and fracture energies used for damage initiation and evolution. Figure 15b shows that RBC-shell projectiles, with free and sweep mesh controls, exhibit a notably higher contact force response (nearly double) and a shorter contact time by approximately 1 ms. This deviation is likely due to the combination of RBC implementation and the definition of contact pairs in the kinematic contact algorithm, particularly when both the projectile and composite laminate are modeled using S4R elements. This combination may prevent the kinematic contact algorithm from accurately detecting contact surfaces and penetrations and enforcing contact constraints, resulting in an overstiff behavior and consequently an overpredicted contact force. To better understand the underlying mechanisms of this behavior, the kinematic contact algorithm is explained in the following paragraph.
Figure 15. Out-of-plane contact force history plots for different projectile modeling techniques using kinematic contact algorithms. Results correspond to case study #1 in Table 2 using an element size of 0.8 mm for all projectiles, an in-plane element size of 0.4 mm, five section points per layer for the composite laminate, and relax stiffness hourglass algorithm [].
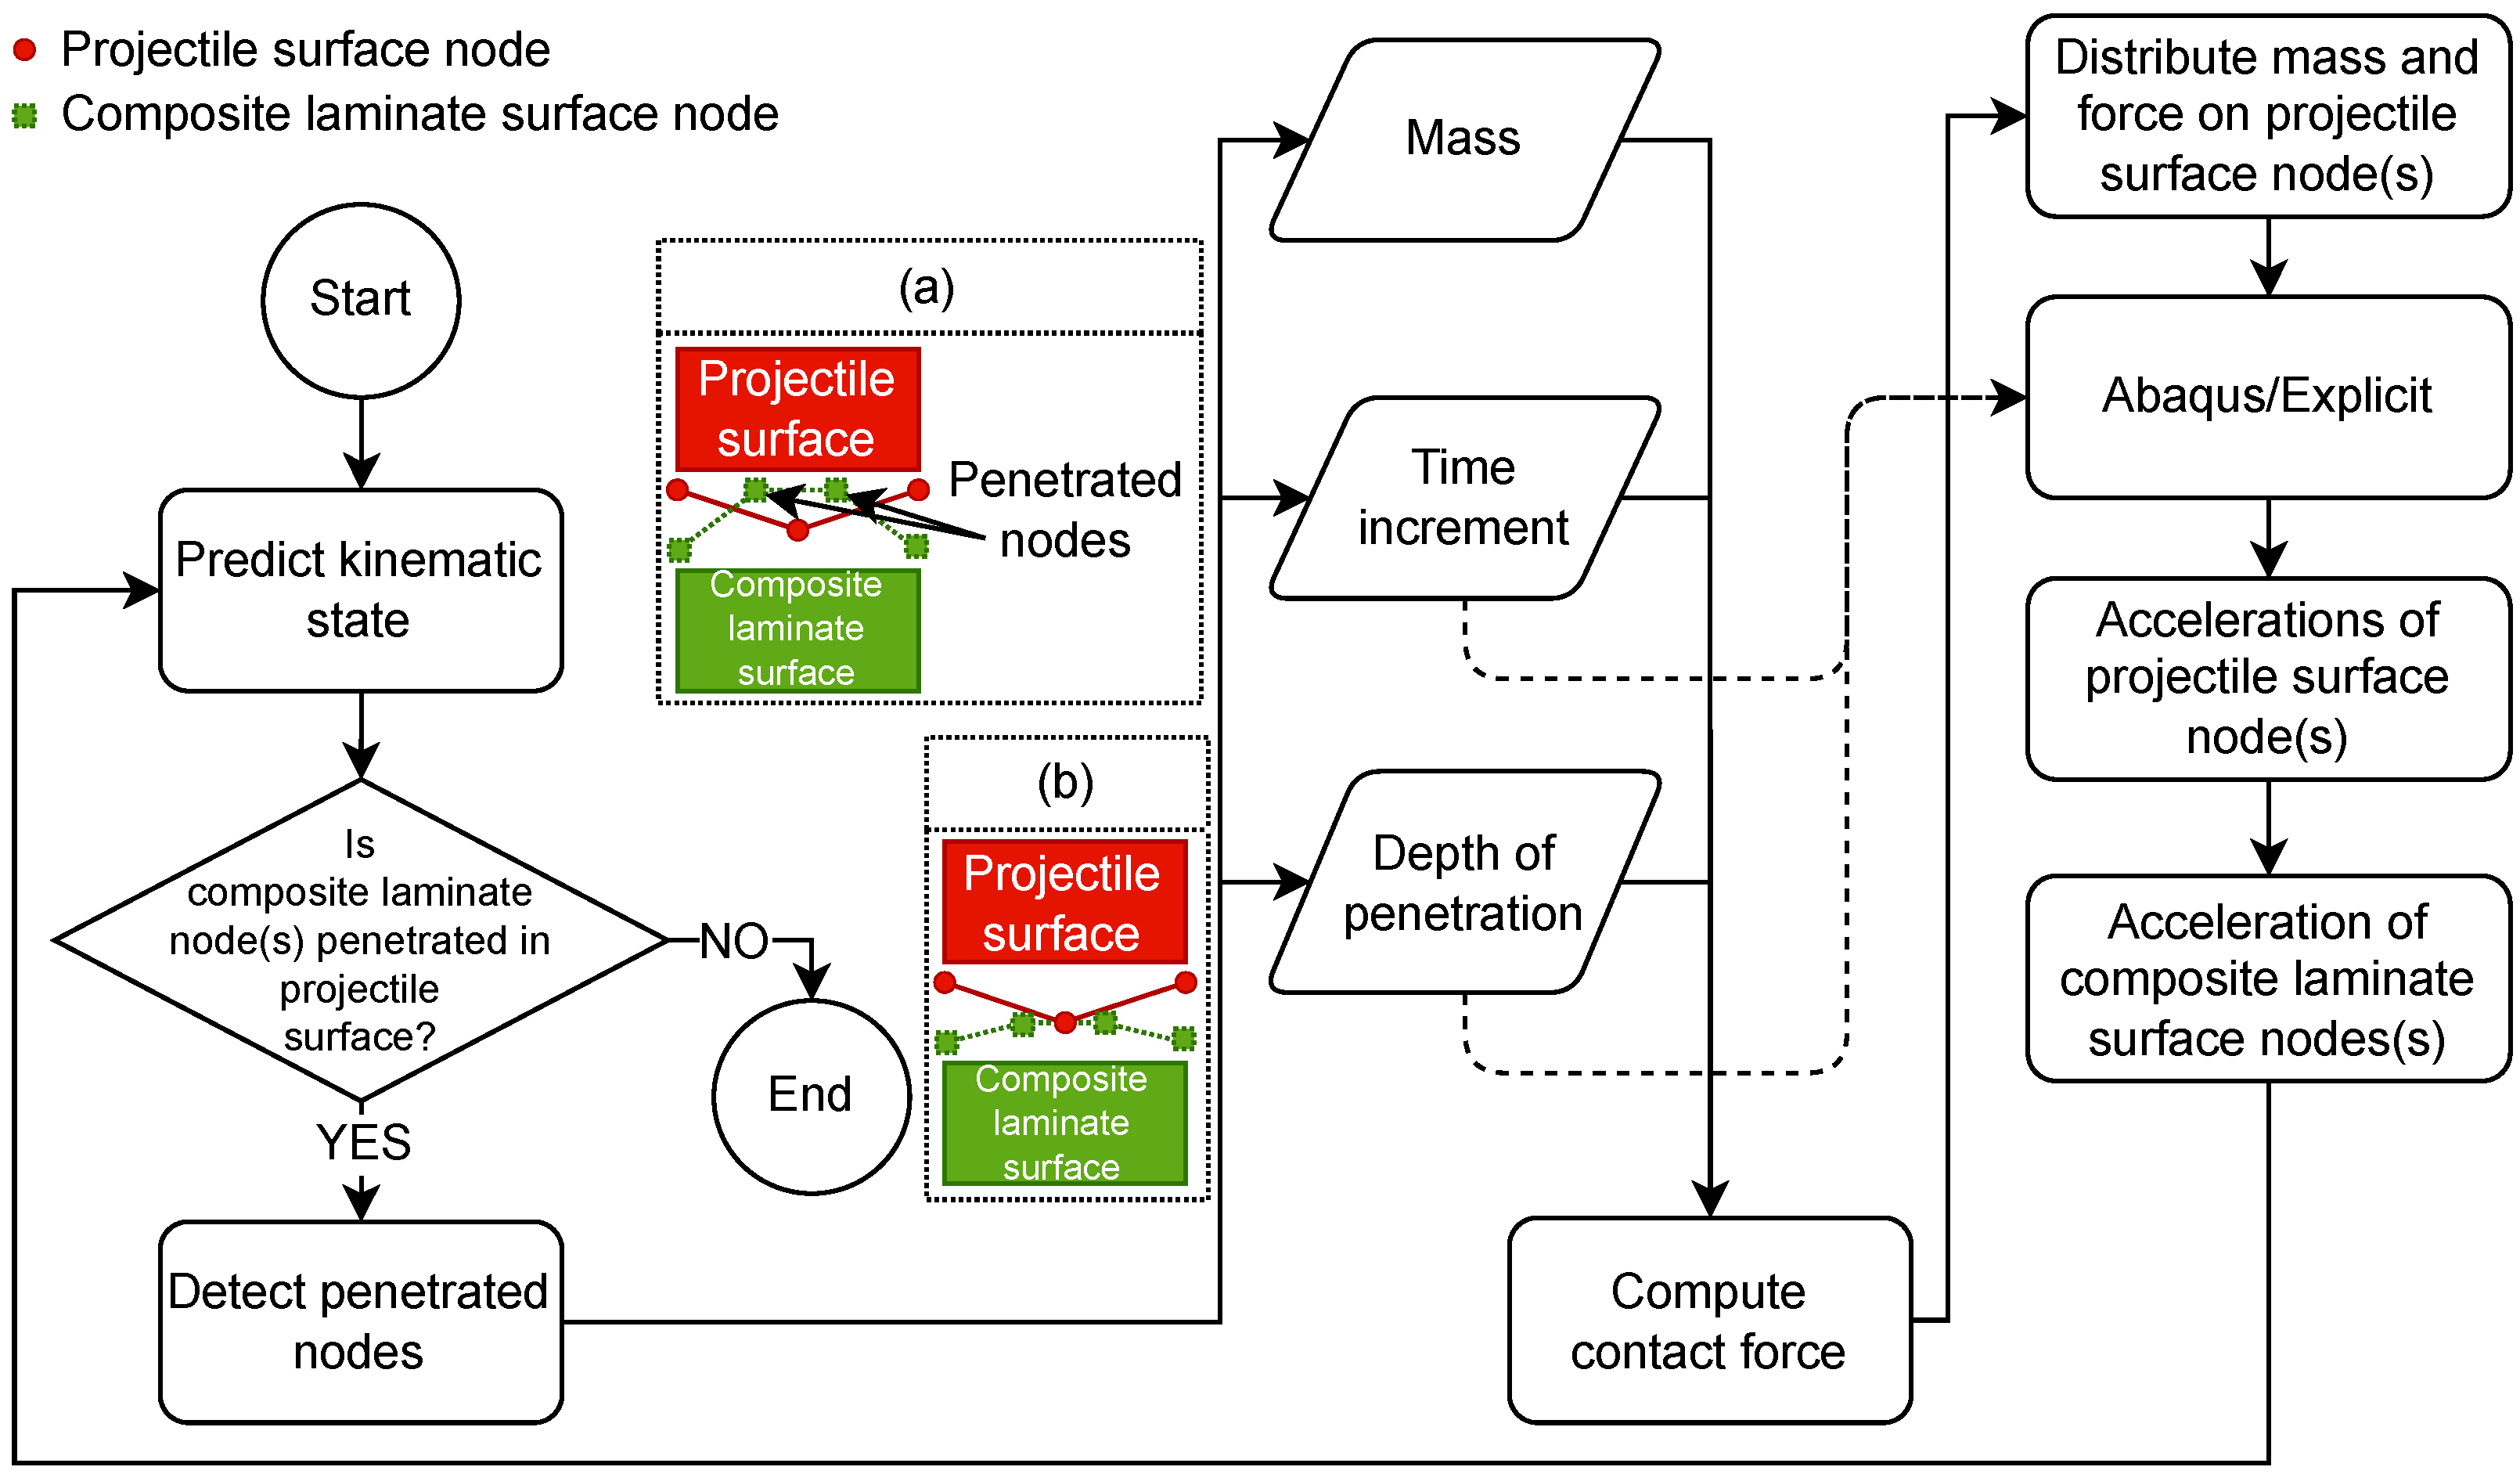
Figure 16 illustrates the kinematic contact algorithm implemented in Abaqus []. This algorithm outputs the contact forces required for computing the accelerations of the projectile and composite laminate. Initially, this algorithm predicts the kinematic state between the projectile and the composite laminate at each time increment. Specifically, it looks for any penetrations from the composite laminate into the projectile. This is illustrated in Figure 16a. In the event of penetration, the algorithm detects the penetrated nodes and computes the contact force based on the nodal mass, time increment, and depth of penetration. Then, the algorithm distributes the mass and the computed contact force to the nodes. Two cases are applicable: (1) If the projectile properties are associated with an RP, such as an analytical rigid projectile, both mass and contact force are attributed to RP. (2) In case of using a deformable projectile, the mass is distributed over the projectile nodes, and the contact force is distributed across the involved nodes in the contact. Next, Abaqus/Explicit uses the contact force, time increment, and depth of penetration to compute the acceleration of the projectile and composite laminate. These calculations help predict the new kinematic state between the projectile and the composite laminate. If additional penetrations are detected, this process iterates until no further penetrations remain, as shown in Figure 16b, at which the contact force and acceleration are computed and the algorithm exits. The iterative corrections of penetrated nodes at each time increment, while intended to ensure a physically robust analysis, may lead to inaccuracies in detecting penetrated nodes and subsequently an overestimation of the contact force response. It appears that this issue may be further exacerbated by severe element deformation and/or when the RBC-shell implementation is used for the projectile modeling.
Figure 16. Kinematic contact algorithm (adapted from []).
Penalty contact algorithm: The contact force responses for different projectile modeling techniques using the penalty contact algorithm are shown in Figure 17. Among various projectiles, only the deformable projectile, shown in Figure 17a, captures the expected three-stage contact force response, closely matching the experimental result. The analytical rigid projectile in Figure 17b exhibits severe oscillations that begin immediately after initial contact and continue throughout the analysis. This behavior is likely due to the unique formulation of the analytical rigid projectile, in which Abaqus controls the mesh internally. This, combined with a potential stiffness mismatch between the projectile and composite laminate, could compromise the penalty contact algorithm’s ability to enforce the contact constraints. A different yet similar behavior can be observed for the discrete rigid and RBC-solid in Figure 17c,d. These projectiles initially predict the contact force response up to the damage initiation point. However, once the damage evolves, the contact force response becomes instable, exhibiting oscillatory behavior and eventually terminating. This is also evident in the dissipated damage plots in Figure 17c,d. Although the termination point varies across projectiles, the underlying issue appears consistent, suggesting an incompatibility between the R3D4 and C3D8R elements, used to mesh these projectiles, and the penalty contact algorithm. Another explanation could lie in how the penalty coefficient, which resists the penetration of composite laminate nodes into the projectile, is scaled based on the element stiffness. This is further discussed in the following paragraph, in which the penalty contact algorithm is explained.
Figure 17. Out-of-plane contact force history plots for different projectile modeling techniques using penalty contact algorithms. Results correspond to case study #1 in Table 2 using an element size of 0.8 mm for all projectiles, an in-plane element size of 0.4 mm, five section points per layer for the composite laminate, and relax stiffness hourglass algorithm []. (a) Deformable projectile. (b) Analytical rigid projectile. (c) Discrete rigid projectile with free and sweep mesh controls. (d) RBC-solid and RBC-shell projectiles—with free and sweep mesh controls.
Figure 18 shows the penalty contact algorithm in Abaqus []. The penalty contact algorithm shares some similarities with the kinematic contact algorithm but differs in several aspects. At each time increment, the penalty contact algorithm predicts the kinematic state between the projectile and composite laminate. This includes identifying the penetrated nodes from the composite laminate surface into the projectile surface, as shown in Figure 18a. In the event of penetration, the algorithm searches for the penetrated nodes and, based on the mass, time increment, and penetration depth, computes the contact force. The mass and computed force are then distributed over the projectile surface nodes, similar to the explanation in the kinematic contact algorithm. Abaqus/Explicit uses the nodal mass, computed contact force, time increment, and penetration depth to calculate the acceleration of the projectile and, subsequently, the composite laminate. The algorithm reaches the end of the time increment, as shown in Figure 18b, and proceeds to the next one. Unlike the kinematic contact algorithm, the penalty algorithm does not explicitly correct the kinematic state to prevent penetration from the composite laminate nodes into the projectile. Instead, it uses a penalty coefficient, typically a combination of element stiffness with a scaling factor, to prevent the penetration []. The penalty stiffness could become problematic for rigid projectiles. It appears that due to the stiffness mismatch between the projectile and the composite laminate and/or excessive element deformation, the solver cannot properly scale the penalty coefficient. Consequently, the penalty contact algorithm fails to accurately correct the penetration of composite laminate nodes into the projectile, resulting in numerical instabilities and ultimately leading to termination. These findings suggest using the deformable projectile with the penalty contact algorithm when modeling LVI of composite laminates with S4R elements.
Figure 18. Penalty contact algorithm (adapted from []).
General contact: A comparison of contact force responses for different projectile modeling techniques using the general contact is provided in Figure 19. Although the general contact uses the penalty contact algorithm, it differs fundamentally in defining contact interactions, as Abaqus automatically detects and manages contact surfaces, eliminating the need for the user to define them explicitly. This automated approach reduces modeling complexity and prevents errors associated with manually entering contact surface data. As shown in Figure 19a,b, all projectiles exhibit the three-stage response consistent with the experimental result, especially during stage (III). This enhancement can be attributed to the general contact adaptive contact surface detection capabilities. General contact automatically detects contact surfaces throughout the analysis and continuously updates them, making it well suited for unpredictable contact scenarios. For instance, during rebound in stage (III), the contact surfaces may move into relative positions that are not well captured by the predefined contact pairs. However, the adaptive contact surface detection in general contact—with its continuous search and update of contact conditions—can effectively capture these relative positions, resulting in more accurate contact force predictions. Additionally, for discrete rigid and RBC-shell, the general contact maintains a consistent contact force response across different mesh controls—free and sweep. This consistency suggests that general contact can effectively handle contact surface interactions, irrespective of the projectile modeling techniques.
Figure 19. Out-of-plane contact force history plots for different projectile modeling techniques using general contact. Results correspond to case study #1 in Table 2 using an element size of 0.8 mm for all projectiles, an in-plane element size of 0.4 mm, five section points per layer for the composite laminate, and relax stiffness hourglass algorithm [].
To further assess the reliability of these analyses, energy history plots for the deformable projectile using the kinematic, penalty, and general contact are presented in Figure 20. The deformable projectile is selected due to its better agreement with the experiment across different contact algorithms/interactions. Both kinematic (Figure 19a) and penalty (Figure 19b) algorithms show closely similar results, with the total energy (ETOTAL) remaining constant throughout the analysis, except for a minor increase during stage (III), as discussed in Section 3.1. The kinematic algorithm exhibits slightly more pronounced oscillations than the penalty algorithm, which can be attributed to its iterative correction of penetrating surfaces at each time increment. In contrast, the general contact in Figure 20c shows a notable drop in ETOTAL, particularly during stages (II) and (III). This suggests that, despite its good agreement with the experiment, using general contact in LVI modeling of composite laminates requires careful evaluation of energy plots, especially when energy conservation is a priority.
Figure 20. Energy history plot for different contact algorithms. Results correspond to case study #1 in Table 2 using a deformable projectile with an element size of 0.8 mm, an in-plane element size of 0.4 mm, five section points per layer for the composite laminate, and relax stiffness hourglass algorithm.
To isolate the cause of the ETOTAL drop, an additional analysis is conducted in the absence of damage using the general contact. The energy plots are shown in Figure 20d. General contact is chosen because it exhibits the largest ETOTAL drop among the results in Figure 20a–c. As seen in Figure 20d, in the absence of damage, ETOTAL remains constant throughout the analysis, confirming the energy is conservative. The kinetic energy (ALLKE) is converted to elastic strain energy (ALLSE), with total internal energy (ALLIE) overlapping ALLSE since artificial energy (ALLAE) and dissipated damage energy (ALLDMD) are negligible and zero, respectively. Additionally, ALLAE/ALLIE and ALLVD/ALLIE ratios are both approximately 0.11%, confirming their negligible contribution. This comparison demonstrates that the ETOTAL deviation observed in Figure 20a,c is due to the inclusion of the damage, rather than errors in the numerical implementation. More importantly, this comparison highlights that general contact should not be regarded as an inappropriate method for modeling LVI in composite laminates. Instead, it emphasizes the importance of checking energy plots using any contact algorithm/interaction to ensure the energy remains conservative.
Table 6 summarizes the list of compatible projectile modeling techniques and contact algorithms/interactions for S4R elements. The results indicate that all projectile modeling techniques, except for the RBC-shell with both free and sweep mesh controls, are compatible with the kinematic contact algorithm and can be used to predict the contact force response. The RBC-shell projectiles combined with the kinematic contact algorithm tend to overpredict the peak contact force and underpredict the contact time. The penalty contact algorithm is only compatible with the deformable projectile. All rigid projectiles exhibit severe oscillatory behavior or termination, indicating numerical instabilities in enforcing contact constraints during the damage evolution. While the general contact appears to provide acceptable contact force responses across all projectile modeling techniques, further investigation of the energy history plots reveals nonconservative behavior. This indicates that although the contact force response can be effectively predicted, the general contact may introduce numerical instabilities that compromise the solution accuracy.
Table 6. Summary of compatible projectile modeling techniques and contact algorithms and interactions. Results correspond to case study #1 in Table 2 using an element size of 0.8 mm for all projectiles, an in-plane element size of 0.4 mm, five section points per layer for the composite laminate, and relax stiffness hourglass algorithm (✓: compatible, ×: incompatible, *: while effective in predicting contact force response, the general contact may lead to nonconservative response in energy history plots).

3.4. Effect of Hourglass Control on Artificial Strain Energy of Conventional Shell Elements

Table 7 presents the artificial strain energy (ALLAE) to total internal energy (ALLIE) ratio of the composite laminate for three different hourglass control algorithms—relax stiffness, pure stiffness, and enhanced—using S4R elements. All analyses correspond to case study #1 in Table 2. Despite minimal differences, the enhanced algorithm results in the lowest ALLAE/ALLIE ratio, followed by the pure stiffness and relax stiffness algorithms.
Table 7. Effect of various hourglass control algorithms on the artificial strain energy (ALLAE) to internal energy (ALLIE) ratio using S4R elements. Results correspond to case study #1 in Table 2 using a deformable projectile with an element size of 0.8 mm and kinematic contact algorithm. In-plane element size and section points according to Table 5 (* default hourglass algorithm in Abaqus/Explicit).
The relax stiffness algorithm, the default hourglass control algorithm in Abaqus/Explicit, is based on an integral viscoelastic formulation that introduces a history-dependent resistance force to the hourglass mode []. This algorithm enables smoother energy dissipation, particularly at the early stage of dynamic problems, where the contact initiates []. However, its time-integration formulation can lead to gradual accumulation of artificial strain energy, as reflected in its higher ALLAE/ALLIE ratio compared to the other two algorithms. Although adjusting the stiffness coefficients can mitigate the accumulation of artificial strain energy, such an adjustment falls outside the scope of this paper.
The pure stiffness algorithm applies a linear resistance force proportional to the hourglass mode and is recommended for both quasi-static and transient dynamic analyses []. Its linear nature provides better control over hourglass mode compared to the relax stiffness and reduces artificial strain energy without overstiffening the structure.
The enhanced algorithm outperforms the previous two algorithms, resulting in the lowest ALLAE/ALLIE ratio. It is a refinement of the pure stiffness algorithm and uses the enhanced assumed strain method to compute stiffness coefficients []. Unlike the other two methods, the enhanced algorithm uses the element formulation to compute the stiffness coefficients, rather than relying on user inputs. This minimizes the artificial stiffening and results in a more physically accurate representation of the element deformation.
Overall, although all three hourglass algorithms result in an ALLAE/ALLIE ratio of less than 10%, considered acceptable for this paper, the enhanced algorithm offers the lowest ratio, making it the preferred choice for LVI modeling of composite laminates using S4R elements.

3.5. Accuracy of Conventional Shell Elements in LVI Modeling of Thick Composite Laminates

Figure 21 shows the relative difference between the experiment and FEA using S4R elements for various laminate thicknesses, including case studies #2 to #5 in Table 2 The comparison considers four key impact variables: peak contact force, f z , m a x and displacement, u z , m a x , contact time, and absorbed energy. The laminate thickness is normalized by its width in Figure 21 to define a dimensionless thickness-to-width ratio, as discussed in Section 2.5. The relative difference is calculated using Equation (2) [].
Relative difference = B Experiment B FEA B Experiment × 100
where B represents the key impact parameter, e.g., f z , m a x or u z , m a x , with subscripts experiment and FEA indicating values obtained from experiment and FEA, respectively. The results in Figure 21 indicate that S4R elements provide reasonable accuracy for thin laminates (thickness-to-width ratio less than 0.04), with absolute relative differences below 16% across all four key variables. However, beyond 0.04, the relative difference increases dramatically: the peak contact force is overpredicted, while the peak displacement, contact time, and absorbed energy are underpredicted.
Figure 21. Relative difference of key impact variables between experiment and FEA using S4R elements for different thickness-to-width ratios. Results correspond to case study #1 in Table 2 using a deformable projectile with an element size of 0.8 mm, kinematic contact algorithm, and relax stiffness hourglass algorithm for case studies #2 to #5 in Table 2 In-plane element size and section points according to Table 5.
The overprediction of peak contact force can be attributed to the limitation of FSDT that governs the S4R element formulation. FSDT enforces zero through-the-thickness strain, ε z z (see Figure 3), and assumes a linear displacement variation through the laminate thickness, indicating constant transverse shear strains, ε x z and ε y z (see Figure 3) []. While these assumptions reduce computational cost, they make S4R elements excessively stiff, ultimately leading to overpredicted contact force [,]. This overstiff behavior is further amplified by the use of section points. Although section points enable through-the-thickness stress integration and improve computational efficiency, this inherent simplification in S4R element formulation limits their sensitivity to thickness variation and deformation during transverse load, e.g., LVI [].
The underpredicted displacement and contact time are also a consequence of this excessive stiff behavior. This overstiff behavior resists the out-of-plane deformation and shortens the duration of energy transferred between the projectile and composite laminate, resulting in a smaller contact time compared to the experiment. The same mechanism also prevents the laminate from out-of-plane deformation, leading to an underestimation of the peak displacement []. These relative differences escalate as the laminate thickness increases. For the thickness-to-width ratio less than 0.04, FSDT assumptions remain reasonably valid because ε z z , ε x z , and ε y z are negligible []. However, as the laminate thickness increases (beyond 0.04), these strain components become nonnegligible, and the single-layer representation of the laminate with through-the-thickness section points fails to predict the laminate deformation [].
Absorbed energy shows the largest relative difference, with values approaching 100% in the thickest laminate. For thickness-to-width ratios less than 0.04, the absorbed energy predicted by FEA is reasonably close to the experiment, with a maximum reaching approximately 14%. For thin laminates, matrix cracking typically occurs at the early stages of impact due to high bending stress at the laminate back face [,] and often serves as a precursor to delamination []. It appears that for laminates with thickness-to-width ratios less than 0.04, the majority of the energy is absorbed through matrix cracking, which is adequately represented with the present damage model. However, the relative difference between the experiment and FEA increases substantially for thicker laminates with thickness-to-width ratios beyond 0.04. As thickness increases, the transverse shear strains become comparable in magnitude to in-plane strain, ε x y [], which violates FSDT assumptions, leading to underpredicted absorbed energies. Furthermore, thicker laminates contain more layers and interfaces, where a greater portion of the absorbed energy is associated with delamination []. CSEs represent a multi-layer composite laminate as an equivalent single layer with through-the-thickness section points. This formulation does not account for interlaminar damage. Consequently, delamination is absent in the model, which explains why the relative difference in absorbed energy is notably higher in laminates with thickness-to-width ratios exceeding 0.04.
In summary, although S4R elements are computationally efficient for thin laminates, their predictive accuracy decreases beyond the thickness-to-width ratio of 0.04. This limit is notably lower than the recommended ratio for the isotropic shell in Abaqus [], highlighting the increased complexity of the anisotropic, layered architecture of composite laminates.

4. Conclusions

This study establishes a benchmark for accurately and efficiently modeling low-velocity impact (LVI) of composite laminates using conventional shell elements (CSEs), specifically S4R elements in Abaqus/Explicit. The findings of this paper are as follows:
  • Mesh convergence study: A systematic mesh convergence study for CSEs, based on contact force, displacement, and stress, is proposed. The robustness of the proposed method is assessed against five experimental case studies. Contact force and displacement converge rapidly with relatively larger in-plane element sizes, e.g., 0.4 mm, with an approximated error below 10% during damage initiation and evolution. Stress convergence, however, is more demanding and requires convergence for both in-plane element size and number of section points. Stress convergence requires smaller in-plane element sizes, e.g., 0.25 mm, and up to nine section points through the thickness to ensure solution accuracy. Furthermore, stress convergence is particularly challenging during the damage initiation and evolution, although smaller in-plane element sizes and additional numbers of section points reduce the approximated error. Additionally, it is essential to monitor the ratio of the artificial strain energy to total internal energy and the ratio of viscous dissipated energy to internal energy—as solution accuracy metrics—below a certain limit (e.g., ≤10% in this paper) to ensure the solution is stable and physically reliable.
  • Effect of projectile modeling technique on contact force response: Four projectile modeling techniques with different geometries and mesh control are evaluated: analytical rigid, discrete rigid—with free and sweep mesh controls—rigid body constraints (RBC) with solid geometry, RBC with shell geometry—with free and sweep mesh controls—and deformable projectiles. The contact force response is assessed through various contact constraint algorithms/interactions, including kinematic, penalty, and general contact (which enforces the penalty algorithm). The deformable projectile, using either the kinematic or penalty contact algorithm, remains the most accurate projectile modeling technique for LVI modeling of composite laminates. The penalty contact algorithm exhibits incompatibility with all rigid projectiles, potentially due to the stiffness mismatch between the projectile and the composite laminate. This mismatch affects the computation of the penalty coefficient used to prevent the penetration of the projectile into the composite laminate, resulting in the termination of the analysis. General contact demonstrates compatibility with all projectiles and accurately predicts the contact force response. However, energy history plots reveal that the total energy is not conserved throughout the analysis, particularly during damage initiation and evolution, compromising the accuracy of the finite element analysis.
  • Effect of the hourglass algorithm on artificial strain energy: The ratio of the artificial strain energy—the dissipated energy due to the hourglass mode—to internal energy is used as a metric to assess three hourglass control algorithms: relax stiffness, pure stiffness, and enhanced. The enhanced algorithm results in the lowest ratio, indicating its capability in controlling the hourglass mode of S4R elements with minimal artificial stiffness and providing a more physically accurate response during LVI.
  • Applicable thickness range of CSEs: The accuracy of S4R elements is assessed for four laminates with thickness-to-width ratios of 0.02, 0.04, 0.06, and 0.12 across four key impact variables: peak contact force and displacement, contact time, and absorbed energy. Results indicate that S4R elements can predict these impact variables with an absolute relative error of less than 16% for thickness-to-width ratios of less than 0.04. Beyond 0.04, S4R elements exhibit stiff behavior, overpredicting the contact force and underpredicting the displacement, contact time, and absorbed energy.
While this paper is not hypothesis-based, the results confirm the methodological expectations. Contact force and displacement convergence with a relatively coarse mesh, while stress convergence requires finer in-plane element sizes and additional section points. As expected, S4R elements show acceptable accuracy for thin laminates but become increasingly stiff for thicker laminates, limiting their accuracy. An unexpected outcome is the nonconservative energy behavior using general contact once the damage initiates. These findings validate the robustness of the proposed benchmarking approach in this paper and highlight the key limitations of CSEs to be considered in future applications. The modeling guidelines provided in this paper are applicable to civilian aerospace structures (e.g., fuselage panels, airplane wings, and cargo doors), wind turbine blades, and marine structures, such as boats, where LVI events, such as tool drop and in-service strikes, are critical design concerns. While the methodology could be extended to defense structures, where high-velocity impact is of concern, the results are focused on civilian applications.
Recommendations for future studies are listed as follows:
  • Incorporate an interlaminar damage model: Future studies could include a more comprehensive damage model to account for interlaminar damage, i.e., delamination. Furthermore, this damage model can be used to assess the capability of CSEs in detecting delamination size—a critical post-impact metric. Additionally, the inclusion of interlaminar damage may enhance the ability of S4R elements to detect thickness variations during contact, leading to more accurate stress predictions during damage initiation and evolution.
  • Parametric study on impact energy and velocity: Future studies could involve varying impact energies and velocities to assess the accuracy of CSE. This will help establish an envelope within which CSEs can be used for LVI modeling of composite laminates.
  • Sub-component and component assessment: This paper is limited to coupon-level analyses. Extending the scope of this paper to sub-components, such as curved panels and stiffened skin, would enable an evaluation of how complex geometries and real-world boundary conditions affect the accuracy of CSEs.

Author Contributions

Conceptualization, A.B. and A.S.V.; Methodology, A.B. and A.S.V.; Software, A.B.; Validation, A.B.; Formal analysis, A.B.; Investigation, A.B.; Resources, A.S.V.; Data curation, A.B.; Writing—original draft preparation, A.B.; Writing—review and editing, A.S.V.; Visualization, A.B. and A.S.V.; Supervision, A.S.V.; Project administration, A.S.V.; Funding acquisition, A.S.V. All authors have read and agreed to the published version of the manuscript.

Funding

This work is mainly supported by start-up funds from the Office of the Vice President for Research and Dean of the Graduate School, University of Maine. The authors also acknowledge financial support from the Department of Mechanical Engineering, University of Maine and the Governor’s Energy Office (GEO), State of Maine. The authors gratefully acknowledge support from the Janet Waldron Doctoral Research Fellowships (JWDRF), which provides funding to enhance doctoral research productivity and degree completion at the University of Maine.

Data Availability Statement

The Abaqus files developed in this paper are openly accessible at: https://github.com/amirbaharvand66/abaqus_lvi_cse, accessed on 2 October 2025.

Acknowledgments

Amir Baharvand would like to thank Stephen Cousins (former staff of the Advanced Computing Group at the University of Maine) and Chris Dalton (Cyberinfrastructure Engineer at the Advanced Research Computing, Security, and Information Management (ARCSIM), the University of Maine) for their support and assistance throughout this work. The authors also gratefully acknowledge the use of High-Performance Computing provided by the University of Maine.

Conflicts of Interest

The authors declare no conflicts of interest.

Abbreviations

BVIDBarely visible impact damage
CDMContinuum damage model
CSEConventional shell element
DOFDegrees of freedom
EAMEnergy absorption mechanism
FEFinite element
FEAFinite element analysis
FEMFinite element method
FSDTFirst-order shear deformation theory
LVILow-velocity impact
RBCRigid body constraint
RPReference point

Appendix A. Definitions

Barely visible impact damage: It refers to impact-induced damage that, although may exhibit minimal or no sign of damage on the exterior surface, can cause complex internal damage within a composite structure. BVID may not be easily detectable but can compromise the structural integrity and reduce the residual strength of the composite structures [].
Clearance–Overclosure: Clearance refers to the distance between two separated surfaces. Overclosure refers to the distance between two surfaces that have penetrated each other.
Continuum shell elements: They combine the characteristics of both solid elements—by requiring the modeling of the thickness—and shell theory—by enforcing first-order shear deformation theory—through specific interpolation functions. This family of elements in Abaqus is applicable to both thin and thick shells and is less expensive than solid elements [].
Effective stress: It refers to the stress exerted on a damaged element and counteracts the internal forces [].
Element characteristic length: It refers to a typical dimension of an element and is a function of element geometry and formulation []. For instance, the characteristic length of the S4R element is the square root of the element area.
Mesh control: It refers to specific techniques used to generate the mesh. Abaqus offers several mesh control techniques, including structures, free, and sweep. Each technique has its advantages and limitations, and the choice of the appropriate technique depends on the model geometry.
Small and large problems: In the context of finite element methods, the problem size refers to the problem’s complexity and computational cost, which depend on the number of DOF, sources of nonlinearity, and level of detail. In this paper, the problem size specifically refers to the number of DOF, which depends on the element formulation. Therefore, we define small problems as those with fewer DOF with less computational cost and large problems as those with higher numbers of DOF with higher computational cost [].
Peak contact force: The maximum load a composite laminate can withstand without significant damage, where composite stiffness and strength start degrading due to EAMs such as fiber breakage, interfacial debonding, and fiber pull-out [].
Phenomenological damage law: a mathematical model that describes the material behavior in terms of damage and response to external loads.
Impact behavior: Various aspects of impact response, including contact force, time, and displacement.

Appendix B. Constitutive Damage Models of Composite Laminates
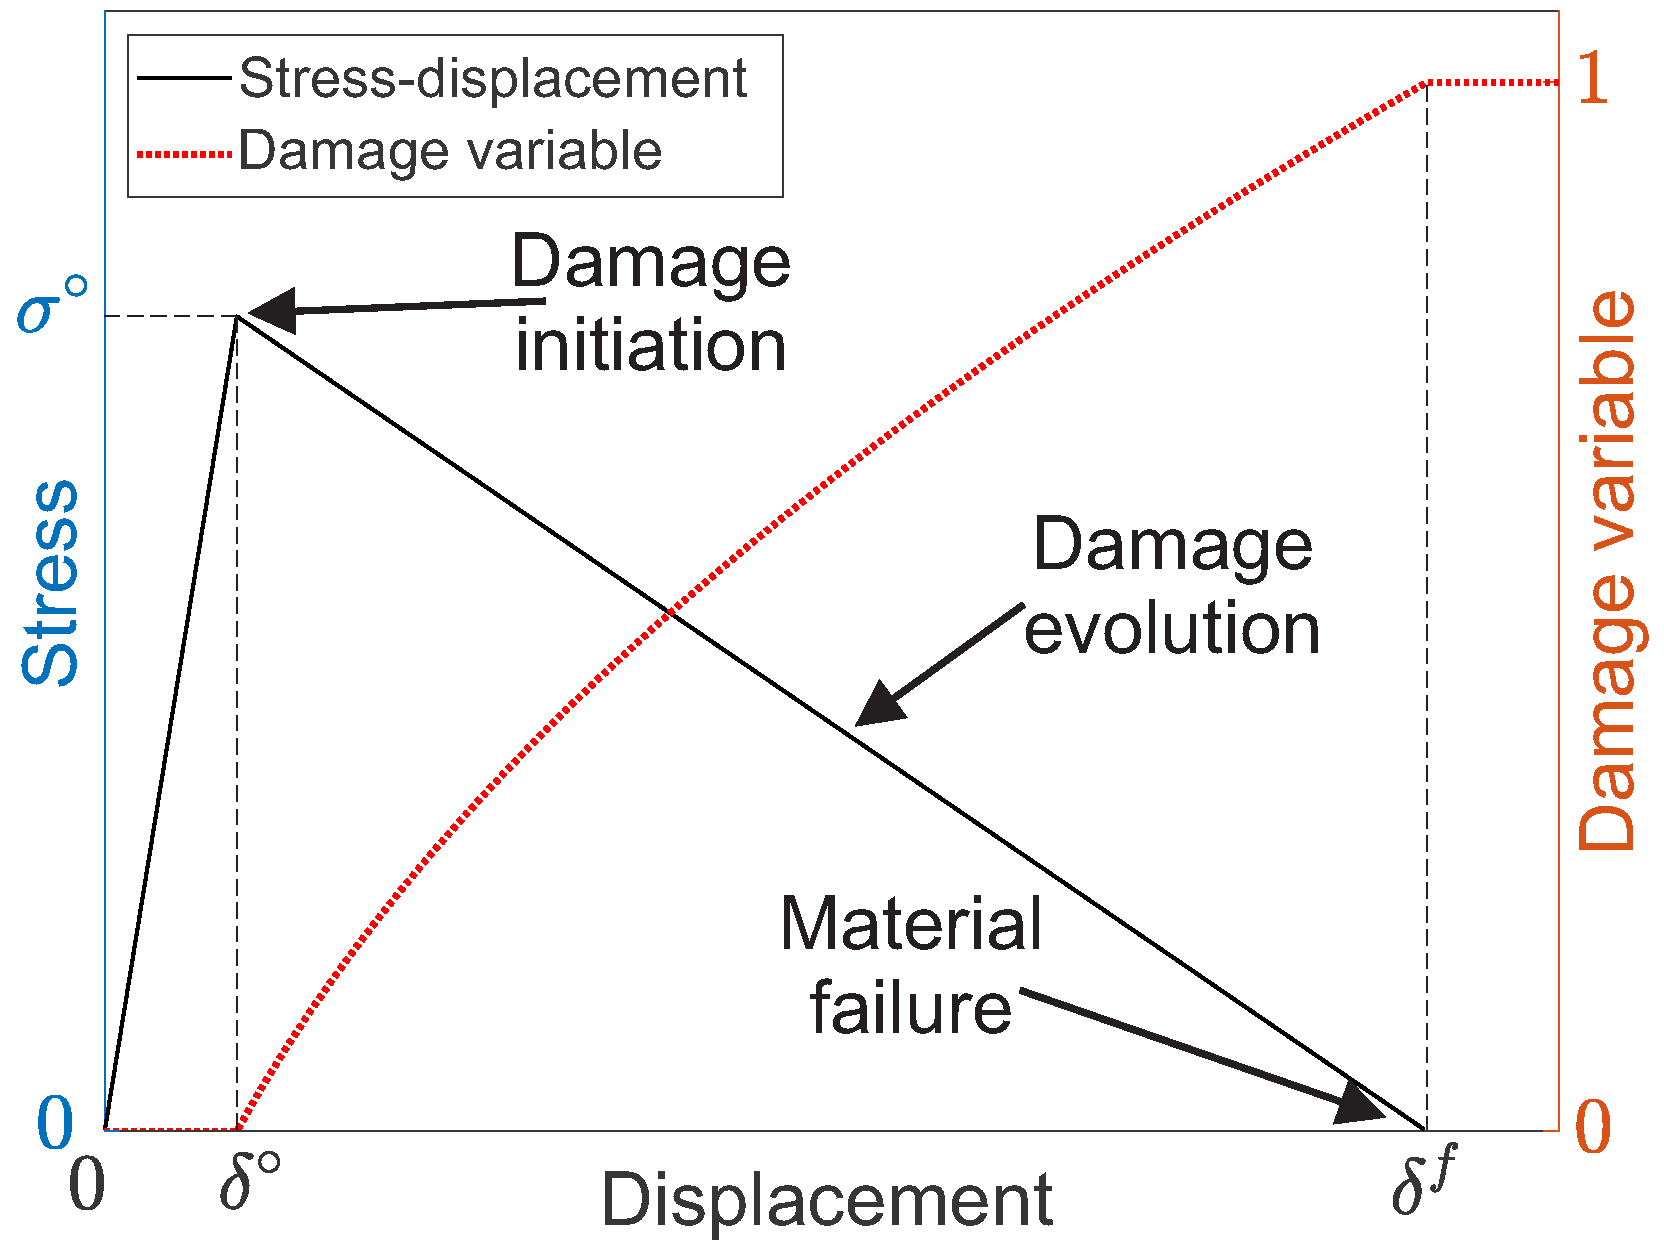
Abaqus uses a bilinear damage model for the progressive failure of composite laminates. This model is illustrated in Figure A1 and comprises two distinct regions: (I) damage initiation and (II) damage evolution. The initial linear stress–displacement curve (solid black line) represents the undamaged elastic response and increases linearly up to δ o , the displacement at which the peak stress σ o is reached. This corresponds to the damage initiation point. Beyond this point, the damage evolves according to a linear degradation law between stress and displacement, as indicated by the descending solid black line. During the damage evolution, the damage variable (dotted red line) increases monotonically from zero (undamaged) to one (material failure), leading to a gradual reduction in material stiffness.
Figure A1. A schematic of the damage initiation and evolution models implemented in Abaqus [].
Damage initiation: In this paper, damage initiation is governed by the Hashin failure criterion. The Hashin failure criterion is based on the principles of continuum mechanics and is developed for unidirectional fiber-reinforced composites with linear elastic behavior. This failure criterion assumes (I) a plane stress state, (II) independent fiber and matrix failure modes, and (III) a quadratic polynomial function for the matrix failure []. It has the following four distinct failure criteria, as provided in []:
Fiber tensile failure ( σ ^ 11 0 ) : F f t = σ 11 ^ X t 2 Fiber compressive failure ( σ ^ 11 < 0 ) : F f c = σ 11 ^ X c 2 Matrix tensile failure ( σ ^ 22 0 ) : F m t = σ 22 ^ Y t 2 + σ 12 ^ S l 2 Matrix compressive failure ( σ ^ 22 < 0 ) : F m c = σ 22 ^ 2 S t 2 + Y c 2 S t 2 1 σ 22 ^ Y c + σ 12 ^ S l 2
where X t and X c are the tensile and compressive tensile strength in the fiber direction, Y t and Y c are the tensile and compressive strength in the transverse fiber direction, S l and S t are the longitudinal and transverse in-plane shear strength. σ ^ 11 , σ ^ 22 , τ ^ 12 are the components of the effective stress tensor. Prior to the damage initiation, σ ^ = σ , where σ is the Cauchy stress tensor.
Damage evolution: Abaqus CDM [] is a phenomenological damage model that captures only fiber damage due to normal stress and matrix damage due to transverse and shear stresses. Additionally, it is limited to transversely isotropic materials and assumes linear elastic behavior for stress–strain relations and nonlinear behavior for damage. The unloading is also assumed to be linear, and the damage incurred during the loading does not progress during unloading. This damage model does not account for delamination, fiber/matrix interfacial debonding, or void growth.
Once the damage initiates, the laminate stiffness degrades and the effective stress tensor is modified for all four failure criteria in Equation (A1). This corresponds to the point where the damage variable is no longer zero, as illustrated in Figure A1. At this instant, σ ^ = M σ , where M is defined according to Equation (A2).
M = 1 1 d f 0 0 0 1 1 d m 0 0 0 1 1 d s
d f , d m , and d s are internal damage variables used to characterize the damage of the fiber, matrix, and shear, respectively, and are computed according to Equation (A4), discussed later in this section. During the damage evolution, Abaqus utilizes a continuum damage model ( σ = C ( d ) ϵ ), where ϵ is the elastic strain and C ( d ) is the constitutive tensor, computed according to Equation (A3).
C ( d ) = 1 D ( 1 d f ) E 11 ( 1 d f ) ( 1 d m ) ν 21 E 11 0 ( 1 d f ) ( 1 d m ) ν 12 E 22 ( 1 d m ) E 22 0 0 0 ( 1 d s ) μ 12 D
where D = 1 ( 1 d f ) ( 1 d m ) ν 12 ν 21 . E 11 and E 22 are longitudinal and transverse Young’s modulus. μ 12 is the shear modulus, ν 12 and ν 21 are the Poisson’s ratios, and it requires ν 12 ν 21 < 1 to ensure C ( d ) is positive definite (for any vector, v and tensor, U , v . Uv 0 , and v . Uv = 0 if and only if v = 0 []). d f , d m , and d s are determined from Equation (A5) according to the criteria in Equation (A4) for various fiber and matrix failure modes.
d f = d f t if σ ^ 11 0 d f c if σ ^ 11 < 0 d m = d m t if σ ^ 22 0 d m c if σ ^ 22 < 0 d s = 1 ( 1 d f t ) ( 1 d f c ) ( 1 d m t ) ( 1 d m c )
The internal damage variables in Abaqus are displacement-based [] and are computed for each failure in Equation (A1) using Equation (A5).
d j = δ j f ( δ j δ j o ) δ j ( δ j f δ j o ) where j = t ( tension ) and j = c ( compression )
where G c is the critical energy release rate and represents the area under the curve of the solid line in Figure A1. δ f is the displacement at which the material is fully damaged and corresponds to a damage state of one, as shown in Figure A1. For each failure mode, δ f is determined according to Equation (A6).
Fiber failure : δ j f = 2 G j c X j , j = t if σ ^ 11 0 c if σ ^ 11 < 0 Matrix failure : δ j f = 2 G j c Y j , j = t if σ ^ 22 0 c if σ ^ 22 < 0
δ is the local displacement and is a function of the element characteristic length, L c . For the S4R element, the characteristic length is the square root of the shell element area []. Assuming no coupling between the axial strain, ϵ 11 , and in-plane shear strain, ϵ 12 :
Fiber failure : δ = L c ε , ε = ϵ 11 if σ ^ 11 0 ϵ 11 if σ ^ 11 < 0 Matrix failure : δ = L c ε 2 + ϵ 12 2 , ε = ϵ 22 if σ ^ 22 0 ϵ 22 if σ ^ 22 < 0
where is the Macaulay operator and is defined as ε = ε + | ε | 2 . δ o is the displacement prior to damage initiation and for each failure mode is computed according to Equation (A8).
Fiber failure : δ o = X j E 11 , j = t if σ ^ 11 0 c if σ ^ 11 < 0 Matrix failure : δ o = Y j E 22 , j = t if σ ^ 22 0 c if σ ^ 22 < 0

Appendix C. Material Properties and Impact Parameters

Nonreported mechanical properties are designated by * next to the corresponding property and assumed based on the available properties. Furthermore, nonreported transverse shear modulus, μ 23 , are designated by and calculated according Equation (A9):
μ 23 = E 22 2 ( 1 + ν 23 )
where E 22 and ν 23 are the transverse Young’s modulus and out-of-plane Poisson’s ratio, respectively.
Table A1. Physical and material properties and specifications of T800H/3900-2 epoxy composite laminate. Laminate stacking sequence: [45/90/−45/0] 3 s [].
PropertySymbolValueUnitReference
Density ρ 1550 kg/m 3 []
Longitudinal Young’s modulus E 11 152.4GPa[]
Transverse Young’s modulus  E 22 9.2GPa[]
In-plane shear modulus μ 12 4.3GPa[]
Out-of-plane shear modulus μ 23 3.0GPa-
In-plane Poisson’s ratio ν 12 0.35-[]
Out-of-plane Poisson’s ratio ν 23 0.53-[]
Longitudinal tensile strength X t 2089MPa[]
Longitudinal compressive strength X c 1482MPa[]
Transverse tensile strength Y t 79MPa[]
Transverse compressive strength Y c 231MPa[]
Longitudinal shear strength S l 133MPa[]
Transverse shear strength * S t 133MPa-
Longitudinal tensile fracture energy G t c 133 kJ/m 2 []
Longitudinal compressive fracture energy G c c 40 kJ/m 2 []
Transverse tensile fracture energy G t t c 0.5 kJ/m 2 []
Transverse compressive fracture energy G t c c 1.6 kJ/m 2 []
Dimension (thickness × length × width) t × l × w 4.65 × 127 × 76.2 mm 2 []
Table A2. Physical and material properties and specifications of TENAX-E HTS40 F13 12K/RTM 6 composite laminate with 2, 6, and 12 mm thickness. The 2 mm laminate stacking sequence: [∓45/0/90]s. The 6 mm laminate stacking sequence: [∓45/0/90/±45/90/0/∓45/0/90]s. The 12 mm laminate stacking sequence: [∓45/90/0/±45/0/90/∓45/90/0/∓45/0/90/±45/90/0/∓45/0/90]s [].
PropertySymbolValueUnit
Density ρ 1770 kg/m 3
Longitudinal Young’s modulus E 11 140GPa
Transverse Young’s modulus E 22 8.6GPa
In-plane shear modulus μ 12 4.2GPa
Out-of-plane shear modulus  μ 23 3.3GPa
In-plane Poisson’s ratio ν 12 0.3-
Out-of-plane Poisson’s ratio * ν 23 0.3-
Longitudinal tensile strength X t 2160MPa
Longitudinal compressive strength X c 1236MPa
Transverse tensile strength Y t 67MPa
Transverse compressive strength * Y c 67MPa
Longitudinal shear strength S l 70MPa
Transverse shear strength * S t 70MPa
Longitudinal tensile fracture energy G t c 120 kJ/m 2
Longitudinal compressive fracture energy G c c 30 kJ/m 2
Transverse tensile fracture energy G t t c 0.385 kJ/m 2
Transverse compressive fracture energy G t c c 1.5 kJ/m 2
Dimension (length × width) l × w 150 × 100 mm 3
Table A3. Physical and material properties and specifications of unidirectional carbon epoxy composite laminate. Laminate stacking sequence: [±45/0 2 /90/0] 2 s [].
PropertySymbolValueUnit
Density ρ 1600 kg/m 3
Longitudinal Young’s modulus E 11 149.5GPa
Transverse Young’s modulus E 22 8.43GPa
In-plane shear modulus μ 12 4.2GPa
Out-of-plane shear modulus μ 23 2.52GPa
In-plane Poisson’s ratio ν 12 0.3-
Out-of-plane Poisson’s ratio ν 23 0.45-
Longitudinal tensile strength X t 2143MPa
Longitudinal compressive strength X c 1034MPa
Transverse tensile strength Y t 75MPa
Transverse compressive strength Y c 250MPa
Longitudinal shear strength S l 108MPa
Transverse shear strength S t 95MPa
Longitudinal tensile fracture energy G t c 30.72 kJ/m 2
Longitudinal compressive fracture energy G c c 7.15 kJ/m 2
Transverse tensile fracture energy G t t c 0.667 kJ/m 2
Transverse compressive fracture energy G t c c 7.41 kJ/m 2
Dimension (thickness × length × width) t × l × w 4.46 × 150 × 100 mm 3

References

  1. Daniel, I.; Ishai, O. Engineering Mechanics of Composite Materials, 2nd ed.; Oxford University Press: Oxford, UK, 2006. [Google Scholar]
  2. Bibo, G.A.; Hogg, P.J.; Backhouse, R.; Mills, A. Carbon-fibre non-crimp fabric laminates for cost-effective damage-tolerant structures. Compos. Sci. Technol. 1998, 58, 129–143. [Google Scholar] [CrossRef]
  3. Shyr, T.W.; Pan, Y.H. Impact resistance and damage characteristics of composite laminates. Compos. Struct. 2003, 62, 193–203. [Google Scholar] [CrossRef]
  4. Kazemian, M.; Cherniaev, A. Prediction of Damage in Non-Crimp Fabric Composites Subjected to Transverse Crushing: A Comparison of Two Constitutive Models. J. Compos. Sci. 2022, 6, 224. [Google Scholar] [CrossRef]
  5. Zhang, N.; Zhou, G.; Guo, X.; Xuan, S.; Wei, D.; Wang, X.; Cai, D. High-velocity impact damage and compression after impact behavior of carbon fiber composite laminates: Experimental study. Int. J. Impact Eng. 2023, 181, 104749. [Google Scholar] [CrossRef]
  6. Pascoe, J.A. Slow-growth damage tolerance for fatigue after impact in FRP composites: Why current research won’t get us there. Theor. Appl. Fract. Mech. 2021, 116, 103127. [Google Scholar] [CrossRef]
  7. Davies, G.A.; Olsson, R. Impact on composite structures. Aeronaut. J. 2004, 108, 541–563. [Google Scholar] [CrossRef]
  8. Verma, A.S.; Yan, J.; Hu, W.; Jiang, Z.; Shi, W.; Teuwen, J.J. A review of impact loads on composite wind turbine blades: Impact threats and classification. Renew. Sustain. Energy Rev. 2023, 178, 113261. [Google Scholar] [CrossRef]
  9. Hart, K.R.; Chia, P.X.; Sheridan, L.E.; Wetzel, E.D.; Sottos, N.R.; White, S.R. Comparison of Compression-After-Impact and Flexure-After-Impact protocols for 2D and 3D woven fiber-reinforced composites. Compos. Part A Appl. Sci. Manuf. 2017, 101, 471–479. [Google Scholar] [CrossRef]
  10. Liu, P.F.; Liao, B.B.; Jia, L.Y.; Peng, X.Q. Finite element analysis of dynamic progressive failure of carbon fiber composite laminates under low velocity impact. Compos. Struct. 2016, 149, 408–422. [Google Scholar] [CrossRef]
  11. Zhou, J.; Wen, P.; Wang, S. Finite element analysis of a modified progressive damage model for composite laminates under low-velocity impact. Compos. Struct. 2019, 225, 111113. [Google Scholar] [CrossRef]
  12. Zou, J.; Lei, Z.; Bai, R.; Liu, D.; Liu, H.; Huang, X.; Yan, C. Damage evolution and failure mechanism of asymmetric composite laminates under low-velocity impact and compression after impact. Thin-Walled Struct. 2023, 182, 110177. [Google Scholar] [CrossRef]
  13. Huang, L.; Tao, Y.; Sun, J.; Zhang, D.; Zhao, J. Assessment of numerical modeling approaches for thin composite laminates under low-velocity impact. Thin-Walled Struct. 2023, 191, 111053. [Google Scholar] [CrossRef]
  14. Ni, K.; Chen, Q.; Wen, J.; Cai, Y.; Zhu, Z.; Li, X. Low-velocity impact and post-impact compression properties of carbon/glass hybrid yacht composite materials. Ocean Eng. 2024, 292, 116448. [Google Scholar] [CrossRef]
  15. Cantwell, W.J.; Morton, J. The impact resistance of composite materials—A review. Composites 1991, 22, 347–362. [Google Scholar] [CrossRef]
  16. Gemi, L. Investigation of the effect of stacking sequence on low velocity impact response and damage formation in hybrid composite pipes under internal pressure. A comparative study. Compos. Part B Eng. 2018, 153, 217–232. [Google Scholar] [CrossRef]
  17. Barouni, A.K.; Dhakal, H.N. Damage investigation and assessment due to low-velocity impact on flax/glass hybrid composite plates. Compos. Struct. 2019, 226, 111224. [Google Scholar] [CrossRef]
  18. Bakhori, S.N.M.; Hassan, M.Z.; Bakhori, N.M.; Jamaludin, K.R.; Ramlie, F.; Daud, M.Y.M.; Aziz, S.A. Physical, Mechanical and Perforation Resistance of Natural-Synthetic Fiber Interply Laminate Hybrid Composites. Polymers 2022, 14, 1322. [Google Scholar] [CrossRef]
  19. Shah, S.Z.; Karuppanan, S.; Megat-Yusoff, P.S.; Sajid, Z. Impact resistance and damage tolerance of fiber reinforced composites: A review. Compos. Struct. 2019, 217, 100–121. [Google Scholar] [CrossRef]
  20. Singh, K.K.; Shinde, M. Impact Behavior of Fibre Reinforced Laminates; Springer: Singapore, 2022. [Google Scholar] [CrossRef]
  21. Greenhalgh, E.S. The influence of fibre architecture in the failure of polymer composites. In Failure Analysis and Fractography of Polymer Composites; Woodhead Publishing Limited: London, UK, 2009; pp. 279–355. [Google Scholar] [CrossRef]
  22. Loendersloot, R. Permeability of non-crimp fabric preforms. In Non-Crimp Fabric Composites; Woodhead Publishing Limited: London, UK, 2011; pp. 166–215. [Google Scholar] [CrossRef]
  23. Wan, L.; Ismail, Y.; Sheng, Y.; Ye, J.; Yang, D. A review on micromechanical modelling of progressive failure in unidirectional fibre-reinforced composites. Compos. Part C Open Access 2023, 10, 100348. [Google Scholar] [CrossRef]
  24. Cheryala, S.B.; Yerramalli, C.S. The role of fiber distribution on the in-situ resin behavior in the hybrid polymer composites. Mech. Mater. 2022, 173, 104446. [Google Scholar] [CrossRef]
  25. Reddy, Y.S.; Moorthy, C.M.; Reddy, J.N. Non-linear progressive failure analysis of laminated composite plates. Int. J. Non-Linear Mech. 1995, 30, 629–649. [Google Scholar] [CrossRef]
  26. Kim, Y.; Davalos, J.F.; Barbero, E.J. Progressive Failure Analysis of Laminated Composite Beams. J. Compos. Mater. 1996, 30, 536–560. [Google Scholar] [CrossRef]
  27. Mohammadi, B.; Hosseini-Toudeshky, H.; Sadr-Lahidjani, M.H. Progressive damage analyses of angle-ply laminates exhibiting free edge effects using continuum damage mechanics with layer-wise finite element method. Fatigue Fract. Eng. Mater. Struct. 2008, 31, 549–568. [Google Scholar] [CrossRef]
  28. Borkowski, L.B.; Kumar, R.S.; Palliyaguru, U.R. Coupled Analysis of Low-Velocity Impact Damage and Compression after Impact Strength of Composite Laminates. J. Aerosp. Eng. 2021, 34, 04021051. [Google Scholar] [CrossRef]
  29. Carrera, E.; Elishakoff, I.; Petrolo, M. Who needs refined structural theories? Compos. Struct. 2021, 264, 113671. [Google Scholar] [CrossRef]
  30. Khalili, S.M.; Soroush, M.; Davar, A.; Rahmani, O. Finite element modeling of low-velocity impact on laminated composite plates and cylindrical shells. Compos. Struct. 2011, 93, 1363–1375. [Google Scholar] [CrossRef]
  31. Bogenfeld, R.; Kreikemeier, J.; Wille, T. Review and benchmark study on the analysis of low-velocity impact on composite laminates. Eng. Fail. Anal. 2018, 86, 72–99. [Google Scholar] [CrossRef]
  32. González, E.V.; Maimí, P.; Martín-Santos, E.; Soto, A.; Cruz, P.; de la Escalera, F.M.; de Aja, J.R.S. Simulating drop-weight impact and compression after impact tests on composite laminates using conventional shell finite elements. Int. J. Solids Struct. 2018, 144–145, 230–247. [Google Scholar] [CrossRef]
  33. Schwab, M.; Todt, M.; Wolfahrt, M.; Pettermann, H.E. Failure mechanism based modelling of impact on fabric reinforced composite laminates based on shell elements. Compos. Sci. Technol. 2016, 128, 131–137. [Google Scholar] [CrossRef]
  34. Verma, A.S.; Vedvik, N.P.; Haselbach, P.U.; Gao, Z.; Jiang, Z. Comparison of numerical modelling techniques for impact investigation on a wind turbine blade. Compos. Struct. 2019, 209, 856–878. [Google Scholar] [CrossRef]
  35. Verma, A.S.; Jiang, Z.; Vedvik, N.P.; Gao, Z.; Ren, Z. Impact assessment of a wind turbine blade root during an offshore mating process. Eng. Struct. 2019, 180, 205–222. [Google Scholar] [CrossRef]
  36. Tessitore, N.; Riccio, A. A novel FEM model for biaxial non-crimp fabric composite materials under tension. Comput. Struct. 2006, 84, 1200–1207. [Google Scholar] [CrossRef]
  37. Tserpes, K.I.; Labeas, G.N. Mesomechanical analysis of non-crimp fabric composite structural parts. Compos. Struct. 2009, 87, 358–369. [Google Scholar] [CrossRef]
  38. Alabbad, M.; Vel, S.S.; Lopez-Anido, R.A. Computational model for predicting the low-velocity impact resistance and tolerance of composite laminates. Compos. Part B Eng. 2022, 244, 110187. [Google Scholar] [CrossRef]
  39. Raju, K.; Tay, T.E.; Tan, V.B.C. A review of the FE2 method for composites. Multiscale Multidiscip. Model. Exp. Des. 2021, 4, 1–24. [Google Scholar] [CrossRef]
  40. Li, S.; Sitnikova, E. Applications to textile composites. In Representative Volume Elements and Unit Cells; Woodhead Publishing: London, UK, 2020; pp. 371–415. [Google Scholar] [CrossRef]
  41. Bouvet, C.; Castanié, B.; Bizeul, M.; Barrau, J.J. Low velocity impact modelling in laminate composite panels with discrete interface elements. Int. J. Solids Struct. 2009, 46, 2809–2821. [Google Scholar] [CrossRef]
  42. Bouvet, C.; Rivallant, S.; Barrau, J.J. Low velocity impact modeling in composite laminates capturing permanent indentation. Compos. Sci. Technol. 2012, 72, 1977–1988. [Google Scholar] [CrossRef]
  43. Rivallant, S.; Bouvet, C.; Hongkarnjanakul, N. Failure analysis of CFRP laminates subjected to compression after impact: FE simulation using discrete interface elements. Compos. Part A Appl. Sci. Manuf. 2013, 55, 83–93. [Google Scholar] [CrossRef]
  44. Dubary, N.; Bouvet, C.; Rivallant, S.; Ratsifandrihana, L. Damage tolerance of an impacted composite laminate. Compos. Struct. 2018, 206, 261–271. [Google Scholar] [CrossRef]
  45. Trellu, A.; Bouvet, C.; Rivallant, S.; Ratsifandrihana, L. A new interface element connecting 3D finite elements with non-coincident nodes to simulate delamination in composite laminates. Compos. Struct. 2020, 252, 112694. [Google Scholar] [CrossRef]
  46. Shabani, P.; Li, L.; Laliberte, J.; Qi, G.; Rapking, D.; Mollenhauer, D. High-fidelity simulation of low-velocity impact damage in fiber-reinforced composite laminates using integrated discrete and continuum damage models. Compos. Struct. 2023, 313, 116910. [Google Scholar] [CrossRef]
  47. Sellitto, A.; Saputo, S.; Caprio, F.D.; Riccio, A.; Russo, A.; Acanfora, V. Numerical–Experimental Correlation of Impact-Induced Damages in CFRP Laminates. Appl. Sci. 2019, 9, 2372. [Google Scholar] [CrossRef]
  48. Ouyang, T.; Bao, R.; Sun, W.; Guan, Z.; Tan, R. A fast and efficient numerical prediction of compression after impact (CAI) strength of composite laminates and structures. Thin-Walled Struct. 2020, 148, 106588. [Google Scholar] [CrossRef]
  49. Chen, W.Q.; Lee, K.Y. Three-dimensional exact analysis of angle-ply laminates in cylindrical bending with interfacial damage via state-space method. Compos. Struct. 2004, 64, 275–283. [Google Scholar] [CrossRef]
  50. Chen, W.Q.; Cai, J.B.; Ye, G.R. Exact Solutions of Cross-Ply Laminates with Bonding Imperfections. AIAA J. 2012, 41, 2244–2250. [Google Scholar] [CrossRef]
  51. Lopes, C.S.; Sádaba, S.; González, C.; Llorca, J.; Camanho, P.P. Physically-sound simulation of low-velocity impact on fiber reinforced laminates. Int. J. Impact Eng. 2016, 92, 3–17. [Google Scholar] [CrossRef]
  52. Falcó, O.; Ávila, R.L.; Tijs, B.; Lopes, C.S. Modelling and simulation methodology for unidirectional composite laminates in a Virtual Test Lab framework. Compos. Struct. 2018, 190, 137–159. [Google Scholar] [CrossRef]
  53. Millen, S.L.; Ullah, Z.; Falzon, B.G. On the importance of finite element mesh alignment along the fibre direction for modelling damage in fibre-reinforced polymer composite laminates. Compos. Struct. 2021, 278, 114694. [Google Scholar] [CrossRef]
  54. Falcó, O.; Lopes, C.S.; Sommer, D.E.; Thomson, D.; Ávila, R.L.; Tijs, B.H. Experimental analysis and simulation of low-velocity impact damage of composite laminates. Compos. Struct. 2022, 287, 115278. [Google Scholar] [CrossRef]
  55. Rajaneesh, A.; Bruyneel, M. Low-velocity impact and compression after impact modeling of composites using modified mesoscale model. Compos. Struct. 2023, 311, 116821. [Google Scholar] [CrossRef]
  56. Leone, F.A.; Rose, C.A.; Jackson, W.C.; Seshadri, B.R. Low-Velocity Impact Analyses of Composite Panels Using Cohesive Zone Modeling and Continuum Damage Mechanics. In Proceedings of the AIAA SciTech Forum and Exposition, Orlando, FL, USA, 8–12 January 2024. [Google Scholar] [CrossRef]
  57. Systèmes, D. SIMULIA User Assistance 2021; Dassault Systèmes Simulia Corp: Waltham, MA, USA, 2021. [Google Scholar]
  58. Boudounit, H.; Tarfaoui, M.; Saifaoui, D.; Qureshi, Y. Parametric Study of Accidental Impacts on an Offshore Wind Turbine Composite Blade. J. Bio- Tribo-Corros. 2021, 7, 1–21. [Google Scholar] [CrossRef]
  59. Shabani, P.; Shabani, N. Fatigue life prediction of high-speed composite craft under slamming loads using progressive fatigue damage modeling technique. Eng. Fail. Anal. 2022, 131, 105818. [Google Scholar] [CrossRef]
  60. Stamoulis, K.; Georgantzinos, S.K.; Giannopoulos, G.I. Damage characteristics in laminated composite structures subjected to low-velocity impact. Int. J. Struct. Integr. 2020, 11, 670–685. [Google Scholar] [CrossRef]
  61. Kumar, K.; Surendran, S. Design and analysis of composite panel for impact loads in marine environment. Ships Offshore Struct. 2013, 8, 597–606. [Google Scholar] [CrossRef]
  62. Kumbasar, B.B.; Gider, B. The effects of mass scale and hourglass control for low velocity impact simulations on abaqus. In Proceedings of the AIAA Scitech 2021 Forum, Virtual, 11–15 & 19–21 January 2021; pp. 1–15. [Google Scholar] [CrossRef]
  63. Magomedov, I.A.; Sebaeva, Z.S. Comparative study of finite element analysis software packages. J. Physics Conf. Ser. 2020, 1515, 032073. [Google Scholar] [CrossRef]
  64. Maziz, A.; Tarfaoui, M.; Gemi, L.; Rechak, S.; Nachtane, M. A progressive damage model for pressurized filament-wound hybrid composite pipe under low-velocity impact. Compos. Struct. 2021, 276, 114520. [Google Scholar] [CrossRef]
  65. Hashin, Z.; Rotem, A. A Fatigue Failure Criterion for Fiber Reinforced Materials. J. Compos. Mater. 1973, 7, 448–464. [Google Scholar] [CrossRef]
  66. Hashin, Z. Failure Criteria for Unidirectional Fiber Composites. J. Appl. Mech. 1980, 47, 329–334. [Google Scholar] [CrossRef]
  67. Puck, A.; Schürmann, H. Failure analysis of FRP laminates by means of physically based phenomenological models. Compos. Sci. Technol. 2002, 62, 1633–1662. [Google Scholar] [CrossRef]
  68. Puck, A.; Kopp, J.; Knops, M. Guidelines for the determination of the parameters in Puck’s action plane strength criterion. Compos. Sci. Technol. 2002, 62, 371–378. [Google Scholar] [CrossRef]
  69. Davila, C.G.; Camanho, P.P. Failure Criteria for FRP Laminates in Plane Stress; Technical report; NASA: Washington, DC, USA, 2003. [Google Scholar]
  70. Pinho, S.T.; Darvizeh, R.; Robinson, P.; Schuecker, C.; Camanho, P.P. Material and structural response of polymer-matrix fibre-reinforced composites. J. Compos. Mater. 2012, 46, 2313–2341. [Google Scholar] [CrossRef]
  71. Kazemianfar, B.; Nami, M.R. Influence of oblique low velocity impact on damage behavior of 2D and 3D woven composites: Experimental and numerical methods. Thin-Walled Struct. 2021, 167, 108253. [Google Scholar] [CrossRef]
  72. Sun, J.; Huang, L.; Zhao, J. Oblique Low-Velocity Impact Response and Damage Behavior of Carbon-Epoxy Composite Laminates. Materials 2022, 15, 5256. [Google Scholar] [CrossRef] [PubMed]
  73. ASTM D7136/D7136M-15; Test Method for Measuring the Damage Resistance of a Fiber-Reinforced Polymer Matrix Composite to a Drop-Weight Impact Event. ASTM International: West Conshohocken, PA, USA, 2020; Volume 15.03. [CrossRef]
  74. Williams, K.V.; Vaziri, R. Application of a damage mechanics model for predicting the impact response of composite materials. Comput. Struct. 2001, 79, 997–1011. [Google Scholar] [CrossRef]
  75. Sachse, R.; Pickett, A.K.; Middendorf, P. Simulation of impact and residual strength of thick laminate composites. Compos. Part B Eng. 2020, 195, 108070. [Google Scholar] [CrossRef]
  76. Loganathan, T.M.; Sultan, M.T.; Gobalakrishnan, M.K.; Muthaiyah, G. Ballistic impact response of laminated hybrid composite materials. In Mechanical and Physical Testing of Biocomposites, Fibre-Reinforced Composites and Hybrid Composites; Woodhead Publishing: London, UK, 2019; pp. 171–191. [Google Scholar] [CrossRef]
  77. Phadnis, V.A.; Roy, A.; Silberschmidt, V.V. Dynamic damage in FRPs: From low to high velocity. In Dynamic Deformation, Damage and Fracture in Composite Materials and Structures, Second Edition; Woodhead Publishing: London, UK, 2023; pp. 165–193. [Google Scholar] [CrossRef]
  78. Chen, D.; Luo, Q.; Meng, M.; Sun, G. Low velocity impact behavior of interlayer hybrid composite laminates with carbon/glass/basalt fibres. Compos. Part B Eng. 2019, 176, 107191. [Google Scholar] [CrossRef]
  79. Subadra, S.P.; Griskevicius, P.; Yousef, S. Low velocity impact and pseudo-ductile behaviour of carbon/glass/epoxy and carbon/glass/PMMA hybrid composite laminates for aircraft application at service temperature. Polym. Test. 2020, 89, 106711. [Google Scholar] [CrossRef]
  80. Zhang, C.; Rao, Y.; Li, W. Low-velocity impact behavior of intralayer hybrid composites based on carbon and glass non-crimp fabric. Compos. Struct. 2020, 234, 111713. [Google Scholar] [CrossRef]
  81. Lyu, Q.; Wang, B.; Zhao, Z.; Guo, Z. Damage and failure analysis of hybrid laminates with different ply-stacking sequences under low-velocity impact and post-impact compression. Thin-Walled Struct. 2022, 180, 109743. [Google Scholar] [CrossRef]
  82. Matzenmiller, A.; Lubliner, J.; Taylor, R.L. A constitutive model for anisotropic damage in fiber-composites. Mech. Mater. 1995, 20, 125–152. [Google Scholar] [CrossRef]
  83. Boulbes, R.J. Troubleshooting Finite-Element Modeling with Abaqus, 1st ed.; Springer International Publishing: Cham, Switzerland, 2020. [Google Scholar] [CrossRef]
  84. Tsai, S.W.; Hahn, H.T. Introduction to Composite Materials, 1st ed.; CRC Press: Boca Raton, FL, USA, 1980. [Google Scholar]
  85. Zhang, J.; Zhang, X. An efficient approach for predicting low-velocity impact force and damage in composite laminates. Compos. Struct. 2015, 130, 85–94. [Google Scholar] [CrossRef]
  86. Chapra, S.C. Applied Numerical Methods with MATLAB for Engineers and Scientists, 5th ed.; McGraw Hill LLC: Columbus, OH, USA, 2023. [Google Scholar]
  87. Silva, M.A.; Cismaşiu, C.; Chiorean, C.G. Numerical simulation of ballistic impact on composite laminates. Int. J. Impact Eng. 2005, 31, 289–306. [Google Scholar] [CrossRef]
  88. Cook, R.D.; Malkus, D.S.; Plesha, M.E.; Witt, R.J.W. Concept and Applications of Finite Element Analysis, 4th ed.; Wiley: Hoboken, NJ, USA, 2001; p. 733. [Google Scholar]
  89. Belytschko, T.; Ong, J.S.J.; Liu, W.K.; Kennedy, J.M. Hourglass control in linear and nonlinear problems. Comput. Methods Appl. Mech. Eng. 1984, 43, 251–276. [Google Scholar] [CrossRef]
  90. Hoffmann, M.; Zimmermann, K.; Bautz, B.; Middendorf, P. A new specimen geometry to determine the through-thickness tensile strength of composite laminates. Compos. Part B Eng. 2015, 77, 145–152. [Google Scholar] [CrossRef]
  91. Hidalgo, J.P.; Pironi, P.; Hadden, R.M.; Welch, S. A framework for evaluating the thermal behaviour of carbon fibre composite materials. In Proceedings of the 2nd IAFSS European Symposium of Fire Safety Science, Nicosia, Cyprus, 16–18 June 2015; pp. 195–200. [Google Scholar]
  92. Zimmermann, K.; Zenkert, D.; Siemetzki, M. Testing and analysis of ultra thick composites. Compos. Part B Eng. 2010, 41, 326–336. [Google Scholar] [CrossRef]
  93. Nilsson, S.; Bredberg, A.; Asp, L.E. Effects of CFRP laminate thickness on bending after impact strength. Plast. Rubber Compos. 2009, 38, 61–66. [Google Scholar] [CrossRef]
  94. Nettles, A.T.; Hromisin, S.M. Normalization of Impact Energy by Laminate Thickness for Compression After Impact Testing; Technical Report; NASA: Washington, DC, USA, 2013. [Google Scholar]
  95. Damghani, M.; Saddler, J.; Sammon, E.; Atkinson, G.A.; Matthews, J.; Murphy, A. An experimental investigation of the impact response and Post-impact shear buckling behaviour of hybrid composite laminates. Compos. Struct. 2023, 305, 116506. [Google Scholar] [CrossRef]
  96. Roberts, E.M.; Justusson, B.P.; Schaefer, J.D.; Wanthal, S.P. Improved benchmarking of cohesive elements in abaqus standard for predicting disbond and delamination in composite structures. In Proceedings of the AIAA Scitech 2021 Forum, Virtual, 11–15 & 19–21 January 2021; pp. 1–19. [Google Scholar] [CrossRef]
  97. Reddy, J.N. Mechanics of Laminated Composite Plates and Shells: Theory and Analysis, Second Edition; CRC Press: Boca Raton, FL, USA, 2003. [Google Scholar] [CrossRef]
  98. Mallikarjuna; Kant, T. A critical review and some results of recently developed refined theories of fiber-reinforced laminated composites and sandwiches. Compos. Struct. 1993, 23, 293–312. [Google Scholar] [CrossRef]
  99. Teotia, M.; Soni, R.K. Applications of finite element modelling in failure analysis of laminated glass composites: A review. Eng. Fail. Anal. 2018, 94, 412–437. [Google Scholar] [CrossRef]
  100. Ambartsumian, S.A. Nontraditional theories of shells and plates. Appl. Mech. Rev. 2002, 55, R35–R44. [Google Scholar] [CrossRef]
  101. Abrate, S. Impact on Composite Structures; Cambridge University Press: Cambridge, UK, 1998. [Google Scholar] [CrossRef]
  102. Abdullah, S.I.B.S. Low Velocity Impact Testing on Laminated Composites. In Impact Studies of Composite Materials; Springer: Singapore, 2021; Chapter 1; pp. 1–17. [Google Scholar] [CrossRef]
  103. Reddy, J.N. A Refined Shear Deformation Theory for the Analysis of Laminated Plates; Technical Report; NASA: Washington, DC, USA, 1986. [Google Scholar]
  104. Reis, P.N.; Sousa, P.; Ferreira, L.M.; Coelho, C.A. Multi-impact response of semicylindrical composite laminated shells with different thicknesses. Compos. Struct. 2023, 310, 116771. [Google Scholar] [CrossRef]
  105. Thorsson, S.I.; Waas, A.M.; Rassaian, M. Low-velocity impact predictions of composite laminates using a continuum shell based modeling approach part A: Impact study. Int. J. Solids Struct. 2018, 155, 185–200. [Google Scholar] [CrossRef]
  106. Park, R.; Jang, J. Impact behavior of aramid fiber/glass fiber hybrid composites: The effect of stacking sequence. Polym. Compos. 2001, 22, 80–89. [Google Scholar] [CrossRef]
  107. Lai, W.M. Introduction to Continuum Mechanics, 4th ed.; Elsevier: Burlington, MA, USA, 2010. [Google Scholar]
  108. Camanho, P.P.; Davila, C.G. Mixed-Mode Decohesion Finite Elements for the Simulation of Delamination in Composite Materials; NASA/TM-2002-211737; NASA: Washington, DC, USA, 2002; pp. 1–37. [Google Scholar]
  109. Ghosh, A.; Sinha, P.K. Initiation and propagation of damage in laminated composite shells due to low velocity impact. Int. J. Crashworthiness 2005, 10, 379–388. [Google Scholar] [CrossRef]
  110. Caprino, G.; Iaccarino, P.; Lamboglia, A. The effect of shear on the rigidity in three-point bending of unidirectional CFRP laminates made of T800H/3900-2. Compos. Struct. 2009, 88, 360–366. [Google Scholar] [CrossRef]
  111. Liu, H.; Liu, J.; Ding, Y.; Zhou, J.; Kong, X.; Blackman, B.R.; Kinloch, A.J.; Falzon, B.G.; Dear, J.P. Effects of Impactor Geometry on the Low-Velocity Impact Behaviour of Fibre-Reinforced Composites: An Experimental and Theoretical Investigation. Appl. Compos. Mater. 2020, 27, 533–553. [Google Scholar] [CrossRef]
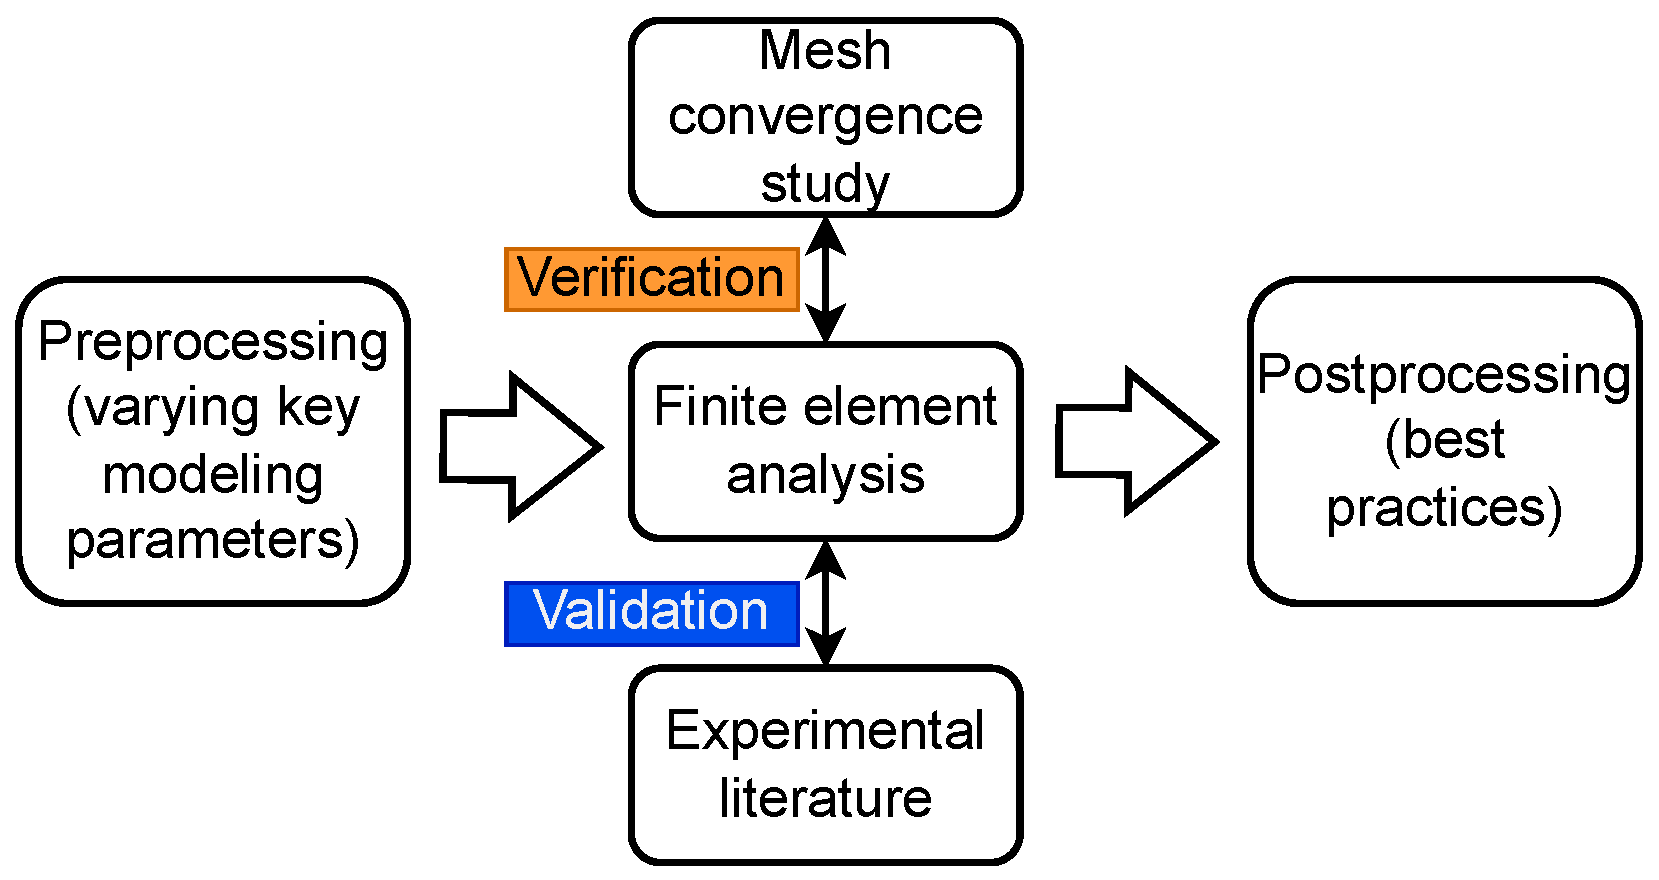
Disclaimer/Publisher’s Note: The statements, opinions and data contained in all publications are solely those of the individual author(s) and contributor(s) and not of MDPI and/or the editor(s). MDPI and/or the editor(s) disclaim responsibility for any injury to people or property resulting from any ideas, methods, instructions or products referred to in the content.

Article Metrics

Citations

Article Access Statistics

Multiple requests from the same IP address are counted as one view.