Article

Multi-Material Fused Filament Fabrication of TPU Composite Honeycombs Featuring Out-of-Plane Gradient Stiffness

by
Savvas Koltsakidis
1,
Konstantinos Tsongas
2,
Nikolaos Papas
1,
Eleftheria Maria Pechlivani
3 and
Dimitrios Tzetzis
1,*
1
Digital Manufacturing and Materials Characterization Laboratory, School of Science and Technology, International Hellenic University, 57001 Thessaloniki, Greece
2
Department of Industrial Engineering and Management, School of Engineering, International Hellenic University, 57001 Thessaloniki, Greece
3
Information Technologies Institute, Centre for Research and Technology Hellas, 57001 Thessaloniki, Greece
*
Author to whom correspondence should be addressed.
J. Compos. Sci. 2025, 9(11), 588; https://doi.org/10.3390/jcs9110588 (registering DOI)
Submission received: 8 October 2025 / Revised: 27 October 2025 / Accepted: 27 October 2025 / Published: 1 November 2025

Abstract

Gradient stiffness structures are increasingly recognized for their excellent energy absorption capabilities, particularly under challenging loading conditions. Most studies focus on varying the thickness of the structure in order to produce gradient stiffness. This work introduces an innovative approach to design honeycomb architectures with controlled gradient stiffness along the out-of-plane direction achieved by materials’ microstructure variations. The gradient is achieved by combining three types of thermoplastic polyurethane (TPU) materials: porous TPU, plain TPU, and carbon fiber (CF)-reinforced TPU. By varying the material distribution across the honeycomb layers, a smooth transition in stiffness is formed, improving both mechanical resilience and energy dissipation. To fabricate these structures, a dual-head 3D printer was employed with one head printed processed TPU with a chemical blowing agent to produce porous and plain sections, while the other printed a CF-reinforced TPU. By alternating between the two print heads and modifying the processing temperatures, honeycombs with up to three distinct stiffness zones were produced. Compression testing under out-of-plane loading revealed clear plateau and densification regions in the stress–strain curves. Pure CF-reinforced honeycombs absorbed the most energy at stress levels above ~4.5 MPa, while porous TPU honeycombs were more effective under stress levels below ~1 MPa. Importantly, the gradient stiffness honeycombs achieved a balanced energy absorption profile across a broader range of stress levels, offering enhanced performance and adaptability for applications like protective equipment, packaging, and automotive structures.

1. Introduction

Lightweight structures are essential in modern engineering applications, where reducing mass without compromising mechanical performance is critical. Such designs are pivotal in industries like aerospace, automotive, and protective equipment, where energy efficiency and material savings are paramount [1,2,3,4]. By minimizing weight, these structures contribute to improved fuel efficiency, reduced emissions, and enhanced overall performance [5,6].
Among various lightweight design strategies, honeycomb structures stand out due to their exceptional strength-to-weight ratio and energy absorption capabilities [7,8,9,10]. Their cellular geometry allows for efficient distribution and deformation control, making them ideal for impact mitigation applications [11,12]. Recent studies demonstrate the versatility of honeycomb structures in tuning mechanical properties through customization of cell size, shape, and wall thickness. Tailoring wall thickness gradients in 3D-printed honeycombs can significantly enhance specific energy absorption and efficiency, with increases of over 110% reported [13]. Bi-linearly graded wall thickness along the out-of-plane direction can improve energy absorption by up to 250% under high-impact conditions [14]. The relationship between cell wall thickness, Poisson’s ratio, and load-bearing capacity has been explored, with findings indicating that increasing wall thickness improves load-bearing responses but decreases energy absorption efficiency [15]. At micro- and nano-scales, compressive stress–strain relations are strongly dependent on cell wall thickness, with nano-sized honeycombs exhibiting tunable properties over a large range [16]. These studies highlight the potential for honeycomb structures to be optimized for specific mechanical requirements through careful design and fabrication techniques.
Advancements in additive manufacturing have revolutionized the production of complex geometries like honeycombs [17,18,19,20]. Particularly fused filament fabrication (FFF) allows for rapid prototyping and customization, enabling the creation of multi-material structures with varied mechanical properties within a single print [21,22,23,24]. This technology facilitates the fabrication of intricate designs that were previously challenging or impossible to achieve with traditional manufacturing methods. Recent research explores multi-material honeycomb structures fabricated using fused filament fabrication (FFF) for enhanced mechanical properties. Honeycomb structures demonstrated superior flexural strength and elastic modulus compared to other designs in mono-material and multi-material configurations [25]. Multi-material honeycomb structures exhibited improved energy absorption capabilities under static and dynamic loading conditions, with potential applications in crash-resistant components [26]. To address interface bonding strength concerns, interlacing infills were developed using layered depth material images, showing enhanced performance in tensile tests [27]. Bio-inspired architected multi-material lattices with hard shells and soft cores demonstrated tunable stiffness, strength, and energy absorption properties, achieving 2–3 times greater energy absorption capacity than single-phase lattices [28]. These advancements in multi-material honeycomb structures offer promising solutions for lightweight, high-performance applications.
Another significant advantage of FFF technology is its capability to work with various filaments composed of different materials. Thermoplastic polyurethane (TPU) emerges as a highly suitable material due to its flexibility and durability [29,30,31,32]. Modifying TPU with a chemical blowing agent produces a porous variant with reduced stiffness and density, ideal for low-stress energy absorption [33,34,35]. Conversely, reinforcing TPU with carbon fiber (CF) significantly increases stiffness and strength, making it better suited for high-stress applications [36,37,38,39]. By strategically integrating porous TPU, plain TPU, and CF-reinforced TPU into a single honeycomb structure, it is possible to engineer gradient stiffness tailored to specific performance requirements.
A promising approach in enhancing the performance of cellular structures is the incorporation of gradient stiffness, where different regions exhibit varying degrees of rigidity usually achieved by varying the structure’s thickness [40,41]. Gradient stiffness materials, which vary in mechanical properties across their structure, are increasingly used for energy absorption due to their ability to control stress distribution and reduce damage under impact. These materials are often inspired by biological systems such as bone, bamboo, and fish scales, which naturally exhibit gradient structures to balance strength and flexibility [42]. Gradient stiffness in cellular materials is increasingly valued for its ability to improve energy absorption, distribute stress more effectively, and reduce localized failure under mechanical loads. These features are critical for applications requiring lightweight, durable, and impact-resistant structures.
Although gradient stiffness has been studied previously, earlier work primarily depends on variations in thickness. In this study, a novel method is explored by fabricating honeycomb structures with out-of-plane gradient stiffness using 3D printing technology by leveraging different material’s microstructure variations. By leveraging a dual-head fused filament fabrication system, porous, plain, and carbon fiber (CF)-reinforced thermoplastic polyurethane (TPU) was combined within a single print. This configuration allows for spatial variation in stiffness, achieved through controlled deposition of different material compositions and the integration of a chemical blowing agent to introduce porosity where needed. The resulting honeycombs are designed to exhibit a smooth stiffness transition across their thickness, optimizing both energy dissipation and structural resilience. This research demonstrates the feasibility of producing gradient-stiffness structures through additive manufacturing and provides a foundation for designing application-specific cellular architectures that require tailored mechanical responses, such as in protective equipment, soft robotics, or adaptive vehicle components.

2. Materials and Methods

2.1. Materials

Three distinct TPU microstructure states were produced using two different filaments. The first was Varioshore TPU, a commercially available material from ColorFabb (Belfeld, The Netherlands), used to manufacture both foamed and non-foamed (solid) TPU honeycomb structures. Depending on the target porosity, printing was performed at 200 °C or 220 °C, yielding material densities of 1.2 g/cm3 and 0.78 g/cm3, respectively. Densities were derived by adjusting the flow-rate factor and multiplying by the manufacturer’s stated density. The flow-rate adjustment was necessary because the material expands at higher temperatures due to activation of the chemical blowing agent. The second filament was a carbon fiber-reinforced TPU from INNOVATEFIL (Jaén, Spain), which was printed at a nozzle temperature of 225 °C.

2.2. Gradient Stiffness Honeycomb Structures

Figure 1 outlines the methodology for designing gradient stiffness honeycombs, beginning with the selection of the honeycomb geometry, including cell dimensions and the division of regions. The next stage involved choosing appropriate materials and assigning them to specific zones. This was followed by the slicing process, where different filaments and printing parameters were designated to each region to achieve the desired gradient stiffness. The final phase consisted of experimental testing and computational simulations to evaluate the structures under compressive loading.

2.3. Manufacturing of the Samples

Honeycomb samples with outer dimensions of 70.69 × 51.96 × 25 mm, a consistent wall thickness of 1.2 mm, and a unit cell size of 5 mm (Figure 2A) were designed using SpaceClaim (Ansys, Release 24.1). These specimens were printed using a SNAPMAKER J1S dual-extrusion 3D printer (SNAPMAKER, Shenzhen, China) equipped with 0.4 mm nozzles. All prints were produced with a 0.15 mm layer height and a printing speed of 40 mm/s. One print head was loaded with a TPU filament containing a chemical blowing agent (CBA), enabling the fabrication of either porous TPU at higher temperatures or solid TPU at lower temperatures. The second print head used a TPU filament reinforced with randomly dispersed carbon fibers (CFs). By combining these materials, structures featuring no gradient, two-stage gradients, and three-stage gradients in stiffness were manufactured. Figure 2B displays the fabricated specimens. The first three honeycombs were single-material structures printed using a single print head, exhibiting no gradation. The subsequent set of specimens consisted of honeycombs with two distinct material regions. For example, plain and porous TPU variants were printed from the same TPU+CBA filament by altering the extrusion temperature. Similarly, combinations of TPU+CF and TPU+CBA filaments printed at different temperatures produced honeycombs with two gradient zones. The final design, featuring three distinct stiffness gradients, was achieved using both TPU+CF and TPU+CBA filaments, each printed at two separate temperatures

2.4. Tensile and Compressions Tests

Tensile and compression experiments (Figure 2C) were conducted using a universal testing machine (Model M500-50AT, Testometric, Lincoln, UK) at a constant strain rate of 0.025 s−1 to address strain rate deformation dependance due to the viscoelastic nature of TPU. Every test was conducted with three specimens to achieve statistical reliability and ensure reproducibility. The machine was equipped with a load cell capable of handling up to 50 kN. Dog bone-shaped specimens for tensile testing were designed according to ISO-37 standards [43]. The fabricated honeycombs underwent compression testing parallel to the direction of the gradient stiffness for evaluation. The compressive stress was determined by dividing the measured compressive force by the effective cross-sectional area.
The corresponding stress–strain curves provided basic data for calculating the specific energy absorption per volume (SEAv), which was calculated according to Equation (1).
S E A v ( ε d ) = 0 ε d σ ε d ε
where ε d is the strain of the structure calculated at a specific head displacement d.

2.5. Finite Element Analysis

Finite element models (FEM) were developed in ANSYS software (Release 24.1) to validate the gradient stiffness behavior observed experimentally and elucidate differences from single-material and gradient stiffness honeycombs. Material models for the three distinct TPU microstructures were represented using a three-parameter Mooney–Rivlin model, calibrated with uniaxial tensile test data. The honeycomb structures were simulated under compression using the same loading speed as in the physical experiments, with the bottom plate constrained as a fixed support (Figure 2D). A refined meshing approach was adopted to ensure mesh convergence and align the simulation results closely with experimental data. The optimal mesh for the honeycombs included 467,051 elements and 93,511 nodes, with an average aspect ratio of 1.88 and a minimum of 1.15, providing an effective balance between accuracy and computational efficiency.

3. Results

3.1. Materials Investigation

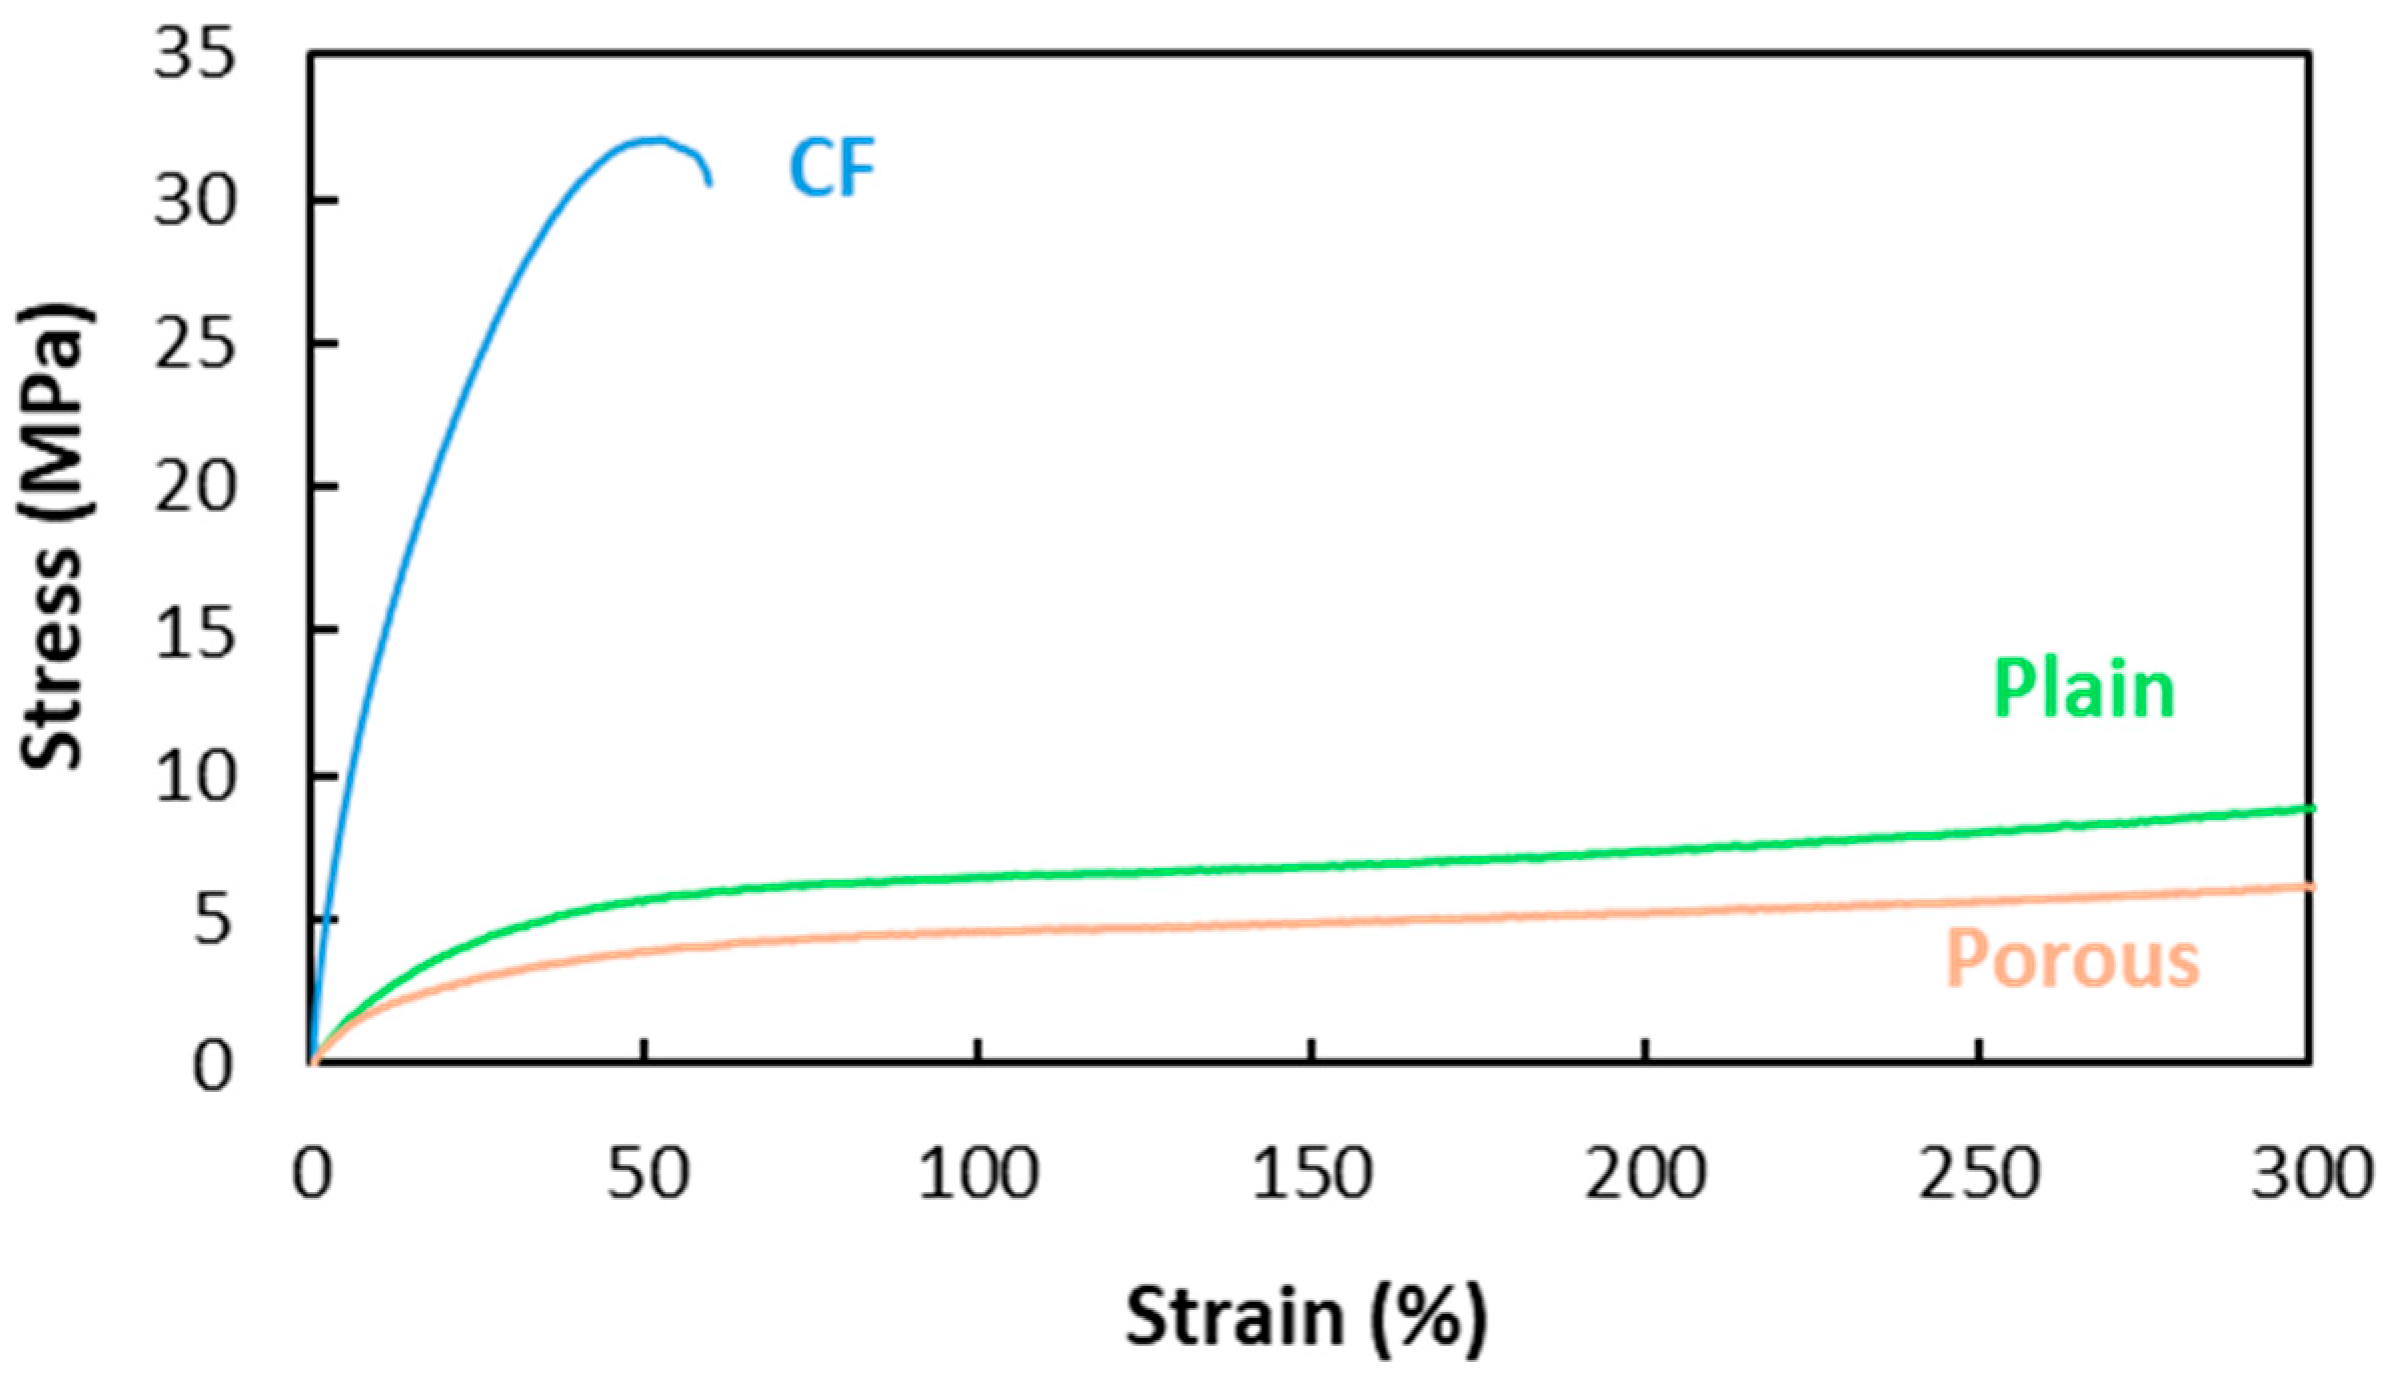
The results of the material characterization are illustrated in Figure 3. For each test, dogbone specimens were 3D printed using a single material type: plain TPU (thermoplastic polyurethane printed without the activation of chemical blowing agents), porous TPU (produced with activated chemical blowing agents to induce internal porosity), and carbon fiber (CF)-reinforced TPU. Figure 3 displays the stress–strain behavior of the three material variants. Both the plain and porous TPU exhibit typical elastomeric characteristics, with an initially steep stress increase followed by a more gradual slope, indicating nonlinear elastic deformation. Plain TPU demonstrated a tensile strength of 22.63 MPa and an impressive elongation at break of 816%, highlighting its high ductility. In contrast, the porous TPU—modified through the activation of chemical blowing agents that introduced internal voids—showed reduced mechanical performance. Its tensile strength dropped to 13.25 MPa, with a slightly lower elongation at break of 756%. The internal porosity effectively acted as stress concentrators, compromising the material’s ability to bear tensile loads while only moderately affecting its ductility. The CF-reinforced TPU presented markedly different mechanical behavior, characterized by a stiffer and more brittle response. This composite material achieved a higher tensile strength of 31.72 MPa but at the cost of drastically reduced elongation at break (45.8%). The inclusion of carbon fibers significantly enhanced stiffness and load-bearing capacity by restricting polymer chain mobility and distributing stress more efficiently along the fiber–matrix interface. However, this reinforcement also limited the material’s ability to deform plastically, leading to a more brittle failure.
These findings clearly demonstrate how changes in microstructure, whether through fiber reinforcement or induced porosity, profoundly influence the mechanical response of TPU-based materials. Carbon fiber incorporation improves strength and stiffness due to its high modulus and effective stress transfer capabilities, while porosity reduces strength by introducing structural weaknesses and lowering the effective load-bearing cross-section. This tunable variation in both strength and stiffness was strategically leveraged to develop functionally graded structures, where material composition is spatially varied to achieve customized mechanical performance across different regions of the part.
The Mooney–Rivlin hyperelastic parameters, derived from the uniaxial stress–strain responses, clearly demonstrate the influence of microstructural modifications on the mechanical behavior of TPU. The CF-reinforced material, with coefficients C01 = 111.85 MPa, C10 = –74.79 MPa, and C11 = 18.76 MPa, exhibits the highest stiffness, reflecting the reinforcing effect of the carbon fibers that enhances load-bearing capacity but reduces ductility. In contrast, the plain material (C01 = 6.62 MPa, C10 = –1.73 MPa, C11 = 0.14 MPa) displays a moderate mechanical response, while the porous material (C01 = 5.28 MPa, C10 = –1.58 MPa, C11 = 0.12 MPa) is the most compliant, consistent with the expected reduction in structural integrity due to the introduction of porosity. Collectively, these parameter variations capture the progressive transition from a compliant to a highly stiff system, and the fitted Mooney–Rivlin constants were subsequently utilized in finite element simulations to model the nonlinear elastic behavior of the materials.

3.2. Single-Zone Honeycomb Investigation

Figure 4 illustrates the compression test results conducted on honeycomb structures fabricated from single-material compositions. Despite sharing an identical geometric design, the mechanical responses varied significantly depending on the material used, highlighting the strong influence of material properties on structural performance. The stress–strain curves shown in Figure 4A clearly demonstrates these differences. The carbon fiber (CF)-reinforced TPU honeycomb exhibited a distinctly stiff response, characterized by a sharp linear rise in stress followed by a relatively short plateau region beginning at approximately 6.2 MPa. In contrast, honeycombs made from plain TPU and porous TPU showed significantly lower plateau stresses, recorded at around 1.3 MPa and 0.4 MPa, respectively. Moreover, their densification phases, where the structure undergoes a steep increase in stress due to the collapse of remaining pores, were delayed relative to the CF-reinforced honeycomb. This indicates a more gradual absorption of energy and greater deformability before full structural compaction.
The observed differences can be attributed to intrinsic material stiffness. The CF-reinforced TPU possesses enhanced stiffness due to the reinforcing effect of carbon fibers, which limit deformation and promote early structural collapse under load. This leads to a quick transition from elastic to densification behavior. On the other hand, plain and porous TPU are more compliant, allowing for larger deformations and prolonged plateau regions, which are beneficial for energy absorption but result in lower stress-bearing capacity. The internal porosity in the porous TPU further reduces its effective stiffness and strength by decreasing the material’s density and introducing stress concentrators. These results confirm that material selection plays a critical role in determining the mechanical response of architected structures.
The specific energy absorption (SEAv) of a structure is inherently linked to the stress levels applied during deformation. Figure 4B illustrates the SEAv as a function of stress for honeycomb structures fabricated from different single materials, based on data obtained from the compression experiments. At lower stress levels, specifically below approximately 0.9 MPa, the porous TPU honeycomb exhibits the highest SEAv. This behavior is attributed to its early entry into the plateau region, where significant deformation occurs with only a minimal increase in stress. In this range, the plain and CF-reinforced TPU honeycombs are still in their elastic regimes and have not yet begun to absorb energy efficiently. As a result, the porous TPU, despite its lower strength, outperforms the others in energy dissipation.
As stress increases to the intermediate range, around 0.9 MPa to 4.7 MPa, the plain TPU honeycomb becomes the most effective in energy absorption. By this stage, the porous TPU has nearly completed its plateau phase and is approaching densification, where its ability to absorb additional energy is significantly reduced. Meanwhile, the plain TPU enters its optimal energy-absorbing range, maintaining plateau deformation over a broad stress interval. This allows it to sustain efficient energy dissipation while maintaining structural integrity, making it the most suitable choice in this mid-stress region. At higher stress levels, above approximately 4.7 MPa, the carbon fiber-reinforced TPU honeycomb dominates in terms of SEAv. The other two materials have by this point transitioned into the densification phase, where their internal cellular structures collapse and energy absorption gives way to direct load transfer. In contrast, the CF-reinforced TPU, owing to its greater stiffness and delayed densification, continues to absorb energy effectively even under higher loads. Its structural rigidity allows it to withstand and dissipate high levels of stress without immediate collapse, making it highly suitable for applications involving intense compressive forces. These observations highlight the critical role of material selection in energy-absorbing structures. Each material offers optimal performance in a different stress range: porous TPU at low stresses, plain TPU at intermediate stresses, and CF-reinforced TPU at high stresses.
Computational results corresponding to the compression experiments are also presented in Figure 4A, providing a direct comparison with the physical tests. The simulation results, depicted as dotted lines, align closely with the experimental data up to 60% strain. This agreement validates the material models and boundary conditions used in the simulations and confirms that the nonlinear deformation behavior of each honeycomb structure was accurately captured.

3.3. Dual-Zone Honeycomb Investigation

Figure 5, Figure 6 and Figure 7 present the compression test results for hybrid honeycomb structures composed of two vertically stacked zones, each made from a different material. In all configurations, the softer material was positioned at the top. Figure 5A specifically shows the performance of a honeycomb structure combining a top zone made of porous TPU and a bottom zone of plain TPU (denoted as PO_PL). For reference, the compression responses of single-material honeycombs are included as colored transparent lines, enabling direct comparison. The PO_PL hybrid displays mechanical behavior that incorporates characteristics of both constituent materials. Notably, its plateau stress closely matches that of the plain TPU honeycomb, though it appears at a slightly delayed point along the strain axis. This delay is attributed to the early densification of the porous top zone, which compresses more readily before the load is fully transferred to the stiffer plain TPU zone beneath.
The specific energy absorption per volume (SEAv) plotted against stress (Figure 5B) reveals a nuanced picture of performance. In the low-stress range (Region i), the PO_PL honeycomb underperforms compared to the single-material porous TPU structure, which has already entered its plateau phase and begins absorbing energy efficiently. In the intermediate-stress range (Region ii), the PO_PL also absorbs less energy than the plain TPU honeycomb, which dominates this range due to its broader and more stable plateau behavior. However, an important insight emerges when the PO_PL honeycomb is compared to the plain TPU in Region i and the porous TPU in Region ii. In both cases, the hybrid outperforms the respective single-material honeycomb not optimized for that stress range. This suggests that while the dual-material configuration may not reach peak performance in any single region, it offers a balanced energy absorption profile across a wider range of stresses.
This behavior is advantageous in applications where variable or unpredictable loading conditions are expected. The combination of a soft, energy-absorbing upper zone with a stiffer, load-bearing lower zone creates a structure that can adapt to both low- and mid-stress scenarios. Although the PO_PL honeycomb may not deliver maximum SEAv in isolated regions, its ability to bridge performance between them highlights the potential of multi-material designs for developing tunable and more resilient energy-absorbing structures.
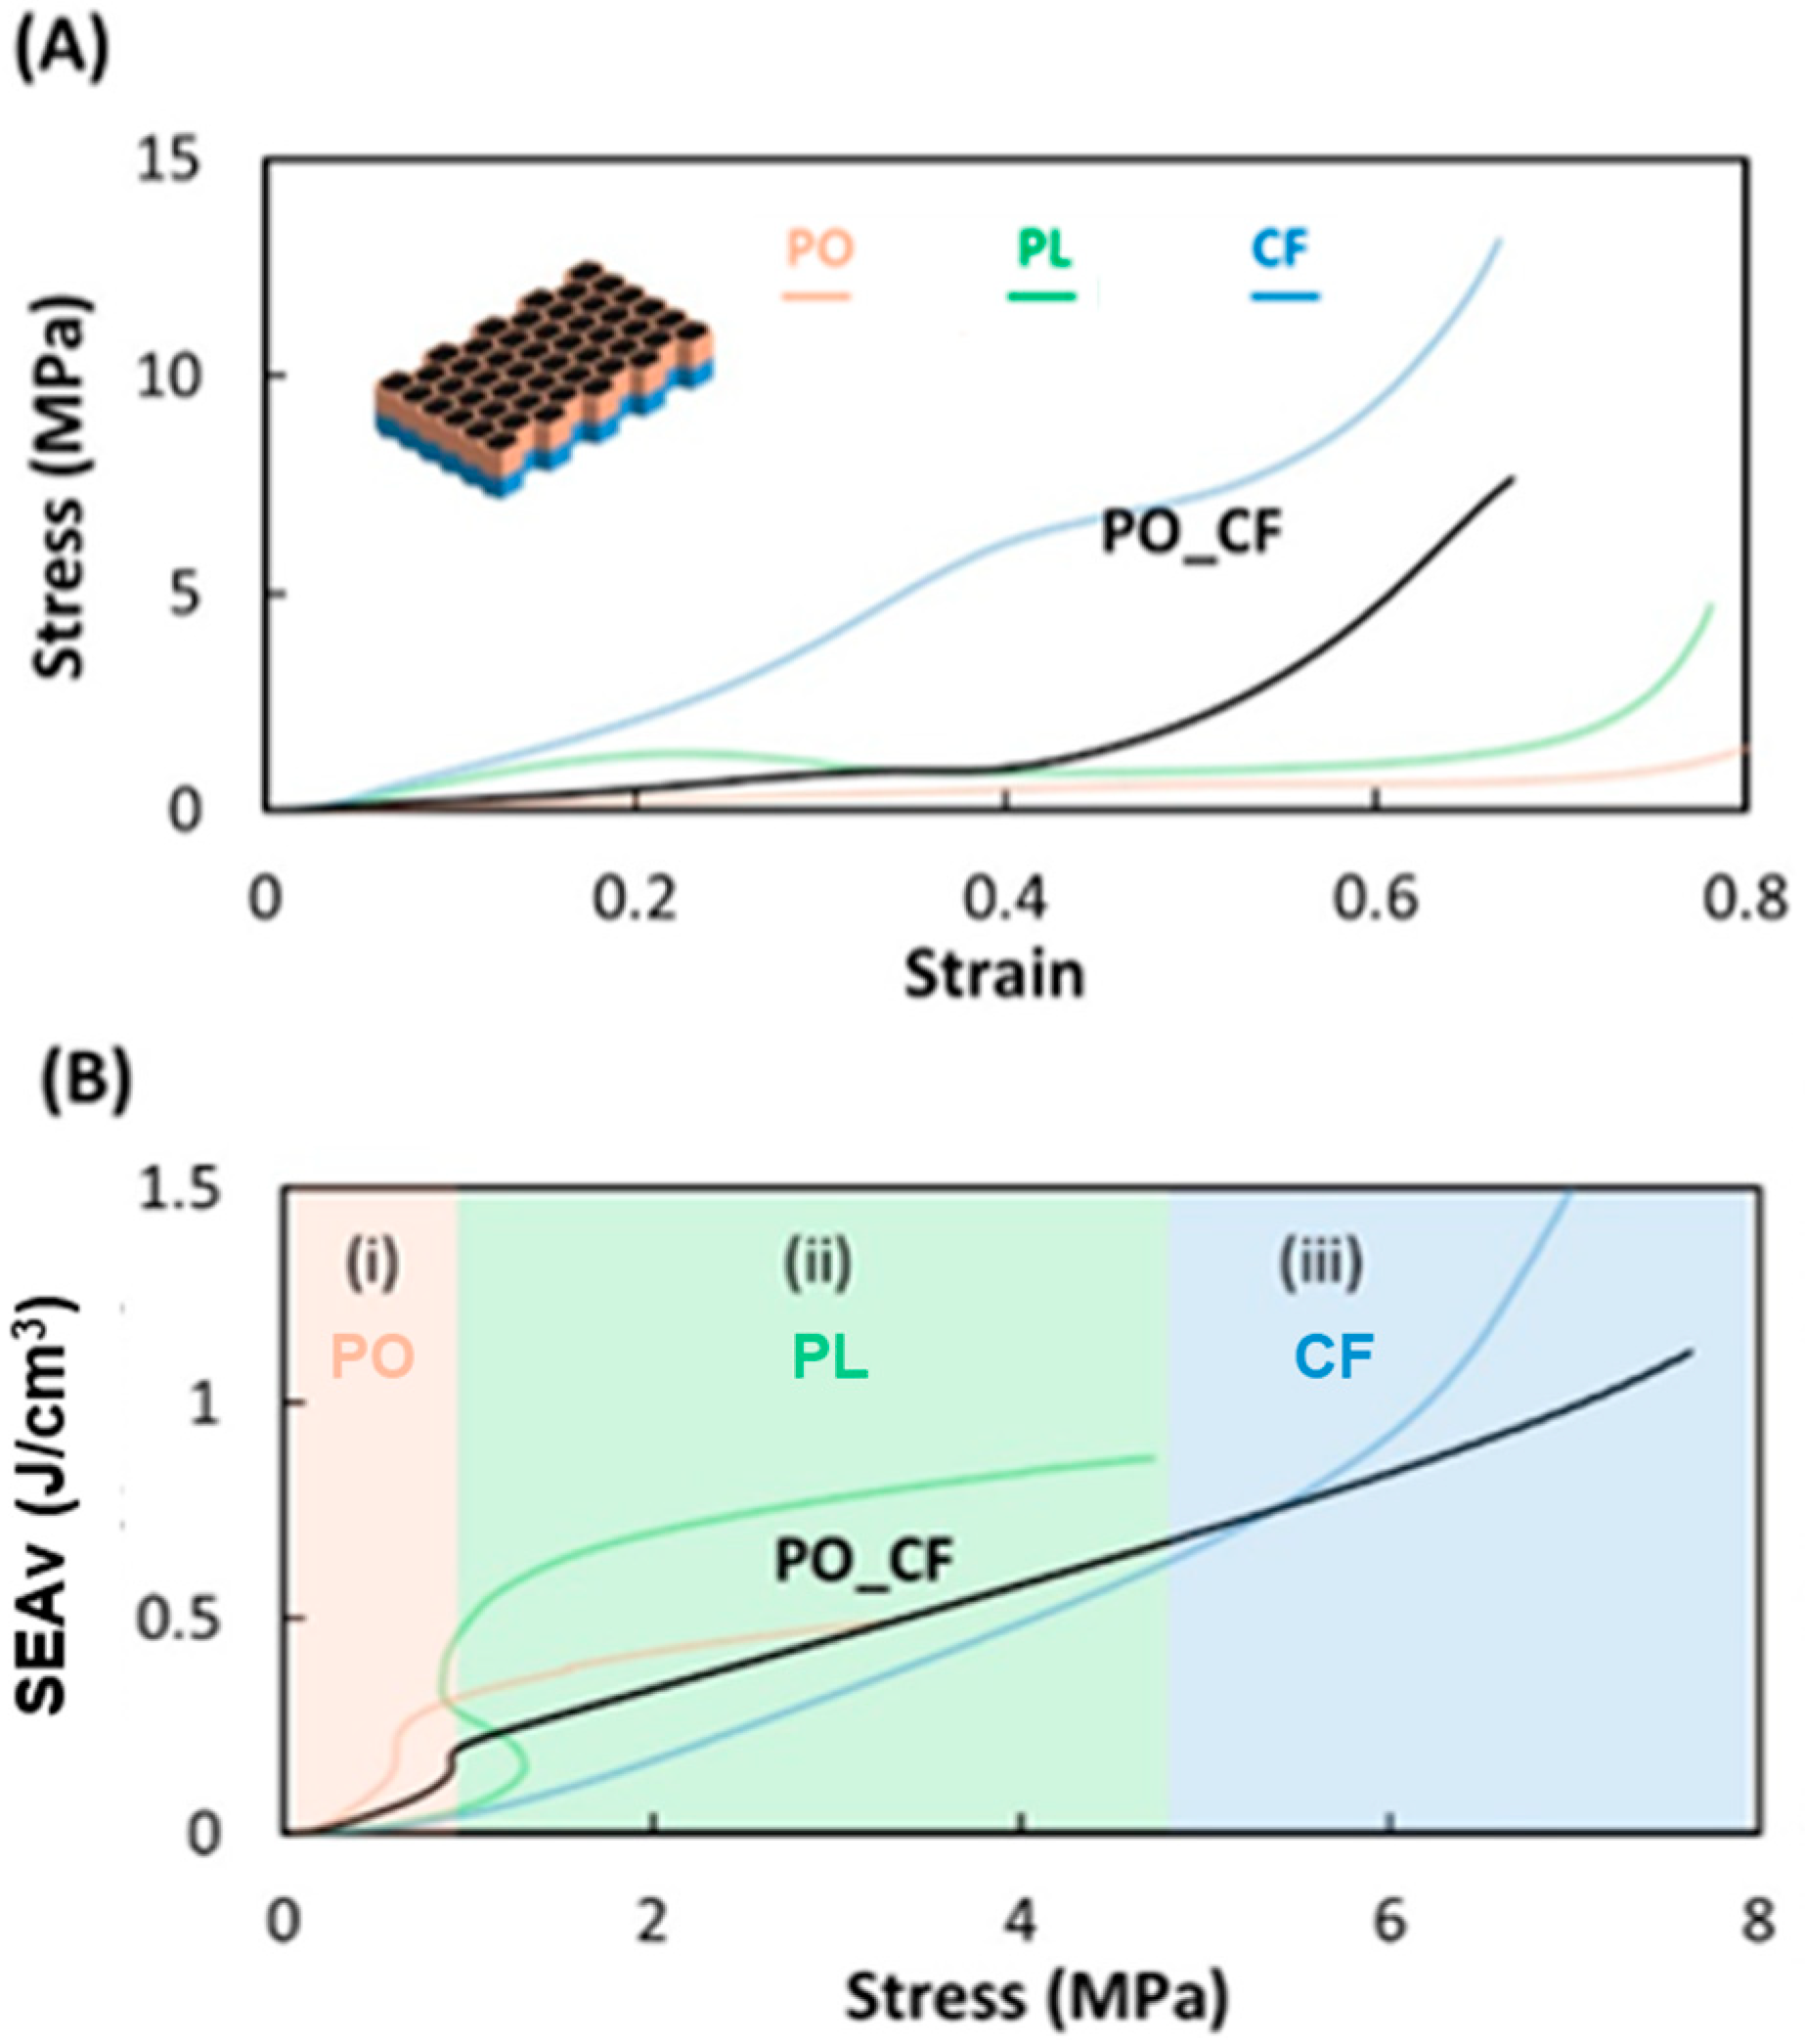
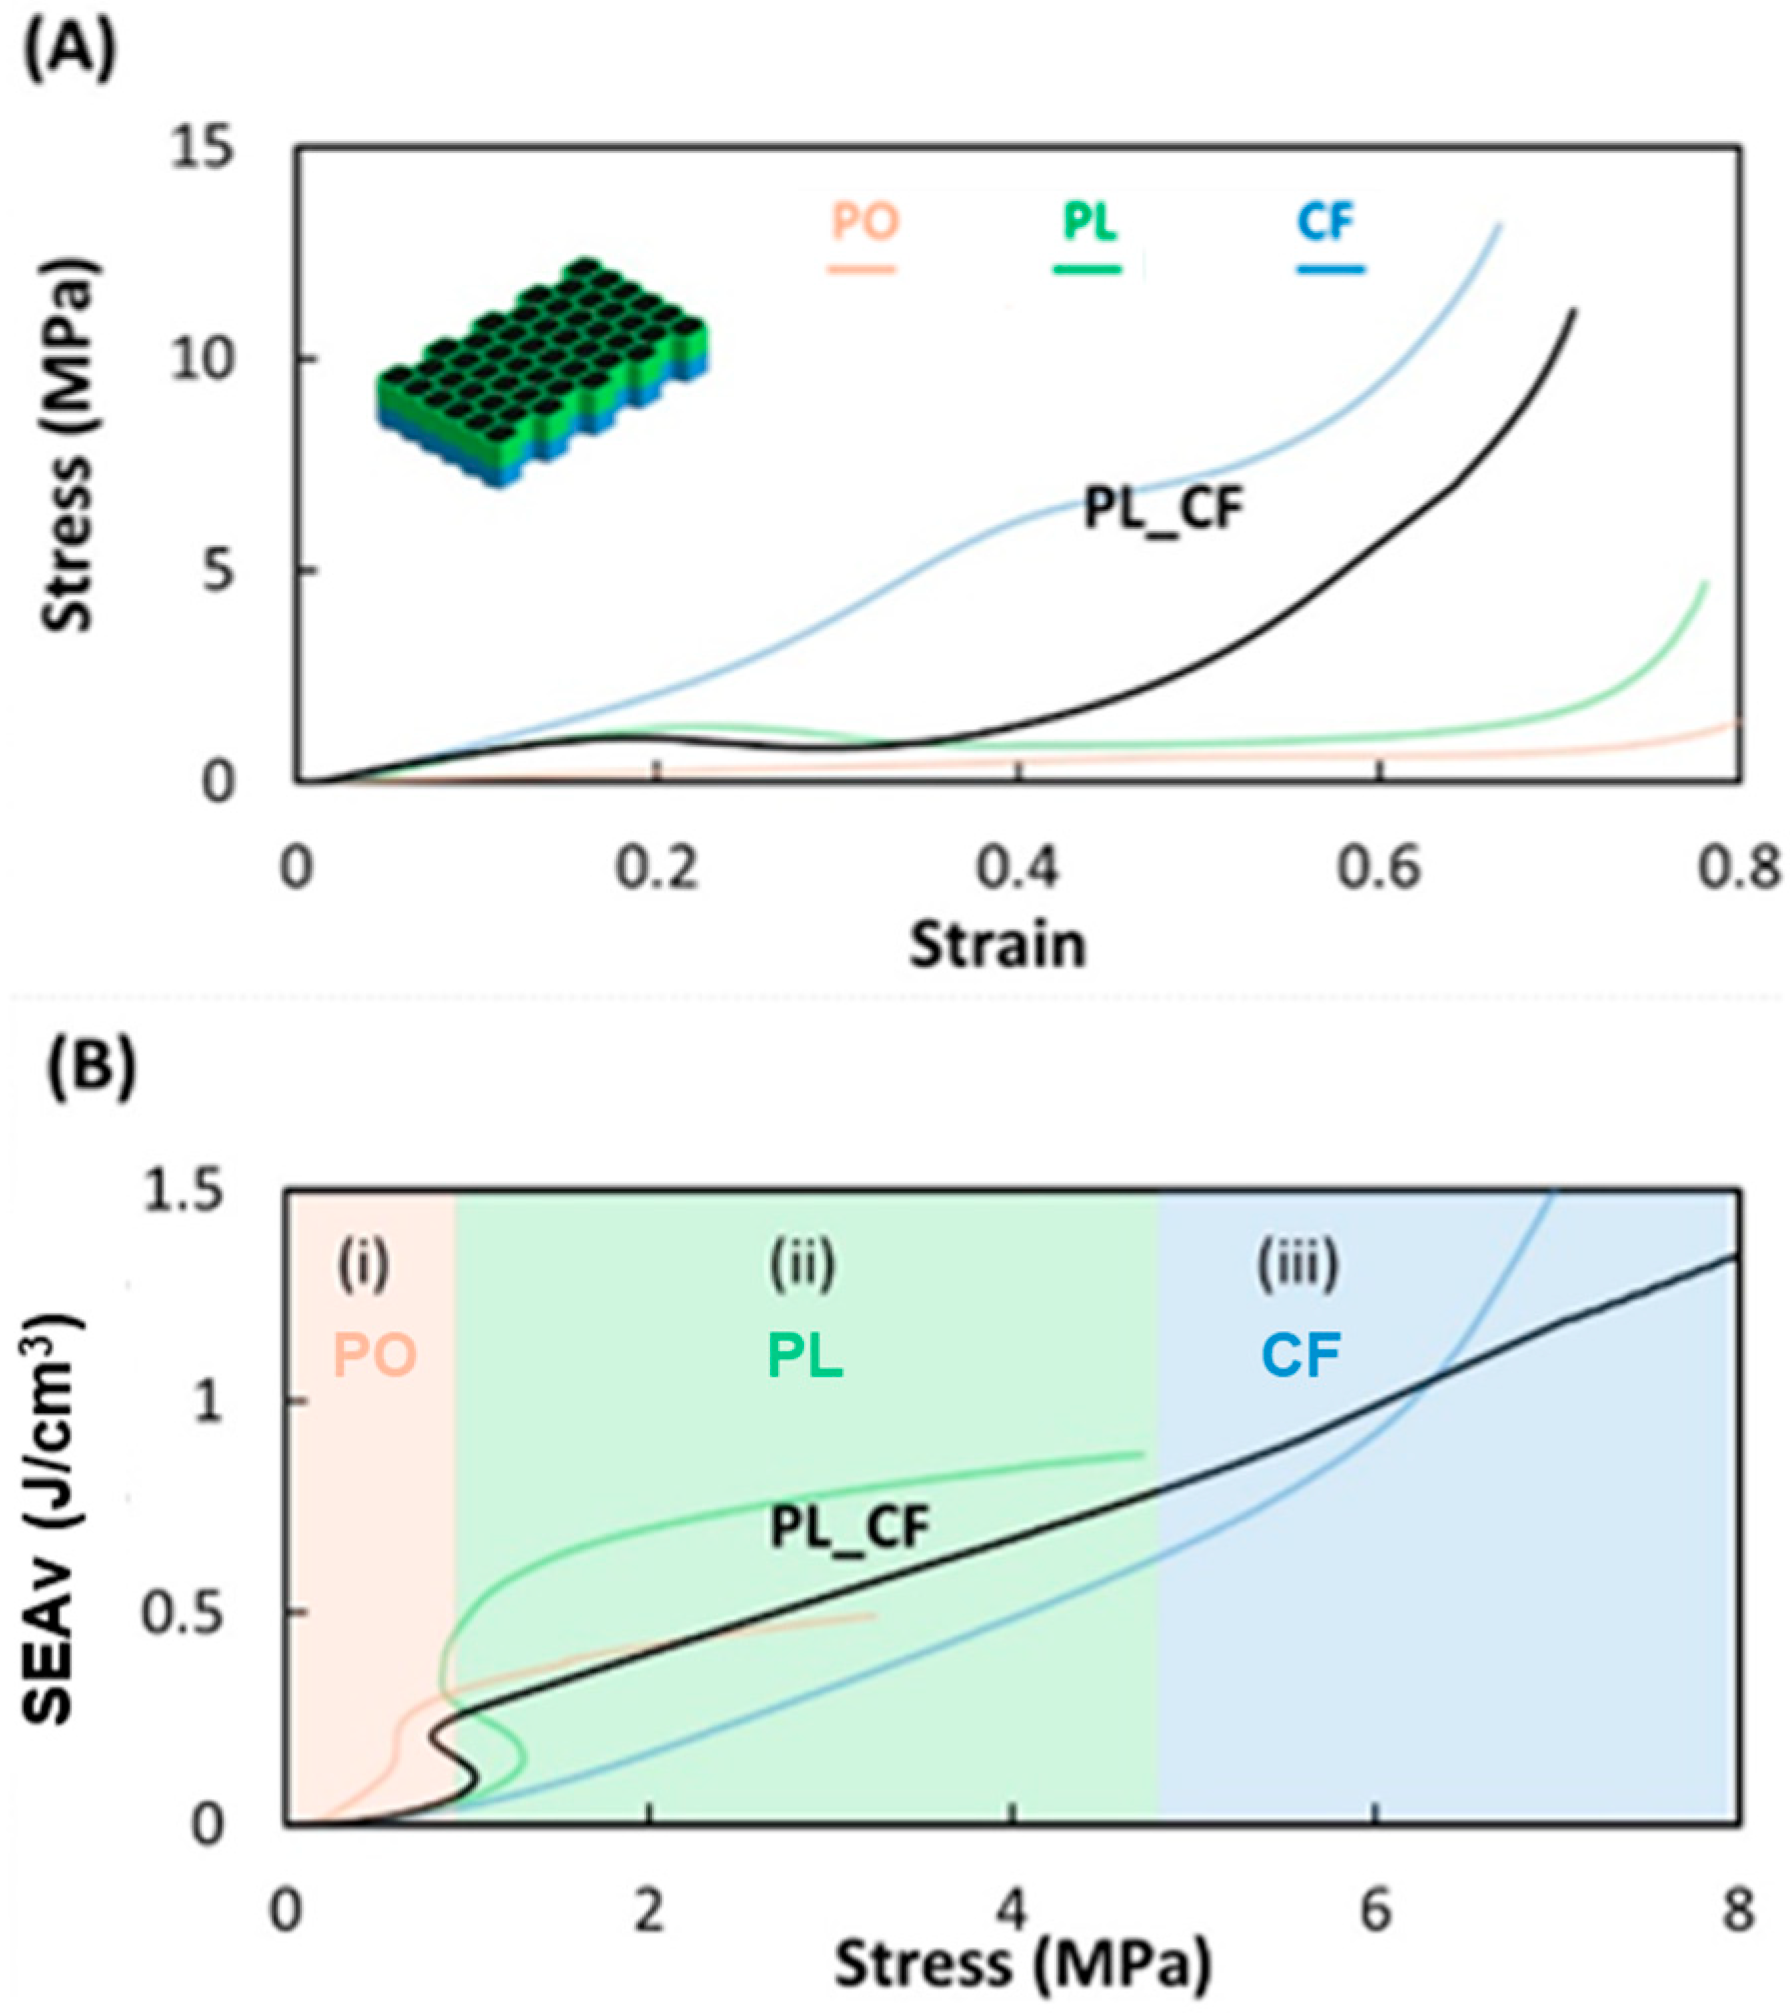
Figure 6 and Figure 7 present the mechanical responses of hybrid honeycombs combining carbon fiber (CF) as the stiff bottom zone with either porous TPU (PO_CF) or plain TPU (PL_CF) as the softer top layer. In both configurations, the stress–strain curves (Figure 6A and Figure 7A) show a very short plateau phase followed by a steep stress rise, closely resembling the behavior of the carbon fiber honeycomb. The initial TPU layers—porous in PO_CF and plain in PL_CF—compress quickly, leading to early load transfer to the CF zone. In the SEAv vs. stress plots (Figure 6B and Figure 7B), both hybrids show lower energy absorption in region i compared to their respective soft-material counterparts. In Region ii, they fall short of pure CF but outperform the TPU-based honeycombs not optimized for mid-stress loading. This demonstrates a trade-off: while PO_CF and PL_CF do not reach peak SEAv in any single range, they provide a broader, more adaptable energy absorption profile suited to variable or uncertain loading conditions.

3.4. Three-Zone Honeycomb Investigation

Figure 8 presents the compression test results for the gradient stiffness honeycomb, which is composed of three vertically stacked zones made from different materials. This configuration is designed to progressively increase in stiffness from top to bottom, enabling a more controlled deformation under compressive loads. Figure 8A illustrates the stress–strain response of this multi-material structure, overlaid with transparent colored lines representing the behavior of the corresponding single-material honeycombs for comparison. The response of the gradient honeycomb closely follows the sequential activation of its individual zones. Initially, the soft porous TPU zone undergoes compression, exhibiting a low-stress plateau typical of highly deformable cellular structures. Once this zone begins to densify, the load is transferred to the intermediate plain TPU zone, resulting in a new plateau region with higher stress levels that closely resemble the response of the plain TPU honeycomb. Finally, as the load continues to increase, the stiffer CF-reinforced TPU zone begins to deform, causing a sharp rise in stress and a pronounced slope in the stress–strain curve. The FEM results, shown as dashed lines, exhibit good agreement with experimental data. However, it can be observed that the FEM simulation predicts the onset of densification earlier than what is seen experimentally.
Figure 8B highlights the specific energy absorption (SEAv) behavior of the PO_PL_CF honeycomb, which demonstrates excellent energy dissipation across a broad range of stresses. This extended plateau performance is particularly beneficial in applications where variable or multi-phase loading is expected. The smooth transition between material zones ensures that the structure maintains a consistent ability to absorb energy. The experimental results align well with the computational simulations, shown as dotted lines in Figure 8A. This agreement validates the numerical model used and confirms that the simulated mechanical response accurately predicts real-world behavior.
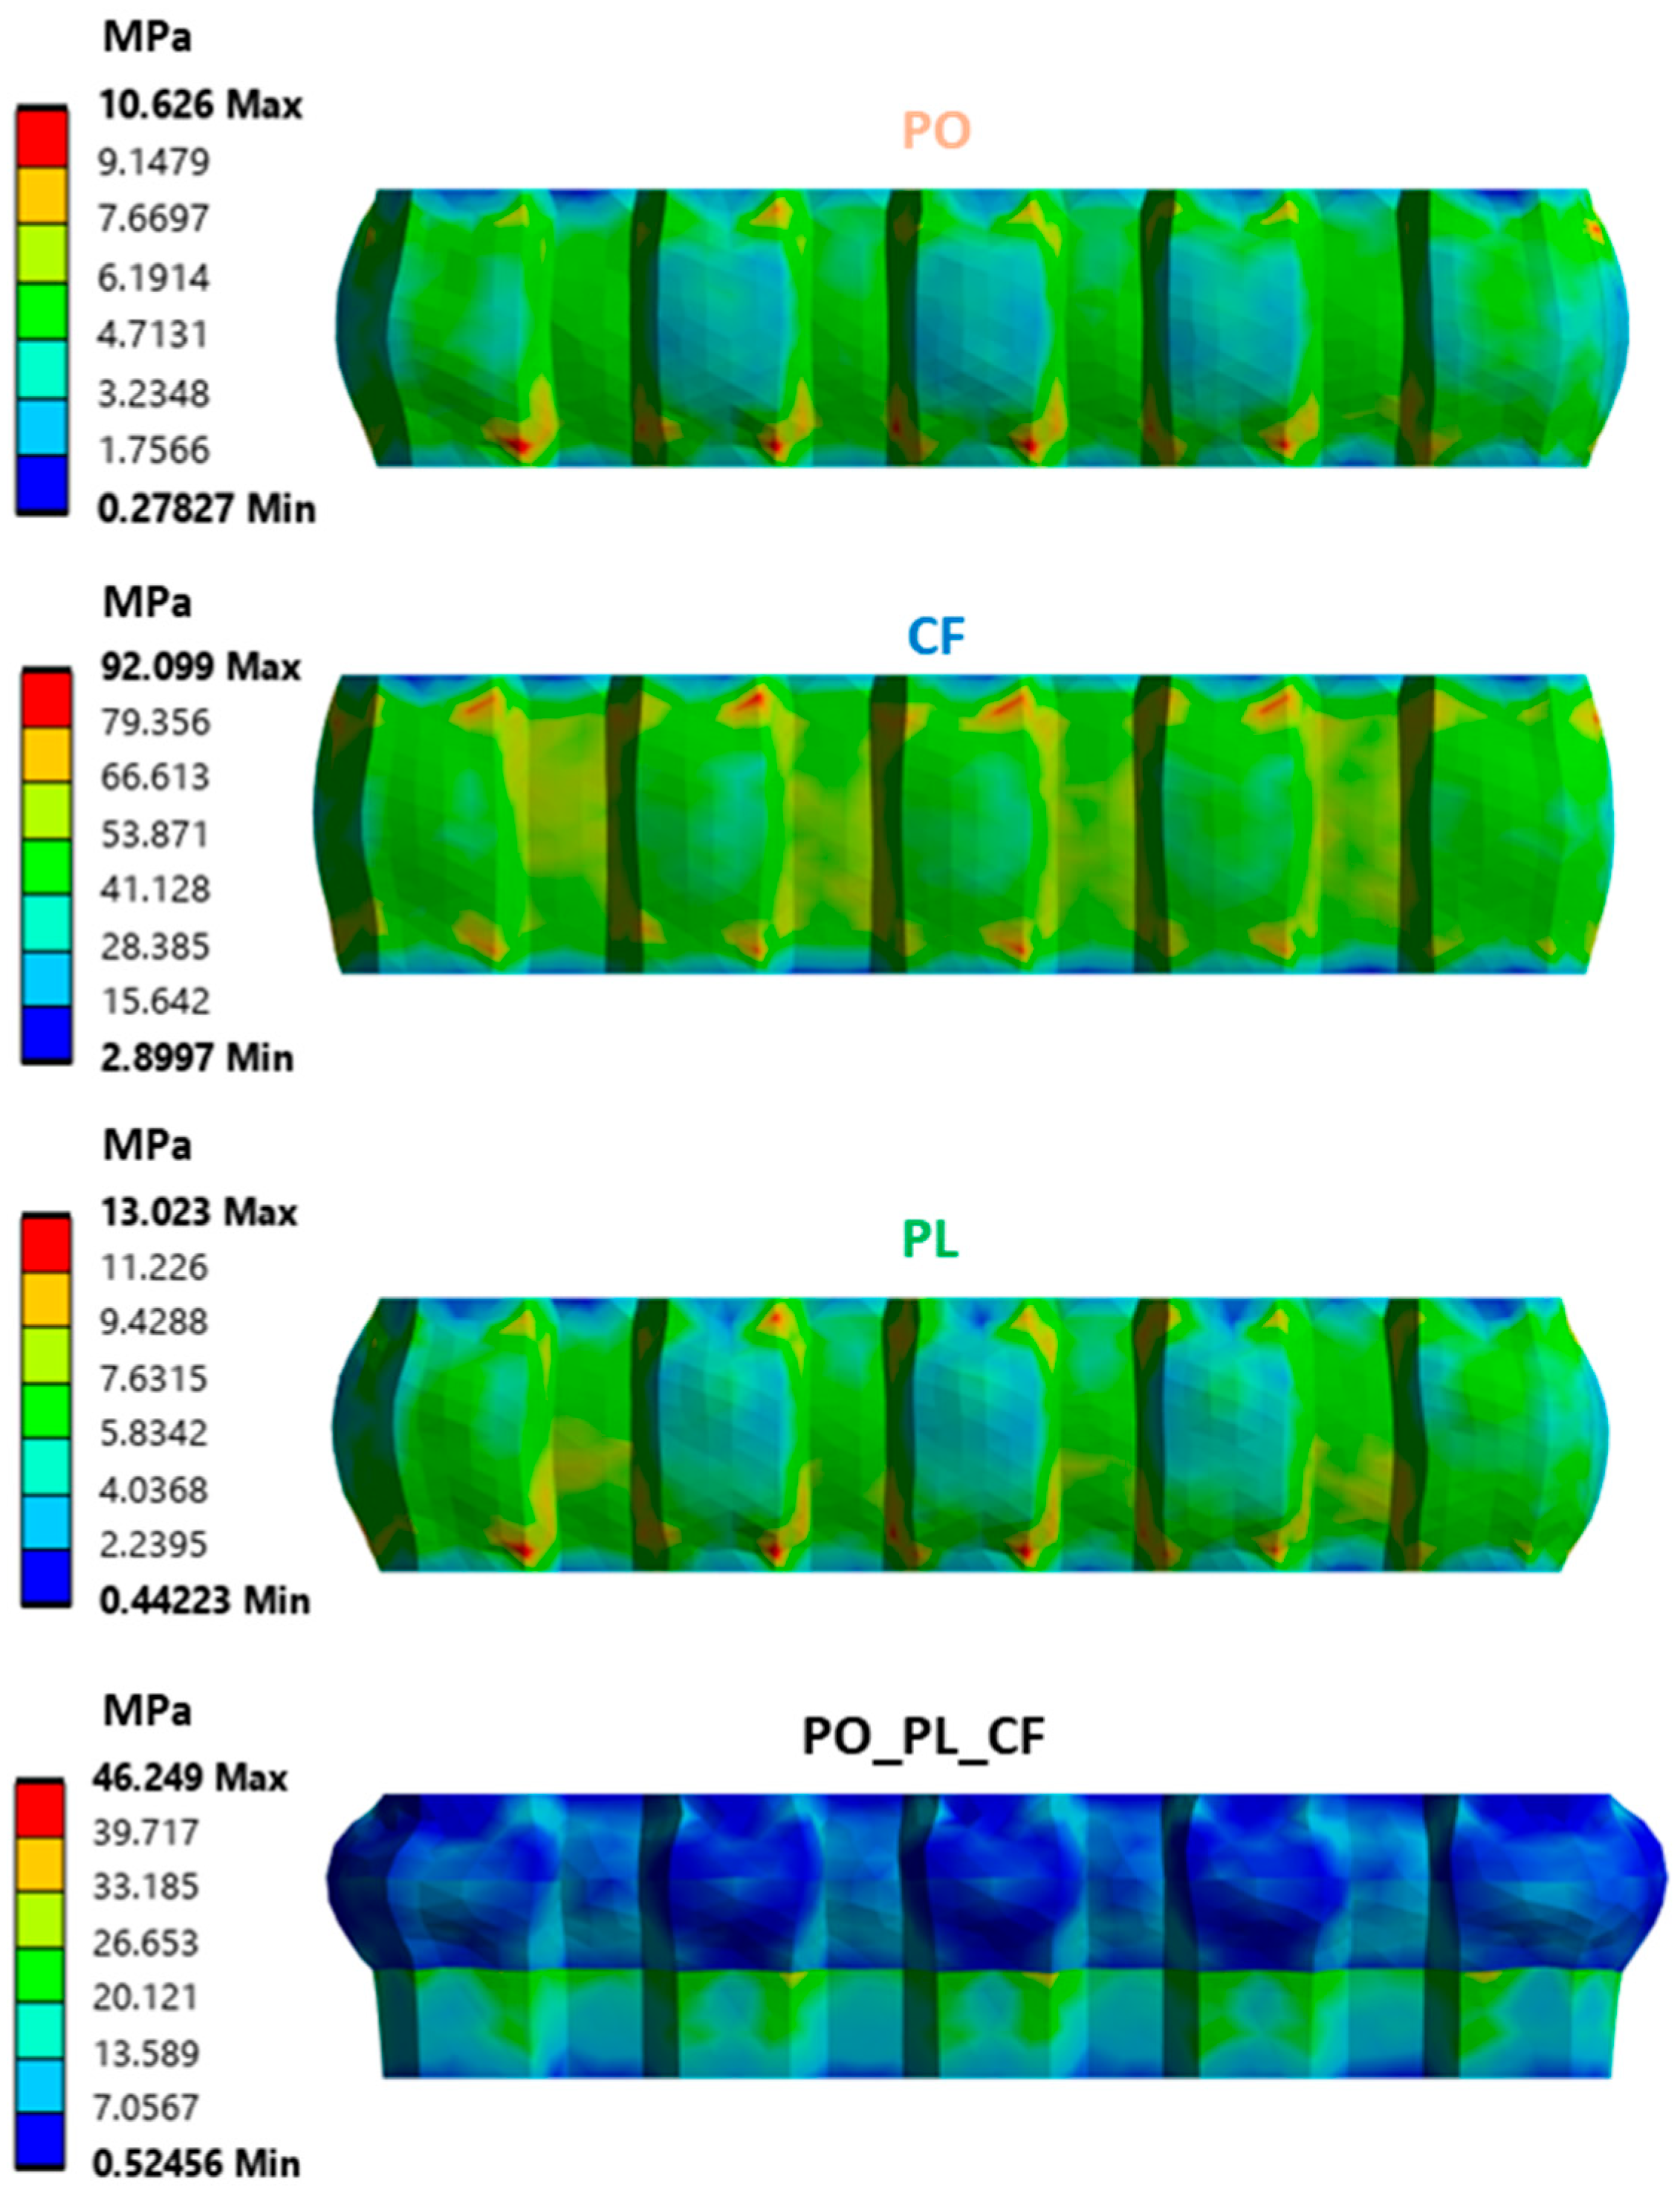
Figure 9 displays the equivalent stress contours for the honeycomb specimens compressed to 30% strain, comparing the single-material designs with the graded three-material configuration. The soft, porous honeycomb exhibited the lowest peak stress (10.62 MPa), followed by the homogeneous solid counterpart (13.02 MPa). Owing to its much greater stiffness, the carbon-fiber honeycomb reached a much higher maximum stress at 92.09 MPa. In the graded honeycomb the peak stress remained lower than that of the CF specimens. At this strain level, the porous layer has completely densified, the plain layer has just begun to densify, and the rigid CF layer experienced the lowest deformation.
Finally, Table 1 presents the compressive strength values obtained from experiments and FEM analyses. Overall, the FEM predictions agree well with the experimental data, with percentage errors ranging from 3.33% (carbon-fiber case) to 8.20% (porous case). Notably, the FEM slightly overestimates compressive strength in every case except for the carbon-fiber specimen.

4. Conclusions

In this study, honeycomb structures composed of plain TPU, porous TPU, and CF-reinforced TPU were fabricated and examined to evaluate their mechanical performance and energy absorption characteristics. Using fused filament fabrication (FFF), both single-material and gradient stiffness honeycombs were produced to explore the effect of material distribution on compressive behavior. Tensile and compression tests were conducted to assess how changes in material stiffness and configuration influence overall structural performance.
Compression testing under out-of-plane loading revealed distinct plateau and densification regions in the stress–strain curves. CF-TPU honeycombs exhibited the highest stiffness and appealing energy absorption properties at stress levels above ~4.5 MPa, owing to the rigid reinforcement provided by carbon fibers. However, they also showed an earlier onset of densification, limiting their deformation range. Plain TPU honeycombs displayed moderate stiffness and a wider deformation range, while porous TPU honeycombs, with the lowest stiffness, offered a prolonged plateau region and absorbed energy efficiently under low stress levels ~1 MPa.
Hybrid honeycombs with gradient stiffness, created by stacking different materials vertically, demonstrated a valuable balance of properties. These structures took advantage of each material’s strengths by enabling a gradual transition in stiffness along the compression axis. Placing a softer porous TPU layer above a stiffer TPU or CF-TPU base allowed the structure to absorb low-level impacts initially, then progressively resist higher loads. This gradient stiffness design delayed densification and broadened the energy absorption range. As a result, gradient honeycombs offer promising performance for protective applications where multi-phase energy absorption is desired, such as helmets, automotive padding, or footwear.

Author Contributions

Conceptualization, S.K.; Formal analysis, S.K. and N.P.; Funding acquisition, E.M.P.; Investigation, S.K.; Project administration, D.T.; Resources, E.M.P. and D.T.; Software, K.T.; Supervision, D.T.; Validation, N.P.; Visualization, N.P.; Writing—original draft, S.K.; Writing—review and editing, K.T., E.M.P. and D.T. All authors have read and agreed to the published version of the manuscript.

Funding

This research received no external funding.

Institutional Review Board Statement

Not applicable.

Data Availability Statement

The original contributions presented in this study are included in the article. Further inquiries can be directed to the corresponding author.

Conflicts of Interest

The authors declare no conflicts of interest.

References

  1. Sun, G.; Chen, D.; Zhu, G.; Li, Q. Lightweight hybrid materials and structures for energy absorption: A state-of-the-art review and outlook. Thin-Walled Struct. 2022, 172, 108760. [Google Scholar] [CrossRef]
  2. El-Baky, M.A.A.; Allah, M.M.A.; Kamel, M.; Abd-Elaziem, W. Lightweight cost-effective hybrid materials for energy absorption applications. Sci. Rep. 2022, 12, 21101. [Google Scholar] [CrossRef] [PubMed]
  3. Singh, J.; Srivastawa, K.; Jana, S.; Dixit, C.; Ravichandran, S. Advancements in lightweight materials for aerospace structures: A comprehensive review. Acceleron Aerosp. J. 2024, 2, 173–183. [Google Scholar] [CrossRef]
  4. Guo, H.; Zhou, X.; Liu, Z. Advanced lightweight structural materials for automobiles: Properties, manipulation, and perspective. Sci. Adv. Mater. 2024, 16, 563–580. [Google Scholar] [CrossRef]
  5. Hassan, H.Z.; Saeed, N.M. Advancements and applications of lightweight structures: A comprehensive review. Discov. Civ. Eng. 2024, 1, 47. [Google Scholar] [CrossRef]
  6. Braga, D.F.; Tavares, S.M.O.; da Silva, L.F.; Moreira, P.M.G.P.; de Castro, P.M. Advanced design for lightweight structures: Review and prospects. Prog. Aerosp. Sci. 2014, 69, 29–39. [Google Scholar] [CrossRef]
  7. Thomas, T.; Tiwari, G. Crushing behavior of honeycomb structure: A review. Int. J. Crashworthiness 2019, 24, 555–579. [Google Scholar] [CrossRef]
  8. Chandrasekaran, N.K.; Arunachalam, V. State-of-the-art review on honeycomb sandwich composite structures with an emphasis on filler materials. Polym. Compos. 2021, 42, 5011–5020. [Google Scholar] [CrossRef]
  9. Anni, I.A.; Uddin, K.Z.; Pagliocca, N.; Singh, N.; Rahman, O.; Youssef, G.; Koohbor, B. Out-of-plane load-bearing and mechanical energy absorption properties of flexible density-graded TPU honeycombs. Compos. Part C Open Access 2022, 8, 100284. [Google Scholar] [CrossRef]
  10. Townsend, S.; Adams, R.; Robinson, M.; Hanna, B.; Theobald, P. 3D printed origami honeycombs with tailored out-of-plane energy absorption behavior. Mater. Des. 2020, 195, 108930. [Google Scholar] [CrossRef]
  11. Mohammadi, H.; Ahmad, Z.; Petrů, M.; Mazlan, S.A.; Johari, M.A.F.; Hatami, H.; Koloor, S.S.R. An insight from nature: Honeycomb pattern in advanced structural design for impact energy absorption. J. Mater. Res. Technol. 2023, 22, 2862–2887. [Google Scholar] [CrossRef]
  12. Dong, Y.; He, J.; Wang, D.; Luo, D.; Zeng, Y.; Feng, H.; You, X.; Shen, L. Advanced Modular Honeycombs with Biomimetic Density Gradients for Superior Energy Dissipation. Biomimetics 2025, 10, 221. [Google Scholar] [CrossRef] [PubMed]
  13. Kumar, S.; Ubaid, J.; Abishera, R.; Schiffer, A.; Deshpande, V.S. Tunable energy absorption characteristics of architected honeycombs enabled via additive manufacturing. ACS Appl. Mater. Interfaces 2019, 11, 42549–42560. [Google Scholar] [CrossRef] [PubMed]
  14. Jefferson Andrew, J.; Schneider, J.; Schiffer, A.; Hafeez, F.; Kumar, S. Dynamic crushing of tailored honeycombs realized via additive manufacturing. Int. J. Mech. Sci. 2022, 219, 107126. [Google Scholar] [CrossRef]
  15. Uddin, K.Z.; Anni, I.A.; Youssef, G.; Koohbor, B. Tuning Load Bearing Capacities of Flexible Honeycomb with Poisson’s Ratio Modulation. In Proceedings of the American Society for Composites-Thirty-Eighth Technical Conference, Woburn, MA, USA, 18–20 September 2023. [Google Scholar]
  16. You, J.F.; Zhang, H.C.; Zhu, H.X.; Kennedy, D. The high strain compression of micro-and nano-sized random irregular honeycombs. Mater. Res. Express 2016, 3, 095023. [Google Scholar] [CrossRef]
  17. Nazir, A.; Arshad, A.B.; Lin, S.C.; Jeng, J.Y. Mechanical performance of lightweight-designed honeycomb structures fabricated using multijet fusion additive manufacturing technology. 3D Print. Addit. Manuf. 2022, 9, 311–325. [Google Scholar] [CrossRef] [PubMed]
  18. Afkhami, S.; Amraei, M.; Gardner, L.; Piili, H.; Wadee, M.A.; Salminen, A.; Björk, T. Mechanical performance and design optimisation of metal honeycombs fabricated by laser powder bed fusion. Thin-Walled Struct. 2022, 180, 109864. [Google Scholar] [CrossRef]
  19. Nazmul Ahsan, A.M.M.; Khoda, B. Characterizing novel honeycomb infill pattern for additive manufacturing. Manuf. Sci. Eng. 2021, 143, 021002. [Google Scholar] [CrossRef]
  20. Zhang, L.; Song, B.; Zhao, A.; Liu, R.; Yang, L.; Shi, Y. Study on mechanical properties of honeycomb pentamode structures fabricated by laser additive manufacturing: Numerical simulation and experimental verification. Compos. Struct. 2019, 226, 111199. [Google Scholar] [CrossRef]
  21. Matsuzaki, R.; Kanatani, T.; Todoroki, A. Multi-material additive manufacturing of polymers and metals using fused filament fabrication and electroforming. Addit. Manuf. 2019, 29, 100812. [Google Scholar] [CrossRef]
  22. Hasanov, S.; Alkunte, S.; Rajeshirke, M.; Gupta, A.; Huseynov, O.; Fidan, I.; Alifui-Segbaya, F.; Rennie, A. Review on additive manufacturing of multi-material parts: Progress and challenges. J. Manuf. Mater. Process. 2021, 6, 4. [Google Scholar] [CrossRef]
  23. Wang, Z.; Wang, L.; Tang, F.; Chen, J. Multi-material additive manufacturing via fused deposition modeling 3D printing: A systematic review on the material feeding mechanism. Proc. Inst. Mech. Eng. Part E J. Process Mech. Eng. 2024, 09544089231223316. [Google Scholar] [CrossRef]
  24. Cunha, P.; Teixeira, R.; Carneiro, O.S.; Silva, A.F. Multi-material fused filament fabrication: An expedited methodology to assess the affinity between different materials. Prog. Addit. Manuf. 2023, 8, 195–204. [Google Scholar] [CrossRef]
  25. Dairabayeva, D.; Perveen, A.; Talamona, D. Flexural Performance of Mono-material and Multimaterial Fused Filament Fabrication Honeycomb Structures. In Proceedings of the 2023 14th International Conference on Mechanical and Aerospace Engineering (ICMAE), Porto, Portugal, 18–21 July 2023; IEEE: New York, NY, USA, 2023; pp. 54–59. [Google Scholar]
  26. Rajendra Boopathy, V.; Sriraman, A.; Arumaikkannu, G. Energy absorbing capability of additive manufactured multi-material honeycomb structure. Rapid Prototyp. J. 2019, 25, 623–629. [Google Scholar] [CrossRef]
  27. Mustafa, I.; Kwok, T.H. Interlacing infills for multi-material fused filament fabrication using layered depth material images. Micromachines 2022, 13, 773. [Google Scholar] [CrossRef] [PubMed]
  28. Yavas, D.; Liu, Q.; Zhang, Z.; Wu, D. Design and fabrication of architected multi-material lattices with tunable stiffness, strength, and energy absorption. Mater. Des. 2022, 217, 110613. [Google Scholar] [CrossRef]
  29. Desai, S.M.; Sonawane, R.Y.; More, A.P. Thermoplastic polyurethane for three-dimensional printing applications: A review. Polym. Adv. Technol. 2023, 34, 2061–2082. [Google Scholar] [CrossRef]
  30. Nihal, R.A.; Broti, N.M.; Deowan, S.A.; Rahman, S. Design and development of an anthropomorphic robotic hand using TPU material. In Proceedings of the 2019 2nd International Conference on Innovation in Engineering and Technology (ICIET), Dhaka, Bangladesh, 23–24 December 2019; IEEE: New York, NY, USA, 2019; pp. 1–6. [Google Scholar]
  31. Backes, E.H.; Harb, S.V.; Pinto, L.A.; de Moura, N.K.; de Melo Morgado, G.F.; Marini, J.; Passador, F.R.; Pessan, L.A. Thermoplastic polyurethanes: Synthesis, fabrication techniques, blends, composites, and applications. J. Mater. Sci. 2024, 59, 1123–1152. [Google Scholar] [CrossRef]
  32. Arifvianto, B.; Iman, T.N.; Prayoga, B.T.; Dharmastiti, R.; Salim, U.A.; Mahardika, M.; Suyitno. Tensile properties of the FFF-processed thermoplastic polyurethane (TPU) elastomer. Int. J. Adv. Manuf. Technol. 2021, 117, 1709–1719. [Google Scholar] [CrossRef]
  33. Kharbas, H.A.; McNulty, J.D.; Ellingham, T.; Thompson, C.; Manitiu, M.; Scholz, G.; Turng, L.S. Comparative study of chemical and physical foaming methods for injection-molded thermoplastic polyurethane. J. Cell. Plast. 2017, 53, 373–388. [Google Scholar] [CrossRef]
  34. Polat, Y.; Pampal, E.S.; Stojanovska, E.; Simsek, R.; Hassanin, A.; Kilic, A.; Demir, A.; Yilmaz, S. Solution blowing of thermoplastic polyurethane nanofibers: A facile method to produce flexible porous materials. J. Appl. Polym. Sci. 2016, 133, 43025. [Google Scholar] [CrossRef]
  35. Koltsakidis, S.; Tsongas, K.; Tzetzis, D. Combining Micro and Macro Relative Density: An Experimental and Computational Study on Hierarchical Porous 3D-Printed Polylactic Acid Structures. Adv. Eng. Mater. 2024, 26, 2402012. [Google Scholar] [CrossRef]
  36. Hao, M.; Wang, J.; Wang, R.; Gong, M.; Zhang, L.; Wang, D.; Lu, Y.; Zhang, L.; Lin, X. Mechanical dependence of 3D-printed thermoplastic polyurethane reinforced with minor continuous carbon fibres. Virtual Phys. Prototyp. 2023, 18, e2224304. [Google Scholar] [CrossRef]
  37. Sánchez-Adsuar, M.S.; Linares-Solano, A.; Cazorla-Amorós, D.; Ibarra-Rueda, L. Influence of the nature and the content of carbon fiber on properties of thermoplastic polyurethane-carbon fiber composites. J. Appl. Polym. Sci. 2003, 90, 2676–2683. [Google Scholar] [CrossRef]
  38. Zhang, Y.; Zhang, Y.; Liu, Y.; Wang, X.; Yang, B. A novel surface modification of carbon fiber for high-performance thermoplastic polyurethane composites. Appl. Surf. Sci. 2016, 382, 144–154. [Google Scholar] [CrossRef]
  39. Lin, M.-C.; Lin, J.-H.; Bao, L. Thermoplastic polyurethane reinforced with continuous carbon fiber tows: Manufacturing technique and fabric property evaluation. Appl. Compos. Mater. 2021, 28, 1531–1546. [Google Scholar] [CrossRef]
  40. Niknam, H.; Akbarzadeh, A.H. Graded lattice structures: Simultaneous enhancement in stiffness and energy absorption. Mater. Des. 2020, 196, 109129. [Google Scholar] [CrossRef]
  41. Rahman, H.; Yarali, E.; Zolfagharian, A.; Serjouei, A.; Bodaghi, M. Energy absorption and mechanical performance of functionally graded soft–hard lattice structures. Materials 2021, 14, 1366. [Google Scholar] [CrossRef] [PubMed]
  42. Meyers, M.A.; Chen, P.-Y.; Lin, A.Y.-M.; Seki, Y. Biological materials: Structure and mechanical properties. Prog. Mater. Sci. 2008, 53, 1–206. [Google Scholar] [CrossRef]
  43. ISO 37:2024; Rubber, Vulcanized or Thermoplastic—Determination of Tensile Stress-Strain Properties. International Organization for Standardization: Geneva, Switzerland, 2024.
Figure 1. Presents a schematic overview of the gradient stiffness honeycomb study. Step 1 involves selecting geometry based on specified dimensions and dividing it into zones. Step 2 consists of selecting and assigning different materials to each zone to create a gradient in stiffness. In Step 3, the model is sliced and for 3D printing, with distinct materials allocated to the corresponding zones and with a dual-head FFF printer. Step 4 includes the investigation phase, which is carried out experimentally through compression tests and computationally via simulation of the same tests.
Jcs 09 00588 g001
Figure 2. Specimen preparation and characterization, (A) Dimensions of honeycombs structures (B) Compression test set up (C) Finite element analysis model for a three-zone gradience stiffness honeycomb. (D) Fabricated specimens for investigation.
Jcs 09 00588 g002
Figure 3. Tensile analysis of the 3D-printed TPU matrix materials.
Jcs 09 00588 g003
Figure 4. Shows the results of compression tests on single-material honeycombs. (A) displays stress–strain curves comparing experimental and simulation data of compression tests. The solid line indicates experimental results, while the dashed line represents computational data up to 60% strain. (B) presents the specific energy absorption (SEAv) across varying stress levels: region (i) highlights where the PO honeycomb performs best, (ii) indicates the dominance of the PL honeycomb, and (iii) shows where the CF honeycomb excels.
Jcs 09 00588 g004
Figure 5. Shows the results of compression tests on a dual material honeycomb made from a porous TPU zone and a plain TPU zone. (A) displays experimental stress–strain curves of compression tests. The transparent colored lines indicate the compression response of single-material honeycombs and are included for comparison purposes. (B) presents the specific energy absorption (SEAv) across varying stress levels: region (i) highlights where the PO honeycomb performs best, (ii) indicates the dominance of the PL honeycomb, and (iii) shows where the CF honeycomb excels.
Jcs 09 00588 g005
Figure 6. Shows the results of compression tests on a dual material honeycomb made from a porous TPU zone and a CF TPU zone. (A) displays experimental stress–strain curves of compression tests. The transparent colored lines indicate the compression response of single-material honeycombs and are included for comparison purposes. (B) presents the specific energy absorption (SEAv) across varying stress levels: region (i) highlights where the PO honeycomb performs best, (ii) indicates the dominance of the PL honeycomb, and (iii) shows where the CF honeycomb excels.
Jcs 09 00588 g006
Figure 7. Shows the results of compression tests on a dual material honeycomb made from a plain TPU zone and a CF TPU zone. (A) displays experimental stress–strain curves of compression tests. The transparent colored lines indicate the compression response of single-material honeycombs and are included for comparison purposes. (B) presents the specific energy absorption (SEAv) across varying stress levels: region (i) highlights where the PO honeycomb performs best, (ii) indicates the dominance of the PL honeycomb, and (iii) shows where the CF honeycomb excels.
Jcs 09 00588 g007
Figure 8. Presents the compression test results for a honeycomb structure composed of three distinct material zones: one made of porous TPU, one of plain TPU, and one reinforced with carbon fiber TPU. (A) displays stress–strain curves comparing experimental and simulation data of compression tests. The solid line indicates experimental results, while the dashed line represents computational data up to 60% strain. The transparent colored lines indicate the compression response of single-material honeycombs and are included for comparison purposes (B) presents the specific energy absorption (SEAv) across varying stress levels: region (i) highlights where the PO honeycomb performs best, (ii) indicates the dominance of the PL honeycomb, and (iii) shows where the CF honeycomb excels.
Jcs 09 00588 g008
Figure 9. Equivalent stress contours for single-material and three-material honeycombs compressed to 30% strain.
Jcs 09 00588 g009
Table 1. Experimental and simulation compressive strengths.
HoneycombExperimental (MPa)Simulation (MPa)Percentage Error (%)
PO0.610.668.20
PL1.291.376.20
CF6.316.093.33
PO_PL_CF1.081.156.48
Disclaimer/Publisher’s Note: The statements, opinions and data contained in all publications are solely those of the individual author(s) and contributor(s) and not of MDPI and/or the editor(s). MDPI and/or the editor(s) disclaim responsibility for any injury to people or property resulting from any ideas, methods, instructions or products referred to in the content.