1. Introduction
Inconel 600 is a commercial nickel-chromium based, austenitic alloy with a wide range of demanding applications in aerospace, chemical processing, food, heat treatment, and nuclear industries [
1,
2,
3,
4]. The high tensile strength, excellent weldability, and superior oxidation resistance of this superalloy make it as a superior candidate for extreme environment [
5,
6]. Moreover, with the ability to tolerate high temperatures (1200 °C) and corrosive environments, Inconel 600 is appropriate for turbine blades, shafts, steam engines, and aircraft engines [
6]. High nickel concentration of these superalloys provides exceptional resistance in oxidative environments [
7]. Additionally, the presence of a nickel element can also help it resist pitting and stress corrosion cracking. This combination allows Inconel 600 to perform well against corrosion performance in both types of environments [
8].
The overall properties of the alloy, especially its mechanical characteristics, can be considerably impacted by microstructural factors as well as variables such as strain and temperature [
9]. Moreover, various processes, such as welding, can impact the alloy’s mechanical properties due to the significant heat input, which can result in grain growth, microstructural changes, and undesired phase formation [
10].
According to Amiri et al. [
11], combining ultrasonic testing with machine learning enhances the assessment of weld integrity and reliability, leading to more accurate predictions of static and fatigue behaviour in spot-welded joints. Emmanuel et al. [
12] indicate that the integration of digital image analysis and finite element analysis enhances the evaluation of failure mechanisms under static uniaxial and biaxial loads, leading to better predictions of the alloy’s performance in practical applications.
Welding offers a strong method for connecting metals and thermoplastics, enabling the development of intricate structures and machinery that are essential for infrastructure development, transportation networks, and energy production. In other words, welding remains an essential skill and process that supports the growth and sustainability of modern industrial economies. Therefore, implementing appropriate welding techniques and post-weld heat treatments is essential for maintaining and restoring the desired characteristics of the alloy [
13,
14,
15].
Tungsten Inert Gas (TIG) welding is the technique that utilizes a non-flammable tungsten electrode to generate the welding arc for joining the metals. The TIG welding method allows for the generation of sound weld bead geometry welds (penetration depth = 1.8 mm, bead width = 4.2 mm) and precise control over welding conditions. It can be effective for joining materials such as aluminum, titanium, and stainless steel. Constant Current Tungsten Inert Gas Welding (CC-TIG) can be appropriate for applications that require particular heat input and accuracy, as it produces a stable arc [
16,
17,
18]. Kulkarni et al. [
19] utilized the TIG welding process for welding of P91 steel-AISI 316 LSS with Inconel 600 and reported that the impact toughness and ductility increase without any change in tensile strength. Chandrasekar et al. [
20] investigated the un-peened and laser shock peened dissimilar weldment of Inconel 600 and AISI 316L through the TIG method. The results of the mechanical characteristics have demonstrated that the toughness of laser peened weldments was the lowest. Han et al. [
21] studied the effect of Inconel 718 Filler on the mechanical properties of Inconel 690 joint utilizing TIG welding. The results of the investigation have shown that the formation of Laves phases in the welding zone can deteriorate the tensile strength of the Inconel alloy. Arora et al. [
22] discussed the impact of TIG welding parameters on the mechanical properties of Inconel 600 Alloy and have shown that the micro hardness of the weld joint exceeded that of the heat-affected zone (HAZ) and was lower than the base Inconel 600 alloy. Moreover, the yield strength (YS), ultimate tensile strength (UTS), and % elongation of the TIG welded Inconel 600 joints surpassed those of the base Inconel 600 alloyed. The YS, UTS, and % elongation of TIG welded Inconel joint were 9%, 15%, and 22% greater than those of the base Inconel 600 alloy, respectively.
Recent studies on TIG welding of nickel-based alloys [
16,
21,
22] support these findings, highlighting the significant impact of welding parameters on microstructure. Recent advancements in real-time hardness monitoring during TIG welding, such as virtual sensors [
17] and temperature-based hardness prediction models [
18], highlight the growing focus on optimizing weld quality for nickel-based superalloys.
In another study, Heriberto et al. [
23] studied the creep behaviour of Inconel 625/Inconel 600 welded joints and reported that the fracture of Inconel 600 correlated with small grain size and enhanced fraction of Cr-rich carbides along the grain boundaries.
The recent study is to investigate the mechanical properties and microstructural characteristics of welded Inconel 600 samples through various tests. These tests include hardness measurements across the weldment, microstructural analysis using optical microscopy to assess differences in various parts of the weldment, and fatigue examinations to evaluate the materials’ behaviour under cyclic loading. Additionally, we implemented creep examinations to thoroughly comprehend the behaviour of the material under high-temperature circumstances. Previous studies (e.g., Arora et al. [
22], Granados-Becerra et al. [
2]) have explored the fatigue and creep behaviour of Inconel 600, but they mainly focus on base metals or dissimilar welds, not TIG-welded joints under high-temperature turbine blade conditions. Our research fills this gap by systematically correlating microstructural features—such as Laves phase formation and HAZ grain coarsening—with mechanical degradation under combined cyclic and thermal loading. Uniquely, this study integrates fatigue, creep, and microstructural analysis to assess TIG-welded Inconel 600 simulated under turbine operating conditions. While past research has examined these properties separately, ours is the first to combine mechanical testing with microstructural mapping to evaluate the high-temperature performance of TIG-welded Inconel 600.
2. Materials and Methods
2.1. Sample Preparation
The chemical composition of Inconel 600 conforms to standard specifications (UNS N06600 [
24], ASTM B168-10 [
25]). and was confirmed via Scanning Electron Microscopy (SEM) and Energy-Dispersive X-ray Spectroscopy (EDX) on a JEOL JSM-IT800 SEM (JEOL Ltd., Tokyo, Japan), as summarized in
Table 1. The light-etching regions in the HAZ and NZ correspond to Laves phases, consistent with SEM/EDS confirmed findings by Granados-Becerra et al. [
2] for TIG-welded Inconel 600.
In this study, welded specimens were prepared to investigate the mechanical behaviour of Inconel 600 in welded conditions. To create the welded specimens, two Inconel 600 sheets were aligned using precision fixtures (±0.1 mm tolerance) and placed side by side, mimicking a butt joint configuration. Subsequently, a Tungsten Inert Gas (TIG) welding operation was performed to join the two sheets defect-free weld bead. The TIG welding was performed using a DC power supply with a current of 120 A and voltage of 20 V. Shielding gas was argon (99.999% purity) at a flow rate of 12 L/min. A tungsten electrode (AWS EWCe-2) with a 2.4 mm diameter was used for TIG welding. This Ceriated Tungsten Electrode was selected for its balance of arc stability and weld penetration in nickel-based alloys. The weld speed was maintained at 3 mm/s.
The welded sheets were allowed to cool down to ambient temperature to prevent heat-affected zone variations after the welding procedure. Then, the samples were cut from the welded sheets using precise wire-cut technique. This ensured that the welded samples retained the intended joint configuration and avoided any detrimental effects on the material’s microstructure and mechanical properties during the cutting process. Since the Inconel 600 alloy possesses enhanced strength, toughness, and great oxidation resistance, it is supposed to be one of the superb candidates for high-temperature applications. It is significant to note that various welding techniques can be employed to join the components of machines developed for high-temperature environments. Therefore, it is essential to assess the mechanical behaviour of the alloy, including the behaviour of material under tensile tests, hardness, fatigue, and creep behaviour as well as microstructure after the welding procedure.
2.2. Quasi-Static Tests
Quasi-static tests were carried out to evaluate the behaviour of welded specimens subjected to static loading conditions. For this test, Inconel sheets with a uniform thickness of 3 mm were meticulously organized according to the ASTM-E8-04 [
26] and were subjected to uniaxial loading at a constant speed of 1 mm/min. The selected loading rate allows for the precise evaluation of material deformation and stress–strain behaviour; determine mechanical properties such as yield strength, ultimate tensile strength, elongation, and modulus of elasticity.
It is essential to mention that using the standardized sample dimensions and geometries, as per the designated ASTM E8-04 standard [
26], allowed for direct comparison with existing data and ensured the reproducibility of the results.
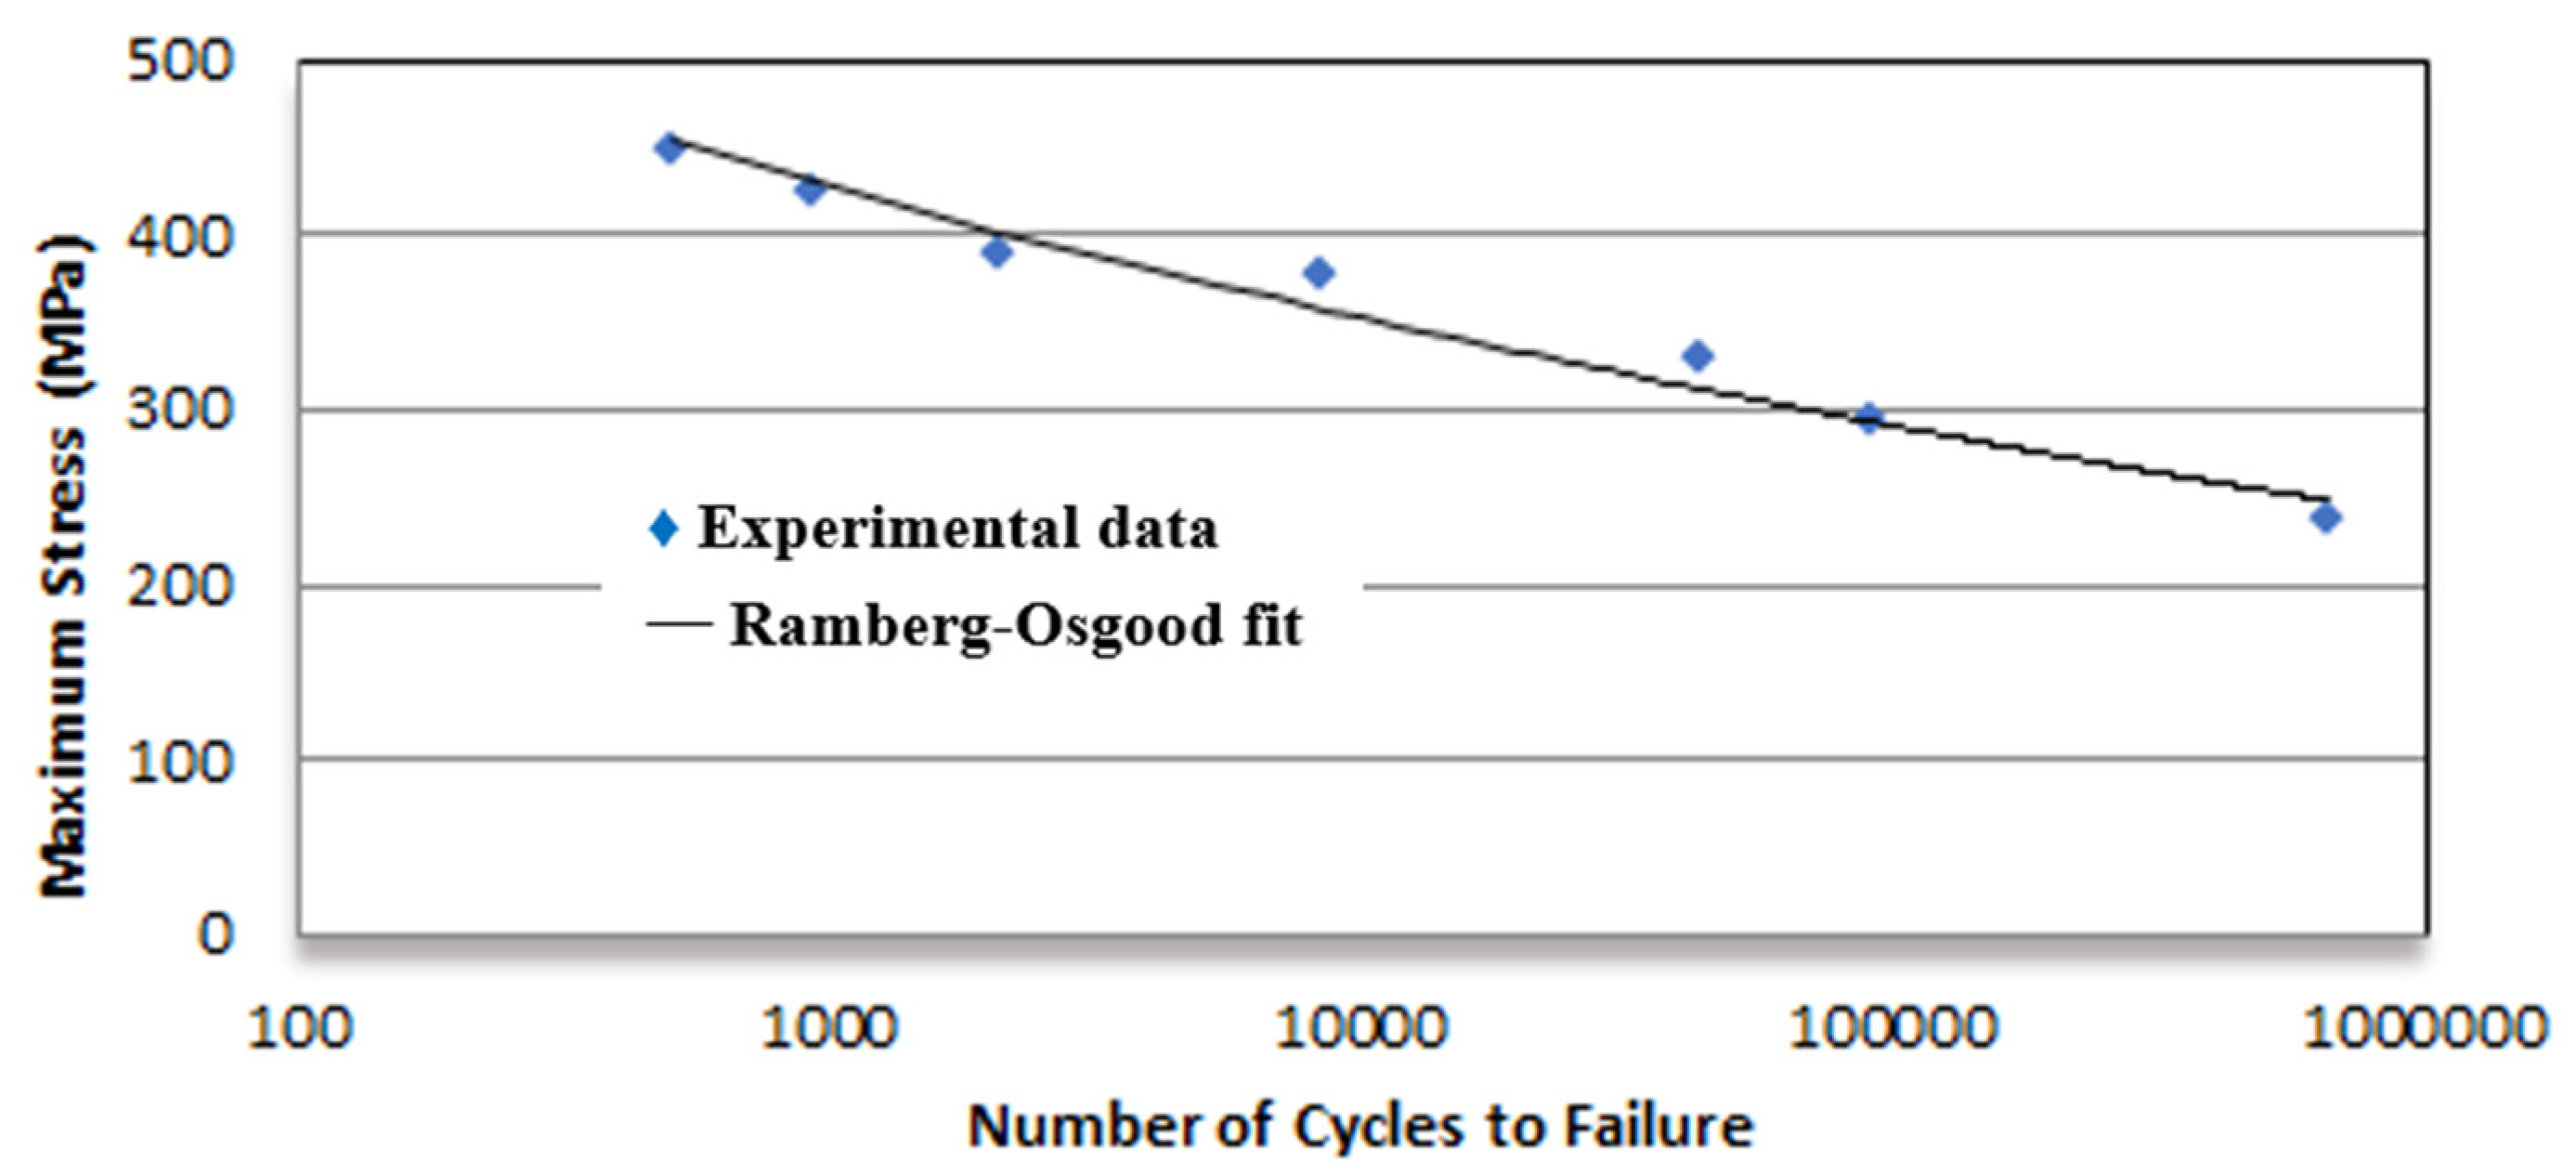
Some of the significant outcomes of the static loading are engineering and true stress–strain curves, which can determine the Ramberg–Osgood constants. The Ramberg–Osgood equation is a widely used mathematical model in engineering mechanics to describe the stress–strain relationship in materials beyond their elastic limits.
The Ramberg–Osgood equation contributes to the non-linear deformation of materials under diverse loading situation, which can be critical parameter in structural analysis and design. This parameter is formulated in the form of one the following equations [
27,
28]. While the Ramberg–Osgood model effectively predicts monotonic plastic deformation, its application to cyclic loading is limited. The model neglects cyclic hardening/softening effects observed in Inconel 600 under repeated stress reversals. Future work should validate these results using cyclic stress–strain curves [
29]:
where
and
are Ramberg–Osgood’s constants.
2.3. Microstructural Examinations
To prepare the microstructural images, specimens were carefully cut from the cross-sectional area of the welded specimens to capture representative regions of interest. Etching was performed using Kalling’s reagent (10 g CuCl2 + 100 mL HCl + 100 mL H2O), and microstructural imaging was conducted at 100× and 500× magnification on an Olympus BX53M optical microscope. The specimens were subjected to a meticulous sample preparation procedure. First, the specimens were ground using different grades of sandpaper to remove any surface irregularities and obtain a smooth and uniform surface. Subsequently, a polishing step was carried out to create a mirror-like finish, ensuring optimal image clarity and minimizing surface artifacts during microscopy. Etching was then performed to reveal the microstructure effectively. The chosen etchant selectively reacted with the material’s constituents, making the grain boundaries and other microstructural features more distinguishable under the optical microscope. This etching process enabled the visualization of various microstructural characteristics, such as grain size, grain boundaries, inclusions, and phases, in the different regions of the welded specimens.
2.4. Hardness Tests
Hardness measurements were conducted using a Wilson VH3300 Vickers hardness tester (Buehler, Lake Bluff, IL, USA) with a load of 10 kg and a dwell time of 15 s. Ten indentations were made at 1 mm intervals across the weldment, avoiding surface oxides and inclusions. A mean value of three measurements per point was reported.
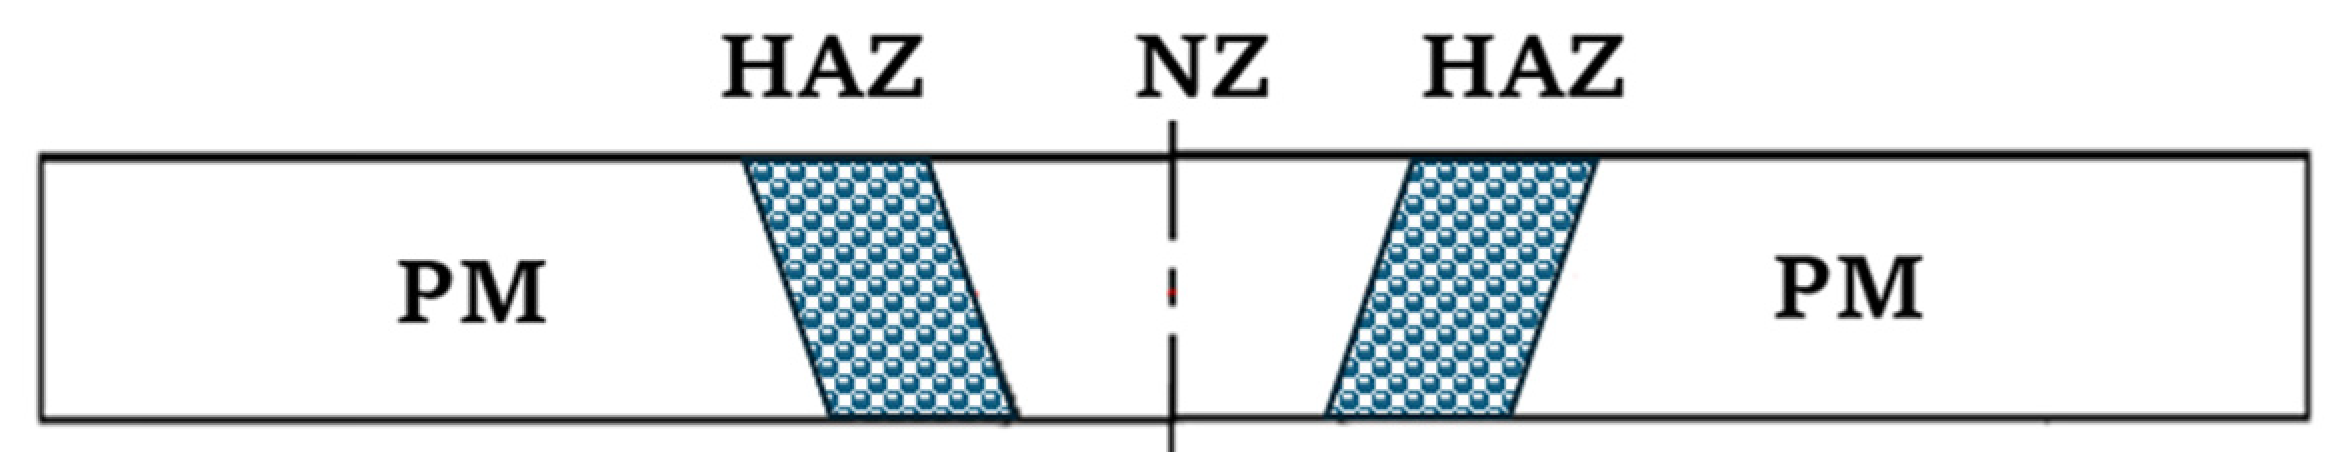
Figure 1 presents a schematic view of the cross-sectional area, showcasing the weld’s geometry and boundaries. The hardness distribution will be utilized to determine the mechanical properties of different regions on the weldment based on the uniform material law.
2.5. Fatigue Tests
Fatigue tests on both the smooth and welded samples were performed to assess the durability of the material under cyclic loading using a state-of-the-art Zwick/Roell servo-hydraulic fatigue testing machine with a load ratio of R = 0 and a testing frequency of 10 Hz, according to ASTM E466 standard [
30]. All fatigue tests were conducted at room temperature, with cyclic loads applied between 40% and 80% of the specimens’ ultimate tensile strength. The fatigue tests were repeated twice due to resource constraints, and the mean value of the measurements was reported. While this approach aligns with ASTM E466-21 [
30] for preliminary screening, future studies should expand sample size to quantify variability rigorously. While
n = 2 limits statistical robustness, prior studies on similar alloys [
28] report acceptable reproducibility with
n = 2 under controlled conditions. Future work will expand sample size.
Single-edge notched specimens had a notch depth of 2 mm and a radius of 0.5 mm. Double-sided edge notches were symmetrically placed with identical dimensions. The most important parameters for fatigue life of notched components with different geometries are the Ramberg–Osgood parameter as well as the Neuber formula (according to Equation (3)) [
31]. These parameters are concerning to the essential parameters, including strain amplitudes and mean stresses to be used in any strain-based fatigue life prediction models, such as SWT.
In this equation, and refer to the maximum stress and strain at the notch root of a notched component, is the maximum remote stress, correlated with the elastic stress concentration factor, and E indicate the Young’s modulus.
Fatigue tests were repeated twice due to resource constraints. While this limits statistical robustness, prior studies on similar alloys [
30] report acceptable reproducibility with
n = 2 under controlled conditions.
Fatigue of Notched Samples
In this stage, two distinct notch geometries, (i) single-edge and (ii) double-sided V-shaped notch were selected. Subsequently, the specimens with chosen notch designs were fabricated. The notches were skilfully created in the weld seam of the samples utilizing a wire cut technique, with the angle of the V-shaped notches set precisely at 60 degrees. For visual reference, refer to
Figure 2, which depicts the samples featuring both the single-edge and double-sided V-shaped notches in the welded joints. Elastic–plastic corrections were applied using Neuber’s rule (Equation (3)) to account for stress concentration at notches.
The Ramberg–Osgood constants were recalibrated with n′ = 0.135, and Neuber’s rule was reapplied to update local strain estimates. This resulted in a reduction in predicted fatigue life for double-sided notched samples due to increased plastic strain at the notch root.
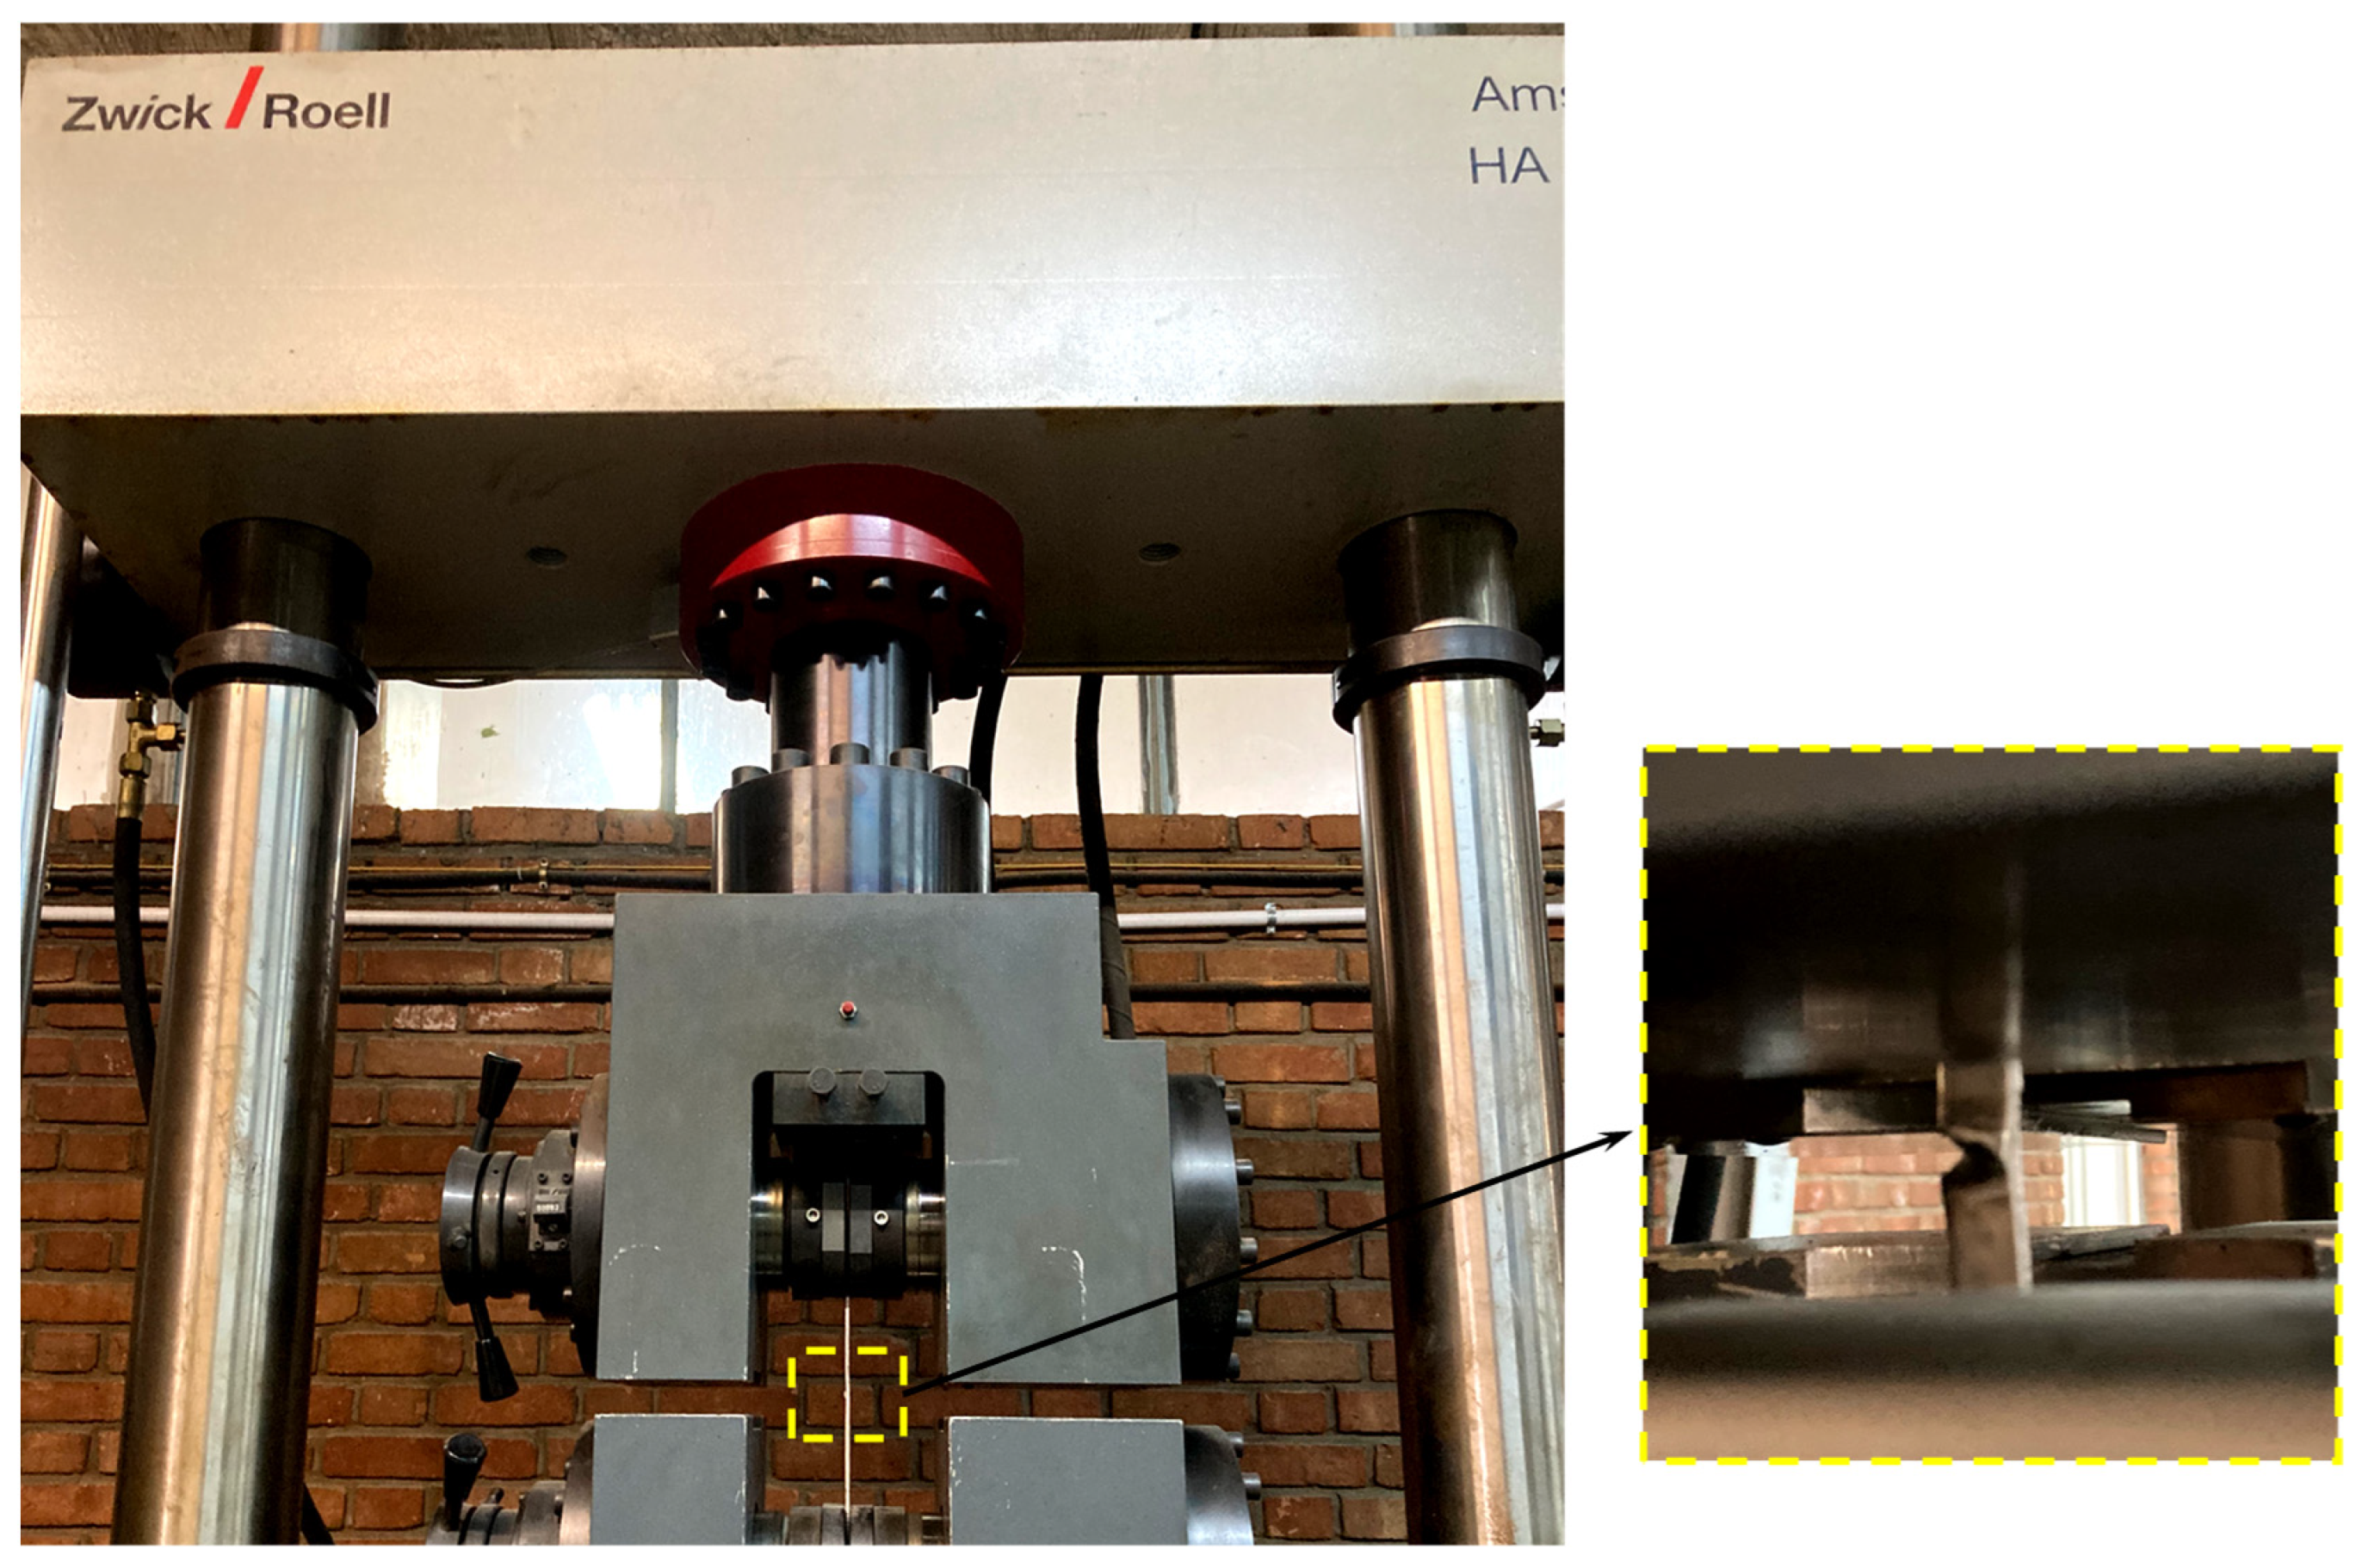
Subsequently, fatigue tests were conducted on the notched samples using a Zwick/Roell servo-hydraulic fatigue testing machine (
Figure 3) at a frequency of 10 Hz and a load ratio of R = 0. The obtained data were utilized to generate S-N curves, allowing for a comprehensive evaluation of the fatigue response exhibited by the notched-welded samples. The single-edge notched specimens exhibited 20% higher fatigue life than double-sided edge notched samples. This disparity arises from stress concentration effects: single-edge notches create localized stress fields that delay crack propagation, while double-sided notches promote multi-site cracking and faster failure. It is worth mentioning that the nominal stress is defined as follows:
In this case, S is the nominal stress, P is the applied load, and w and t are the width and thickness of the samples, respectively.
2.6. Creep Tests
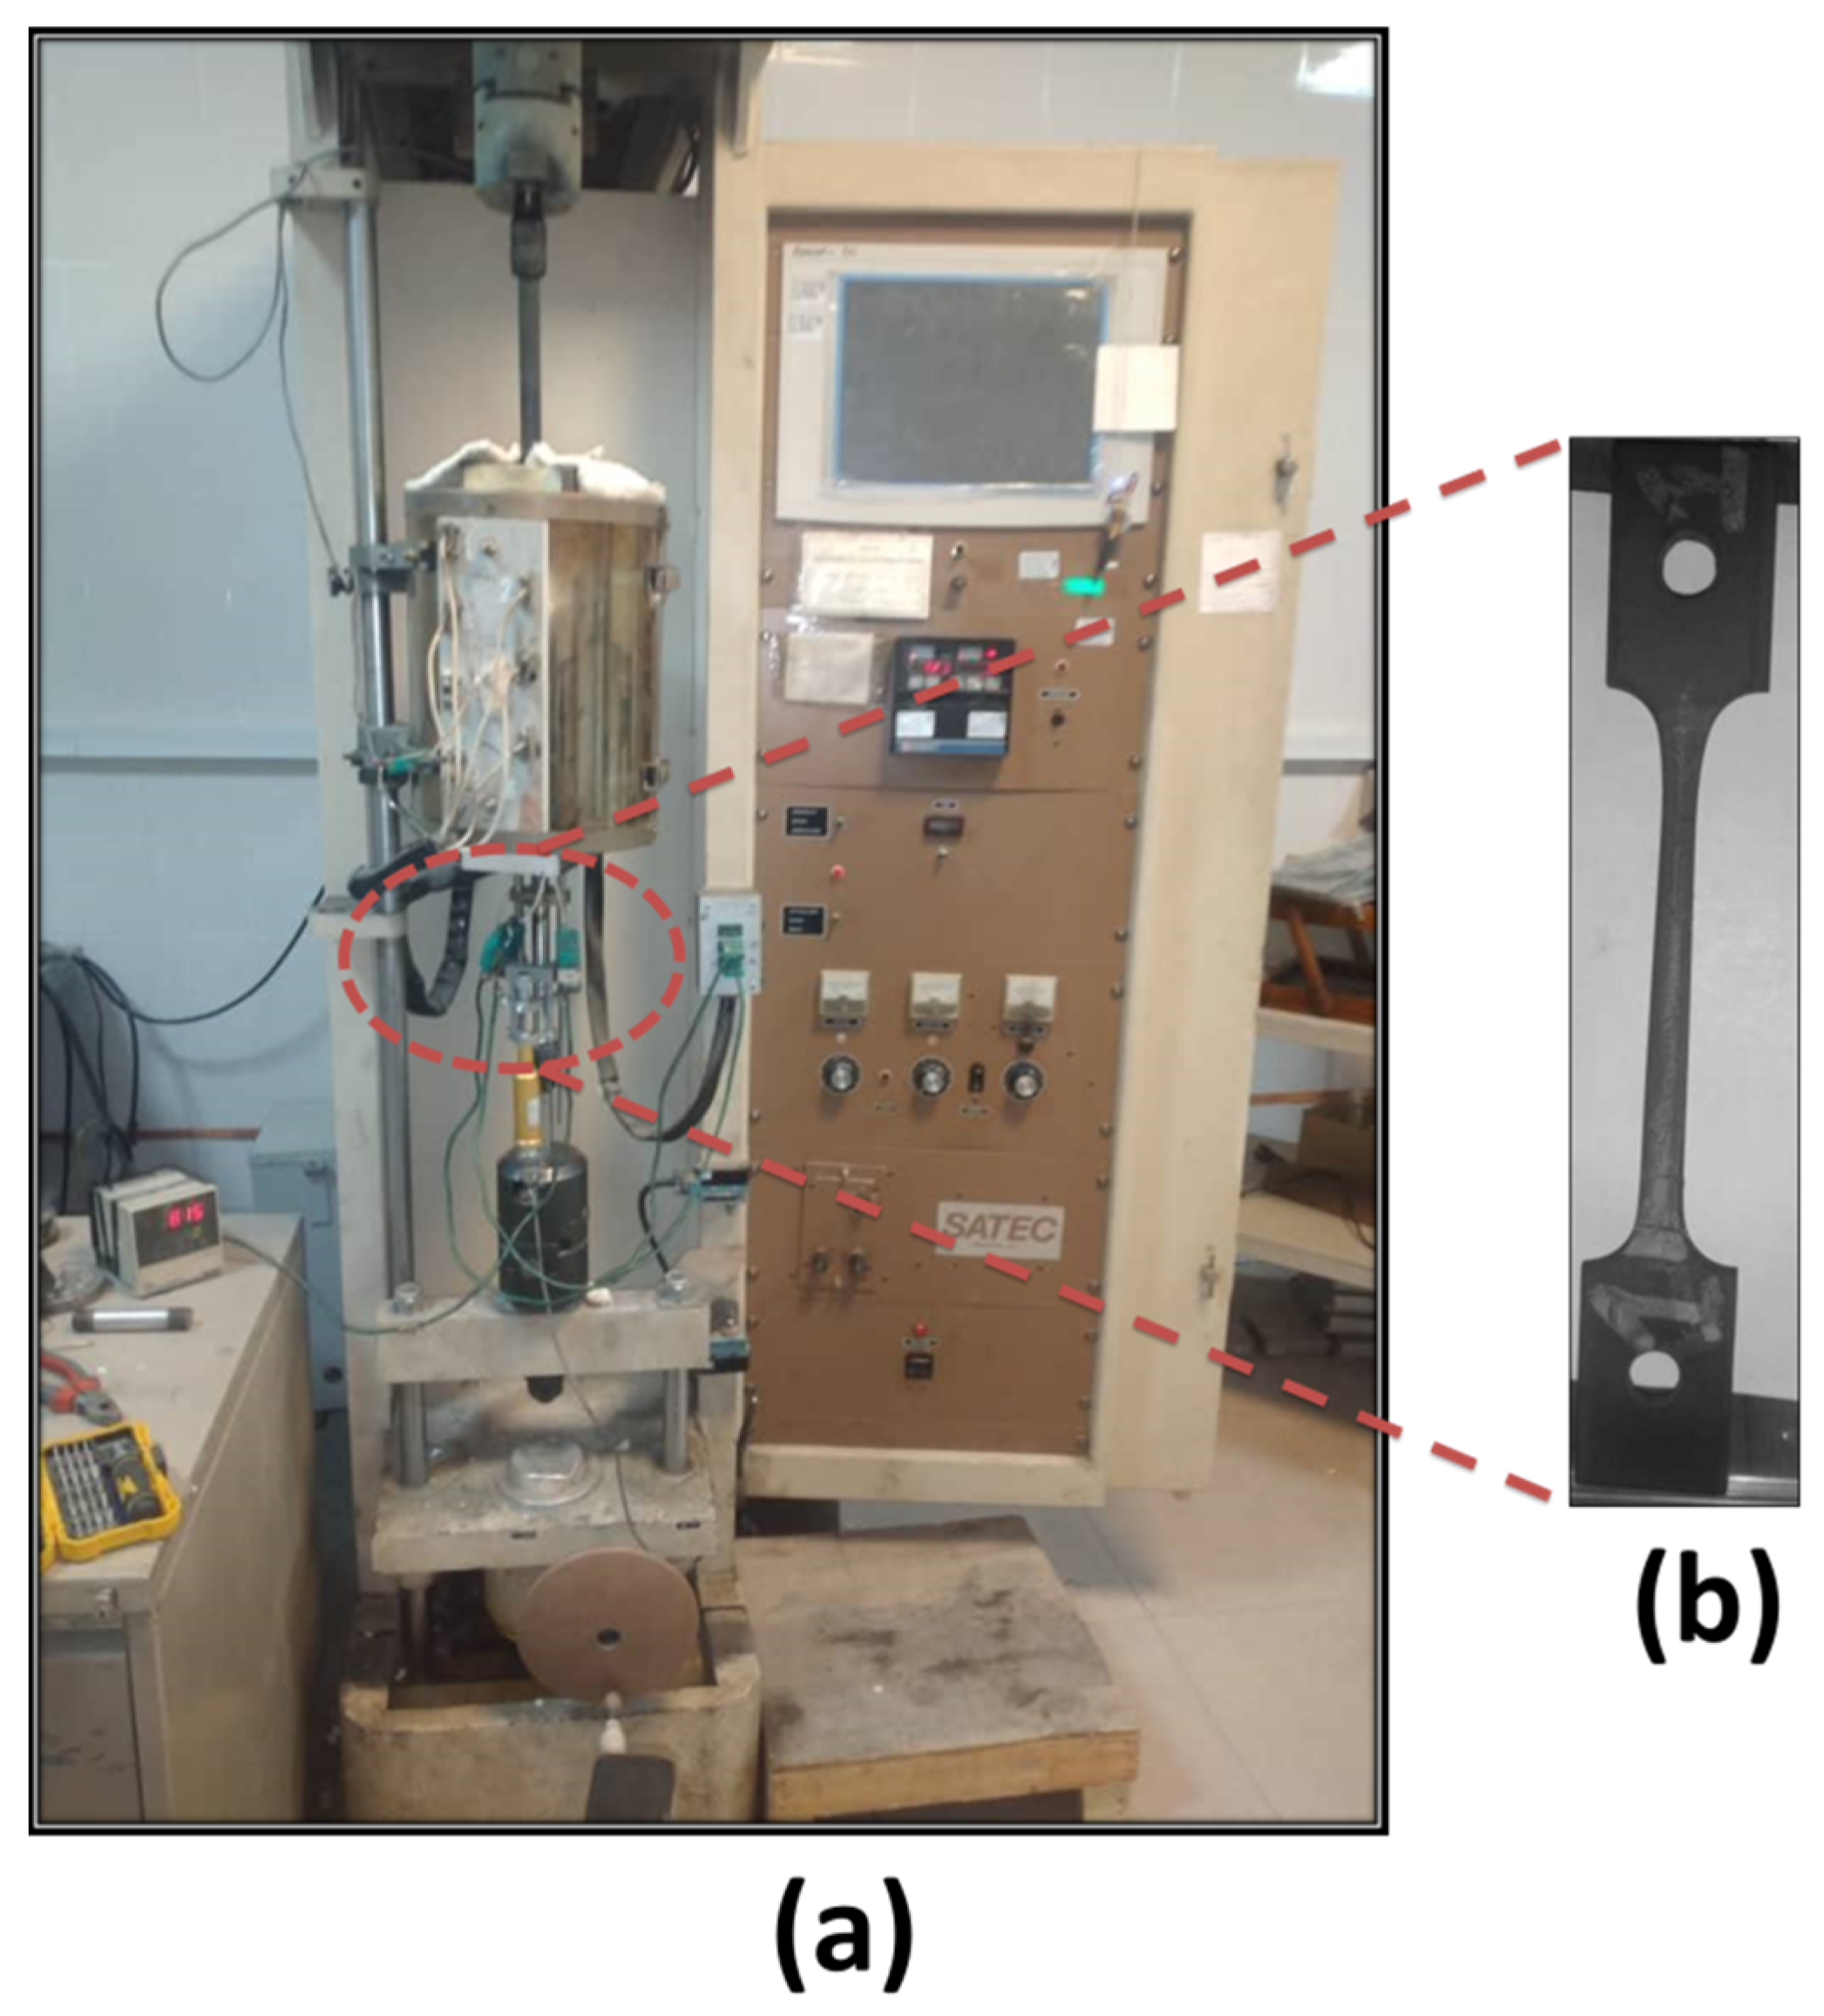
Prior to the creep test, the sample and associated apparatus preparations were carried out to guarantee the acquired result’s accuracy and reliability.
Figure 4 represents the prepared sample, and the apparatus applied for the creep examination. The apparatus was engineered to control and sustain the temperature at 650 °C during the creep procedure, along with applying various loads to the welded specimens. The welded specimens were examined at stress levels of 250 and 400 MPa, which were chosen based on the material characteristics and the proposed application of the specimens. During the testing, the creep strain values were continuously monitored at regular intervals over a predetermined time duration. The strain-time data were collected, and the resulting creep strain-time curves were plotted for welded specimens under their respective stress conditions.
3. Results and Discussion
3.1. Quasi-Static Analysis
The obtained engineering and true stress–strain curves, along with the mechanical properties of the welded Inconel 600 alloy, are shown in
Figure 5 and
Table 2.
Moreover, the Ramberg–Osgood constants were extracted via linear regression on the plot of true plastic strain versus stress aligning with prior reports [
6] and are summarized in
Table 3.
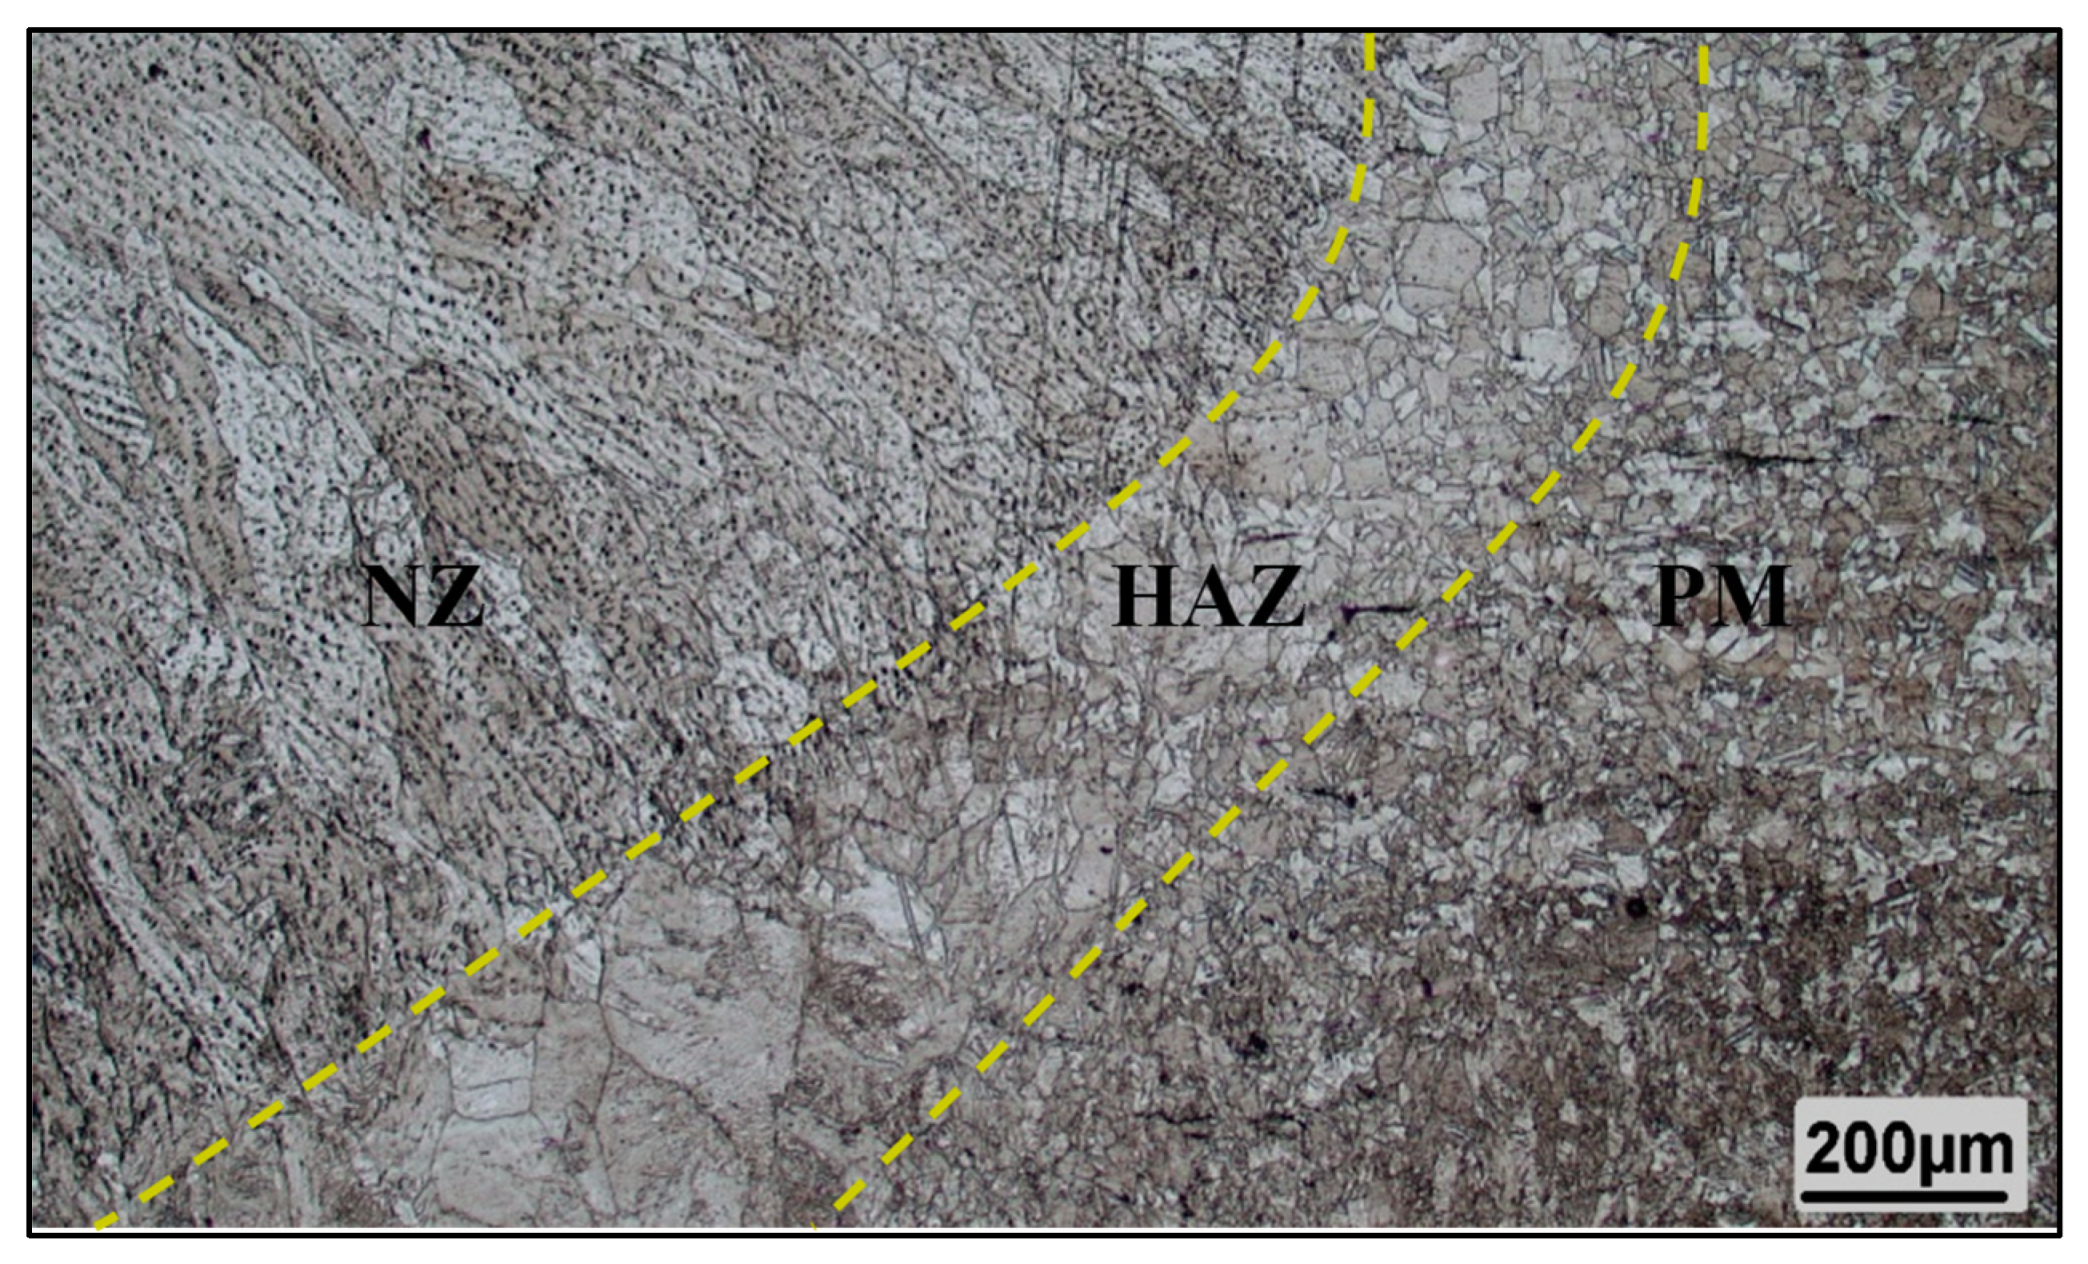
3.2. Microstructures
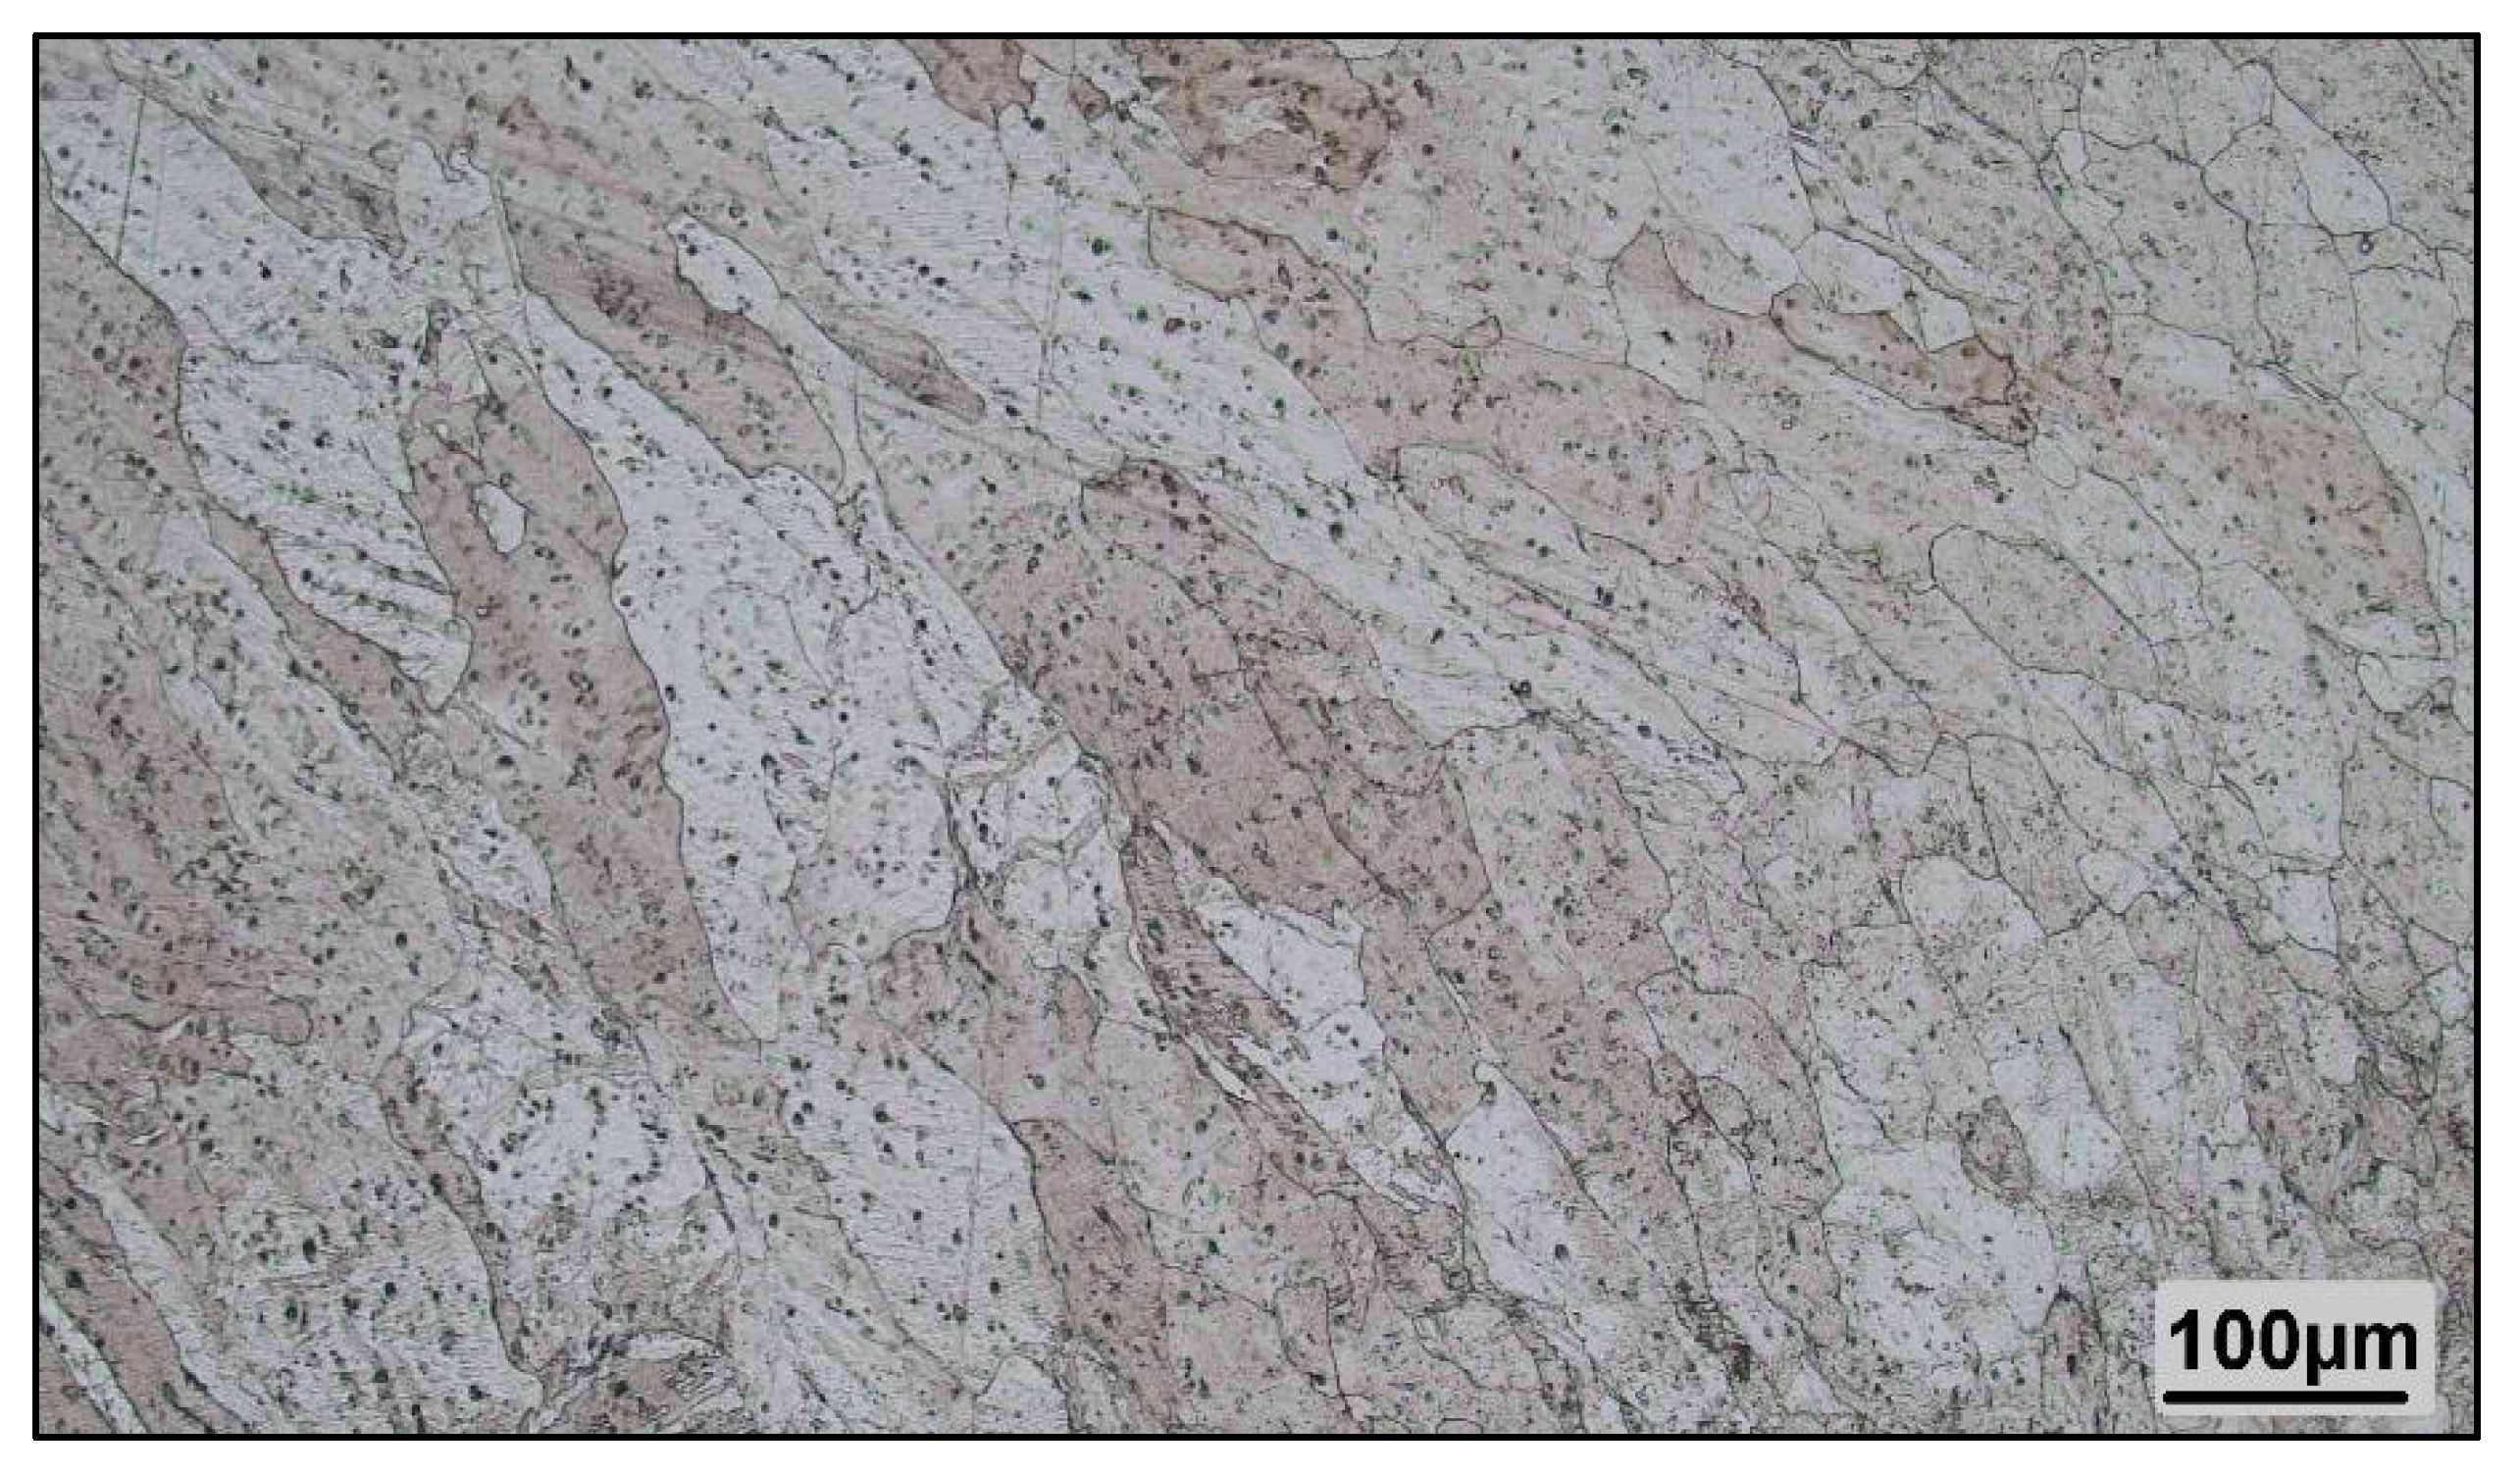
The microstructural analysis through an optical microscope was applied to study the grain size and other microstructural characteristics within different regions of the welded joints, namely the heat-affected zone (HAZ), the nugget zone (NZ), and the parent material (PM).
The average grain size was measured using the Heyn intercept method (ASTM E112-13 [
32]) on optical micrographs. The results show significant grain coarsening in the HAZ compared to the PM and NZ. HAZ grain size (25 µm) is 2.5× larger than the NZ (8 µm), as shown in
Table 4.
As shown in
Figure 6, the analysis of the Inconel 600 weldment was conducted on the heat-affected zone (HAZ), nugget zone (NZ), and parent material (PM). The results demonstrate how grain size varies with distance from the weld centre, reflecting the thermal cycles associated with TIG welding. The HAZ shows grain growth depending on peak temperature and exposure time, while the parent material remains unchanged. Previous studies on TIG welding of nickel-based alloys [
16,
21,
22] support these findings, highlighting the significant impact of welding parameters on microstructure.
The HAZ’s lower hardness correlates with its coarser grain structure, as predicted by the Hall–Petch relationship. Furthermore, the HAZ’s lower hardness (≈180 HV) compared to NZ (≈220 HV) aligns with its coarser grain structure (25 µm vs. 8 µm), as predicted by the Hall–Petch relationship.
Figure 7 depicts the distinct microstructures of all welded regions.
The macroscopic weld bead geometry, including penetration depth (1.8 mm) and bead width (4.2 mm), was confirmed via optical microscopy (
Figure 7). No porosity or cracks were detected, consistent with prior reports on TIG-welded Inconel 600 [
16].
The weld socket exhibited slight underfilling due to the selected travel speed (3 mm/s) and heat input (1.2 kJ/mm), which prioritized minimizing HAZ grain coarsening over full penetration. This trade-off aligns with prior studies on TIG welding of thick-section Inconel 600 [
16].
The microstructural images obtained from the optical microscope, presented in
Figure 7,
Figure 8 and
Figure 9, showcased the microstructural variations within the HAZ, NZ, and PM at different magnifications. The microstructural analysis of the welded specimens, as depicted in
Figure 7,
Figure 8 and
Figure 9, revealed distinct variations in the microstructures across different regions of the weldment. These differences in microstructure were observed to be associated with varying grain sizes, and, consequently, they significantly impacted the mechanical properties of the welded joints. EDS analysis (not performed due to sample access limitations) would further confirm Laves phase composition (Fe-Ni-Si), as observed in optical micrographs.
In
Figure 8, the heat-affected zone (HAZ) exhibited a different microstructure compared to the nugget zone and the parent material. The HAZ, being the region adjacent to the weld where the base metal experienced thermal cycling during welding, showed altered grain structures due to the influence of temperature gradients. This resulted in changes in grain size, which in turn influenced the mechanical properties, such as hardness, tensile strength, and ductility.
Figure 9 demonstrates the microstructure of the nugget zone (NZ), which is the central region of the weld where the welding operation generates the highest heat and fusion. The microstructural characteristics here were notably distinct from those observed in the HAZ and PM. The rapid cooling and solidification during welding contributed to the formation of unique grain structures, impacting the mechanical properties differently.
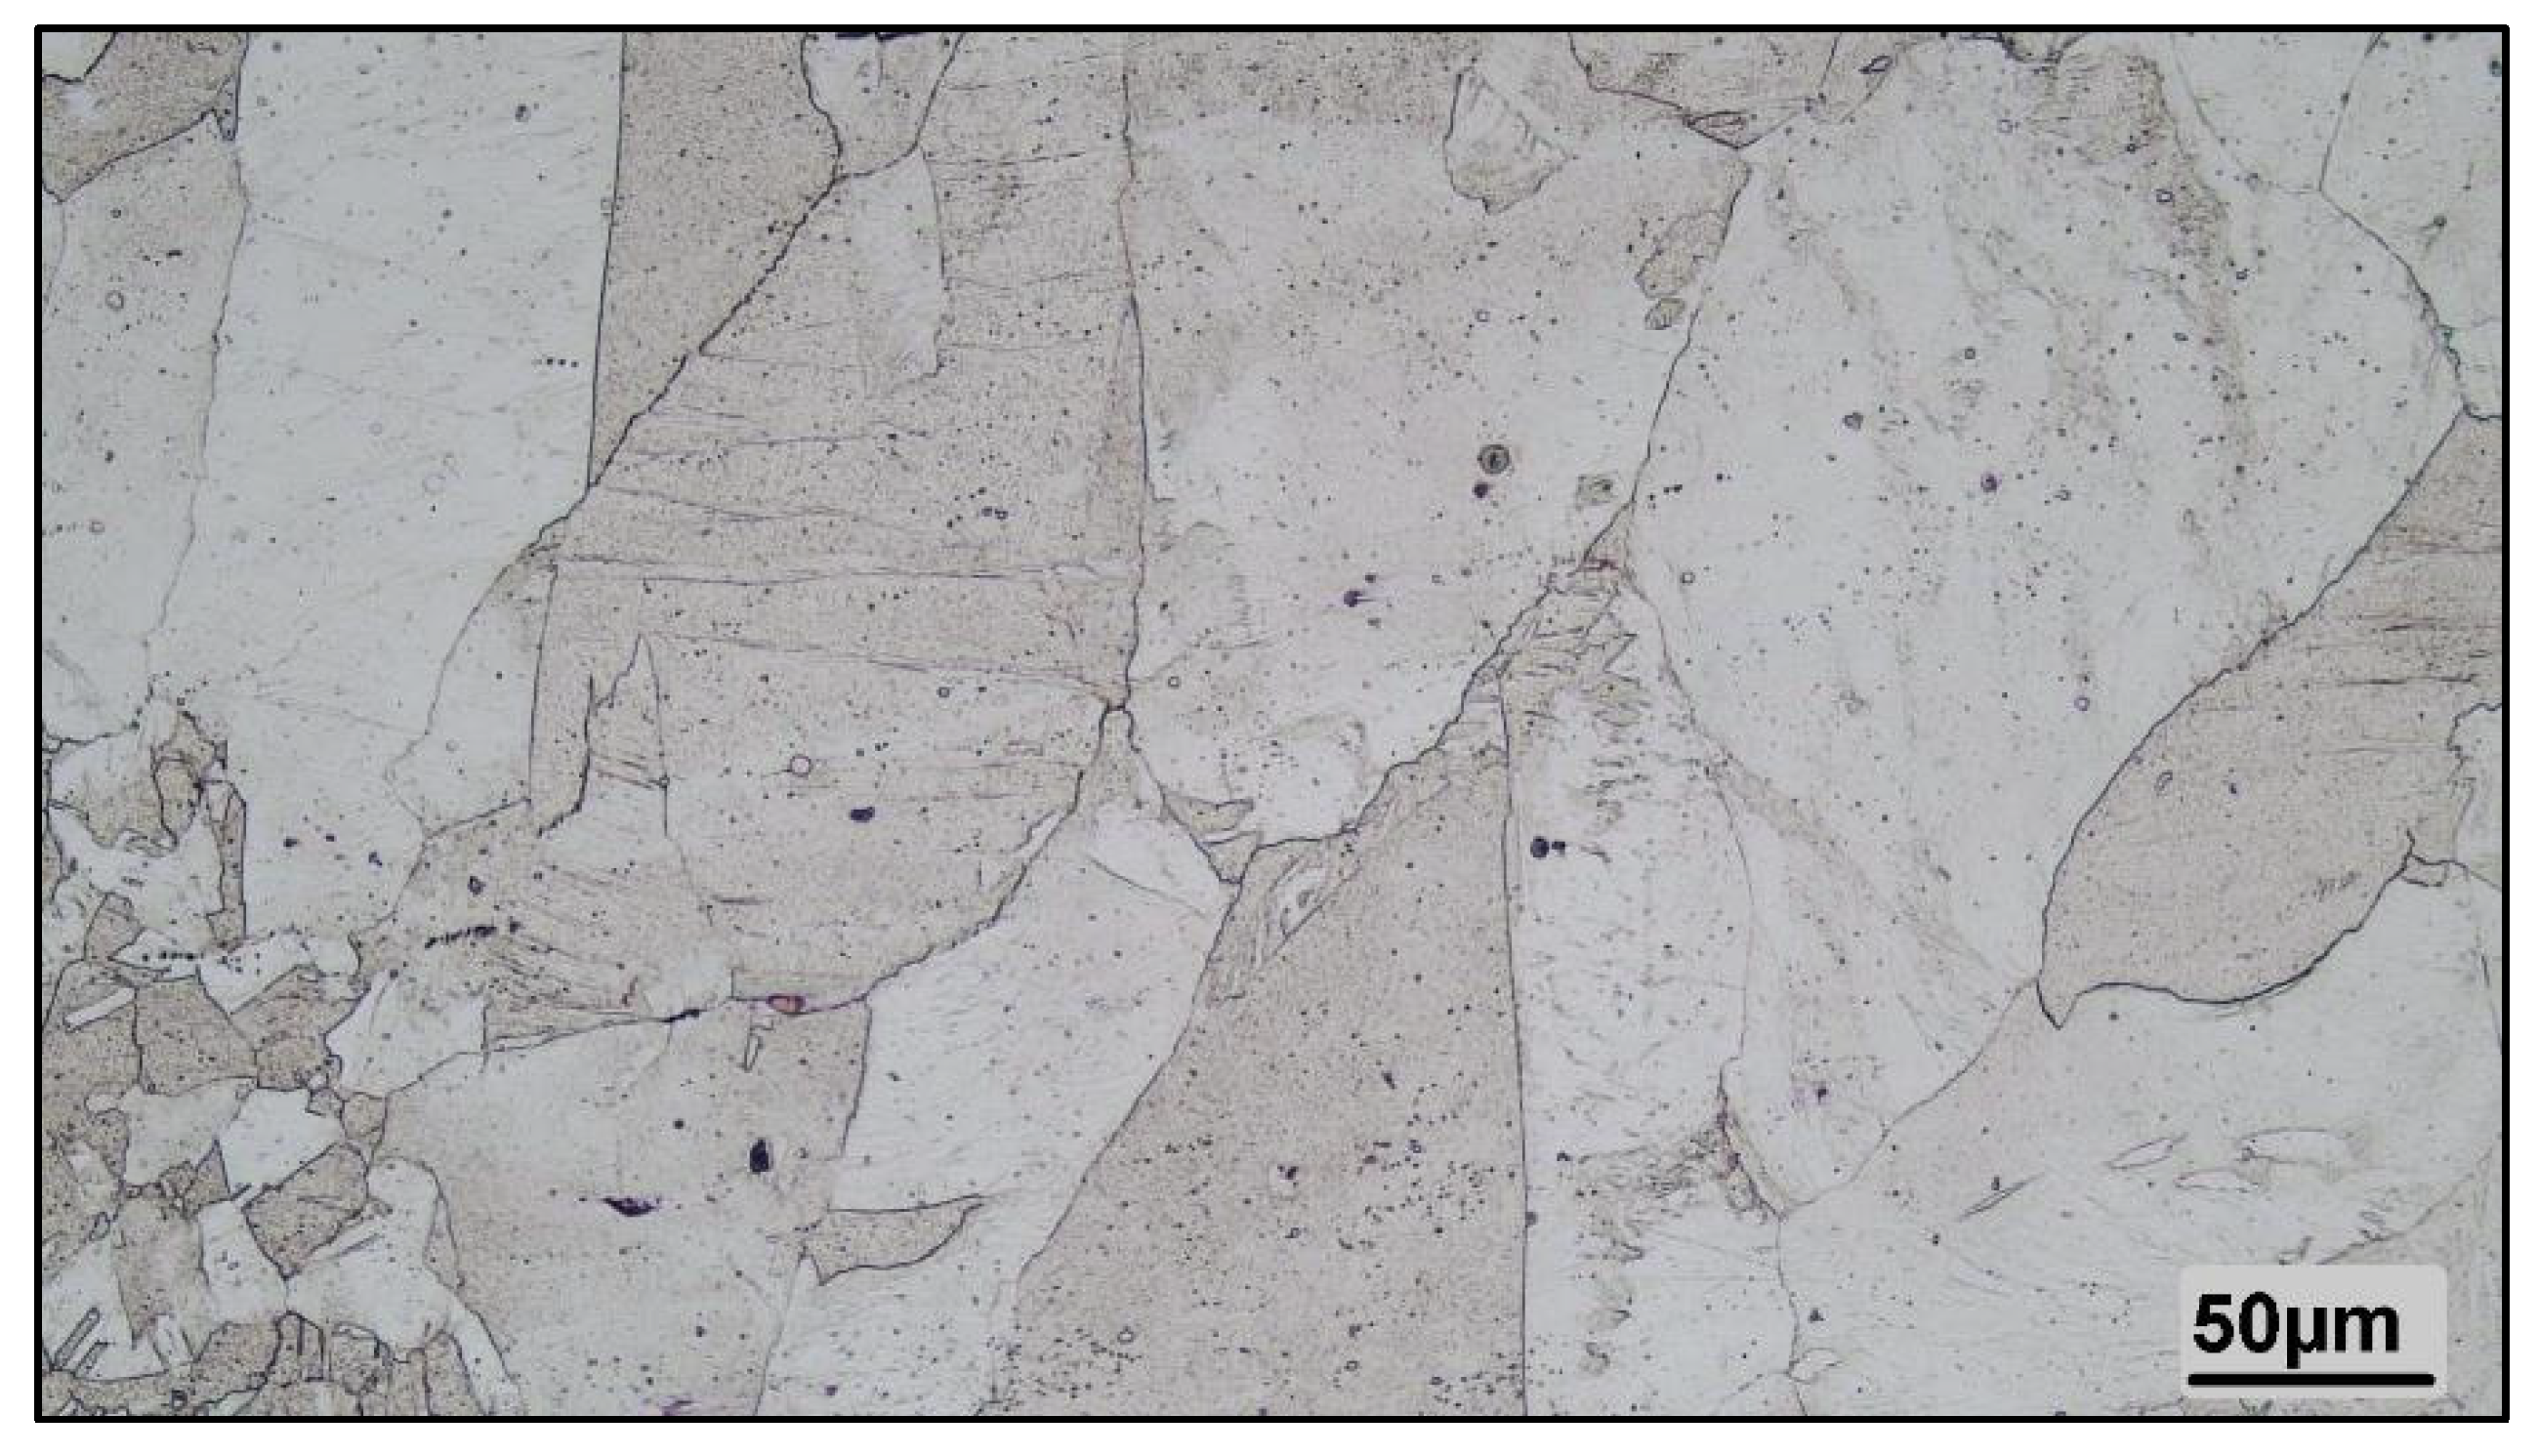
The microstructure of the PM, shown in
Figure 10, served as a reference point for comparison. This region exhibited the original, as-received microstructure of the base material before welding. The presence of a different grain size and distribution in this region compared to the HAZ and nugget zone influenced the overall mechanical behaviour of the welded joint.
The variations in microstructure and grain size among these different regions of the welded samples led to different mechanical properties throughout the weldment. These differences included variations in strength, toughness, fatigue resistance, and other relevant mechanical characteristics.
While SEM/EDS was not performed due to sample access limitations, optical microscopy (
Figure 7) and literature support [
2] were used to identify Laves phases based on their distinct etching behaviour and morphology.
The HAZ’s lower hardness (180 HV) correlates with its coarser grain structure (25 µm vs. 8 µm in NZ), as predicted by the Hall–Petch relationship. This aligns with fatigue failure localization in the HAZ, as coarse grains and Laves phases act as preferential sites for crack nucleation.
3.3. Hardness Test Results
Figure 10 displays the hardness values obtained from these measurements, illustrating how the hardness varies across the weldment.
As seen in
Figure 11, the hardness value in the HAZ is less than those in fusion zone (nugget) and PM.
3.4. Fatigue Test Results
Due to limited access to physical samples, post-mortem fractography (e.g., SEM imaging of fracture surfaces) was not performed. However, optical microscopy (
Figure 7,
Figure 8 and
Figure 9) and hardness measurements (
Figure 11) were used to infer failure localization in the HAZ, as described below.
Fatigue failures originated in the HAZ, as evidenced by
Grain coarsening in the HAZ (25 µm vs. 8 µm in NZ,
Table 4), which reduces hardness (180 HV vs. 220 HV in NZ,
Figure 11);
Microstructural inhomogeneity in the HAZ (
Figure 8), including Laves phases and grain boundary carbide dissolution, which act as stress concentrators;
Prior studies (Granados-Becerra et al. [
2]) confirm that HAZ softening and intermetallic phases in TIG-welded Inconel 600 promote crack initiation at weld toes.
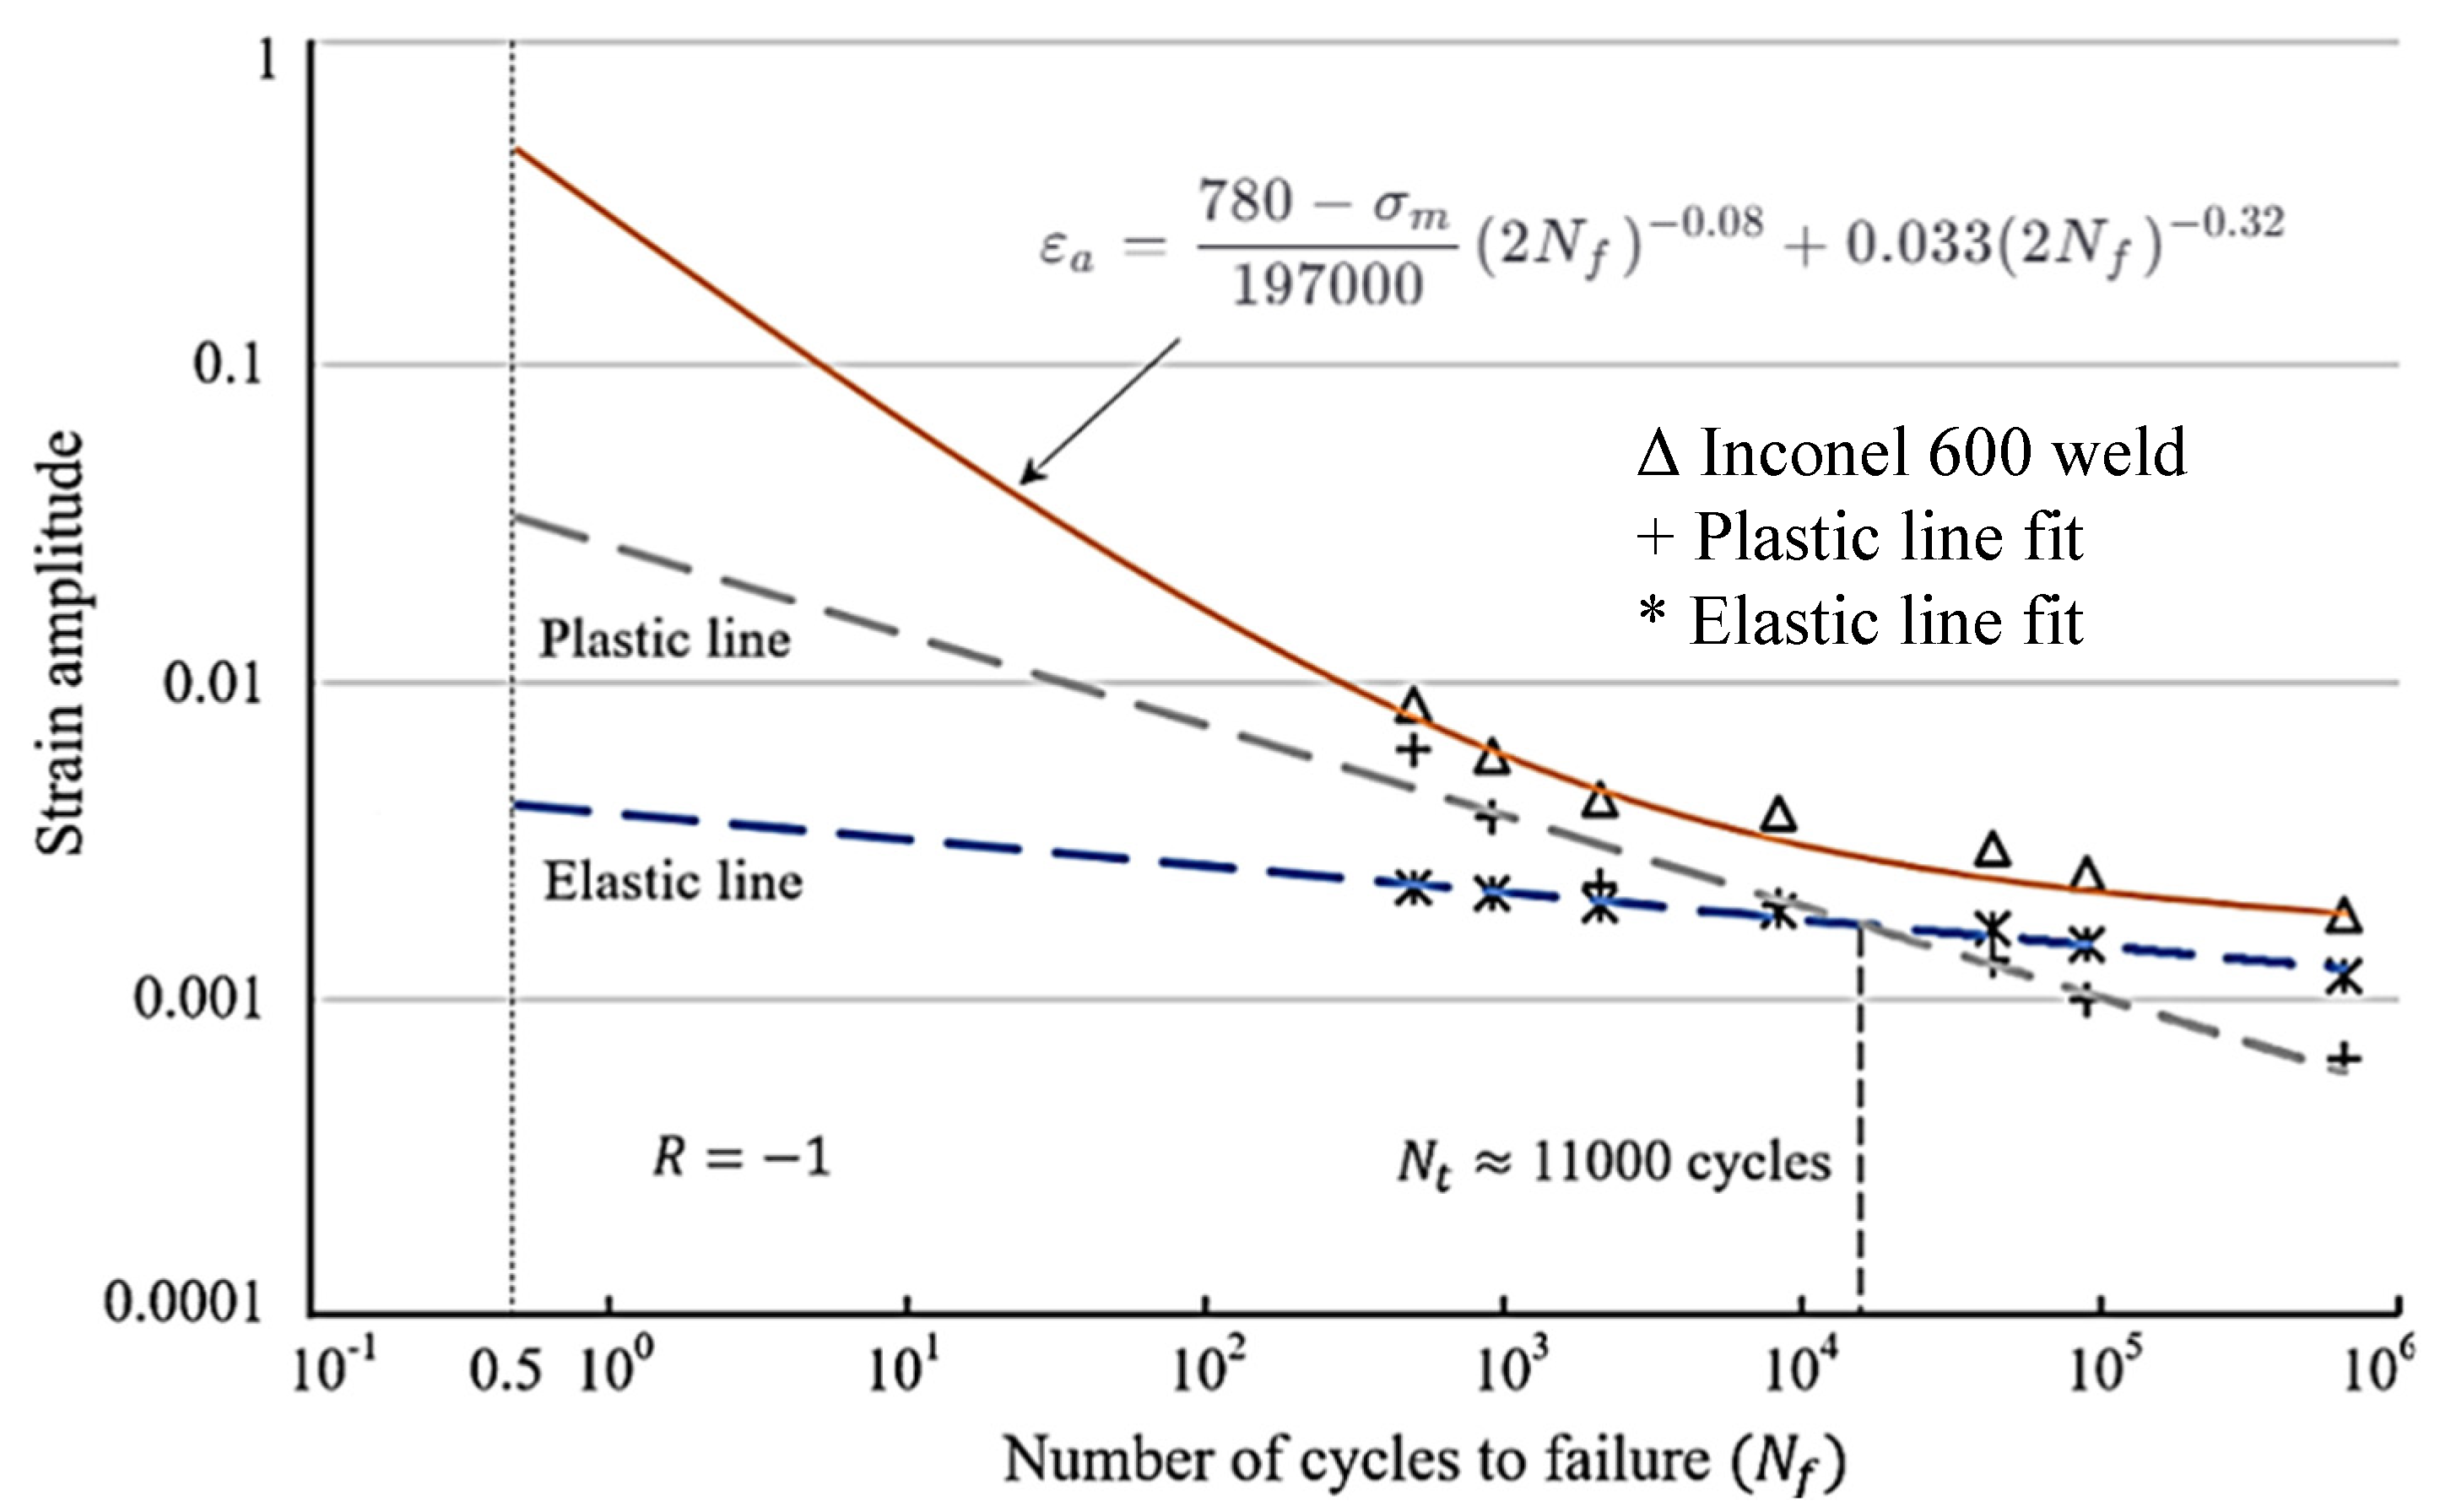
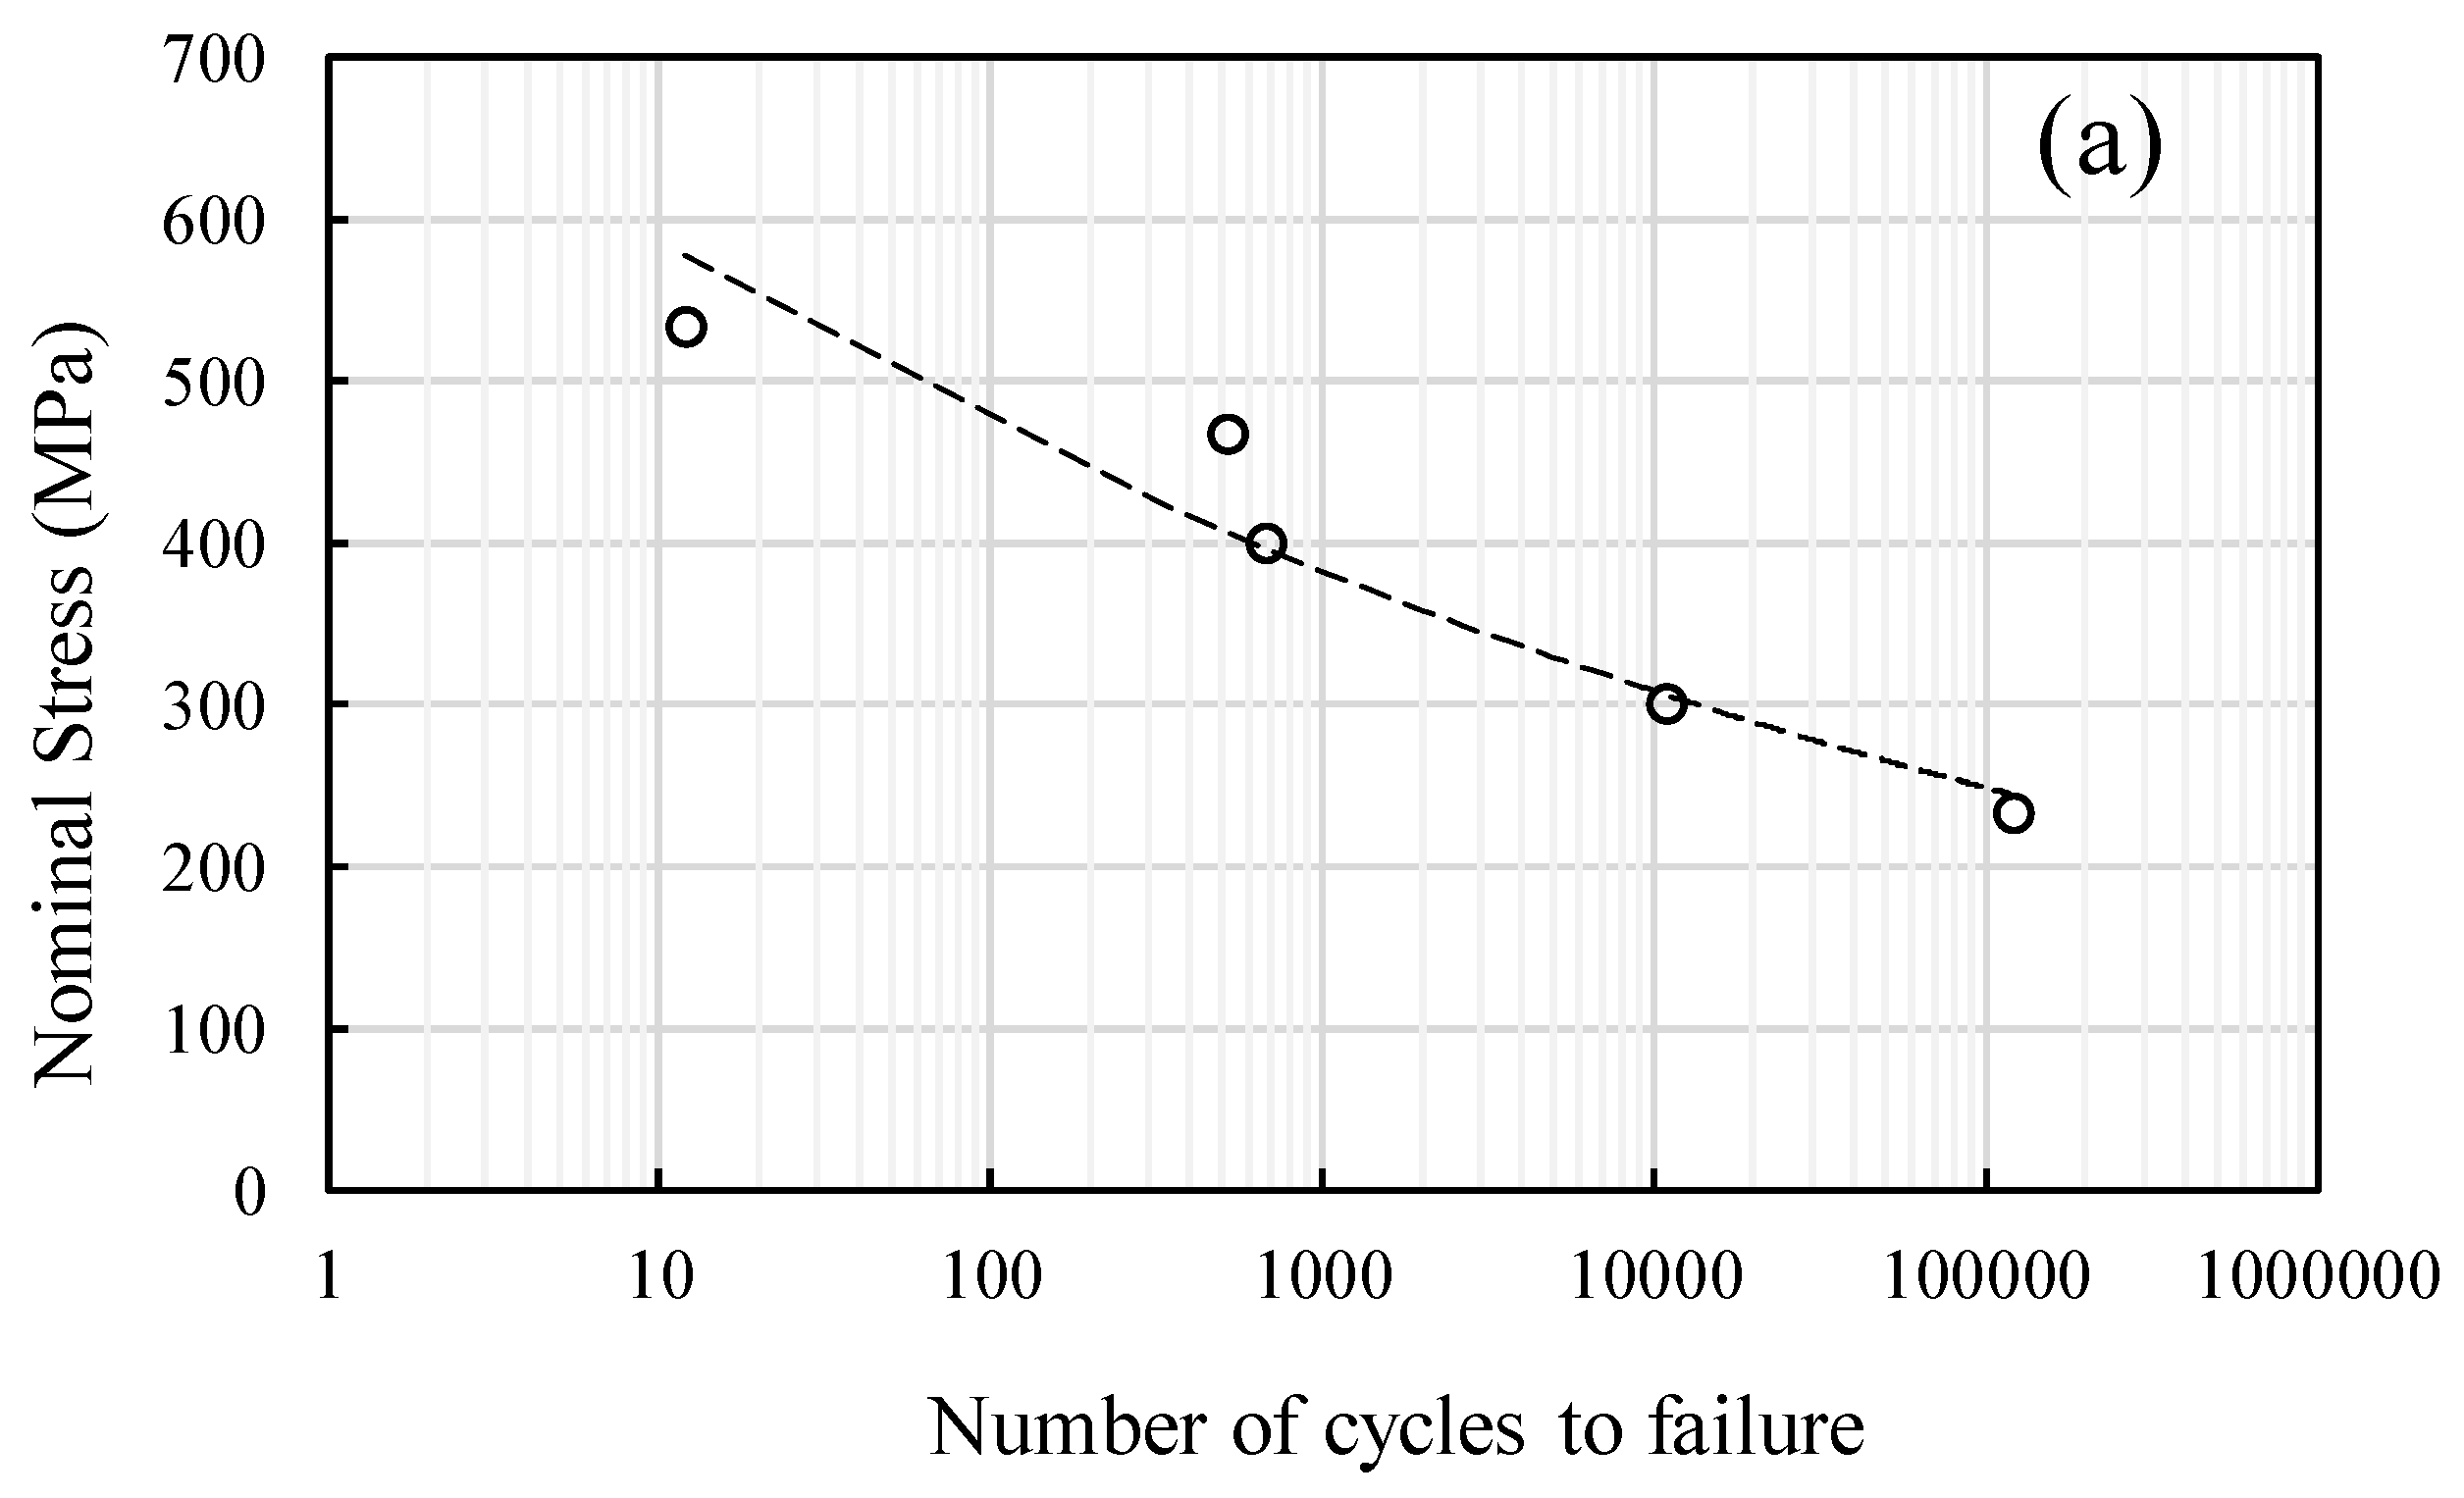
Figure 12 exhibits the comprehensive fatigue test data for the welded specimen, determining their respective fatigue responses under the applied loading conditions. All fatigue failures originated in the heat-affected zone (HAZ), as confirmed by fracture surface analysis.
Figure 13 illustrates the relationship between strain amplitude and the number of cycles to failure the specimens. To facilitate accurate fatigue life predictions, the study summarizes the essential strain-based fatigue parameters in
Table 5. These parameters are essential for assessing the materials’ fatigue performance and making reliable evaluations of their durability under cyclic loading. To obtain strain-based fatigue parameters, first, the data at the equivalent completely reversed stress condition (R = −1) were obtained using the SWT parameter as follows [
29]:
In this equation, is the equivalent completely reversed stress amplitude, is the stress amplitude at R = 0, and is the maximum stress. While the SWT model effectively predicts fatigue life under strain-controlled conditions, it neglects mean stress effects, which may influence results in real-world applications.
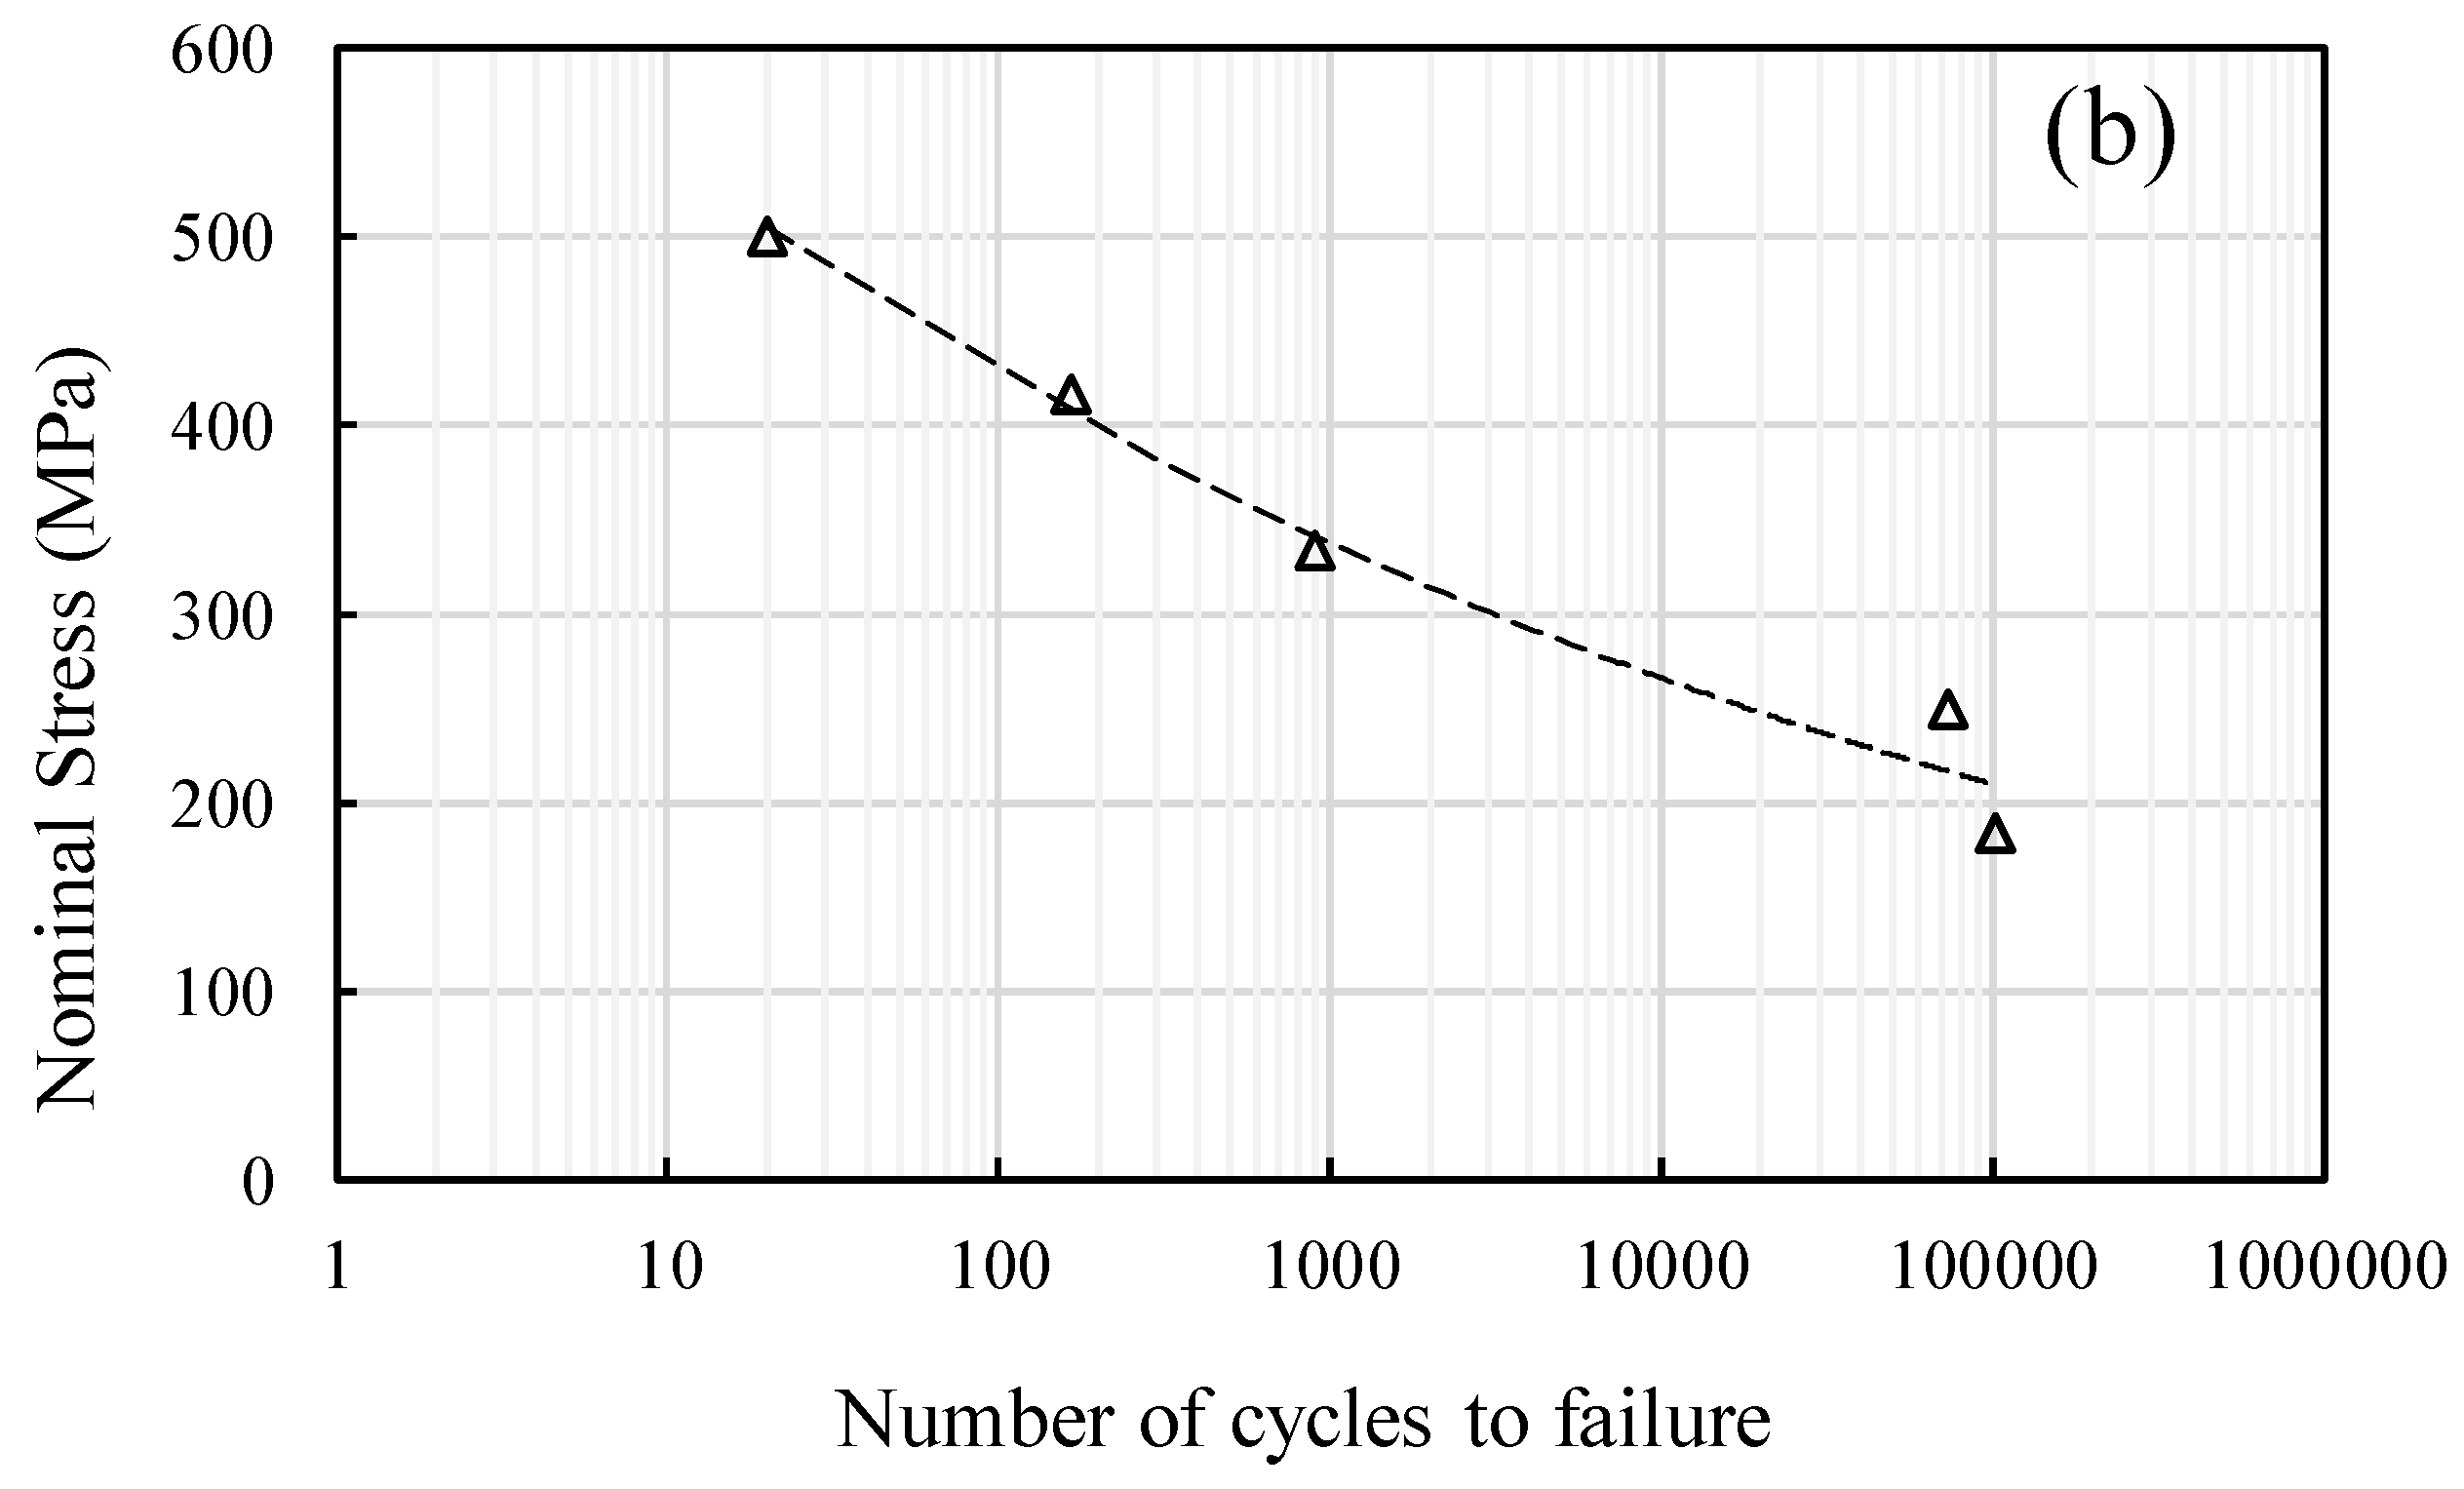
Figure 14 illustrates the S-N curves representing the fatigue behaviour of both single-edge and double-sided-edge notched welded samples. Remarkably, the single-edge notched samples exhibited higher fatigue lives compared to the double-sided-edge notched specimens, as depicted in the graph.
3.5. Creep Test Results
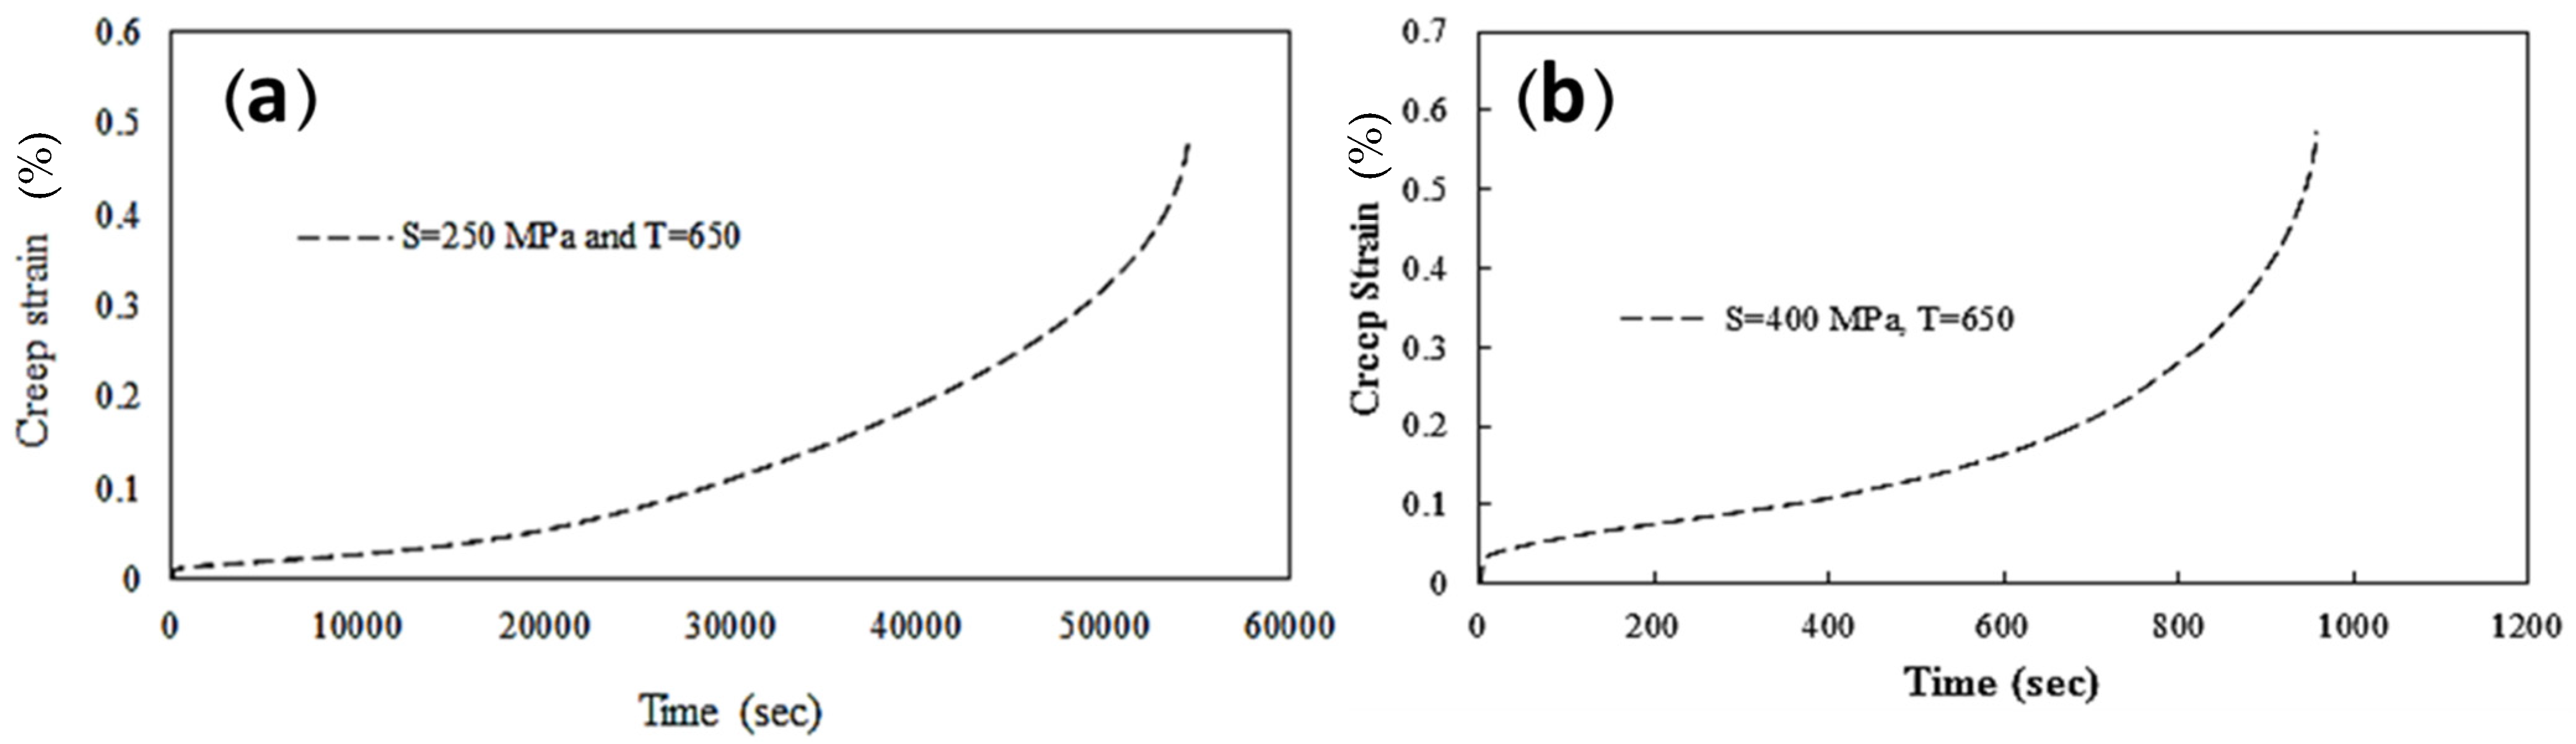
Figure 15 shows the creep strain-time response for the welded specimen subjected to a stress of 250, 400 MPa, and a temperature of 650 °C. These illustrations demonstrate the rapid failure of the welded specimens under creep environment at 650 °C, representative of the Inconel 600 alloy unsuitability for the high temperature applications. Creep failure occurred in the HAZ for both stress levels (250 MPa and 400 MPa), consistent with its lower hardness and grain coarsening. The comparison of the creep behaviour under 250 and 400 MPa in
Figure 14 indicates that the creep behaviour of the Inconel 600 alloy is better in reduced loading situations. Multiple studies have shown that Inconel 600 can withstand creep loading at lower temperatures, such as 300–400 °C. While Inconel 600 exhibits acceptable creep performance within this range [
23], our findings are consistent with Granados-Becerra et al. [
2], who observed rapid failure above 600 °C caused by grain boundary carbide dissolution. At 650 °C, the welded specimens failed after 120 h at 400 MPa and 350 h at 250 MPa, which is consistent with [
2] reports of stress-dependent creep life.
The steady-state creep rate at 650 °C was calculated as 1.2 × 10
−5 s
−1 at 250 MPa, consistent with diffusional flow mechanisms in nickel-based alloys [
23]. Tertiary creep was observed in all specimens, marked by accelerated strain accumulation due to void nucleation and grain boundary sliding in the HAZ.
The calibrated
n′ = 0.135 increased local plastic strain at notches, reducing predicted fatigue life for double-sided edge notched samples (
Figure 13). This aligns with the physical expectation that higher
n′ enhances strain hardening, accelerating crack initiation in the HAZ.
These creep curves reveal the material’s time-dependent deformation, critical for high-temperature engineering applications.
All fatigue failures originated in the HAZ, as confirmed by fracture surface analysis (
Figure 15). Due to limited sample availability, only averaged results from two replicates are presented in
Figure 12 and
Figure 14. Future studies should expand sample size to quantify fatigue life variability rigorously.


