Abstract
This study investigates the combined effects of oxygen content in the purging gas and pre-weld surface finish on the discoloration and corrosion resistance of AISI 316L pipe joints, with relevance to pipe welding where internal cleaning is constrained. The hybrid GTAW–FCAW process was used. Welds were produced at two oxygen levels (500 and 5000 ppm) and two finishes (40- vs. 60-grit). Discoloration and oxide morphology were examined by SEM/EDS, and corrosion behavior was evaluated without oxide removal using cyclic polarization and electrochemical impedance spectroscopy. The results reveal that higher oxygen levels in the purging gas produced more porous, less protective oxide layers, along with intensified oxidation around surface defects such as micro-holes. Surface roughness was also found to influence corrosion behavior: rougher surfaces exhibited higher resistance to pit initiation, whereas smoother surfaces were more susceptible to initiation but offered greater resistance to pit propagation. The corresponding governing mechanisms were identified and discussed in terms of how surface preparation affects crystallographic texture, heterogeneities and recrystallization. Taken together, the results link oxide morphology and near-surface microstructure to electrochemical response and offer practical guidance for pipe welding when internal cleaning is constrained, balancing purging control with surface preparation to preserve corrosion performance. The findings further highlight the critical roles of both purging-gas composition and surface preparation in the corrosion performance of stainless steel welded pipes.
1. Introduction
The durability and performance of stainless steels are crucial in industrial environments where resistance to pitting corrosion determines the longevity and reliability of components. Among them, austenitic stainless steel AISI 316L is widely used for pipelines and structural parts exposed to corrosive media because of its excellent corrosion resistance and mechanical strength [,,]. During welding, surface discoloration inevitably occurs and can degrade the material’s behavior in aggressive conditions [,,]. The oxide film that develops on the weld surface may strongly influence the alloy’s resistance to localized corrosion, particularly pitting, a common failure mode in chloride-containing environments []. Several welding parameters affect the corrosion resistance of AISI 316L [,,,]; among these, the oxygen content of the purging gas and the surface roughness of the weld are especially significant [].
The oxygen concentration in the backing gas has a direct impact on the oxide formation at the weld root surface, leading to discoloration and altering the chemical composition of the oxide layer []. This discoloration, caused by oxygen impurities during purging, is especially critical in industries such as oil and gas, where pitting corrosion resistance is vital []. Several studies have examined the influence of oxygen content in purging gases on both discoloration and corrosion behavior of stainless steels [,]. To ensure optimal corrosion performance, the atmospheric air must be effectively displaced from the fusion zone during welding—particularly for the root pass—by supplying an inert purging gas on the backside of the weld. Bergquist et al. [] reported that atmospheric oxygen levels of about 210,000 ppm can produce a thick oxide film on the weld root surface. Picha et al. [] observed that adding nitrogen (N2) to argon as a purging gas enhanced the pitting corrosion resistance of 304 stainless steel welds made by Gas Tungsten Arc Welding (GTAW). Similarly, Trigwell et al. [] attributed oxidation-induced discoloration in the heat-affected zone of electropolished stainless steel to oxygen contamination in the argon backing gas, noting that the discoloration intensity increases with oxygen content due to the formation of an iron-rich oxide layer. Studies have shown that excessive oxygen content can lead to the formation of porous oxide layers and chromium-depleted zones, which compromise the material’s ability to resist pitting corrosion [].
Thermal heterogeneity across the heat-affected zone (HAZ) plays a crucial role in determining oxide formation, thickness, and corrosion resistance. Our recent thermodynamic analysis using FactSage [] revealed that around 800 °C, stable phases such as corundum and spinel are favored, while at higher temperatures approaching 1300 °C, δ-ferrite and liquid oxide phases begin to appear; partial melting occurs beyond 1445 °C. These variations in phase stability explain why low-temperature regions typically form thin, chromium-rich protective oxides, whereas high-temperature areas develop thicker, iron-rich and liquid-like oxides that are porous and less protective []. The resulting oxide thickness directly influences the interference colors visible on the weld surface. According to optical principles, these colors arise from the path difference of light reflected at the air/oxide and oxide/metal interfaces. Consequently, the straw-yellow, blue, purple, and black discolorations are not merely aesthetic effects but correspond to specific oxide thickness ranges associated with the thermal cycles during welding [,,].
The American Welding Society (AWS) standards, including AWS D18.1 and AWS D18.2, establish strict limits for discoloration in stainless steels used in sanitary and food-processing applications, where only light blue or lighter shades are considered acceptable []. However, these specifications do not extend to the oil and gas sector, leaving a knowledge gap for this field. Previous studies have shown that using a purging gas with an oxygen concentration of about 500 ppm during GTAW produces optimal results in multi-pass welds by improving pitting corrosion resistance, whereas increasing the oxygen level to 5000 ppm significantly reduces it []. Despite these findings, the combined effect of oxygen content and surface roughness on pitting corrosion resistance during hybrid GTAW/Flux-Cored Arc Welding (FCAW), a process widely employed in industrial pipe fabrication, has not yet been investigated.
Surface roughness is another key factor that strongly affects the corrosion behavior of stainless steel. In general, smoother surfaces enhance corrosion resistance by promoting the formation of a uniform and stable passive oxide film [,]. Nowak [] reported that increasing the surface roughness of AISI 316Ti improved oxidation resistance by facilitating the development of a stable Cr–Mn mixed oxide layer. Wang et al. [] found that increasing surface roughness intensified pit depth growth in HP-13Cr Stainless Steel. They explained their findings in terms of the influence of surface roughness in reducing the stagnant layer thickness and accelerating cation diffusion while forming multistage vortices in surface troughs, which inhibited Fe2+ diffusion, promoting local acidification and therefore accelerating pitting corrosion. Jaffré et al. [] found that mechanical surface treatments, particularly dry grinding, significantly impair the passive film stability and corrosion resistance of 304L stainless steel in chloride environments, mainly due to increased roughness and residual stresses. Similarly, Zhang et al. [] demonstrated that electropolishing improves the corrosion resistance of 304L stainless steel by removing surface deformation, whereas sandpaper grinding introduces residual stress that reduces passive film stability. Guo et al. [] further showed that in ENiCrFe-7 welds tested without oxide removal, decreasing surface roughness led to lower passive current density and higher corrosion potential—confirming that smoother surfaces provide superior corrosion protection.
Although it is well established that reducing surface roughness generally improves resistance to pitting corrosion, most of these findings are based on experiments where the oxide layers were removed before testing [,,,,,]. In real industrial environments, however, the oxide layer on the inner surface of welded pipes is often retained, and its influence on corrosion performance has been rarely examined. In this study, the oxide layer formed during high-temperature exposure was deliberately preserved to reflect realistic service conditions. As reported by several researchers [,,,,,], rougher surfaces tend to develop thicker oxide layers, whereas smoother surfaces produce thinner and less porous oxides. These contrasting morphologies are expected to affect the corrosion behavior of welded joints in service. Accordingly, this work offers new insights into the combined influence of surface roughness and intact oxide layers on the corrosion resistance of 316L stainless steel pipe welds used in the oil and gas industry.
Although numerous studies have examined the influence of oxygen content in the purging gas on surface discoloration and corrosion resistance of stainless steels, the combined effects of oxygen concentration and surface roughness remain insufficiently understood—particularly under industrial conditions where the discolored oxide layer is left intact. Moreover, the specific role of surface roughness in governing corrosion resistance in discolored welds has not been systematically investigated. This study addresses these knowledge gaps by evaluating whether an oxygen concentration of 500 ppm remains optimal for hybrid GTAW/FCAW and by assessing how surface roughness affects the corrosion resistance of AISI 316L stainless steel welds. The results aim to provide practical guidance for optimizing welding parameters in the oil and gas industry, balancing performance and cost efficiency without the need for post-weld surface treatments.
To achieve these objectives, the effects of two oxygen contents in the purging gas (500 ppm and 5000 ppm) and two surface roughness levels (buffed with 40- and 60-grit abrasives) on discoloration and corrosion resistance of AISI 316L stainless steel were investigated. The discoloration level was characterized by microscopic and chemical analyses, while electrochemical testing was conducted to evaluate the welded joints’ resistance to localized corrosion. The composition and morphology of the oxide layers were also examined to elucidate the underlying mechanisms. Finally, the results were integrated to propose practical recommendations for optimizing welding parameters and ensuring reliable performance in industrial applications.
This study addresses key gaps in current knowledge by examining how oxygen contents in the backing gas and surface finish influence pitting corrosion resistance in GTAW/FCAW-welded AISI 316L joints. The novelty lies in assessing the effect of surface roughness on corrosion behavior within the discoloration zone, while preserving the internal oxide layer to realistically represent pipe interiors where post-weld cleaning is impractical. This zone, exposed to distinct thermal conditions during welding, plays a critical role in corrosion performance yet remains insufficiently investigated, particularly for hybrid GTAW/FCAW processes applied to 316L stainless steel pipelines. Electrochemical Impedance Spectroscopy (EIS) and cyclic polarization tests were employed to clarify how surface roughness influences the underlying corrosion mechanisms.
2. Methodology
2.1. Materials and Sample Preparation
The AISI 316L stainless steel samples used in this study were supplied by PCL (Edmonton, Alberta, Canada). The alloy’s chemical composition was determined using a SPECTROMAXx LMF08 optical emission spectrometer (Ametek, Kleve, Germany). To ensure measurement of accuracy and reproducibility, five independent readings were performed, and their average values were used for analysis (Table 1). The pipe employed in this study had an external diameter of 154.4 mm and a wall thickness of 7.11 mm for the base metal section.
Table 1.
The elemental composition of the 316L stainless steel used in this study.
2.2. Surface Preparation and Roughness
To evaluate the effect of surface roughness on pitting corrosion resistance, the samples were mechanically polished using 40- and 60-grit abrasive papers to produce two distinct surface finishes. These surface conditions replicate the industrial partner’s standard pre-weld preparation for curved pipe sections. Surface roughness was measured using a Keyence VR-2500 3D surface profiler (Keyence Canada Inc., Mississauga, ON, Canada). For each grit size, 120 individual measurements were taken to ensure statistical reliability, and the average roughness (Ra) values were calculated accordingly. The measured Ra for the 60-grit samples (B2) was 2.29 ± 0.14 µm, while for the 40-grit samples (B1), it was 2.80 ± 0.32 µm. The base metal outside the weld zone exhibited a higher roughness of 6.64 ± 0.89 µm. Representative 3D and line-profile images of the 60-grit surface topography are presented in Figure 1.
Figure 1.
(a) Multi-line roughness profile (60-grit); (b) 3D surface map showing anisotropic grooves.
2.3. Welding Procedures
The 316L stainless steel specimens were welded using a hybrid process combining GTAW and FCAW. Argon gas containing controlled oxygen contents (500 or 5000 ppm) was employed to purge the interior of each pipe. The root pass was deposited by GTAW, followed by two FCAW passes for filling, resulting in a total of three welding passes per specimen. The geometry of the welded joint is illustrated in Figure 2.
Figure 2.
Weld zone geometry (dimensions in mm).
The detailed welding parameters for each pass are summarized in Table 2, while the purging gas compositions are listed in Table 3. Before welding, argon gas with precisely adjusted oxygen contents (500 and 5000 ppm) was introduced to purge the inner surface of the pipe. Commercial-grade oxygen was mixed with argon of different purity levels to obtain the desired concentrations. All tests were conducted in the as-welded condition to replicate actual pipeline interiors, where post-weld cleaning is generally not feasible. The oxygen levels of 500 ppm and 5000 ppm were selected based on prior GTAW work [], which identified distinct discoloration characteristics, particularly a marked transition to opaque black and porous oxide formation at 5000 ppm.
Table 2.
Welding parameters used for the 316L stainless steel pipelines.
Table 3.
Purging gas concentrations.
To ensure precise control of oxygen concentration during welding, the oxygen level was continuously monitored using a PurgEye 300 instrument (Huntingdon Fusion Techniques, Burry Port, Wales). The purging process was carefully initiated and maintained until the target oxygen content was reached. Both pipe ends were sealed to ensure a controlled atmosphere, with inert gas introduced from one side and oxygen content continuously measured at the opposite end to maintain the specified environment.
2.4. Oxide Layer Analysis
The surface discoloration and oxide layer morphology were initially examined using a Keyence VR-2500 3D optical profilometer (Keyence Canada, Mississauga, ON, Canada). Detailed characterization of the oxide layers was then carried out by scanning electron microscopy (SEM) with two high-resolution instruments: Hitachi TM3000 (Hitachi High-Tech, Tokyo, Japan) and SU8230 FE-SEM (Hitachi High-Tech, Tokyo, Japan).
A specialized sample preparation technique—previously described in detail by the authors []—was employed to preserve the oxide layers during examination. This method combines hot mounting with advanced ion milling to maintain the structural integrity of the oxide in both cross-sectional and surface observations. For cross-sectional analysis, ion milling was performed in two stages: the first at 6 kV for 2 h with a reciprocation speed of 60 strokes/min and a ±15° swing angle, followed by a second stage at 5 kV for 1 h with 30 strokes/min and a ±30° swing angle. For surface preparation, ion milling was conducted at 5 kV for 3 min, using a reciprocation speed of 15 strokes/min and a ±60° swing angle. The IM4000 Plus ion mill (Hitachi) was used for all operations, ensuring precise surface conditioning suitable for high-resolution SEM imaging.
In addition to SEM, Electron Backscatter Diffraction (EBSD) was performed to analyze the grain structure of samples after buffing and welding. The chemical composition of the discoloration zone was determined using X-ray diffraction (XRD) analysis with a PANalytical X’Pert Pro diffractometer (Malvern Panalytical, Malvern, Worcestershire, United Kingdom) operating with Co Kα radiation (λ = 1.78896 Å) at 40 mA and 45 kV. Diffraction patterns were collected over a 2θ range of 20–80°, with a step size of 0.016° and a total scan duration of 1 h and 37 min, yielding high-resolution data.
Following the detailed morphological and compositional analysis of the oxide layer, electrochemical tests were conducted to evaluate the pitting corrosion behavior within HAZ.
2.5. Corrosion Testing
The pitting corrosion behavior within the HAZ was evaluated through cyclic polarization and EIS, following the ASTM G5-13 [] standard. Test specimens were prepared with dimensions of 15 × 15 mm, providing an exposed surface area of 1 cm2 in contact with the electrolyte solution (Figure 3). The test electrolyte consisted of an aqueous mixture containing 0.5 M sodium chloride (NaCl) and 0.5 M sulfuric acid (H2SO4) to simulate a highly corrosive environment. All experiments were carried out at a controlled temperature of 23 ± 2 °C, in compliance with ASTM guidelines, and each test was repeated three times to ensure reproducibility.
Figure 3.
(a) Schematic representation of the location of the corrosion test sample, (b) Sample after corrosion test.
The open-circuit potential (OCP), or corrosion potential, was recorded for 300 s to allow stabilization before polarization. Cyclic polarization scans began 50 mV below the OCP and extended up to 2000 mV (vs. Ag/AgCl), with a scan rate of 0.0016 V/s, as suggested by previous studies [,,]. IEIS measurements were performed over a frequency range of 0.1 Hz to 100 kHz, using a 10 mV AC perturbation at the OCP. The electrochemical setup comprised the 316L stainless steel specimen as the working electrode (WE), a platinum counter electrode (CE), and a saturated Ag/AgCl reference electrode (RE). All measurements were carried out using an Autolab PGSTAT302N potentiostat/galvanostat (Metrohm, Riverview, FL, USA) operated with NOVA 2.1.6 software (Metrohm, Riverview, FL, USA). The specimen holder was supplied by Redox Company (Redox, Norrköping, Sweden), and the electrochemical accessories—including the reference and counter electrodes—were obtained from Pine Research Inc. In this study, corrosion testing was conducted without removing the oxide layer, as the focus was on evaluating the pitting corrosion behavior under conditions simulating actual industrial operating conditions. However, this approach made it difficult to observe individual pit propagation and distinguish corrosion features from surface imperfections and therefore, this aspect could not be investigated in the present work. Consequently, direct imaging of pit propagation under the intact oxide was not undertaken; propagation was assessed indirectly via cyclic polarization curve.
The electrochemical data was processed and visualized using MATLAB R2022a (MathWorks, Natick, MA, USA). Parameters such as pitting potential (Epit), repassivation potential, and passive current density were determined via the inflection point method [], which identifies slope changes along the polarization curve corresponding to transitions between active, passive, and pitting regimes [].
3. Results and Discussion
3.1. Oxide Layer Discoloration Analysis
Figure 4 presents the discoloration patterns observed on the inner welded surfaces (the red lines indicate the fusion line) under the different oxygen and surface roughness conditions. Since this study focuses on the pipe-relevant as-welded (heat-tinted) condition, no oxide-free control samples were included. The selected factor levels—oxygen content (500 vs. 5000 ppm) and surface roughness (40- vs. 60-grit)—represent the industrial extremes defined by the partner, allowing evaluation of both main effects and their interaction.
Figure 4.
Discoloration of oxide layers (the red lines indicate the fusion line): (a) 500 ppm, B1; (b) 500 ppm, B2; (c) 5000 ppm, B1; (d) 5000 ppm, B2.
Samples welded under 500 ppm oxygen exhibited a uniform discoloration gradient, transitioning gradually from lighter to darker shades for both roughness levels. At 5000 ppm, however, a distinct blackened region appeared near the weld interface for both surface finishes (Figure 4c,d). This dark zone, consistent across all roughness types, indicates excessive oxidation []. This phenomenon will be further explained in subsequent sections, where the microstructural and corrosion properties of these zones are analyzed.
In AISI 316L stainless steel, the weld pool solidifies in the ferrite–austenite mode, producing a predominantly austenitic weld metal. As shown in Figure 5d, the fusion zone exhibits dendritic austenite, while Figure 5b provides a closer view of the weld line and fusion boundary (highlighted by the blue box in panel a). Figure 5c (red box in b) depicts the adjacent heat-affected zone (HAZ) and base metal region, where thermal exposure caused recrystallization and grain coarsening without melting or dendrite formation [,]. Our work evaluates only the inner surface of the HAZ (discoloration layer); the fusion-zone image is included solely to orient the reader and mark boundaries, and subsurface features inside the material do not affect our results and are not investigated in this paper.
Figure 5.
Weld microstructure: (a) cross-section; (b) weld line (blue box in (a)); (c) adjacent HAZ/base metal (red box in (b)); (d) weld-metal (green box in (b)).
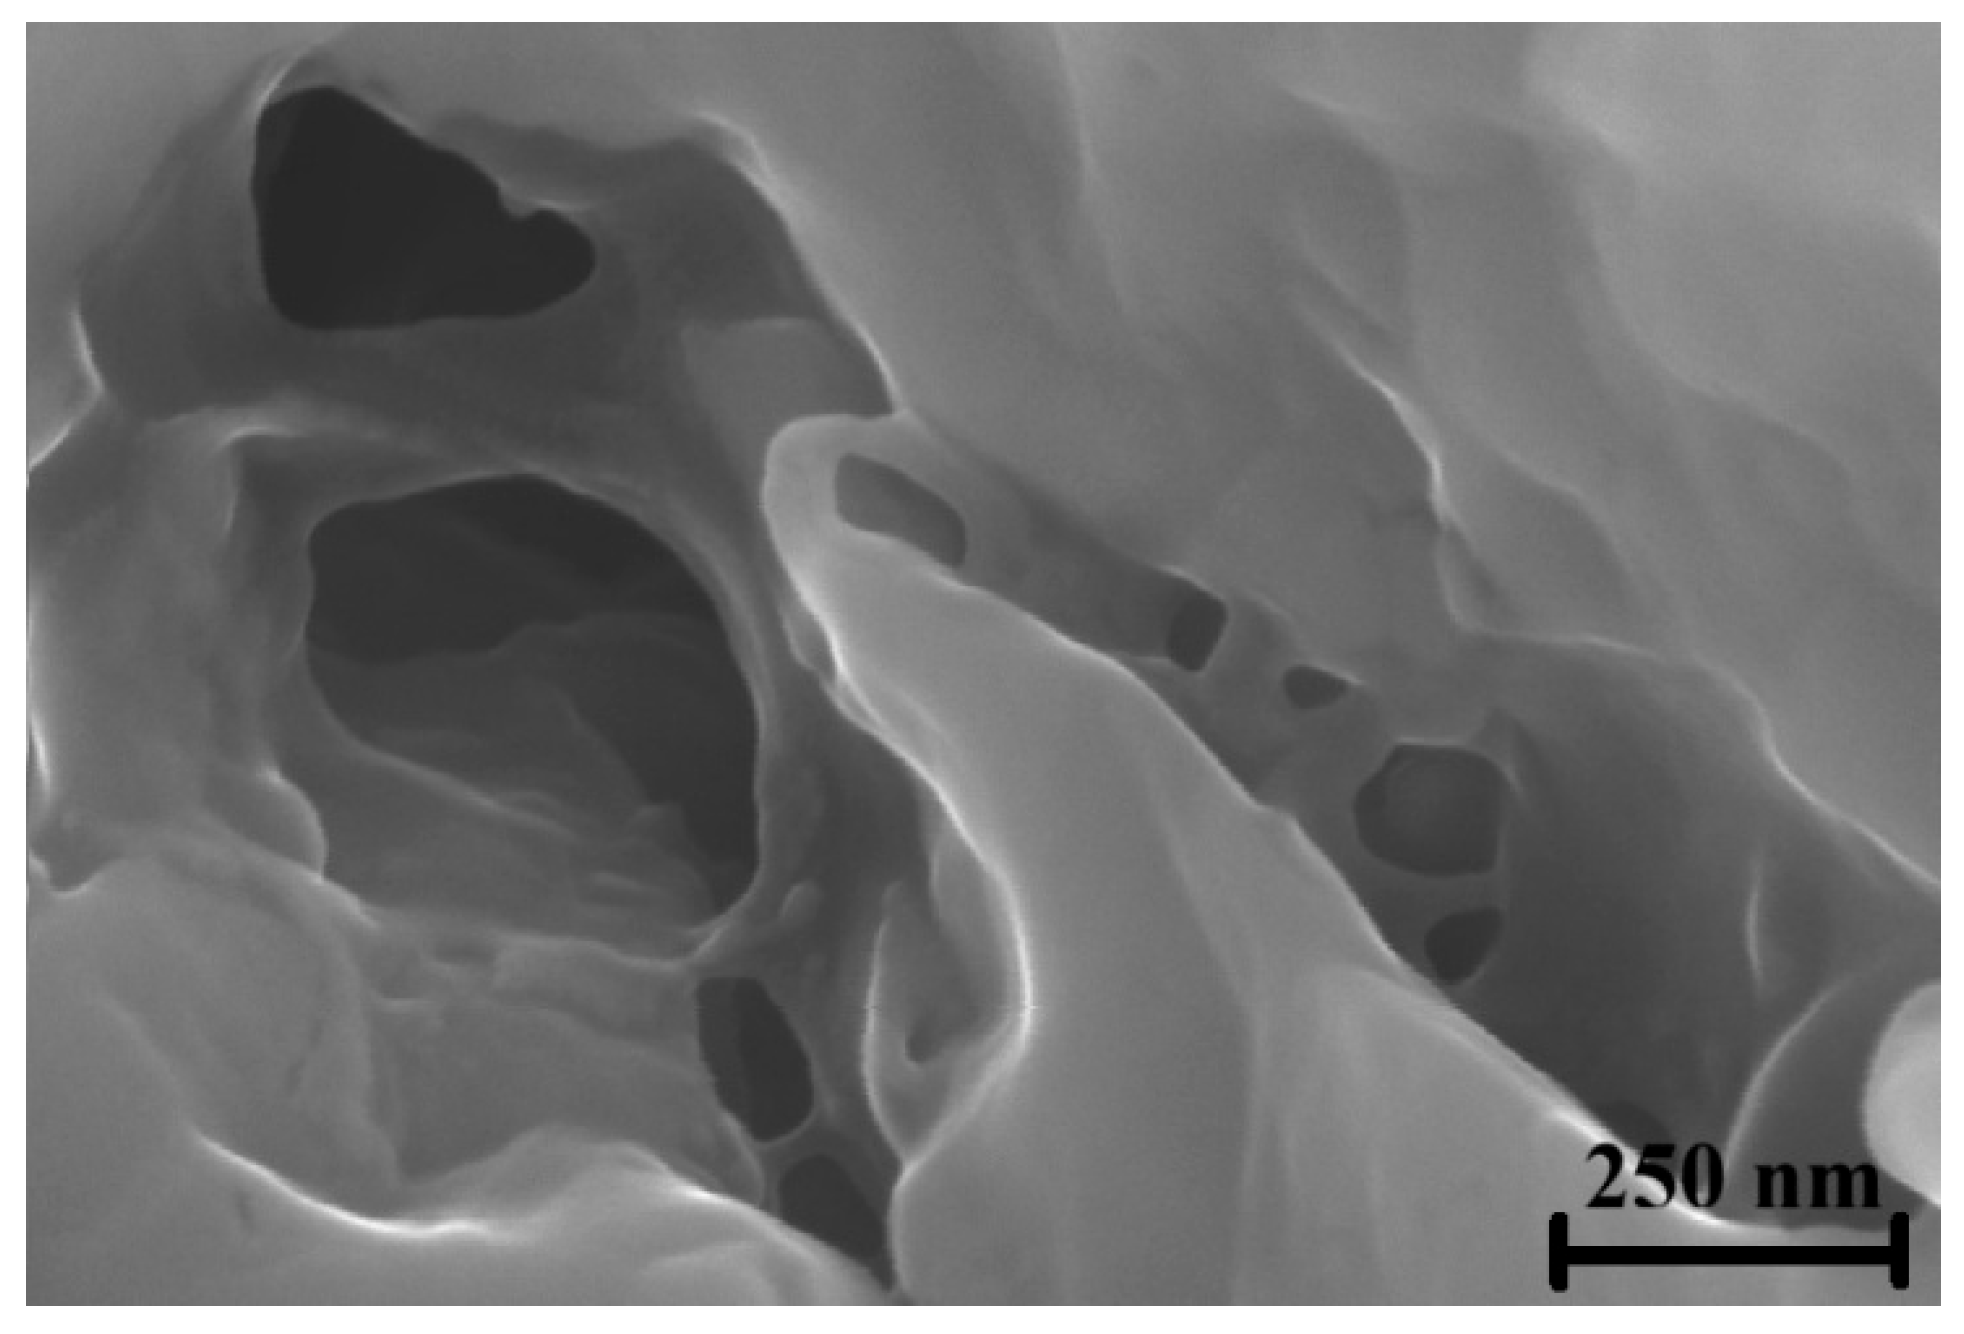
Figure 6 shows a cross-sectional SEM image and corresponding elemental maps (Fe, Cr, Mn) taken 1.5 mm from the fusion boundary of a weld produced under 5000 ppm oxygen with the rougher surface (B2). The inner oxide layer consists mainly of Fe, Cr, and Mn, consistent with the formation of spinel and corundum phases, in agreement with previous studies [,]. The outermost oxide is dominated by iron oxides, featuring spinel-type structures enriched in Fe and an overlying corundum layer. A porous morphology, characteristic of excessive oxidation, was observed near the fusion line only under the 5000 ppm oxygen condition (Figure 7).
Figure 6.
(a) Oxide cross-section 1.5 mm from fusion line (5000 ppm Oxygen, B2); elemental maps: (b) O, (c) Cr, (d) Fe, (e) Mn.
Figure 7.
High-magnification SEM image of the porous oxide layer near the fusion line.
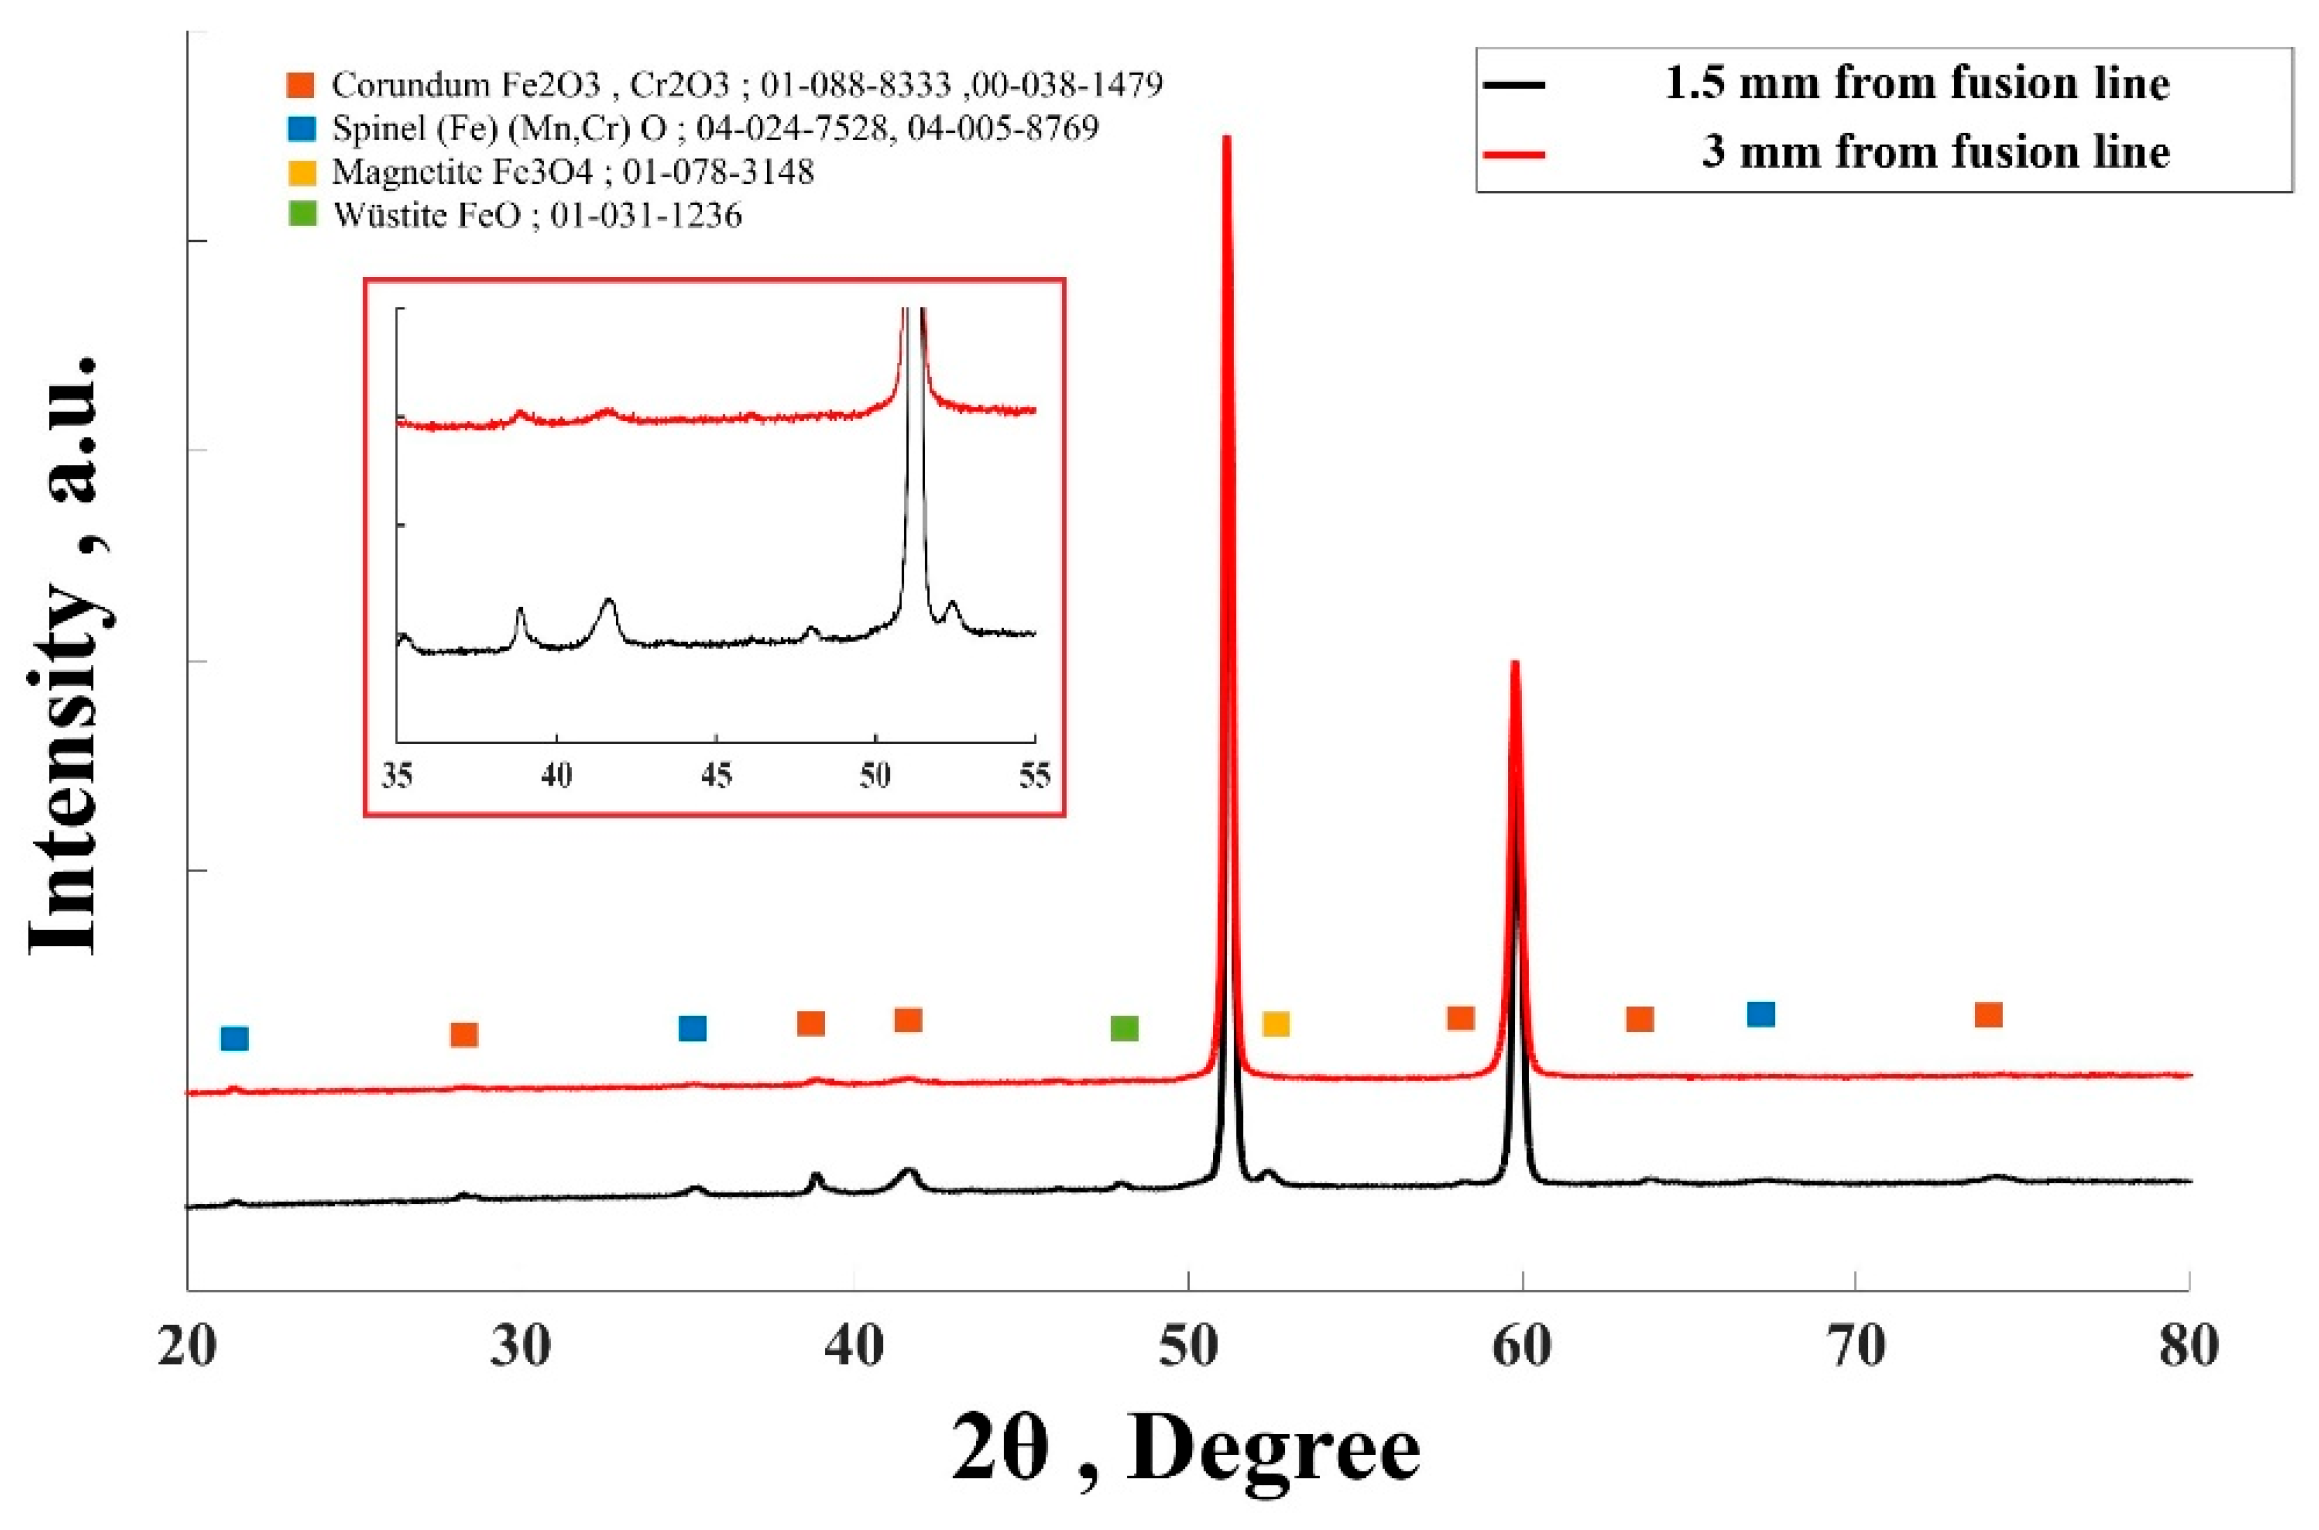
The XRD pattern of the sample taken 1.5 mm from the fusion line under 5000 ppm oxygen shows peaks corresponding to spinel (Fe(Mn, Cr)2O4), corundum (hematite, Fe2O3), magnetite (Fe3O4), and wüstite (FeO) (Figure 8), confirming that the oxide layer is multi-phase. The presence of spinel indicates a mixed Fe–Cr–Mn oxide, while the corundum peaks reflect enrichment in Fe and Cr. The detection of wüstite, recognized by its distinct peak, suggests formation in the outermost oxide or within porous regions []. A magnetite peak at 53° and a strong wüstite peak in the FeO spectrum further support this interpretation.
Figure 8.
XRD pattern under 5000 ppm oxygen condition.
At room temperature, wüstite is thermodynamically unstable and tends to transform into magnetite via oxidation, as expressed by:
When wüstite is porous, however, oxygen diffusion is restricted, preventing complete conversion to magnetite or hematite. A thin magnetite layer then forms on the surface, while wüstite persists beneath it—a phenomenon previously observed on corroded steel surfaces []. The limited oxygen transport through porous wüstite thus slows oxidation and leaves residual FeO even at ambient conditions. Notably, FeO and Fe2O3 peaks are visible at 1.5 mm from the fusion line, with FeO identified near 48°, but these peaks disappear at 3 mm, as shown in Figure 8.
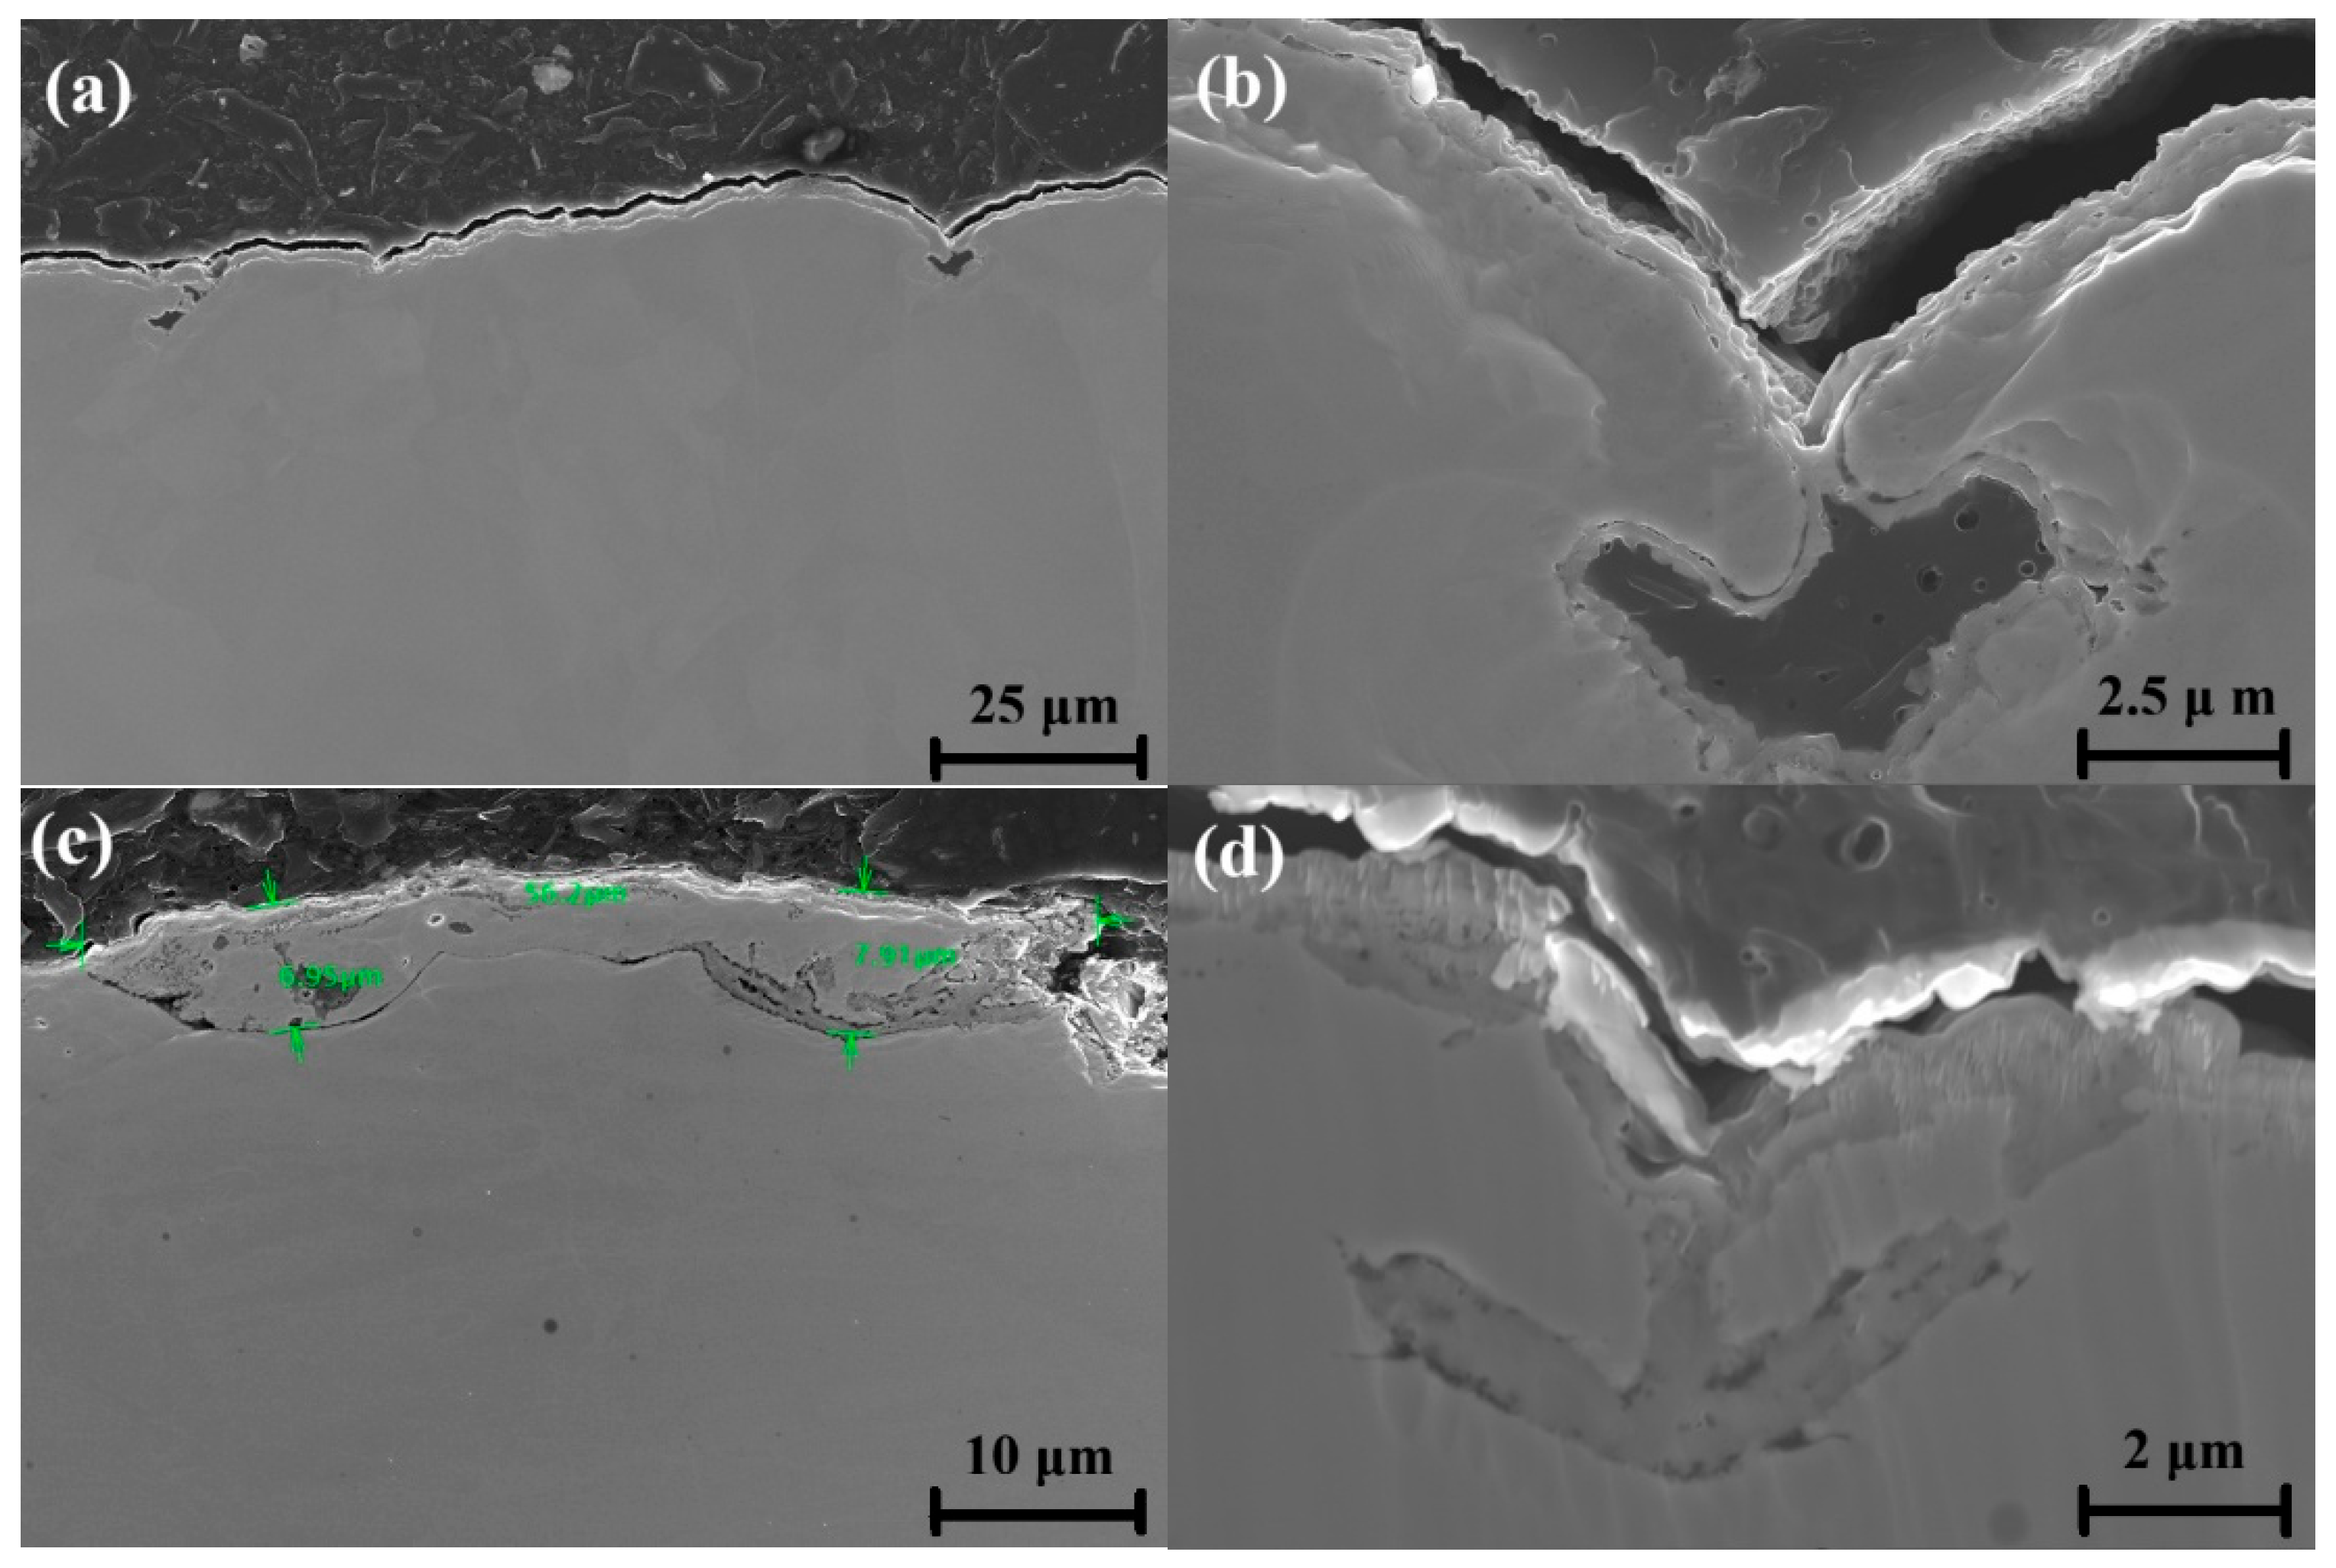
Figure 9 illustrates surface oxidation features likely associated with pre-existing surface imperfections from machining or forming. These features acted as preferential oxidation sites during welding, and their evolution differed significantly between the 500 ppm and 5000 ppm conditions. At the lower oxygen level, oxidation remained localized within surface cavities, producing a thin oxide with limited lateral growth (Figure 9a,b). At 5000 ppm oxygen content, oxidation is significantly more pronounced, with greater propagation beyond the original surface features. This is evident from the thicker oxide layers and more extensive coverage of the material surface. As shown in Figure 9c, oxidation within surface features propagates to a depth of approximately 7 micrometers. This oxidation leads to detachment or delamination of the oxide layer from the underlying metal.
Figure 9.
SEM of surface oxidation: (a,b) 500 ppm Oxygen, 3 mm from fusion line; (c,d) 5000 ppm Oxygen, 3 mm from fusion line.
3.2. Surface Grain Size Before and After Welding
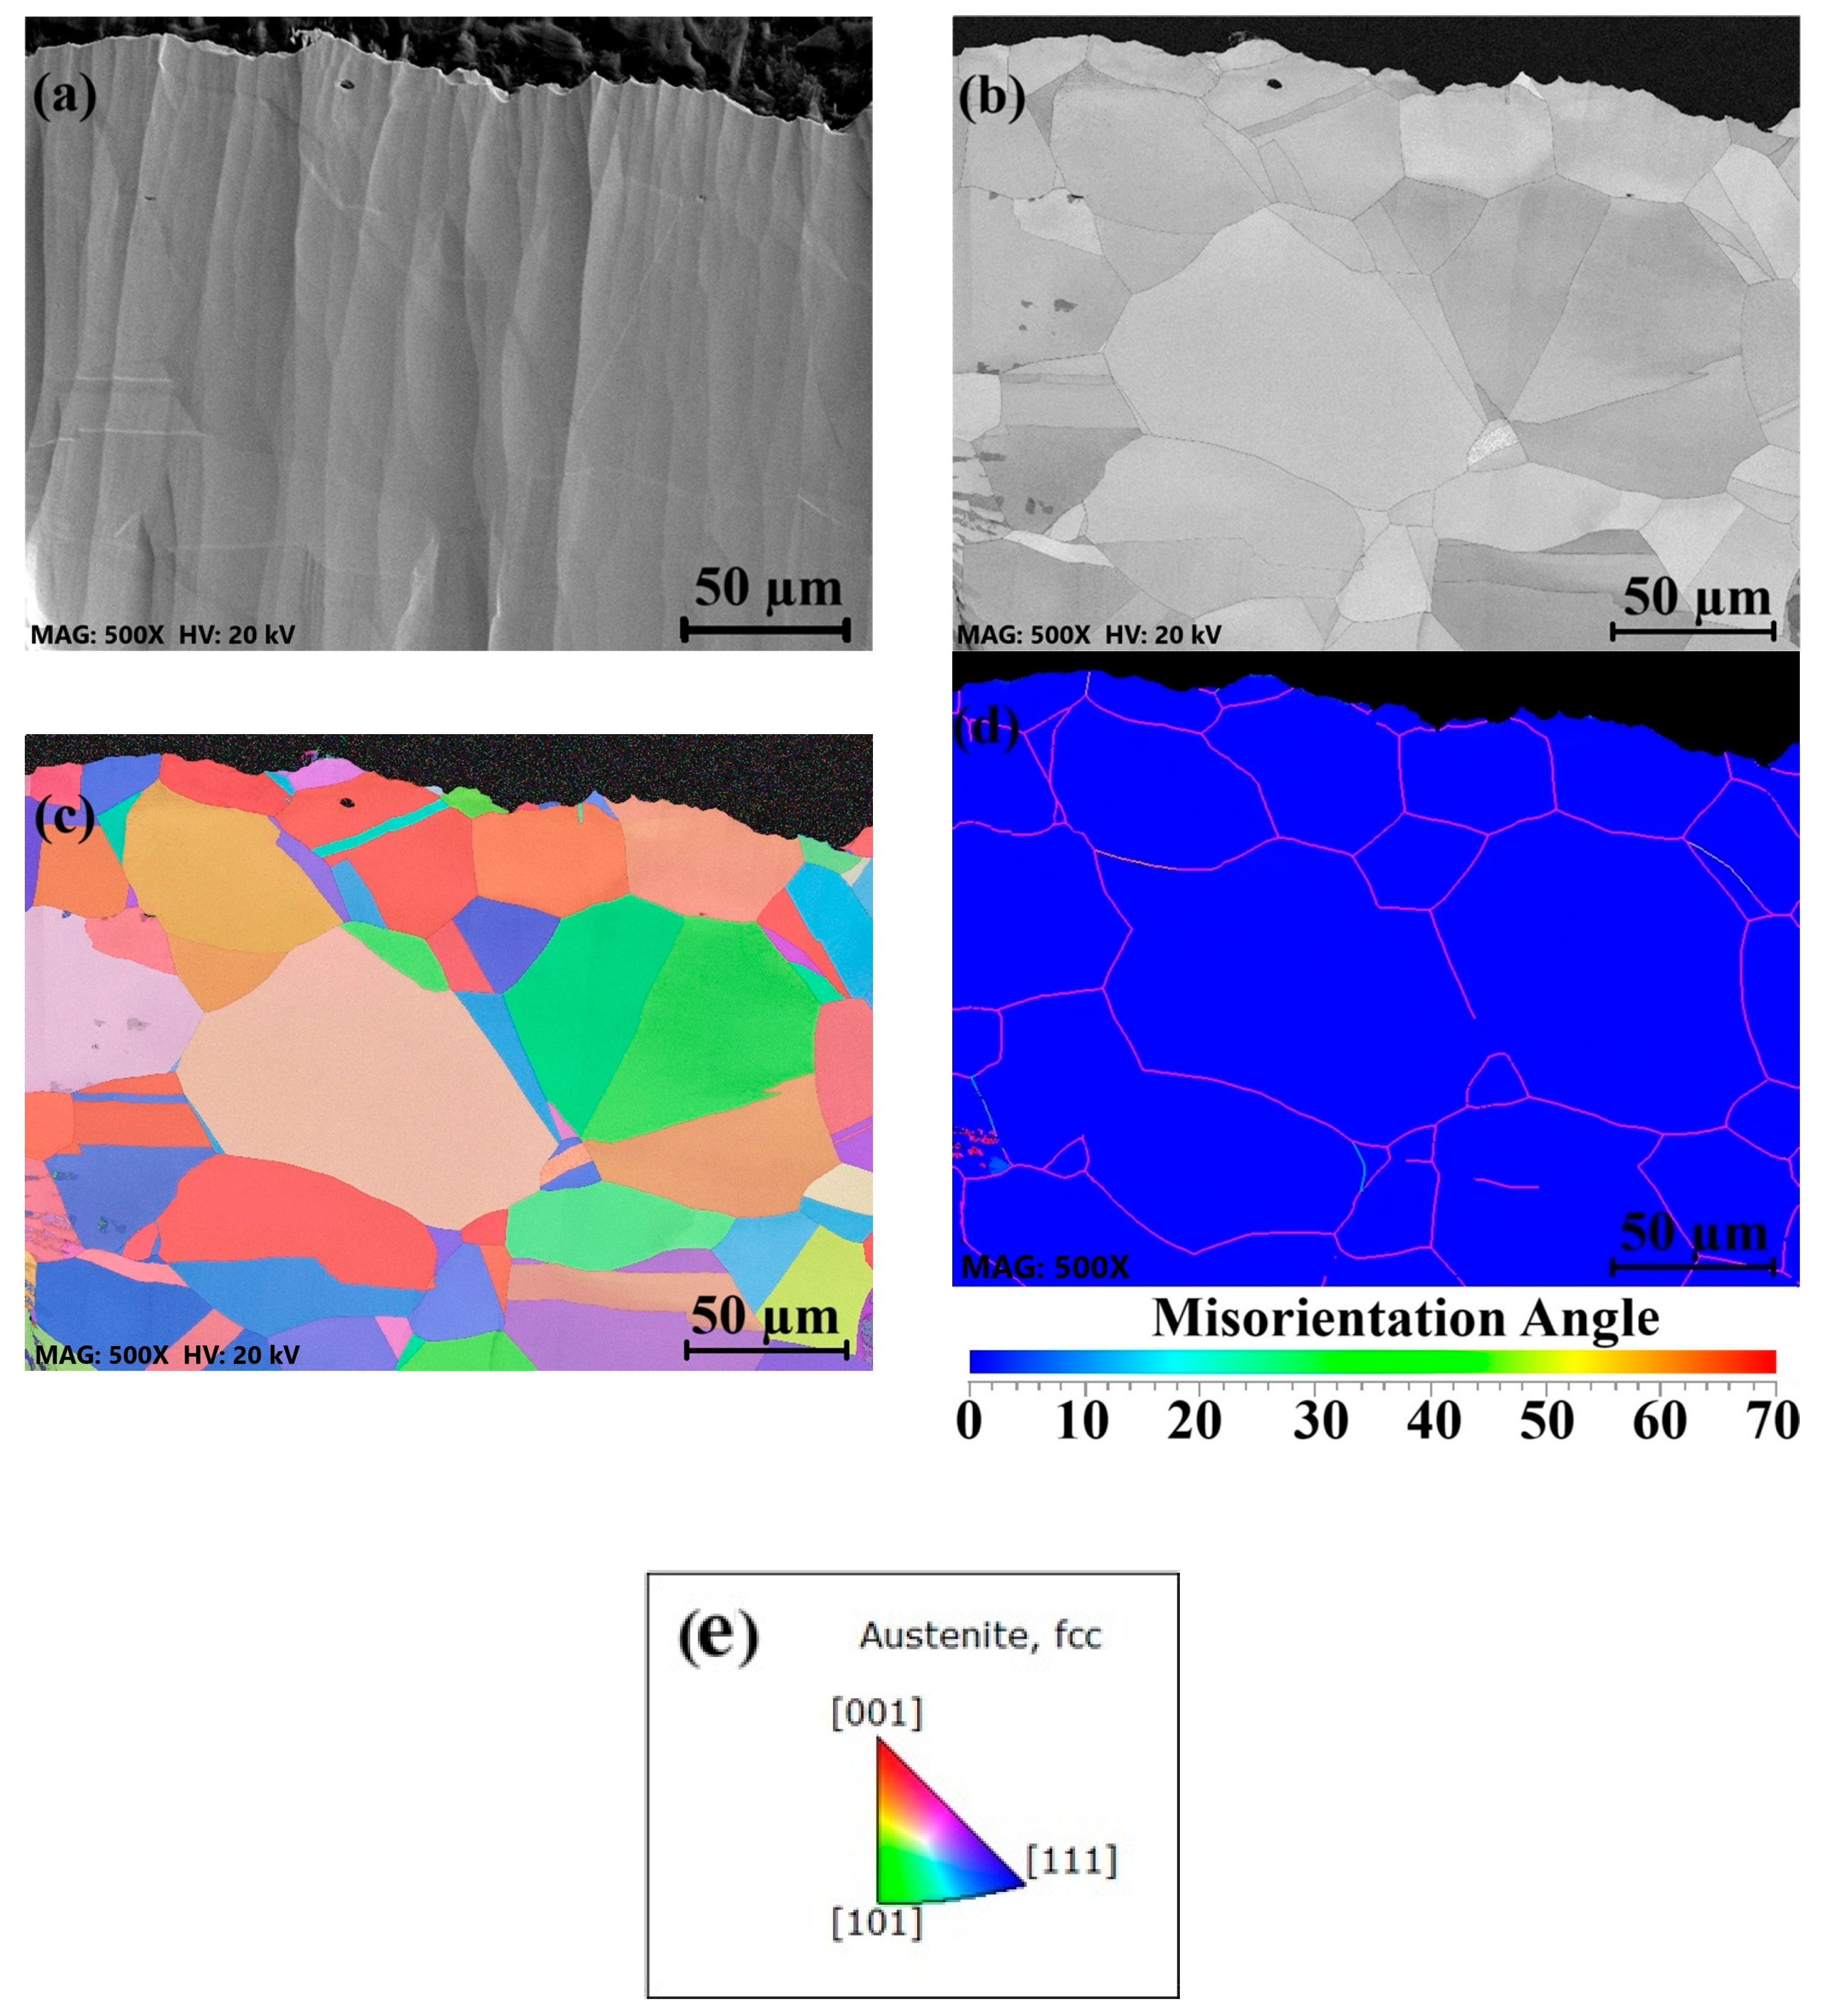
The EBSD maps in Figure 10 show the cross-sectional microstructure of the AISI 316L stainless steel base metal. A variety of crystallographic orientations are observed, yet the grains appear uniform, with smooth boundaries and limited deformation. The average grain size is approximately 5 µm, establishing a baseline for assessing the effects of surface preparation and welding.
Figure 10.
(a) SEM cross-section before welding/buffing; (b) band-contrast map (grain boundaries); (c) IPF-Z map used in simulations; (d) EBSD orientation map; (e) IPF color legend.
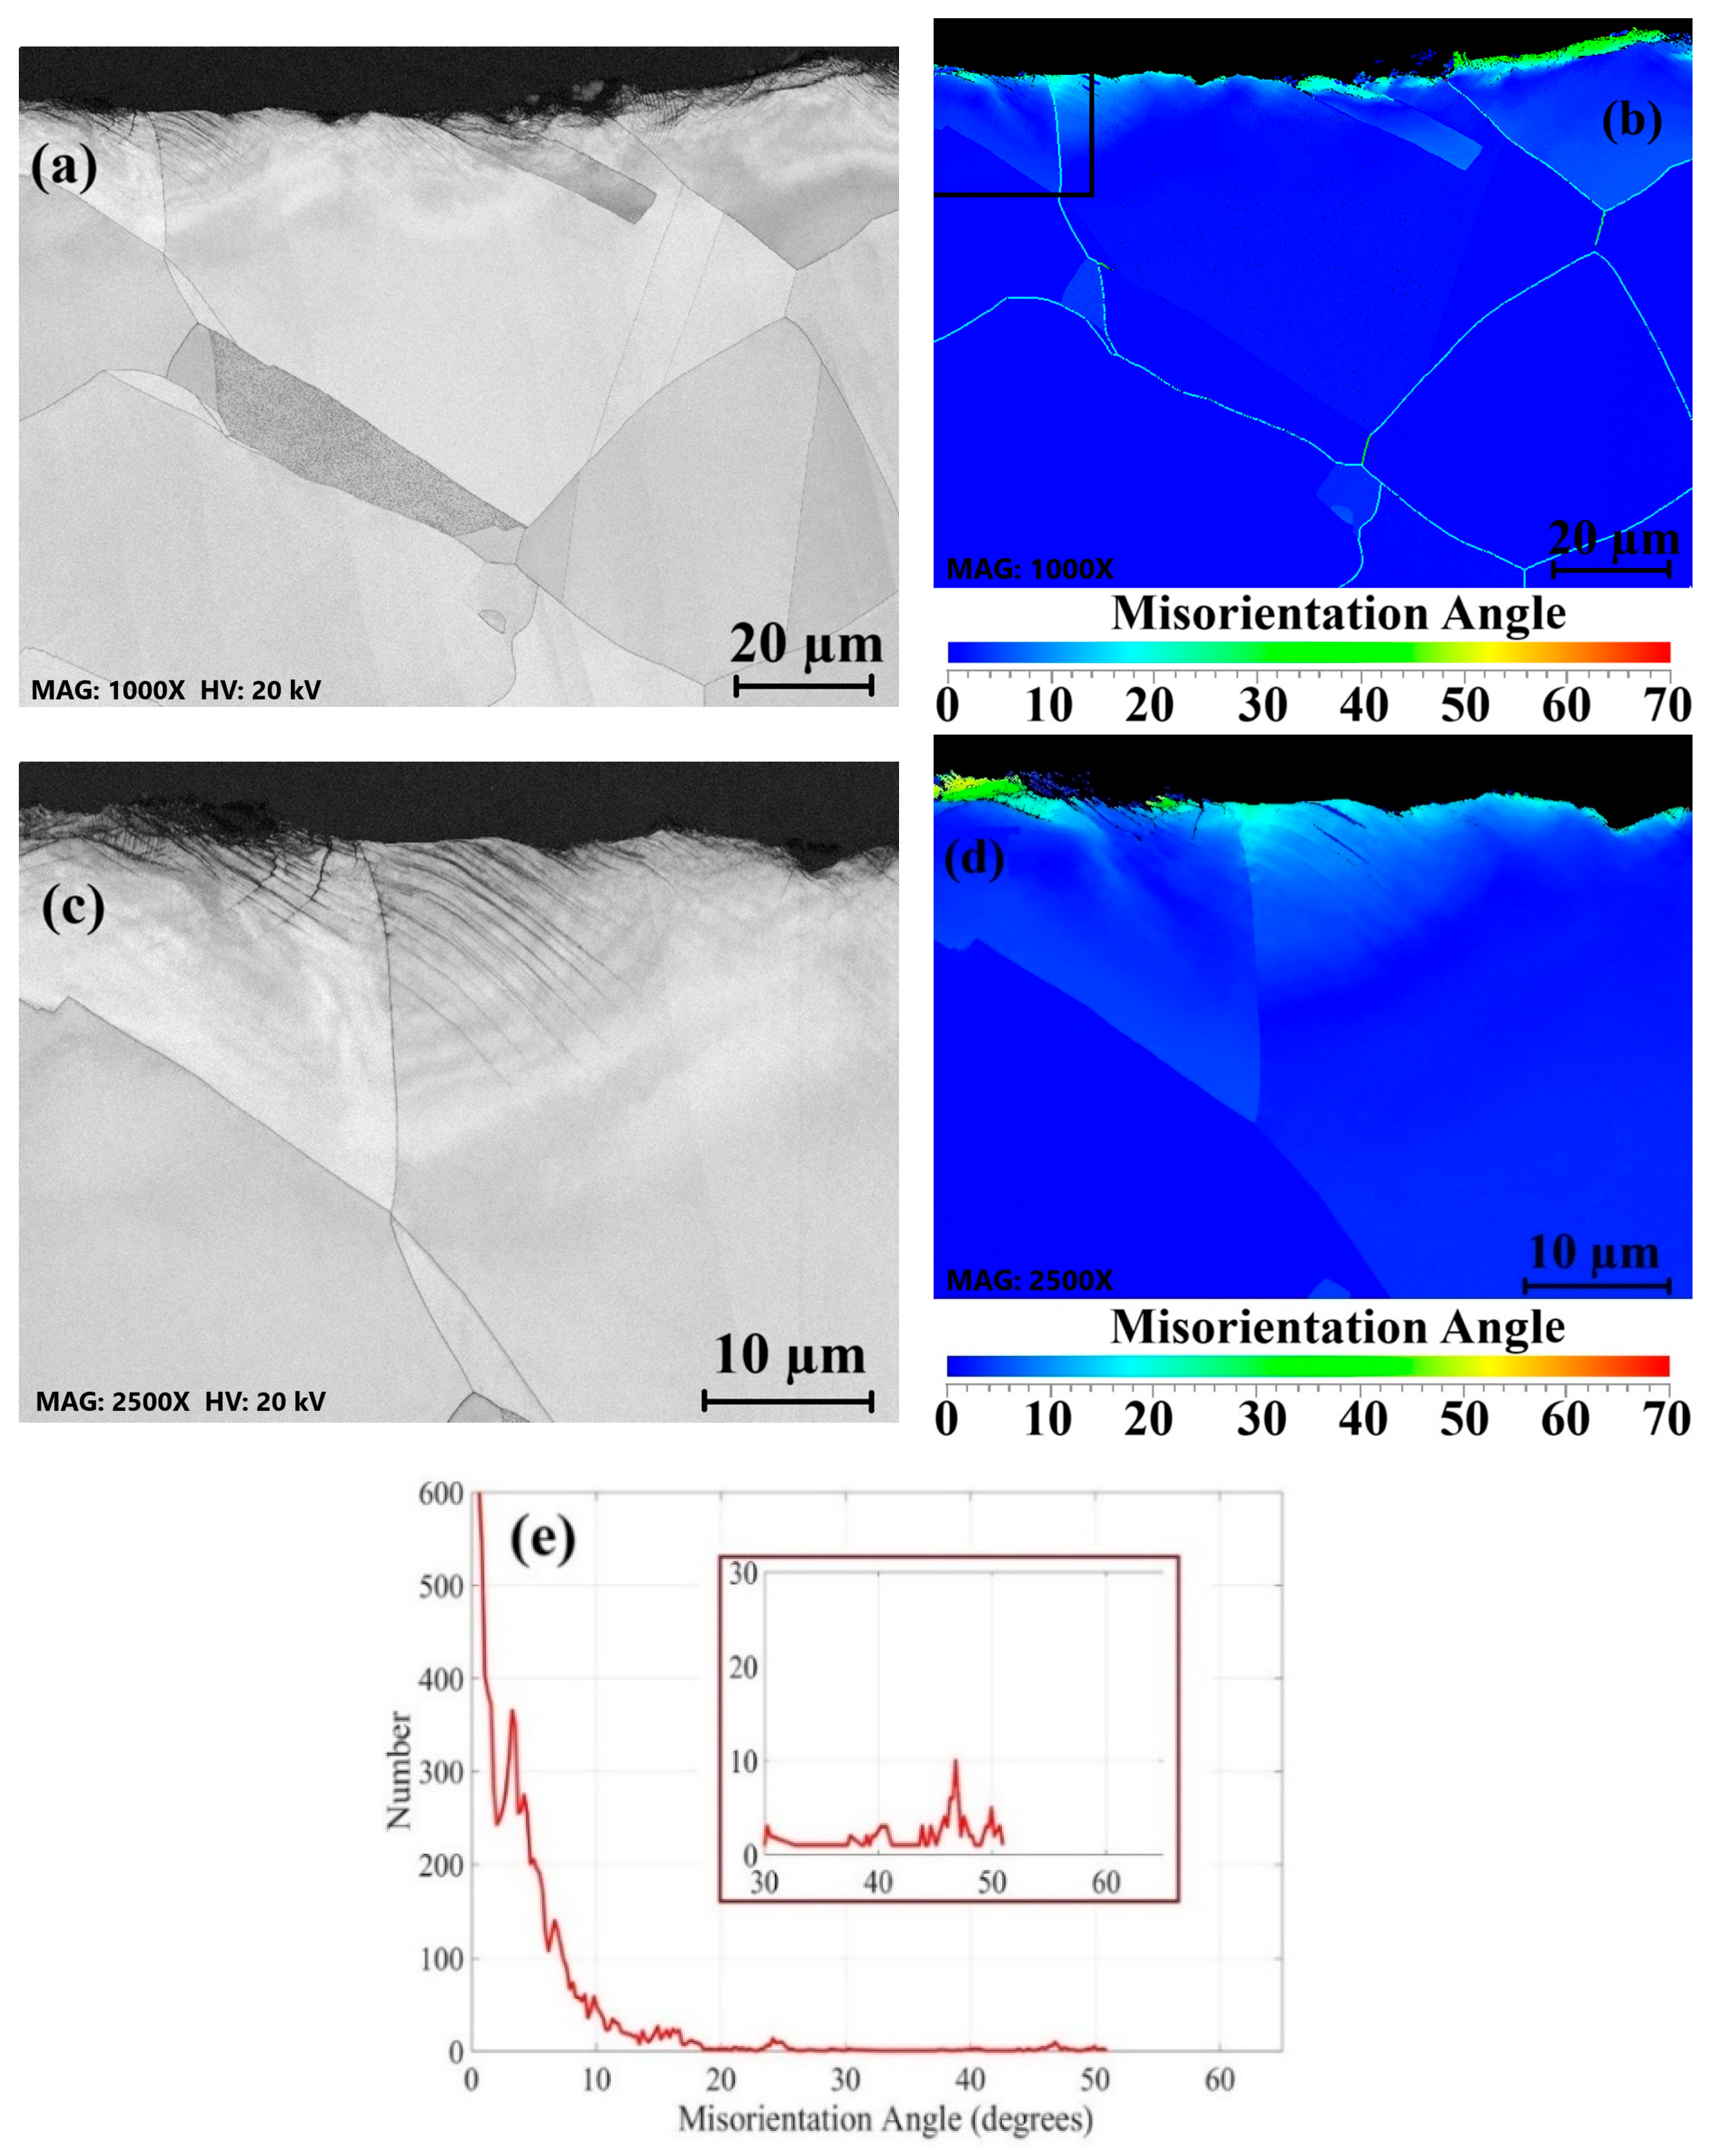
The EBSD analysis of sample B2 (Figure 11) reveals localized misorientation near the surface, reaching up to 50.91°. This misorientation, visible in both the angular misorientation graph and the color-coded EBSD map, reflects strain introduced by the buffing process. The affected zone extends roughly 5 µm beneath the surface, beyond which the grains return to their original orientation and size. Slip bands observed in Figure 11c confirm plastic deformation in the near-surface region.
Figure 11.
EBSD of 316L (B2): (a) band-contrast map; (b) orientation map; (c) higher-magnification view of the black zone in (b); (d) orientation map for (c); (e) average misorientation vs. depth for B2.
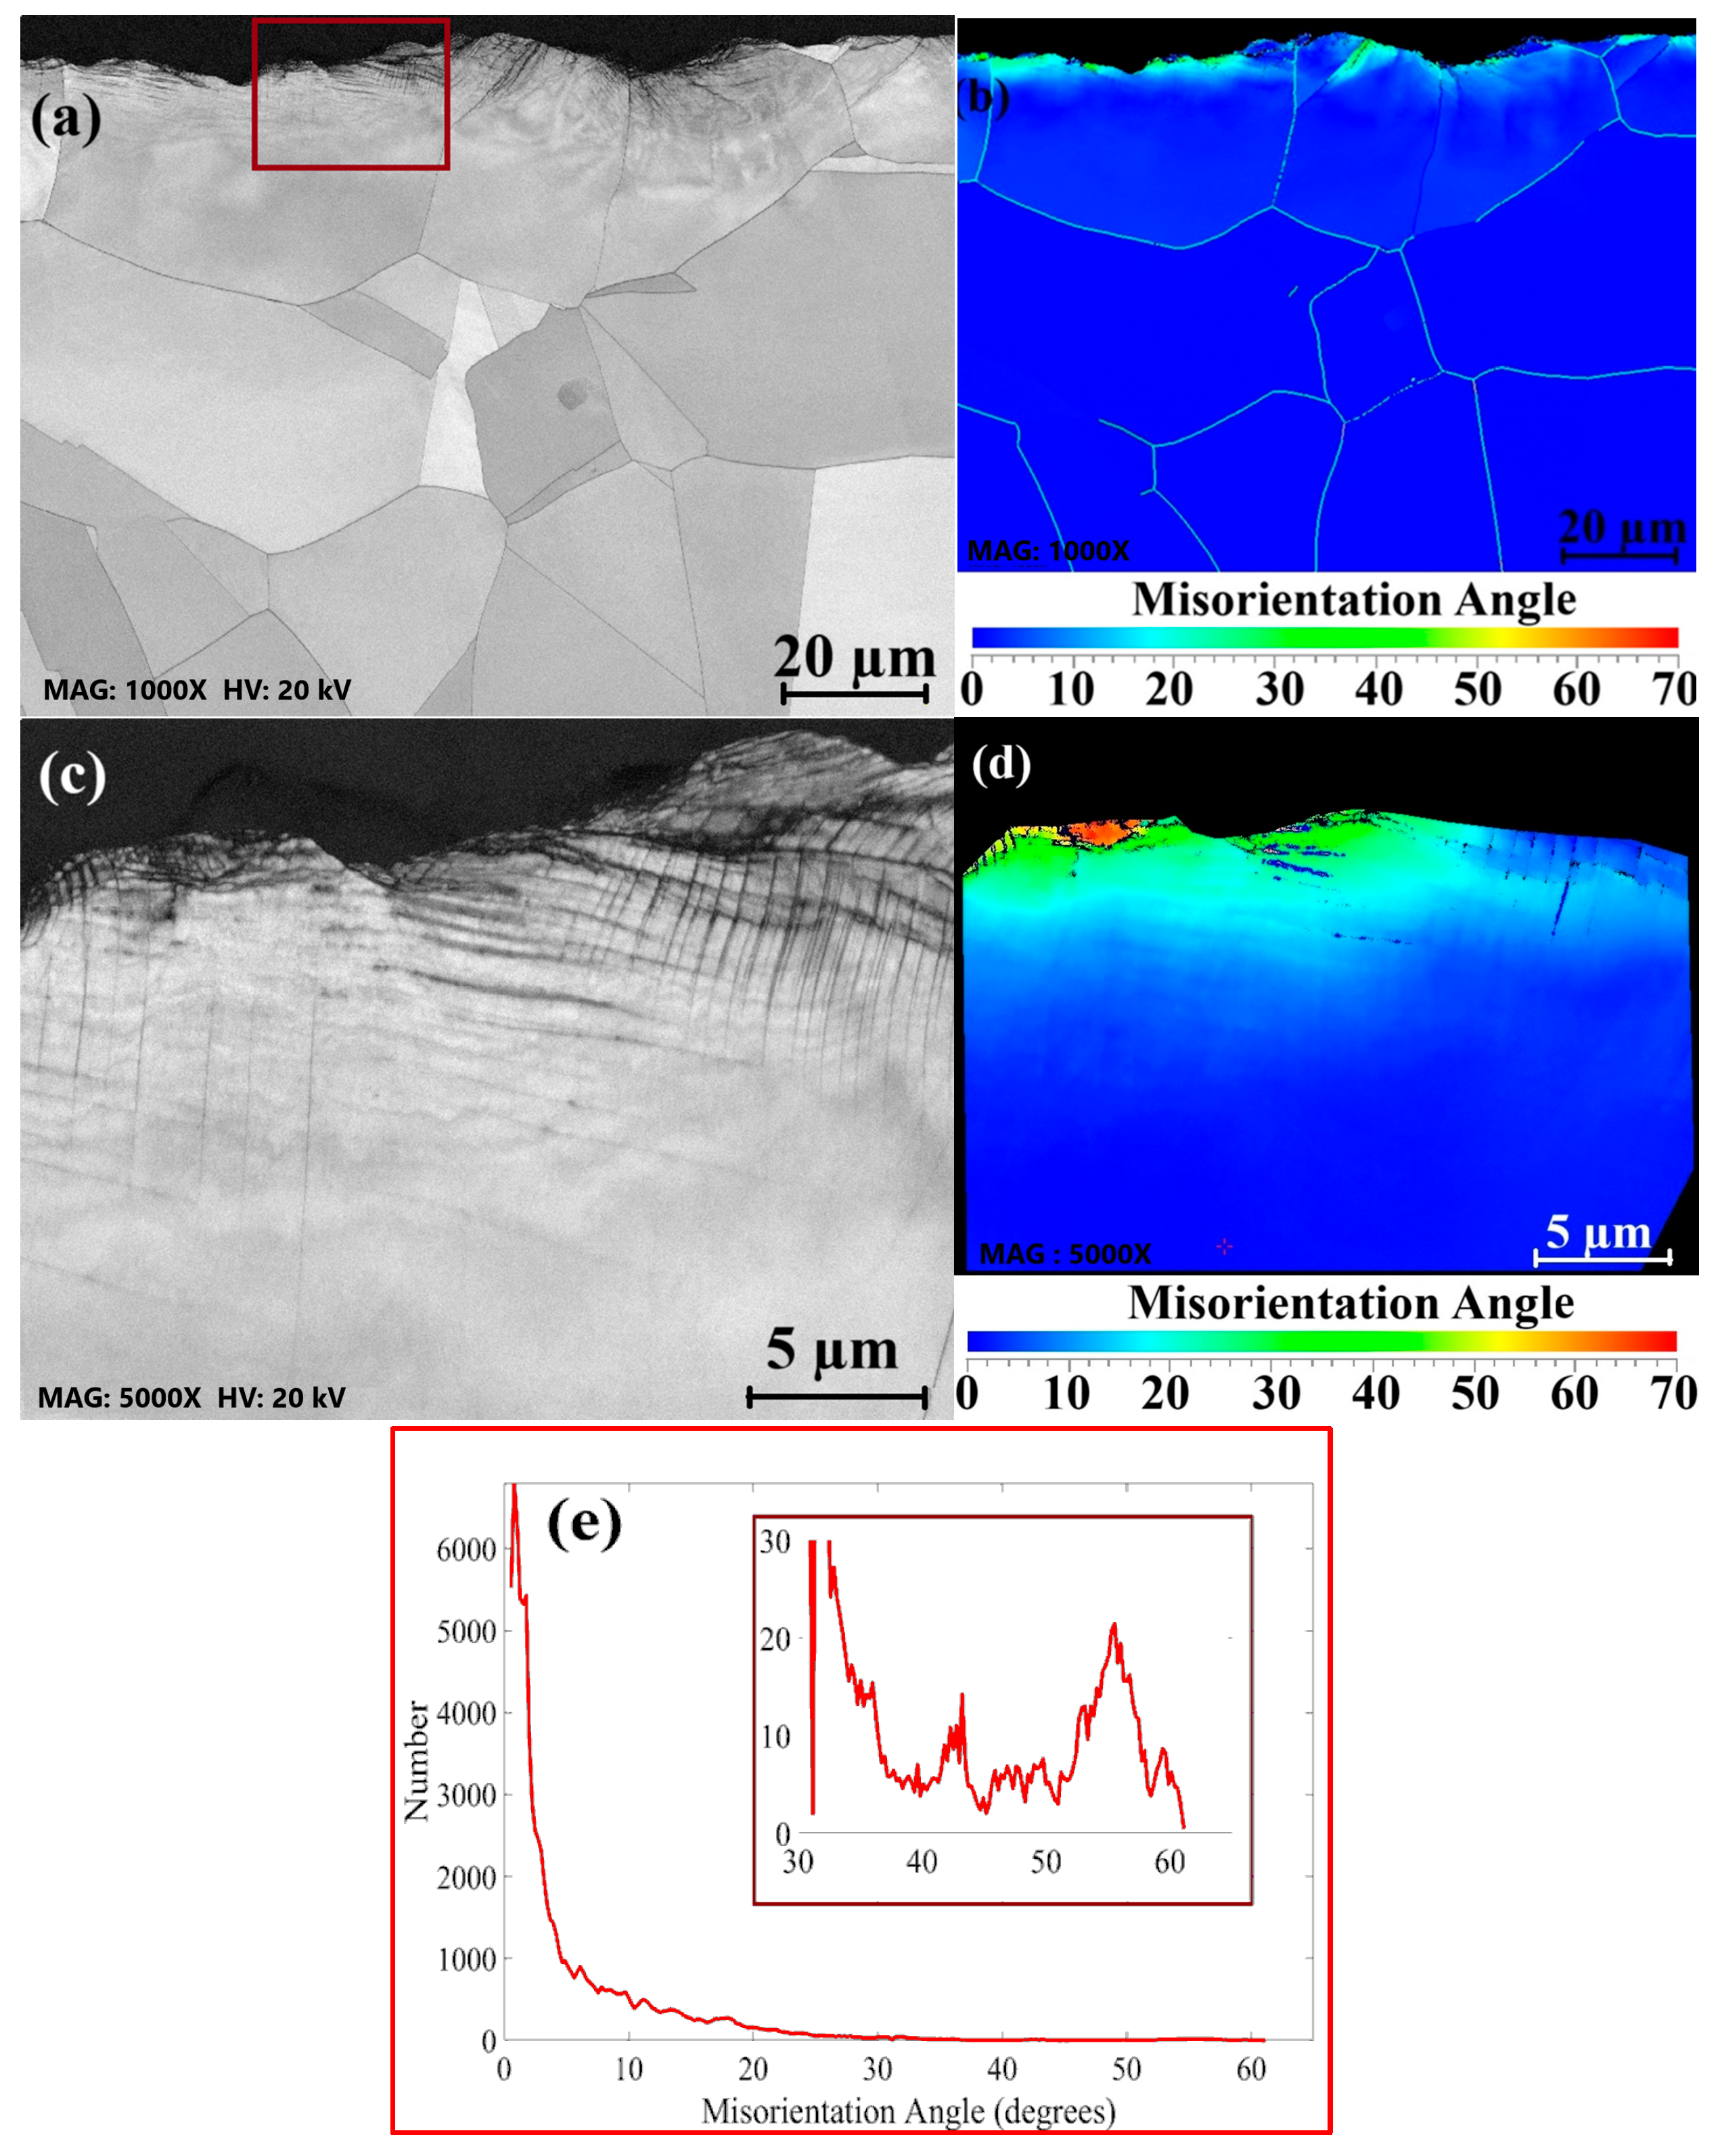
In contrast, sample B1 exhibits greater surface deformation, with misorientation angles up to 61.11° and a deformation depth of about 7 µm. The misorientation is continuous across the surface, indicating a more uniform strain distribution. These findings highlight that higher roughness introduces more pronounced surface deformation, both in terms of misorientation angle and depth (Figure 12). The observed differences suggest that the surface preparation technique significantly influences the subsurface strain and deformation characteristics. Figure 12c shows a higher density of slip bands compared to B2, indicating more pronounced plastic deformation near the surface. The increased slip band density suggests a greater degree of localized strain.
Figure 12.
EBSD of 316L (B1): (a) band-contrast map; (b) orientation map; (c) higher-magnification view of the red zone in (a); (d) orientation map of the grain in (c); (e) average misorientation vs. depth for B1.
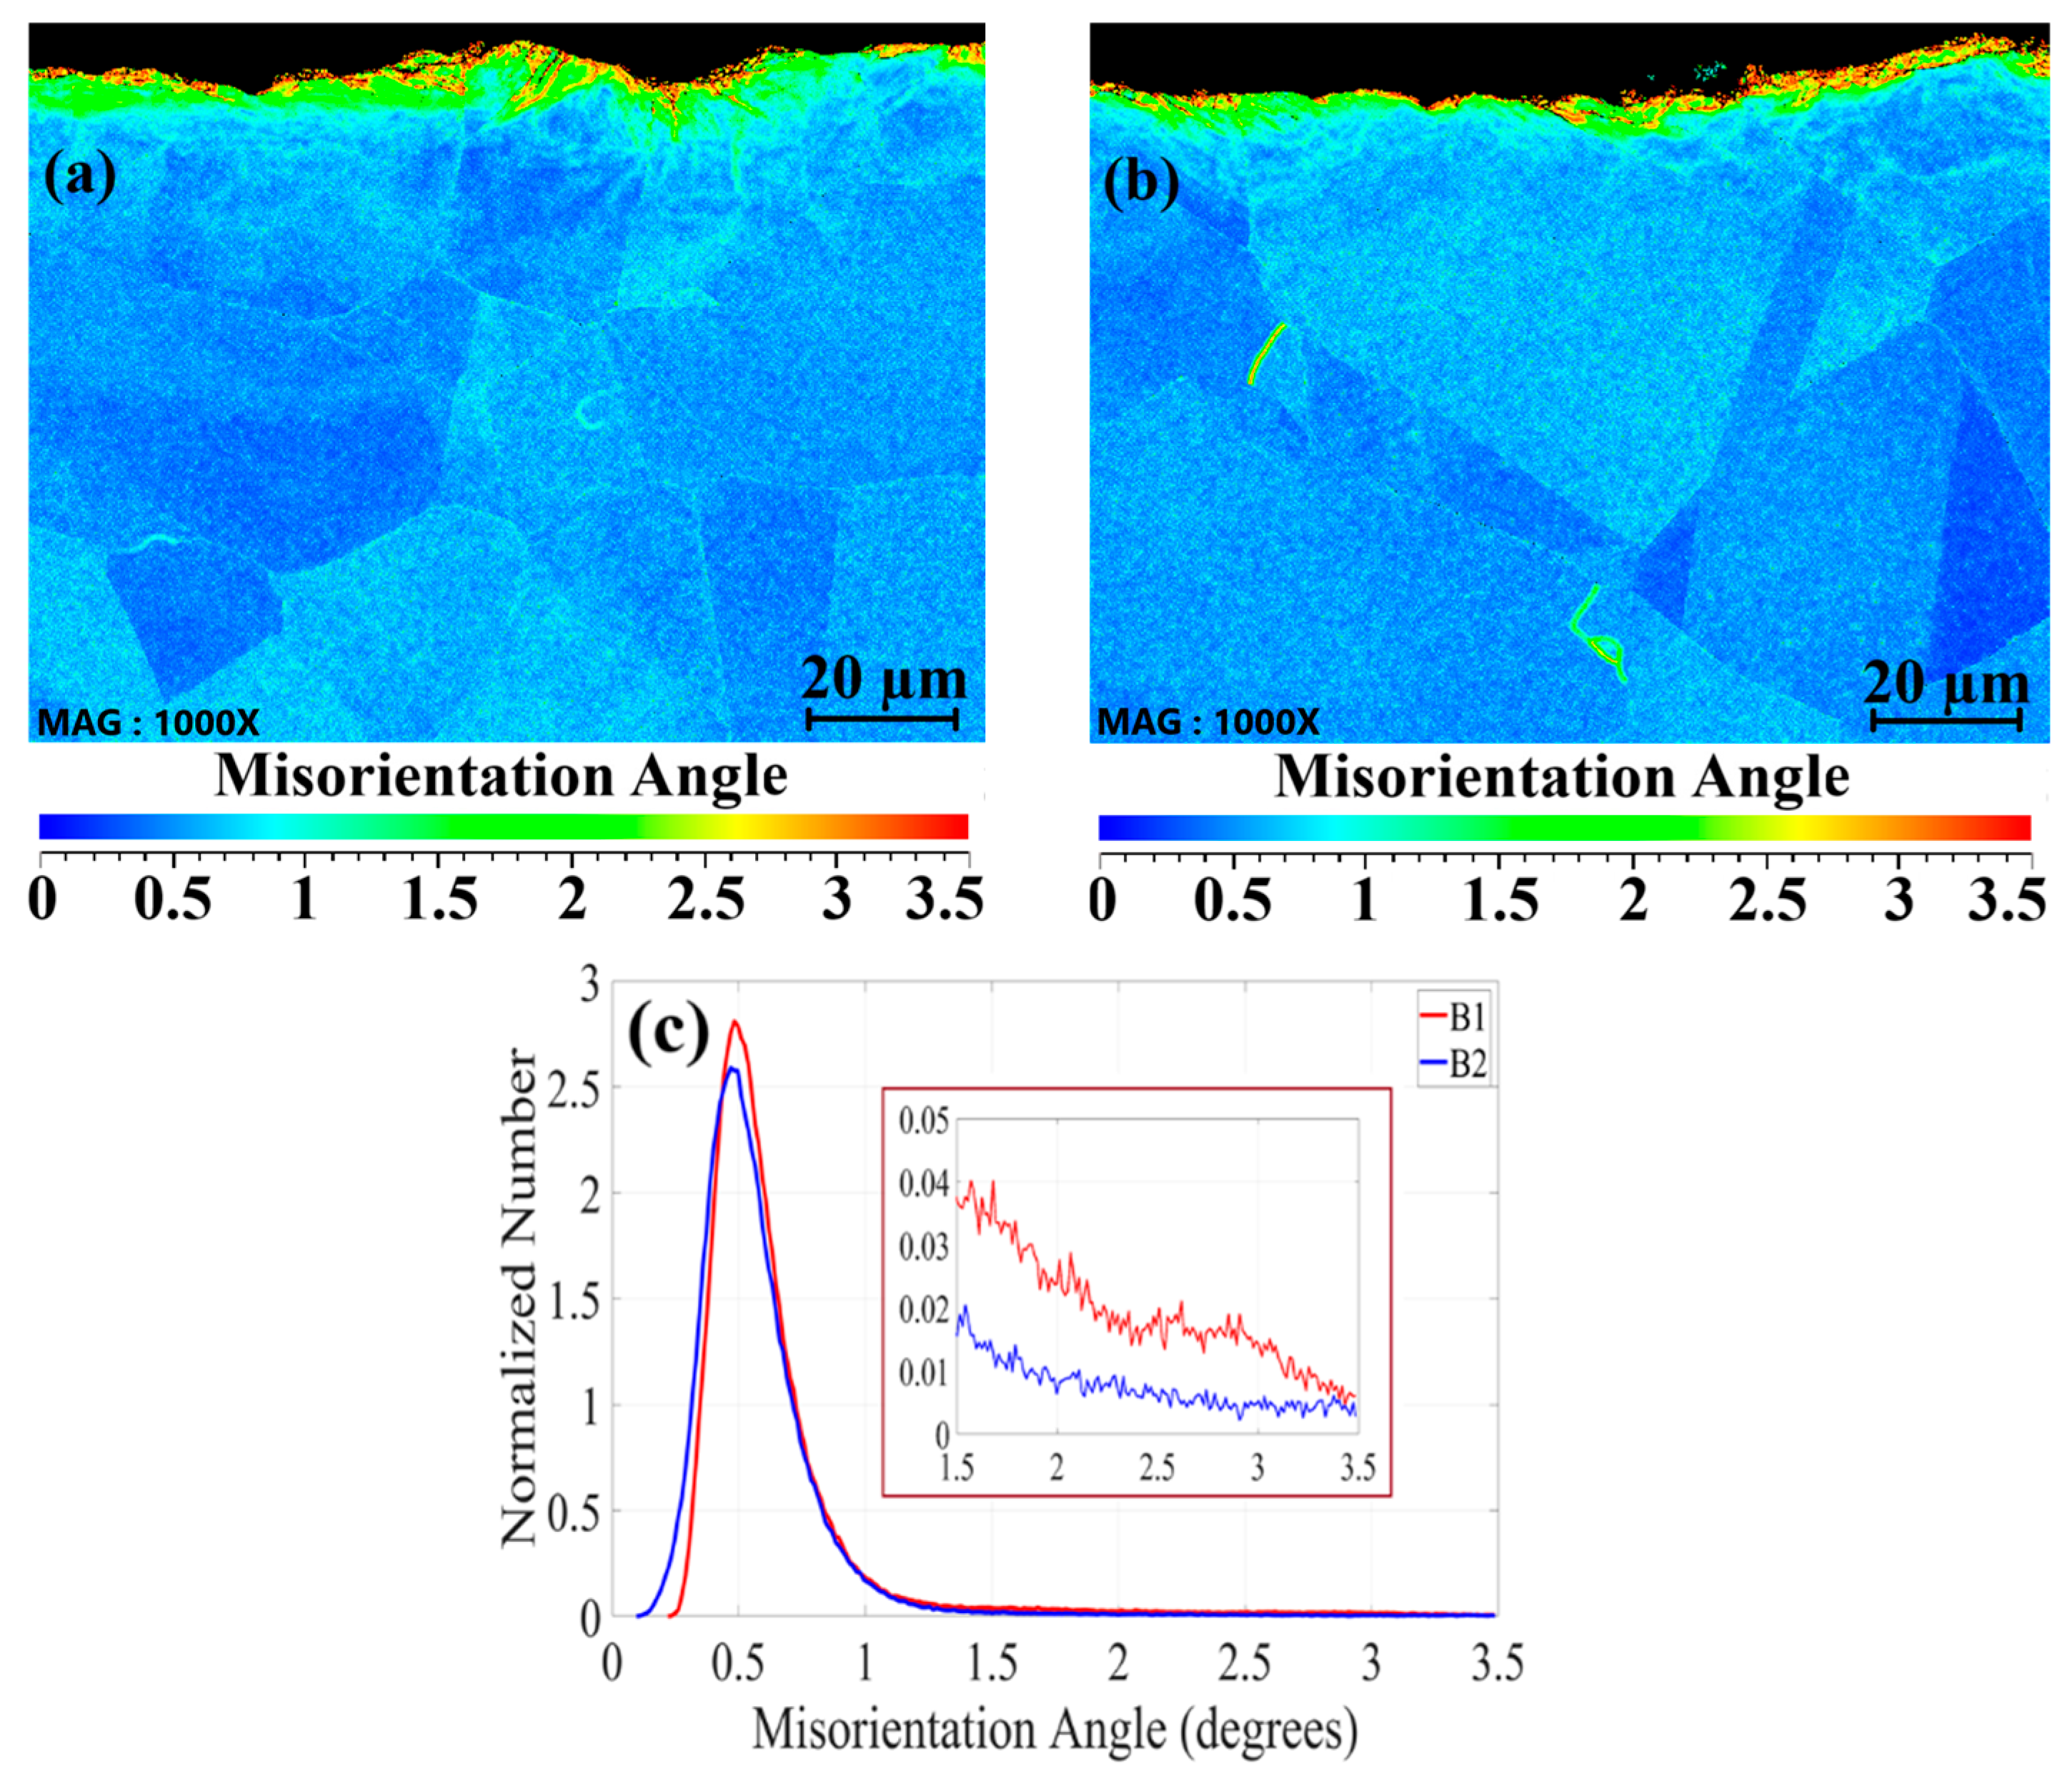
Figure 13 compares the kernel average misorientation (KAM) maps for B1 (40-grit) and B2 (60-grit). The blue-to-red color gradient represents increasing misorientation. The B1 specimen shows higher concentrations of localized strain near the surface, corroborated by the normalized misorientation distribution (Figure 13c). This trend confirms that rougher surface preparation promotes more deformation-induced strain energy.
Figure 13.
Kernel average misorientation analysis: (a) KAM map of B1, (b) KAM map of B2, (c) normalized misorientation distribution.
As illustrated in Figure 13, the misorientation introduced by buffing is largely relieved after welding due to the thermal cycle, which promotes recovery and recrystallization in the surface layer [,,]. During recovery, stored strain energy is partially released, reducing misorientation and residual stress []. Recrystallization subsequently replaces the deformed grains with new, strain-free grains []. In austenitic stainless steels, these microstructural transformations correlate closely with the observed discoloration: thicker oxides formed under higher thermal exposure correspond to recrystallized regions, whereas lighter discoloration zones reflect thinner Cr-rich oxides and limited recrystallization [].
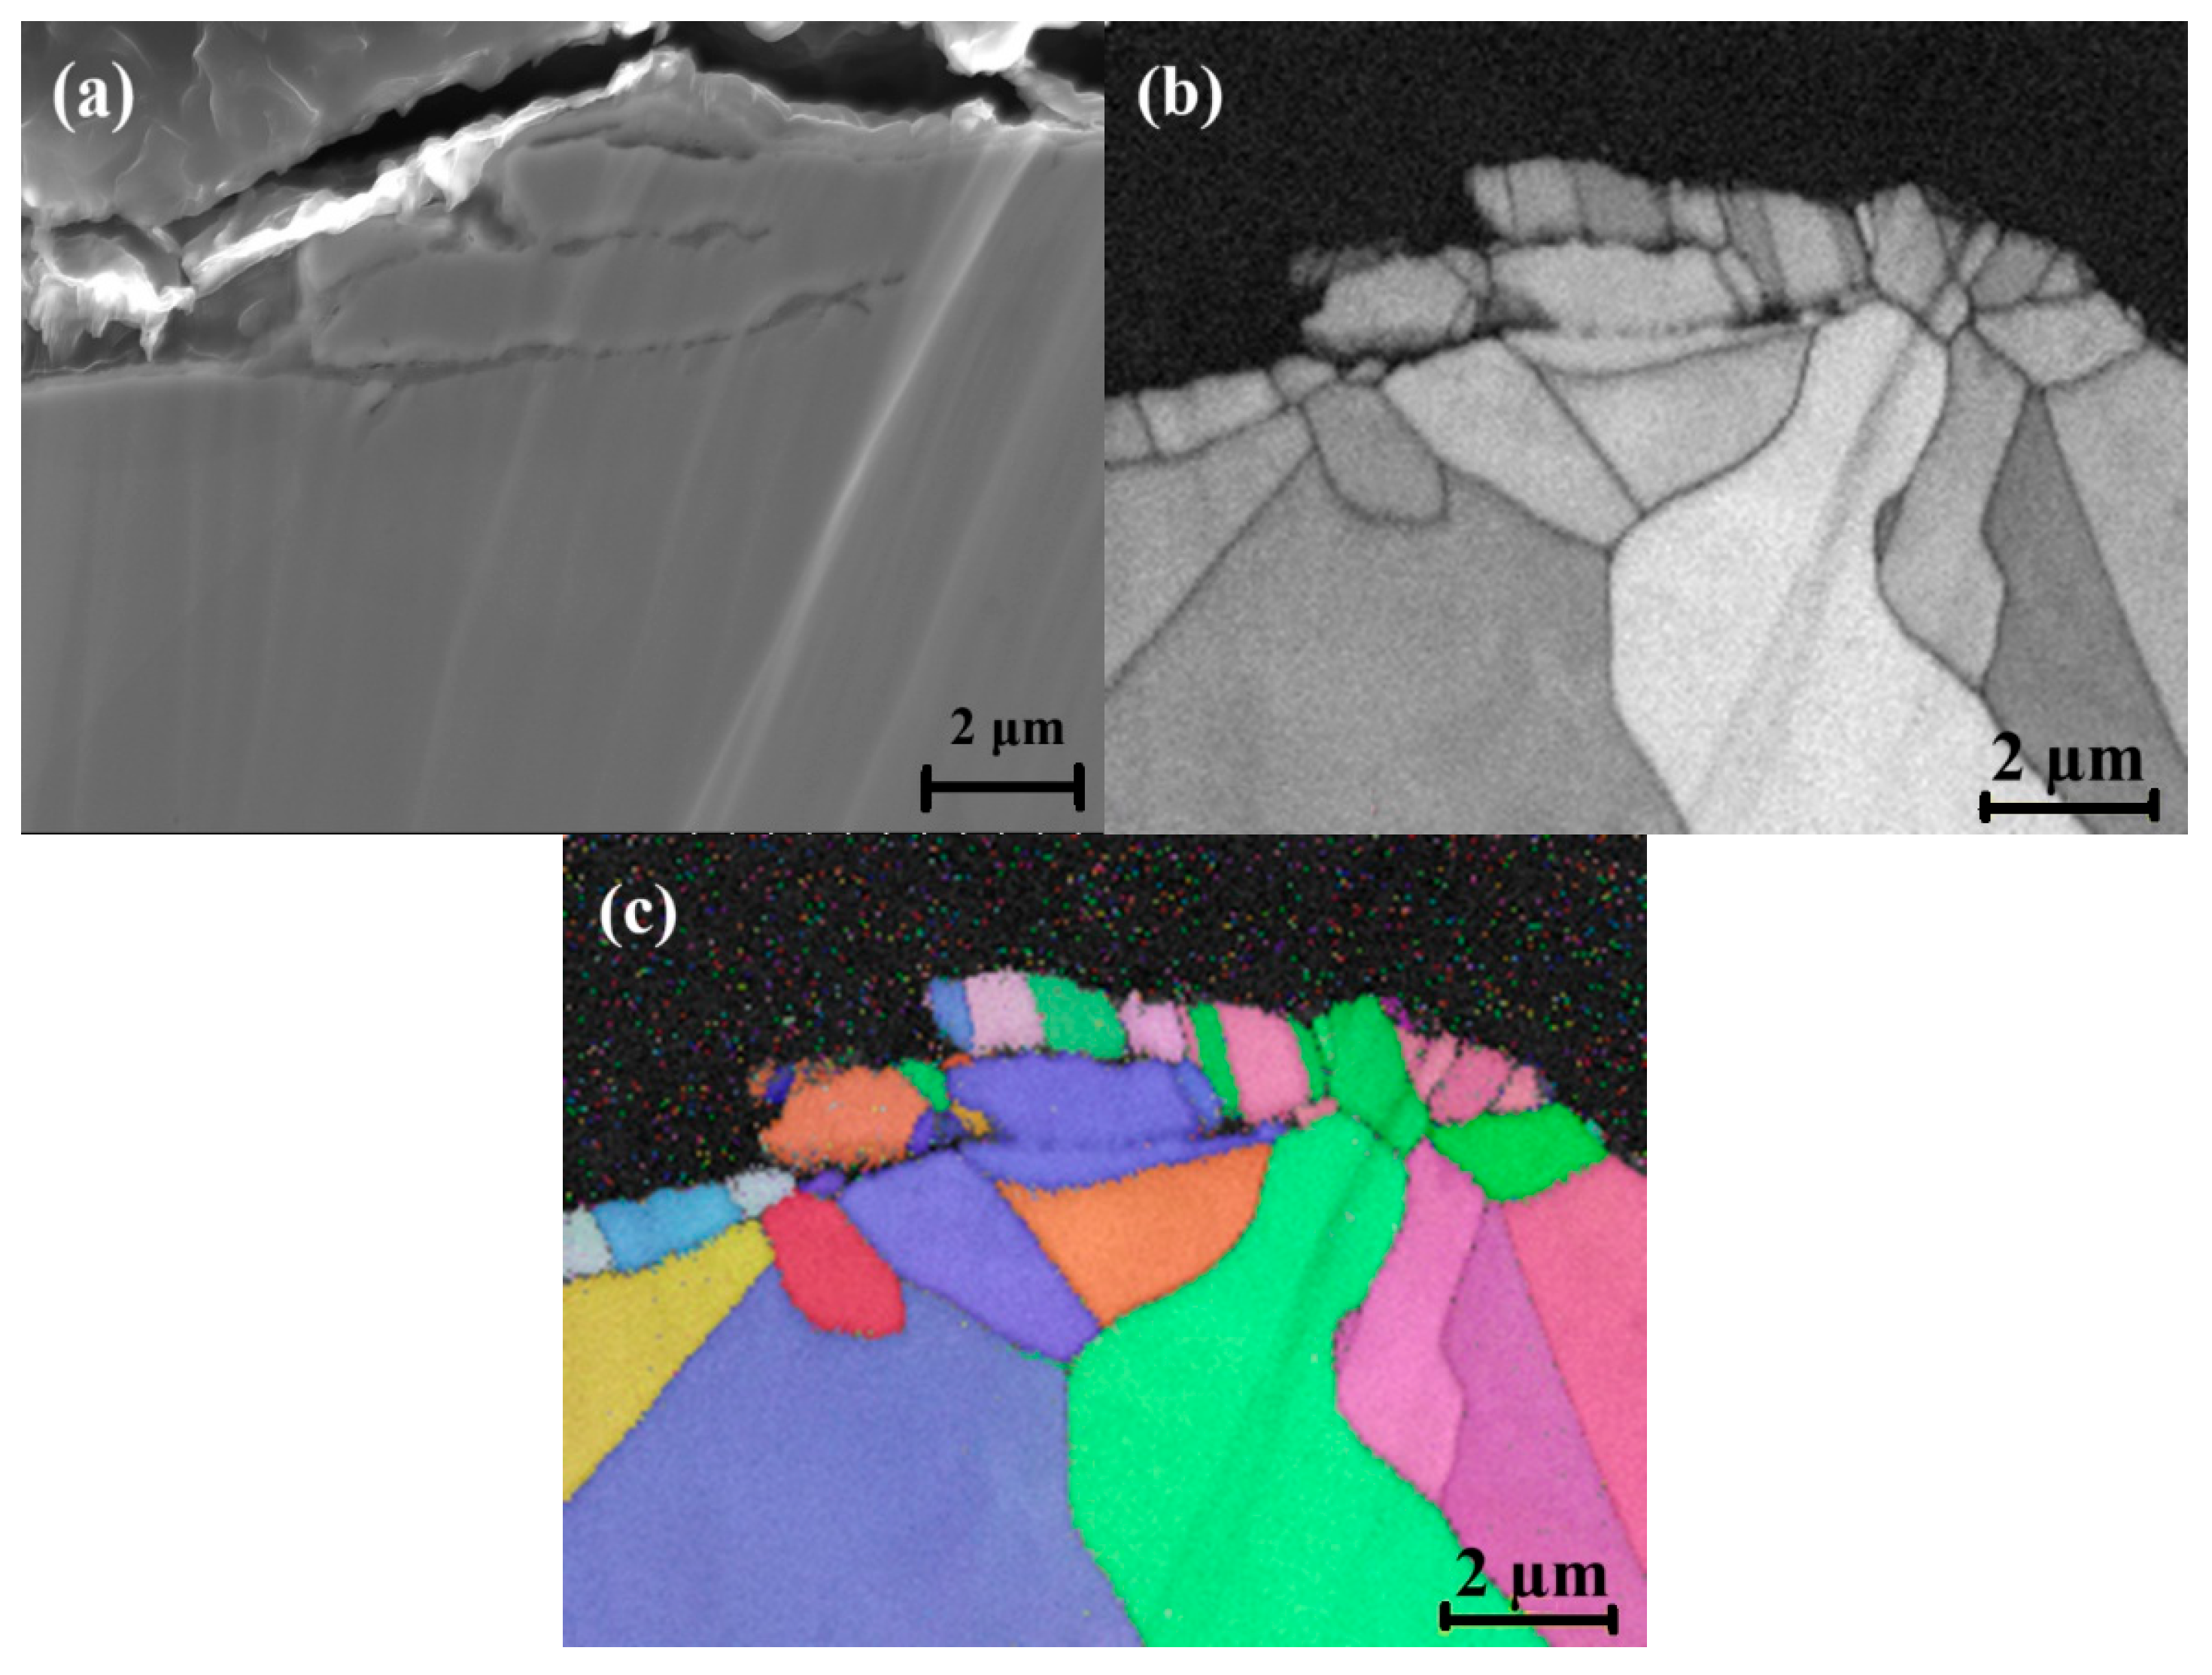
After welding, the near-surface microstructure consists of fine, equiaxed grains (Figure 14), markedly smaller than those in the pre-weld condition. The heat input during welding—particularly within the HAZ—drives this grain refinement. The prior deformation induced by buffing acts as a catalyst for recrystallization, providing nucleation sites for the formation of smaller grains during thermal exposure.
Figure 14.
Post-weld EBSD, 316L (B2), 2.5 mm from fusion line: (a) SEM of HAZ; (b) grain boundary map (recrystallization/grain refinement); (c) orientation map.
Overall, EBSD analysis revealed that the rougher 40-grit (B1) surface condition produced higher misorientation and greater strain energy near the surface than the 60-grit (B2) condition. This increased density of grain boundaries and local deformation directly influences corrosion behavior in the HAZ—regions most susceptible to pitting. Enhanced misorientation and grain boundary density in B1 likely accelerate the diffusion of alloying elements such as Cr and Mn along grain boundaries, linking surface roughness to both microstructural evolution and corrosion resistance.
3.3. Oxidation Analysis
Figure 15 shows elemental maps revealing Cr- and Mn-depleted zones along grain boundaries after welding. These depleted areas form due to preferential oxidation of Cr and Mn during high-temperature exposure.
Figure 15.
Elemental maps of the welded sample B2 (Figure 14): (a) O, (b) Cr, and (c) Mn.
The formation and stability of the oxide layer in welded AISI 316L depend on the diffusion of Cr and Mn from the bulk to the surface and grain boundaries []. his diffusion is governed by grain boundary density, surface roughness, and oxygen content in the purging gas. Because grain boundaries provide rapid diffusion pathways, the effective diffusivity ( can be described by a modified Hart’s equation []:
where and are the grain boundary and lattice diffusion coefficients, and is the grain boundary volume fraction:
where δ is the grain boundary width and is the grain size. Since the grain boundary diffusion coefficient is significantly higher than the lattice diffusion coefficient ( ) [], the effective diffusivity can be approximated as []:
This equation demonstrates that as grain size decreases, the contribution of grain boundary diffusion to increases. In the present study, samples buffed with 40-grit abrasive (B1) exhibit a higher density of grain boundaries compared to 60-grit (B2), resulting in enhanced diffusion rates for Cr and Mn.
The presence of oxygen in the backing gas accelerates oxidation kinetics by increasing the driving force for Cr diffusion towards the surface []. The flux of chromium (Cr) along grain boundaries can be estimated using the flux ratio equation, where is the flux ratio []:
According to Kim et al. [], the flux ratio in stainless steel is approximately 4% for coarse-grained (27 µm) structures. However, for finer grains, this ratio increases by approximately 8% to 12%, meaning that the effective diffusion through grain boundaries becomes more dominant. The calculated values for different grain sizes indicate that as grain size decreases, Cr flux increases, which promotes the formation of Cr-rich oxides in the oxidation layer. The preferential oxidation of Cr and Mn over other alloying elements, such as Fe or Ni, is because they exhibit a stronger affinity for oxygen and form oxides with lower Gibbs free energy, making them thermodynamically more favorable for oxidation [].
The depletion of Cr and Mn adjacent to grain boundaries reflects their thermodynamic preference for oxidation, forming Cr2O3 and MnO, both characterized by low Gibbs free energies of formation. These elements segregate toward boundaries during thermal exposure, where accelerated boundary diffusion at elevated temperatures produces localized depletion zones in the matrix [].
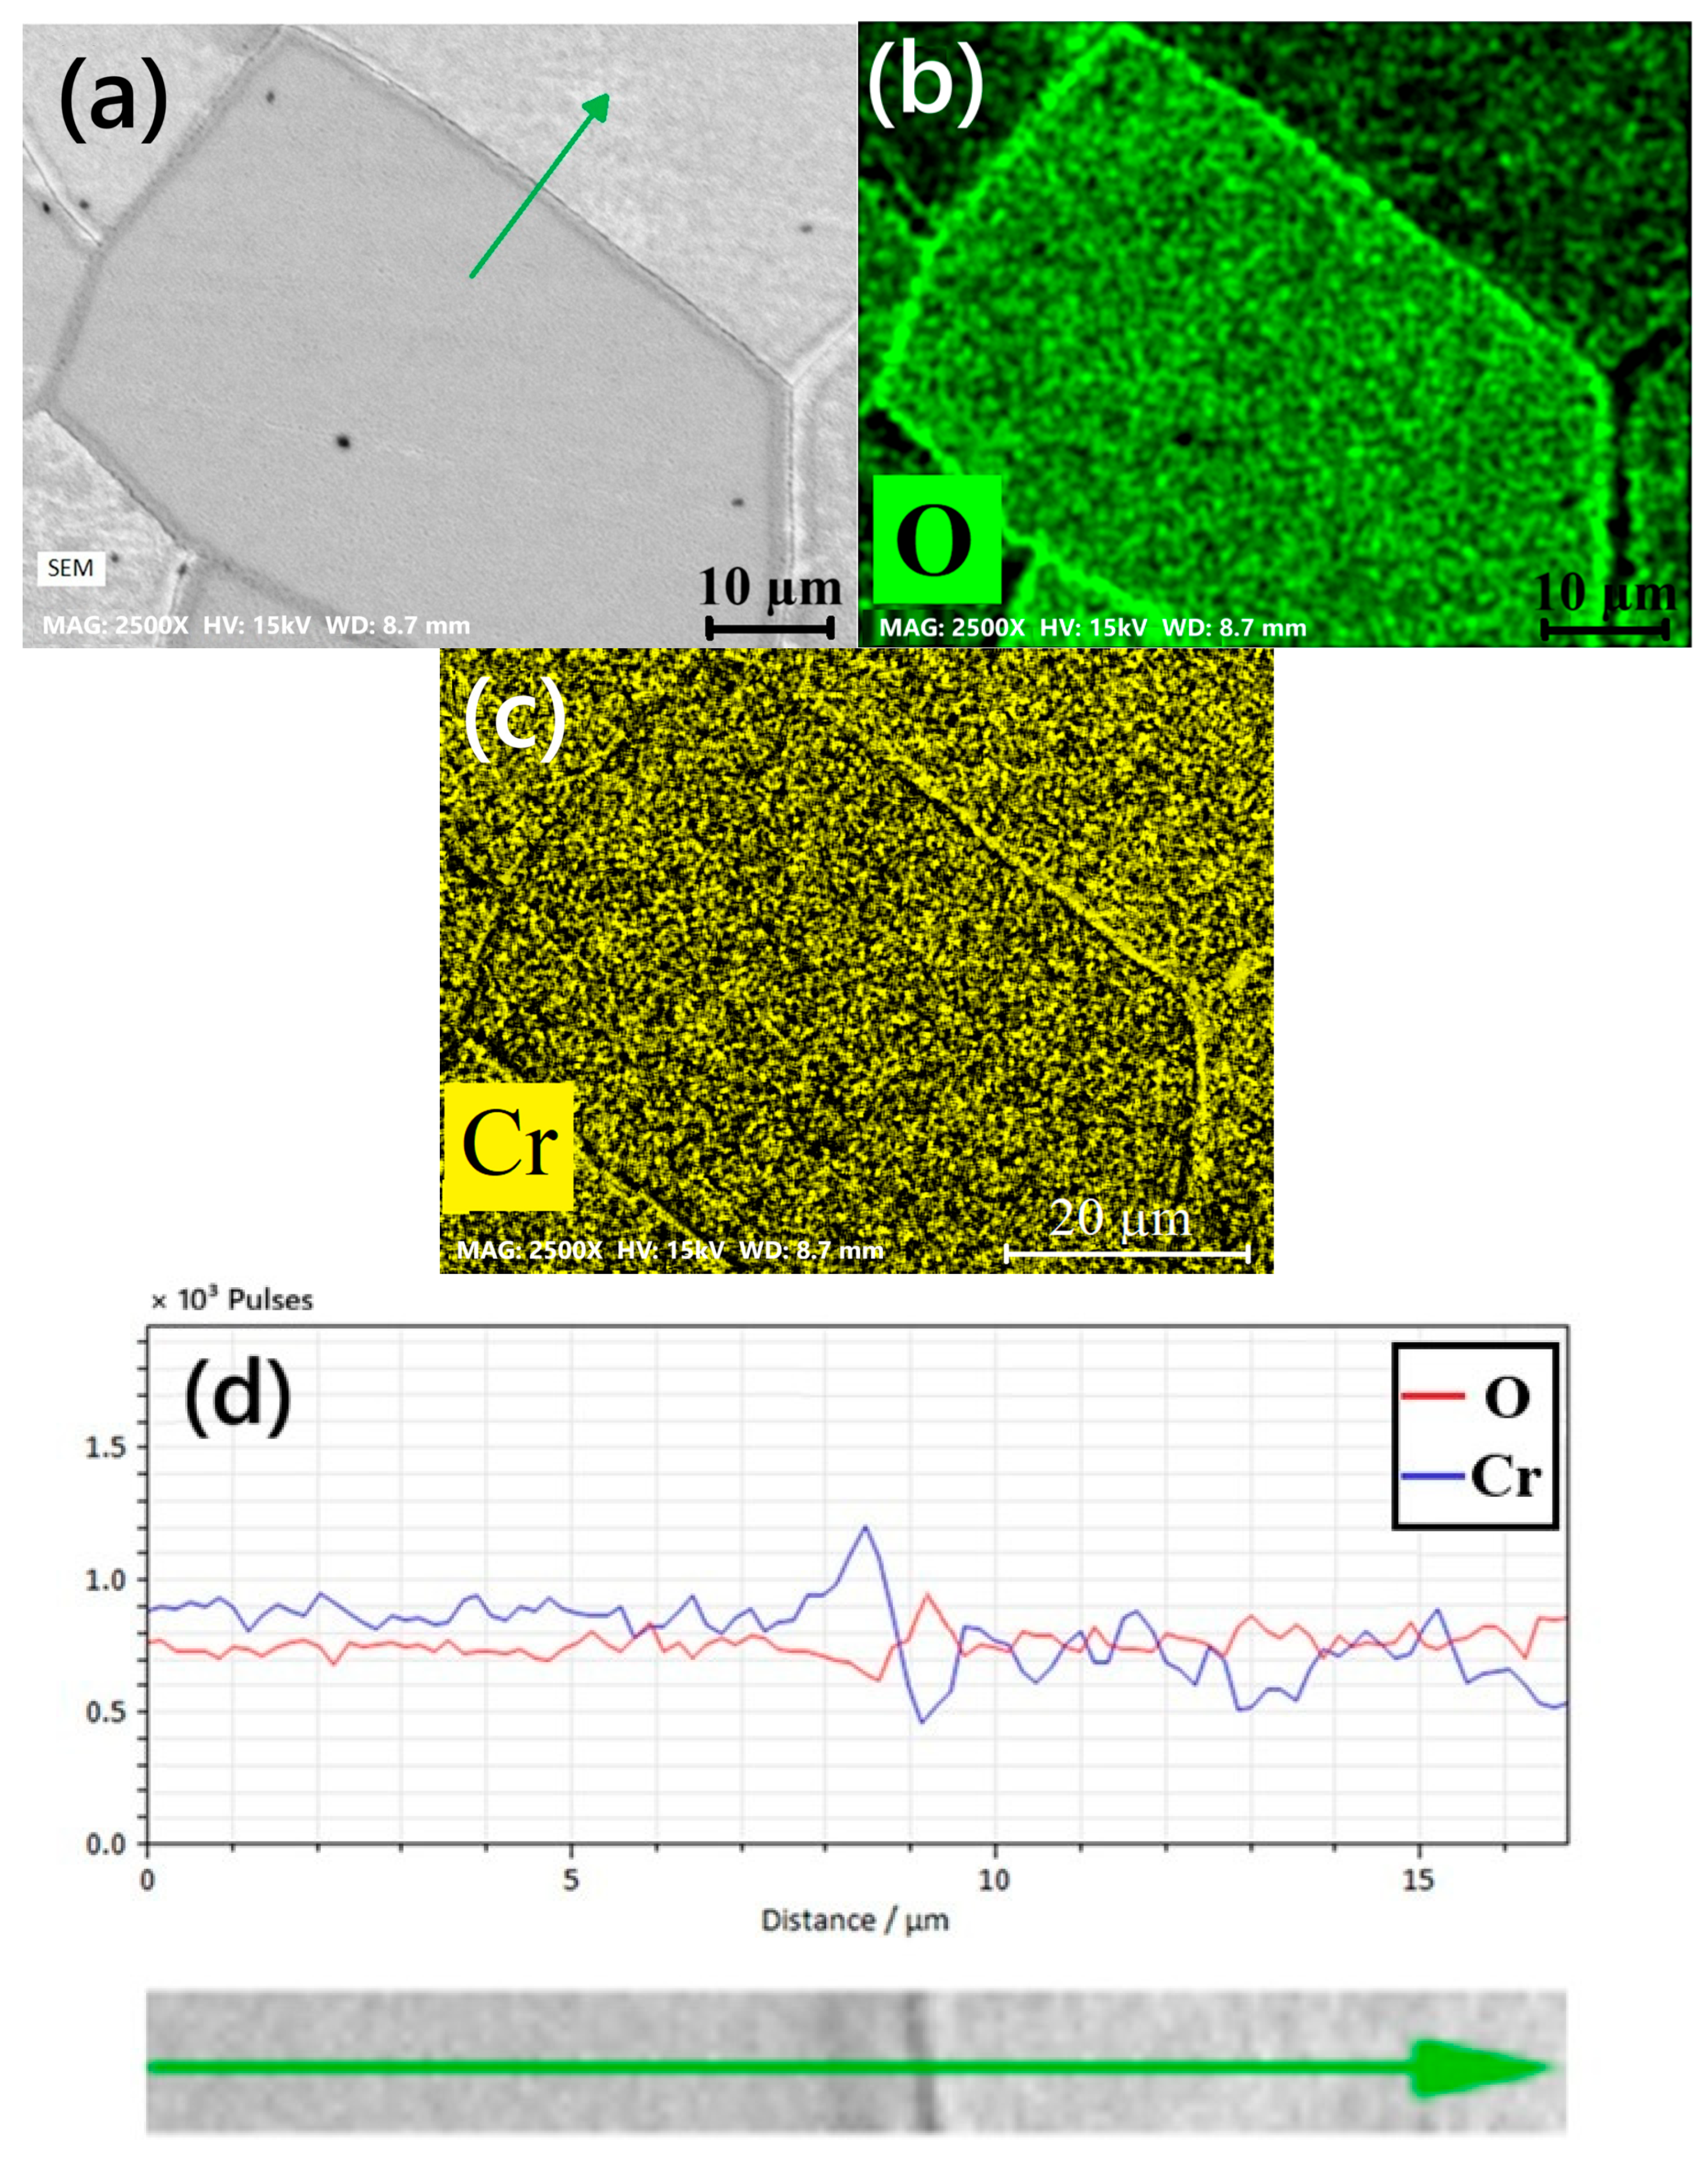
As shown in Figure 16, this setup enabled observation of early-stage oxidation while preserving thin oxides and grain boundary contrast. The maps reveal oxygen enrichment behind the grain boundaries and Cr accumulation along them, with corresponding oxygen depletion at the boundaries.
Figure 16.
Hot-stage (800 °C) surface maps: (a) SEM (grain boundaries); (b) O; (c) Cr; (d) line profile across a grain boundary.
The localized build-up of chromium at grain boundaries is attributed to the rapid diffusion that occurs along grain boundaries, far exceeding the rate of lattice diffusion at high temperatures []. Chromium migrates toward the boundaries, reacting with oxygen to form Cr2O3, a dense and protective oxide [,]. Chen et al. [] showed that in 254SMo, ultrasonic strengthening grinding converts the near-surface into a high-defect, grain boundary–rich layer (via recrystallization), shifting Cr transport from slow lattice diffusion in the coarse-grained, unground weld to fast grain boundary diffusion, which promotes the early formation of a denser Cr2O3. This enrichment of chromium at the grain boundaries results in oxygen consumption for oxide formation, thereby leading to a notable reduction of oxygen concentration in those regions [].
Behind the grain boundaries, the elemental maps show a notable enrichment of oxygen. This was attributed to the diffusion of oxygen into the material’s bulk during the high-temperature exposure. However, in these regions, the availability of Cr is limited due to its preferential segregation to the grain boundaries, as seen in the microstructural analysis of the subsurface layers, reported in Figure 16. The Cr-depleted zones beneath the surface observed in Figure 16 further contribute to the inability of oxygen to form Cr oxide in these regions. Consequently, oxygen enrichment occurs in areas behind the grain boundaries where no protective oxide formation can occur, leading to potential vulnerability to localized oxidation or corrosion.
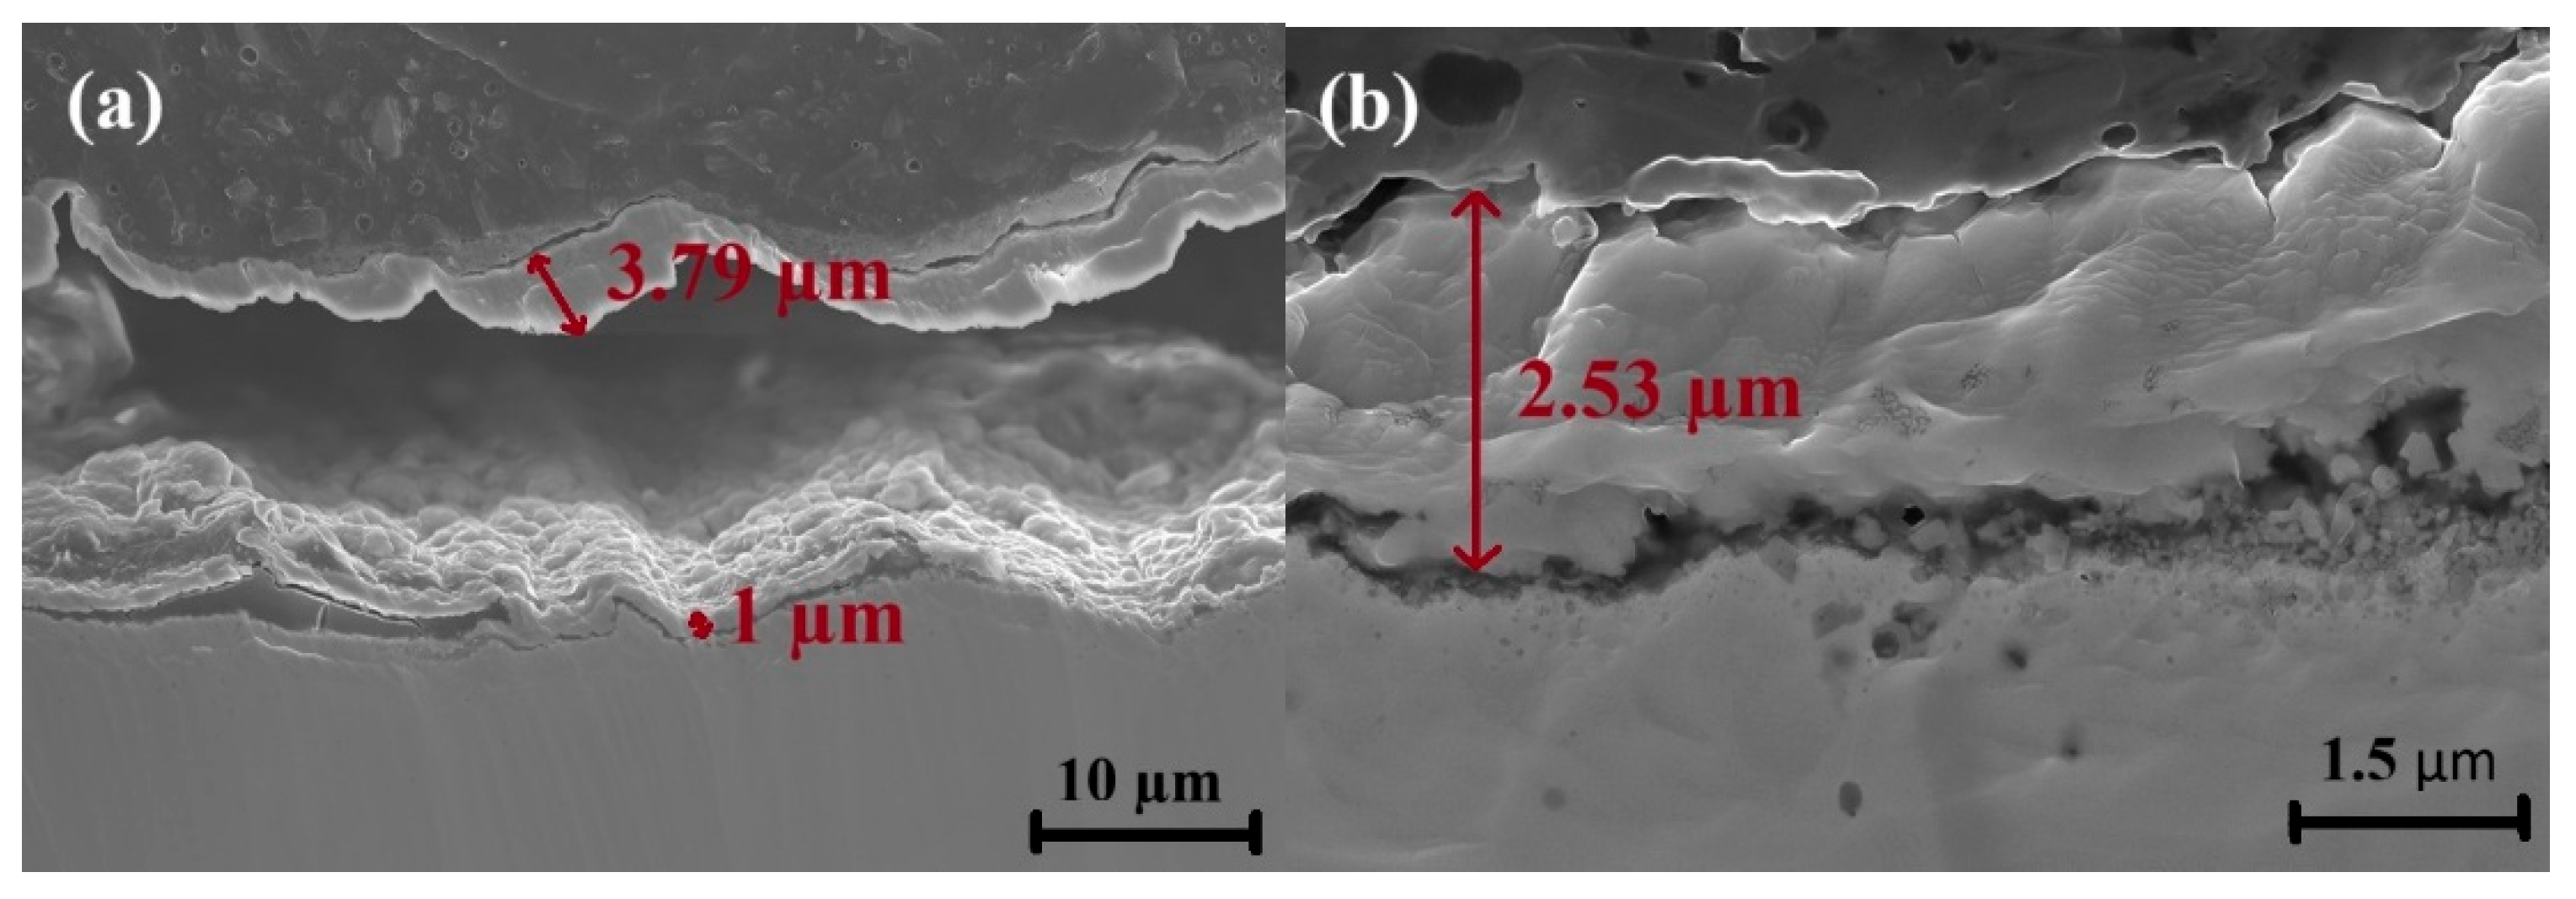
Figure 17 compares surface oxidation 1 mm from the fusion line under 5000 ppm O2 for the two buffing conditions. The 40-grit (B1) sample exhibits a significantly thicker oxide (~4.19 ± 0.40 µm), consistent with its rougher surface and higher density of high-energy sites that promote oxidation. Conversely, the 60-grit (B2) sample develops a thinner oxide (~ 2.43 ± 0.23 µm), reflecting a more uniform element distribution and fewer preferential oxidation sites. Lower misorientation and reduced grain boundary density in B2 restricted oxidation, producing a thinner, more homogeneous oxide []. Ji et al. [] similarly reported that higher roughness in 304 SS promotes thicker, porous oxides, whereas polished surfaces yield thinner, compact films.
Figure 17.
SEM images of surface oxidation at 1 mm from the fusion line under 5000 ppm oxygen condition with different buffing conditions: (a) B1, (b) B2.
Previous studies have further clarified how grain size influences corrosion behavior. Zhao et al. [] found that reducing austenite grain size in metastable stainless steel enhances corrosion resistance by lowering corrosion current density and increasing polarization resistance. Similarly, Fattah-alhosseini et al. [] found that finer-grained AISI 430 stainless steel exhibited lower polarization resistance due to higher point defect density in the passive film, affecting its passivation stability. Additionally, studies by Balusamy et al. [] and Wang et al. [] highlighted that surface nano-crystallization can either enhance or deteriorate corrosion resistance, depending on the microstructural changes induced by grain refinement. In 316L, surface mechanical attrition treatment (SMAT) initially reduces corrosion resistance due to defect introduction but improves stability after annealing []. Moreover, Wang et al. [] reviewed the general influence of grain refinement on pitting corrosion and found that increasing grain boundary density can facilitate passive film formation, thereby improving resistance to localized attack. However, in certain cases, grain refinement increases the number of active sites for localized dissolution, making the material more susceptible to pitting corrosion under aggressive conditions []. These findings highlight the complex interplay between grain structure, passive film stability, and localized corrosion resistance.
3.4. EIS Analysis
The EIS results, represented in Nyquist (Figure 18a), Bode (Figure 18c), and phase angle (Figure 18d) plots, combined with the equivalent circuit fitting parameters, offer important insights into how surface roughness and oxygen concentration influence the corrosion resistance of welded AISI 316L stainless steel. (Figure 18, Table 4). The equivalent circuit used for fitting the EIS data is based on similar models reported previously in the literature [] and includes the following parameters, as shown in Figure 18b: Rs (solution resistance) represents the resistance of the electrolyte solution. Rct1 and Rct2 (Charge Transfer Resistance) represent the resistance to charge transfer at the electrode/electrolyte interface. In the present study, Rct1 corresponds to the initial oxidation process, while Rct2 is linked to the behavior after the oxide layer has formed. The CPE (Constant Phase Element) models non-ideal capacitance behavior resulting from surface roughness, heterogeneity, or defects in the oxide layer, and α is the exponent in CPE.
Figure 18.
(a) Nyquist plots (B1 and B2); (b) equivalent circuit used for fits; (c) Bode magnitude; (d) phase angle vs. frequency.
Table 4.
Fitted EIS parameters for (B1) and (B2) samples at 500 ppm and 5000 ppm oxygen concentrations.
The Nyquist plots indicate that the 40-grit condition (B1) exhibits larger semicircles than B2 at both oxygen levels, indicating higher interfacial resistances. Quantitatively, Rct1 decreases from 1195.47 ± 318.18 Ω (500B1) to 534.51 ± 150.97 Ω (500B2); and from 999.49 ± 98.55 Ω (5000B1) to 344.81 ± 34.25 Ω (5000B2). Thus, the rougher surface develops a more resistive interfacial layer—consistent with the thicker oxides observed in Figure 17.
The Bode impedance magnitude plots and phase angle plots further support the Nyquist plot observations. The impedance magnitude for 40-grit (B1) is consistently higher than that for 60-grit (B2) across the frequency range, especially at 500 ppm. The higher impedance reflects better barrier properties in B1 samples. The phase angle plots reveal that B1 samples maintain a higher phase angle at intermediate frequencies compared to B2. At 5000 ppm oxygen, the impedance magnitude and phase angle drop for both B1 and B2 samples, but B1 still exhibits better performance. This reduction in performance at higher oxygen levels was attributed to the formation of porous and less protective oxide layers, which are less effective at preventing corrosion.
As shown in Table 4, CPE1 values increase with both increasing oxygen content and decreasing surface roughness. For instance, CPE1 for 500B1 is 236.35 ± 38.84 μs°/Ω and increases to 563.2 ± 151.25 μs°/Ω in 500B2, and to 692.58 ± 136.83 μs°/Ω in 5000B2. The corresponding α values slightly decrease, from 0.86 ± 0.01 in 500B1 to 0.83 ± 0.06 in 5000B2, indicating more non-ideal capacitive behavior and higher surface heterogeneity in smoother or more oxidized samples. CPE2 also increases significantly with oxygen content, particularly in B1 samples—from 2962.53 ± 479.05 μs°/Ω at 500 ppm to 7427.93 ± 56.7 μs°/Ω at 5000 ppm—confirming that the oxide layers formed at higher oxygen levels are more porous and less protective. This is consistent with the reduction in both Rct1 and Rct2 values under these conditions. An effective way to assess corrosion resistance is through the analysis of polarization resistance. This parameter, which is the sum of charge transfer resistances (Rtotal = Rct1 + Rct2), serves as an indicator of a material’s ability to withstand corrosive environments—with higher values reflecting enhanced resistance to corrosion []. Among the samples, 500B1 (1202.04 Ω) exhibits the highest total resistance (Rtotal), while 5000B2 (348.12 Ω) shows the lowest.
As shown in Figure 18c,d, higher oxygen content (5000 ppm) reduces corrosion resistance for both buffing conditions. This is evident in the reduced Rct2 values, lower impedance magnitudes, and lower phase angles. This behavior could be related to the formation of more porous oxide layers with increasing oxygen levels, as reported in the literature [,]. The porous layer reduces the protective properties of the surface, leading to increased susceptibility to corrosion.
3.5. Analysis of the Pitting Corrosion
Figure 19 and Table 5 present the cyclic polarization curves and key parameters for samples prepared with 40-grit (B1) and 60-grit (B2) buffing at oxygen concentrations of 500 ppm and 5000 ppm. These results are analyzed in conjunction with the EIS data to provide a more comprehensive understanding of how pitting corrosion resistance varies with surface roughness and oxygen level.

Figure 19.
Cyclic polarization curves for different surface roughness levels with two oxygen contents in the backing gas: (a) 500 ppm, (b) 5000 ppm.
Table 5.
Corrosion parameters from cyclic polarization curve of 316L SS with varying oxygen content and surface roughness.
At 500 ppm oxygen, the pitting current density for B1 is 234 ± 16 μA, which is slightly lower than 253 ± 55 μA for B2 with the same pitting potential (0.48 V). This suggests that B1 samples, with a rougher surface, exhibit better initial resistance to pit initiation. However, when considering repassivation behavior, the 60-grit B2 samples show superior performance. The repassivation current density for B2 is 429 ± 11 μA, significantly higher than 379 ± 1 μA for B1, indicating better recovery from localized corrosion events in B2. The hysteresis loop area for B2 (1.15 A. V) is also smaller than that of B1 (1.26 A. V), indicating lower energy loss during pit repassivation and more stable pit recovery.
At 5000 ppm oxygen, the B1 samples exhibit ipitt 251 μA, which is lower than 409 ± 37 μA for B2, while B2 has 0.53 ± 0.02 V pitting potential, which is higher than 0.50 V for B1, indicating better resistance to pit initiation for B1. However, the repassivation behavior remains superior for B2. The repassivation current density for B2 is 748 ± 71 μA, higher than that for B1 (483 μA). The hysteresis loop area for B2 (1.12 A. V) is smaller than that of B1 (1.33 A. V), indicating better pit recovery and overall stability for B2.
These results reveal a distinct contrast between the initiation and propagation stages of pitting corrosion. While B1 samples demonstrate better resistance to pit initiation (lower ) due to their thicker oxide layers and higher grain boundary density, which act as an initial barrier against pit formation, they are more prone to pit propagation and exhibit poorer repassivation performance. This difference stems from the Cr and Mn depletion along grain boundaries in B1, as evidenced by EBSD and elemental mapping results. Grain boundaries are high-energy zones with increased atomic diffusivity, making them more reactive during oxidation. During welding, elements such as Cr and Mn, which have a strong affinity for oxygen, migrate toward these boundaries and form oxides (Cr2O3 and MnO) []. Consequently, adjacent matrix regions become depleted in these elements, creating weakened areas that facilitate pit propagation once corrosion initiates.
On the other hand, B2 samples, with smoother surfaces, have fewer grain boundaries near the surface. This results in a more stable passive film and better repassivation capabilities, as reflected in the smaller hysteresis loop area and lower irepassive. The smoother surface of B2 facilitates more effective repassivation, reducing the likelihood of pit growth.
The superior pitting corrosion resistance of the 500 ppm samples compared to the 5000 ppm samples can be clearly observed from the polarization curves. The 500 ppm samples exhibit a lower pitting current density and a more positive pitting potential, indicating that higher energy is required for pit initiation and propagation. These features are indicative of a more stable passive layer, providing better protection against localized corrosion.
Conversely, the 5000 ppm samples exhibit elevated pitting current density, which is linked to the formation of a porous oxide layer. This porous structure facilitates the ingress of chloride ions into the substrate, thereby increasing susceptibility to localized corrosion. The porous nature of the oxide layer disrupts the uniformity and stability of the passive film, leading to easier pit initiation and faster propagation of localized corrosion.
The correlation with EIS results further supports these interpretations. The higher overall impedance measured for B1 reflects its thicker, more resistive oxide layer formed on the rougher surface. However, the cyclic polarization data show that despite higher impedance, localized corrosion resistance is superior in B2, which repassivates more efficiently once pits form. Therefore, while rougher surfaces (B1) provide stronger initial resistance to pit initiation, smoother surfaces (B2) demonstrate better repassivation and long-term stability against localized corrosion.
Finally, since the oxide layer was intentionally preserved during corrosion testing, the exact pit locations and propagation features could not be directly observed. The discoloration layer served as a protective oxide, preventing direct visualization of pit initiation and growth, and thus the corrosion behavior was evaluated indirectly through electrochemical analysis.
Following the comprehensive EIS analysis in Section 3.4, which revealed clear differences across roughness and oxygen content, Section 3.5 examines corrosion behavior via cyclic polarization. With the oxide left intact, surface finish affects corrosion differently at initiation versus growth: EIS shows the smoother surface B2 (60-grit) has lower Rct and thus lower resistance to pit initiation, while the rougher B1 (40-grit) exhibits higher barrier properties. In contrast, the polarization data confirms that the smoother B2 limits pit growth and more readily repassivates smaller hysteresis, whereas the rougher B1 permits deeper propagation once initiation occurs.
4. Conclusions
In the present work, an investigation was conducted on the combined effects of surface roughness and oxygen content in the purging gas on the pitting corrosion resistance of AISI 316L stainless steel welds without removing the oxides. The results provide important insights into the role of oxide layer characteristics and surface morphology in influencing the material’s corrosion behavior. The key findings are summarized as follows:
- Surface buffing significantly affected the misorientation of grains and recrystallization after welding. Higher misorientation levels were observed for the rougher surface, while the smoother surface exhibited a more uniform misorientation with lower values.
- Chromium (Cr) and manganese (Mn) depleted zones were revealed along the grain boundaries. The Cr-Mn oxide layer was thicker on the rougher surface. This thicker oxide layer offers initial resistance to corrosion.
- Surface roughness significantly affects corrosion resistance, with smoother surfaces exhibiting lower pitting corrosion resistance compared to rougher surfaces. However, smoother surfaces demonstrated better pitting propagation resistance. The findings are explained in terms of the smoother surface’s lower grain boundary density, which helps prevent initiation of localized corrosion, though it does not prevent the development of deeper pits once they have formed.
The oxygen content in the purging gas strongly influences the oxide layer properties and corrosion resistance. Samples welded with 500 ppm oxygen demonstrated superior pitting resistance compared to those welded with 5000 ppm oxygen. In samples welded with 5000 ppm oxygen, reduced pitting corrosion resistance was observed due to the porous oxide structure and increased oxidation in surface defects, such as micro-holes formed during metal forming. These defects act as pathways for aggressive ions, promoting localized corrosion and pit propagation.
The findings of the present work suggest that optimizing oxygen content and surface preparation techniques are essential for improving the discoloration severity and corrosion resistance of welded joints in industrial applications. Future work will map intermediate purge-gas oxygen content between 500 and 5000 ppm.
Industrial perspective: For inner-surface welds where discoloration remains, keep purge oxygen ≤ 500 ppm to limit porous oxides and preserve pitting resistance. Smoother preparation where repassivation matters is preferred—a rougher surface can raise initiation resistance but tends to favor faster pit growth.
Author Contributions
Conceptualization, M.M., I.R. and M.J.; methodology, M.M., A.K. and M.J.; software, M.M.; formal analysis, M.J.; investigation, M.M. and A.K.; resources, M.M. and I.R.; writing—original draft preparation, M.M.; writing—review and editing, M.M., A.K. and M.J.; visualization, M.M.; supervision, A.K., I.R. and M.J. All authors have read and agreed to the published version of the manuscript.
Funding
This research was funded by the Natural Sciences and Engineering Research Council of Canada (NSERC) under Grant Number CRD 542299-19.
Data Availability Statement
All data supporting the findings of this study are included within the article.
Acknowledgments
The authors sincerely thank PCL Construction for their significant support and material provision, which greatly facilitated the success of this study. Appreciation is extended to Mohammad Saadati for his expert guidance and assistance with electron microscopy analyses. The authors also extend their gratitude to Alireza Tirehkar for his valuable assistance in generating the MATLAB code used in this study and to Hamza Sofiane for his support with the Hotstage microscope experiments. This research was made possible through the collaboration with PCL Construction, based in Edmonton, Alberta, Canada, and financial support from the Natural Sciences and Engineering Research Council of Canada (NSERC) under Grant Number CRD 542299-19.
Conflicts of Interest
Author Iulian Radu is employed by PCL Industrial Constructor Inc. The remaining authors declare that the research was conducted in the absence of any commercial or financial relationships that could be construed as a potential conflict of interest.
References
- Gao, Z.; Wang, R.; Li, J.; Xu, L.; Qiao, L. Effect of cold rolling on the pitting corrosion of 316L and 304 austenitic stainless steels. J. Mater. Sci. 2022, 57, 20503–20520. [Google Scholar] [CrossRef]
- Bedoya-Zapata, Á.D.; Franco-Rendón, C.M.; León-Henao, H.; Santa, J.F.; Barrada, J.E.G. Failure analysis of a welded stainless-steel piping system with premature pitting. Eng. Fail. Anal. 2021, 119, 104986. [Google Scholar] [CrossRef]
- Maroufkhani, M.; Khodabandeh, A.; Radu, I.; Moosavi-Khoonsari, E.; Jahazi, M. Thermodynamic and kinetic analyses of high temperature oxidation of 316L stainless steel. Results Mater. 2025, 28, 100774. [Google Scholar] [CrossRef]
- Maroufkhani, M.; Hakimian, S.; Khodabandeh, A.; Radu, I.; Hof, L.A.; Jahazi, M. Influence of oxygen content in the protective gas on pitting corrosion resistance of a 316l stainless steel weld joint. Materials 2023, 16, 5968. [Google Scholar] [CrossRef] [PubMed]
- Aumpiem, A.; Prateepasen, A. The relation of oxygen value, heat tint and pitting corrosion in super duplex pipe. In Proceedings of the 3rd International Conference on Mechanical and Production Engineering, Pattaya, Thailand, 14–15 January 2017; ISBN 9788193137390. [Google Scholar]
- Garcia, J.H.N.; Santos, N.F.d.; Esteves, L.; Campos, W.R.d.C.; Rabelo, E.G. Corrosion behavior of 316L and alloy 182 dissimilar weld joint with post-weld heat treatment. Matéria 2019, 24, e12471. [Google Scholar] [CrossRef]
- Zhang, H.; Xue, P.; Wang, D.; Wu, L.; Ni, D.; Xiao, B.; Ma, Z. Effect of heat-input on pitting corrosion behavior of friction stir welded high nitrogen stainless steel. J. Mater. Sci. Technol. 2019, 35, 1278–1283. [Google Scholar] [CrossRef]
- Li, M.; Zou, D.; Li, Y.; Tong, L. Effect of cooling rate on pitting corrosion behavior of 904L austenitic stainless steel in a simulated flue gas desulfurization solution. Met. Mater. Int. 2023, 29, 730–747. [Google Scholar] [CrossRef]
- Ezuber, H.; Alshater, A.; Nisar, S.; Gonsalvez, A.; Aslam, S. Effect of surface finish on the pitting corrosion behavior of sensitized AISI 304 austenitic stainless steel alloys in 3.5% NaCl solutions. Surf. Eng. Appl. Electrochem. 2018, 54, 73–80. [Google Scholar] [CrossRef]
- Liu, X.; Zhang, H.; Tong, H.; Sui, Y.; Li, X.; Hou, J. Effect of Surface Roughness on the Corrosion Behavior of 304 Stainless Steel in Seawater. J. Mater. Eng. Perform. 2024, 34, 18287–18297. [Google Scholar] [CrossRef]
- Kim, B.; Lee, C.; Kim, J.; Lee, J. Corrosion Assessment and Quantification of Discoloration in the Weld Root Bead and Heat-Affected Zone of Stainless Steel Pipe Weldments. In Proceedings of the ISOPE International Ocean and Polar Engineering Conference, Rhodes, Greece, 16–21 June 2024; ISOPE: Mountain View, CA, USA, 2024. [Google Scholar]
- Kimbrel, K. Determining Acceptable Levels of Weld Discoloration on Mechanically Polished and Electropolished Stainless Steel Surface. Pharm. Eng. 2011, 31, 1–7. [Google Scholar]
- Ling, L.; Liu, T.; Lu, Y.; Guo, P. Investigation of the oxides film on 304L base metal produced during welding process without inert gas shielding. Appl. Surf. Sci. 2019, 465, 780–786. [Google Scholar] [CrossRef]
- Bergquist, E.-L.; Huhtala, T.; Karlsson, L. The effect of purging gas on 308L TIG root pass ferrite content. Weld. World 2011, 55, 57–64. [Google Scholar] [CrossRef]
- Panmongkol, P.; Phung-on, I. Effect of backing gas mixtures on corrosion properties of stainless steel grade 304 weld metal by autogenous GTAW. J. Mater. Res. Technol. 2021, 11, 1559–1570. [Google Scholar] [CrossRef]
- Trigwell, S.; Selvaduray, G. Effects of welding on the passive oxide film of electropolished 316L stainless steel. J. Mater. Process. Technol. 2005, 166, 30–43. [Google Scholar] [CrossRef]
- Macleod, H.A.; Macleod, H.A. Thin-Film Optical Filters; CRC Press: Boca Raton, FL, USA, 2010. [Google Scholar] [CrossRef]
- Pedrotti, L.S. Basic physical optics. Fundam. Photonics 2008, 1, 152–154. [Google Scholar]
- Khafaji, N.Y.; Demir, A.G.; Vitali, L.; Fustinoni, D.; Niro, A.; Previtali, B.; Taha, Z.A. Optical characterization of laser coloured titanium under different processing atmospheres. Surf. Coat. Technol. 2017, 321, 156–163. [Google Scholar] [CrossRef]
- Avery, R.E. Sanitary Welding Standards. In Proceedings of the ASME Citrus Engineering Symposium, Lake Alfred, FL, USA, 23 March 2000; American Society of Mechanical Engineers: New York, NY, USA, 2000. [Google Scholar] [CrossRef]
- Hong, T.; Nagumo, M. Effect of surface roughness on early stages of pitting corrosion of type 301 stainless steel. Corros. Sci. 1997, 39, 1665–1672. [Google Scholar] [CrossRef]
- Nowak, W.J. Effect of surface roughness on oxidation resistance of stainless steel AISI 316Ti during exposure at high temperature. J. Mater. Eng. Perform. 2020, 29, 8060–8069. [Google Scholar] [CrossRef]
- Wang, J.; Xue, H.; Zhao, Y.; Zhang, T.; Wang, F. Effect of Surface Roughness on the Corrosion of HP-13Cr Stainless Steel in the Dynamic Aggressive Oilfield Environment. Metals 2024, 14, 280. [Google Scholar] [CrossRef]
- Jaffré, K.; Ter-Ovanessian, B.; Abe, H.; Mary, N.; Normand, B.; Watanabe, Y. Effect of mechanical surface treatments on the surface state and passive behavior of 304L stainless steel. Metals 2021, 11, 135. [Google Scholar] [CrossRef]
- Zhang, S.; Jia, M.; Wang, W.; Hou, J.; Kuang, W. The effects of heat treatment and surface state on the corrosion resistance of laser powder bed fusion 304L stainless steel in 3.5 wt% NaCl solution. J. Mater. Res. Technol. 2024, 29, 5620–5632. [Google Scholar] [CrossRef]
- Guo, P.; Zhang, P.; Zhang, J.; Yue, F.; Nie, X.; Chi, R.; Fu, M. Influence of Surface Roughness on the Corrosion Behavior of ENiCrFe-7 Weld Overlay Cladding Materials. J. Mater. Eng. Perform. 2025, 1–9. [Google Scholar] [CrossRef]
- Messinese, E.; Casanova, L.; Paterlini, L.; Capelli, F.; Bolzoni, F.; Ormellese, M.; Brenna, A. A Comprehensive Investigation on the Effects of Surface Finishing on the Resistance of Stainless Steel to Localized Corrosion. Metals 2022, 12, 1751. [Google Scholar] [CrossRef]
- Tang, Y.; Dai, N.; Wu, J.; Jiang, Y.; Li, J. Effect of surface roughness on pitting corrosion of 2205 duplex stainless steel investigated by electrochemical noise measurements. Materials 2019, 12, 738. [Google Scholar] [CrossRef] [PubMed]
- Salah-Rousset, N.B.; Chaouachi, M.; Chellouf, A. Role of surface finishing on pitting corrosion of a duplex stainless steel in seawater. J. Mater. Eng. Perform. 1996, 5, 225–231. [Google Scholar] [CrossRef]
- Tang, Y.; Dai, N.; Wu, J.; Jiang, Y.; Li, J. Investigation of influence of surface roughness on pitting corrosion of duplex stainless steel 2205 using various electrochemical techniques. Int. J. Electrochem. Sci. 2019, 14, 6790–6813. [Google Scholar] [CrossRef]
- Zhao, M.; Wu, H.; Lu, J.; Sun, G.; Du, L. Effect of grain size on mechanical property and corrosion behavior of a metastable austenitic stainless steel. Mater. Charact. 2022, 194, 112360. [Google Scholar] [CrossRef]
- Balusamy, T.; Kumar, S.; Narayanan, T.S. Effect of surface nanocrystallization on the corrosion behaviour of AISI 409 stainless steel. Corros. Sci. 2010, 52, 3826–3834. [Google Scholar] [CrossRef]
- Wang, S.; Sun, M.; Xu, Y.; Long, K.; Zhang, Z. Enhanced localized and uniform corrosion resistances of bulk nanocrystalline 304 stainless steel in high-concentration hydrochloric acid solutions at room temperature. J. Mater. Sci. Technol. 2018, 34, 2498–2506. [Google Scholar] [CrossRef]
- Hao, Y.-W.; Deng, B.; Zhong, C.; Jiang, Y.-M.; Li, J. Effect of surface mechanical attrition treatment on corrosion behavior of 316 stainless steel. J. Iron Steel Res. Int. 2009, 16, 68–72. [Google Scholar] [CrossRef]
- Wang, P.-j.; Ma, L.-w.; Cheng, X.-q.; Li, X.-g. Influence of grain refinement on the corrosion behavior of metallic materials: A review. Int. J. Miner. Metall. Mater. 2021, 28, 1112–1126. [Google Scholar] [CrossRef]
- Aghuy, A.A.; Zakeri, M.; Moayed, M.H.; Mazinani, M. Effect of grain size on pitting corrosion of 304L austenitic stainless steel. Corros. Sci. 2015, 94, 368–376. [Google Scholar] [CrossRef]
- ASTM G5-13; Standard Reference Test Method for Making Potentiodynamic Anodic Polarization Measurements. ASTM International: West Conshohocken, PA, USA, 2013.
- Loto, R.T. Study of the corrosion behaviour of S32101 duplex and 410 martensitic stainless steel for application in oil refinery distillation systems. J. Mater. Res. Technol. 2017, 6, 203–212. [Google Scholar] [CrossRef]
- Azuma, S.; Kudo, T.; Miyuki, H.; Yamashita, M.; Uchida, H. Effect of nickel alloying on crevice corrosion resistance of stainless steels. Corros. Sci. 2004, 46, 2265–2280. [Google Scholar] [CrossRef]
- Sanni, O.; Popoola, A. Corrosion inhibition effect of a non-toxic waste compound on stainless steel in 0.5 molar concentration of sulfuric acid. J. Bio-Tribo-Corros. 2021, 7, 88. [Google Scholar] [CrossRef]
- Bellezze, T.; Giuliani, G.; Roventi, G. Study of stainless steels corrosion in a strong acid mixture. Part 1: Cyclic potentiodynamic polarization curves examined by means of an analytical method. Corros. Sci. 2018, 130, 113–125. [Google Scholar] [CrossRef]
- Miranda-Pérez, A.F.; Rodríguez-Vargas, B.R.; Calliari, I.; Pezzato, L. Corrosion resistance of GMAW duplex stainless steels welds. Materials 2023, 16, 1847. [Google Scholar] [CrossRef]
- Lippold, J.C. Welding Metallurgy and Weldability; John Wiley & Sons: Hoboken, NJ, USA, 2014. [Google Scholar]
- Huang, X.; Xiao, K.; Fang, X.; Xiong, Z.; Wei, L.; Zhu, P.; Li, X. Oxidation behavior of 316L austenitic stainless steel in high temperature air with long-term exposure. Mater. Res. Express 2020, 7, 066517. [Google Scholar] [CrossRef]
- Xie, B.; Sun, M.; Xu, B.; Wang, C.; Jiang, H.; Li, D.; Li, Y. Oxidation of stainless steel in vacuum and evolution of surface oxide scales during hot-compression bonding. Corros. Sci. 2019, 147, 41–52. [Google Scholar] [CrossRef]
- Habib, K.; Damra, M.; Saura, J.; Cervera, I.; Bellés, J. Breakdown and Evolution of the Protective Oxide Scales of AISI 304 and AISI 316 Stainless Steels under High-Temperature Oxidation. Int. J. Corros. 2011, 2011, 824676. [Google Scholar] [CrossRef]
- Balaško, T.; Batič, B.Š.; Burja, J. Influence of the Cooling Rate on the Wüstite Content in Oxide Layers Formed During High-Temperature Oxidation of Hot-Worked Tool Steel with High Thermal Conductivity. High Temp. Corros. Mater. 2025, 102, 2. [Google Scholar] [CrossRef]
- Zhao, G.; Tian, Y.; Li, H.; Ma, L.; Li, Y.; Li, J. Microstructure evolution and dynamic recrystallization mechanisms of 316L stainless steel during hot deformation. Arch. Civ. Mech. Eng. 2024, 24, 35. [Google Scholar] [CrossRef]
- Celik, S.; Ersozlu, I. Dynamic recrystallization of friction welded AISI 316 stainless steel joints. Mater. Test. 2020, 62, 1126–1130. [Google Scholar] [CrossRef]
- Pinto, F.C.; Aota, L.S.; Souza Filho, I.R.d.; Raabe, D.; Sandim, H.R.Z. Recrystallization in non-conventional microstructures of 316L stainless steel produced via laser powder-bed fusion: Effect of particle coarsening kinetics. J. Mater. Sci. 2022, 57, 9576–9598. [Google Scholar] [CrossRef]
- Xiao, Y.; Wang, C.; Zhang, Y.; Liu, X.; Qin, C.; Wang, Z.; Lin, X.; Wang, J.; Wang, L.; He, F. Recovery-Assisted Abnormal Grain Evolution of Selective Laser-Melted 316L Stainless Steel at Intermediate Temperatures. Metall. Mater. Trans. A 2024, 55, 4613–4622. [Google Scholar] [CrossRef]
- Gao, S.; Hu, Z.; Duchamp, M.; Krishnan, P.S.R.; Tekumalla, S.; Song, X.; Seita, M. Recrystallization-based grain boundary engineering of 316L stainless steel produced via selective laser melting. Acta Mater. 2020, 200, 366–377. [Google Scholar] [CrossRef]
- Humphreys, F.J.; Hatherly, M. Recrystallization and Related Annealing Phenomena; Elsevier: Amsterdam, The Netherlands, 2012. [Google Scholar]
- Wei, L.; Wang, Y.; Misra, R.; Chen, J. Understanding the high-temperature oxidation resistance of heat-resistant austenitic stainless steel with gradient nanostructure. Corros. Sci. 2024, 231, 111966. [Google Scholar] [CrossRef]
- Hart, E. On the role of dislocations in bulk diffusion. Acta Metall. 1957, 5, 597. [Google Scholar] [CrossRef]
- Sabioni, A.C.S.; Ramos, R.P.B.; Ji, V.; Jomard, F.; Macedo, W.A.d.A.; Gastelois, P.L.; Trindade, V.B. About the role of chromium and oxygen ion diffusion on the growth mechanism of oxidation films of the AISI 304 austenitic stainless steel. Oxid. Met. 2012, 78, 211–220. [Google Scholar] [CrossRef]
- Wang, S.; Li, X.; Wang, J.; Wang, W.; Xue, Z.; Lu, Y.; Huang, H. Influence of surface plastic deformation on oxidation behavior for low Cr content nickel superalloy: Focus on the Cr diffusion. Surf. Coat. Technol. 2024, 494, 131347. [Google Scholar] [CrossRef]
- Kim, J.-H.; Kim, B.K.; Kim, D.-I.; Choi, P.-P.; Raabe, D.; Yi, K.-W. The role of grain boundaries in the initial oxidation behavior of austenitic stainless steel containing alloyed Cu at 700 C for advanced thermal power plant applications. Corros. Sci. 2015, 96, 52–66. [Google Scholar] [CrossRef]
- Lobb, R.; Evans, H. Formation of protective oxide film on chromium-depleted stainless steel. Met. Sci. 1981, 15, 267–274. [Google Scholar] [CrossRef]
- Zhao, Y.; Chen, P.; Wen, W.; Deng, Y.; Peng, K.; Liu, Y. Effect of Mn content on the high-temperature oxidation behaviors of Mn-substituted-for-Ni alumina-forming austenitic stainless steel. J. Mater. Res. Technol. 2023, 26, 7816–7828. [Google Scholar] [CrossRef]
- Yamamoto, K.; Takayama, T.; Minamino, Y.; Koizumi, Y.; Tokunaga, T.; Hagihara, K. Modification of grain boundary microstructure by controlling dissolution behavior of θ particles in Cr-containing hypereutectoid steel. Mater. Charact. 2023, 205, 113241. [Google Scholar] [CrossRef]
- Feng, X.; Zhang, S.; Liu, P.; Kuang, W. The structure dependence of grain boundary passivation of Alloy 690 in high temperature water. Acta Mater. 2023, 261, 119368. [Google Scholar] [CrossRef]
- Chen, J.; Xie, X.; Zou, T.; Zhang, Y.; Wang, H.; Liang, Z. Improvement of the high-temperature oxidation resistance of 254SMo using ultrasonic strengthening grinding. J. Mater. Res. Technol. 2023, 27, 2052–2065. [Google Scholar] [CrossRef]
- Ji, Y.; Hao, L.; Wang, J.; Ke, W. EIS investigation on surface roughness induced oxide film evolution on 304 SS in simulated secondary circuit water of PWR system. J. Mater. Sci. 2025, 60, 5511–5532. [Google Scholar] [CrossRef]
- Fattah-Alhosseini, A.; Vafaeian, S. Influence of grain refinement on the electrochemical behavior of AISI 430 ferritic stainless steel in an alkaline solution. Appl. Surf. Sci. 2016, 360, 921–928. [Google Scholar] [CrossRef]
- Li, Z.; Mei, K.; Dong, J.; Yang, Y.; Sun, J.; Luo, Z. An investigation on the wear and corrosion resistance of AlCoCrFeNi high-entropy alloy coatings enhanced by Ti and Si. Surf. Coat. Technol. 2024, 487, 130949. [Google Scholar] [CrossRef]
- Hernández, H.H.; Reynoso, A.R.; González, J.T.; Morán, C.G.; Hernández, J.M.; Ruiz, A.M.; Hernández, J.M.; Cruz, R.O. Electrochemical impedance spectroscopy (EIS): A review study of basic aspects of the corrosion mechanism applied to steels. In Electrochemical Impedance Spectroscopy; IntechOpen: London, UK, 2020; pp. 137–144. [Google Scholar] [CrossRef]
Disclaimer/Publisher’s Note: The statements, opinions and data contained in all publications are solely those of the individual author(s) and contributor(s) and not of MDPI and/or the editor(s). MDPI and/or the editor(s) disclaim responsibility for any injury to people or property resulting from any ideas, methods, instructions or products referred to in the content. |
© 2025 by the authors. Licensee MDPI, Basel, Switzerland. This article is an open access article distributed under the terms and conditions of the Creative Commons Attribution (CC BY) license (https://creativecommons.org/licenses/by/4.0/).