1. Introduction
In engineering and manufacturing, the precision and quality of the properties of the material are fundamental to the performance of components and products [
1]. For example, the aluminum alloy AlSi10Mg is known for its combination of high strength and low weight, which makes it particularly attractive for additive manufacturing (AM), a process that fabricates parts layer by layer [
2,
3]. Although this methodology offers advantages such as geometric complexity and reduction in material waste, it faces the challenge of ensuring the internal integrity of materials, particularly with regard to pore formation [
4,
5].
Undesired porosity can negatively affect fundamental properties of the part, such as strength, thermal conductivity, and density, potentially leading to failure in demanding applications [
6,
7,
8,
9,
10]. To characterize porosity, and traditional methods such as apparent density measurements and micrographic section analysis have been developed; however, these approaches are limited in providing a detailed interpretation of the pore distribution [
11]. In this context, micro-computed tomography (µCT) has proven to be a highly valuable non-destructive technique, providing high-resolution three-dimensional images for the detailed exploration of a material’s internal structure.
Recent advances have highlighted that porosity characterization in laser powder bed fusion (L-PBF) requires a combination of conventional and advanced techniques. Classical methods such as the Archimedes principle and metallographic cross-sections have long been used due to their simplicity, but they present limitations in reproducibility and in capturing three-dimensional pore distributions [
12]. X-ray computed tomography (XCT), on the other hand, provides non-destructive 3D analysis, enabling detailed quantification of pore size, morphology, and spatial distribution, although at higher cost and complexity [
13]. More recent efforts have focused on standardization of porosity evaluation in AM through microCT, proposing reference cube samples and automated workflows to ensure comparability and repeatability across systems [
14,
15]. Complementary developments also include comparative studies analyzing gas pycnometry, Archimedes-based gravimetric methods, and micrograph analyses across different AM processes and materials, providing practical guidance on the suitability of each method for density and porosity determination [
16].Together, these studies establish the current state of the art in porosity characterization for L-PBF, highlighting both the strengths and limitations of destructive and non-destructive approaches.
The effectiveness of computed tomography in evaluating internal structures has been widely demonstrated in materials science, particularly for metals and alloys. Quantitative X-ray tomography has evolved from a qualitative diagnostic tool to a robust method for measuring porosity, defect morphology, and density variations in metallic systems, enabling the correlation between processing conditions and internal microstructure [
13]. This demonstrates the applicability of tomography not only in biomedical fields but also as a standard tool for non-destructive evaluation of additively manufactured metals.
In addition, digital image processing techniques provide effective tools for quantification [
17,
18] and analysis of porosity in image stacks generated by computed tomography [
19,
20]. Operations such as histogram normalization, segmentation, grayscale morphological reconstruction, and thresholding help to automatically isolate and measure pores, thus reducing subjectivity and increasing analysis efficiency [
4,
19,
21]. Studies in additive manufacturing indicate that the combination of CT and image processing allows the accurate identification of defects and their correlation with the mechanical properties of the material [
22,
23].
In this context, analyzing the porosity of an aluminum alloy such as AlSi10Mg using computed tomography and digital image processing algorithms becomes particularly relevant for the metalworking, aerospace, and automotive industries [
24]. Moreover, powder bed fusion (PBF)-based additive manufacturing enables the production of lightweight and complex components, although it requires strict control over parameters such as laser power, scan speed, and the quality of the metal powder [
25,
26,
27,
28]. A particularly insightful study focused on aluminum alloys fabricated via laser powder bed fusion (L-PBF). X-ray computed tomography (XCT) was employed to better understand the size, distribution, and morphology of defects within the samples. The results aligned with density measurements obtained through the Archimedes method, revealing that pure aluminum exhibits larger pores with a higher volume fraction. However, based on volume ratio calculations, the XCT findings suggest that the relative densities of the pure aluminum, AlSi12, and AlSi10Mg samples are 99.87%, 99.96%, and 99.95%, respectively [
29].
Accordingly, the present study aims to employ advanced digital image processing techniques and computed tomography to characterize porosity in the AlSi10Mg alloy. The primary objective is to develop methods for pore identification and quantification, and to compare the results with conventional density measurements. Previous studies have successfully combined XCT and image processing for porosity analysis in metallic alloys; however, segmentation strategies often ignore 3D connectivity information, leading to imprecise identification of small or interconnected pores. In contrast, our approach introduces a reproducible process that integrates histogram normalization, morphological reconstruction, and a 3D region-growing algorithm with 18-neighborhood connectivity, enabling a more accurate detection of pore morphology and continuity. This comprehensive approach-which integrates both quantitative and qualitative methods-is expected not only to provide greater accuracy but also to offer deeper insight into the relationship between internal microstructure and the mechanical performance of the alloy, while facilitating the analysis of complex additively manufactured geometries.
In summary, optimizing additive manufacturing of lightweight materials such as aluminum relies on a detailed understanding of internal phenomena such as pore formation and volumetric distribution. Through the application of computed tomography and digital image processing, quality control becomes more precise, efficient, and reliable-benefiting various industrial sectors and promoting interdisciplinary research to enhance both manufacturing and material characterization technologies [
24,
26,
30].
2. Materials and Methods
Three samples of the aluminum alloy (AlSi10Mg) were fabricated using a Concept Laser M2 Cusing Multilaser machine (Lichtenfels, Germany), employing Laser Powder Bed Fusion (L-PBF) technology. The processing parameters were: laser power of 200 W, scanning speed of 800 mm/s, laser spot size of 140 µm, and a Volumetric Energy Density (VED) of 89.28 J/mm
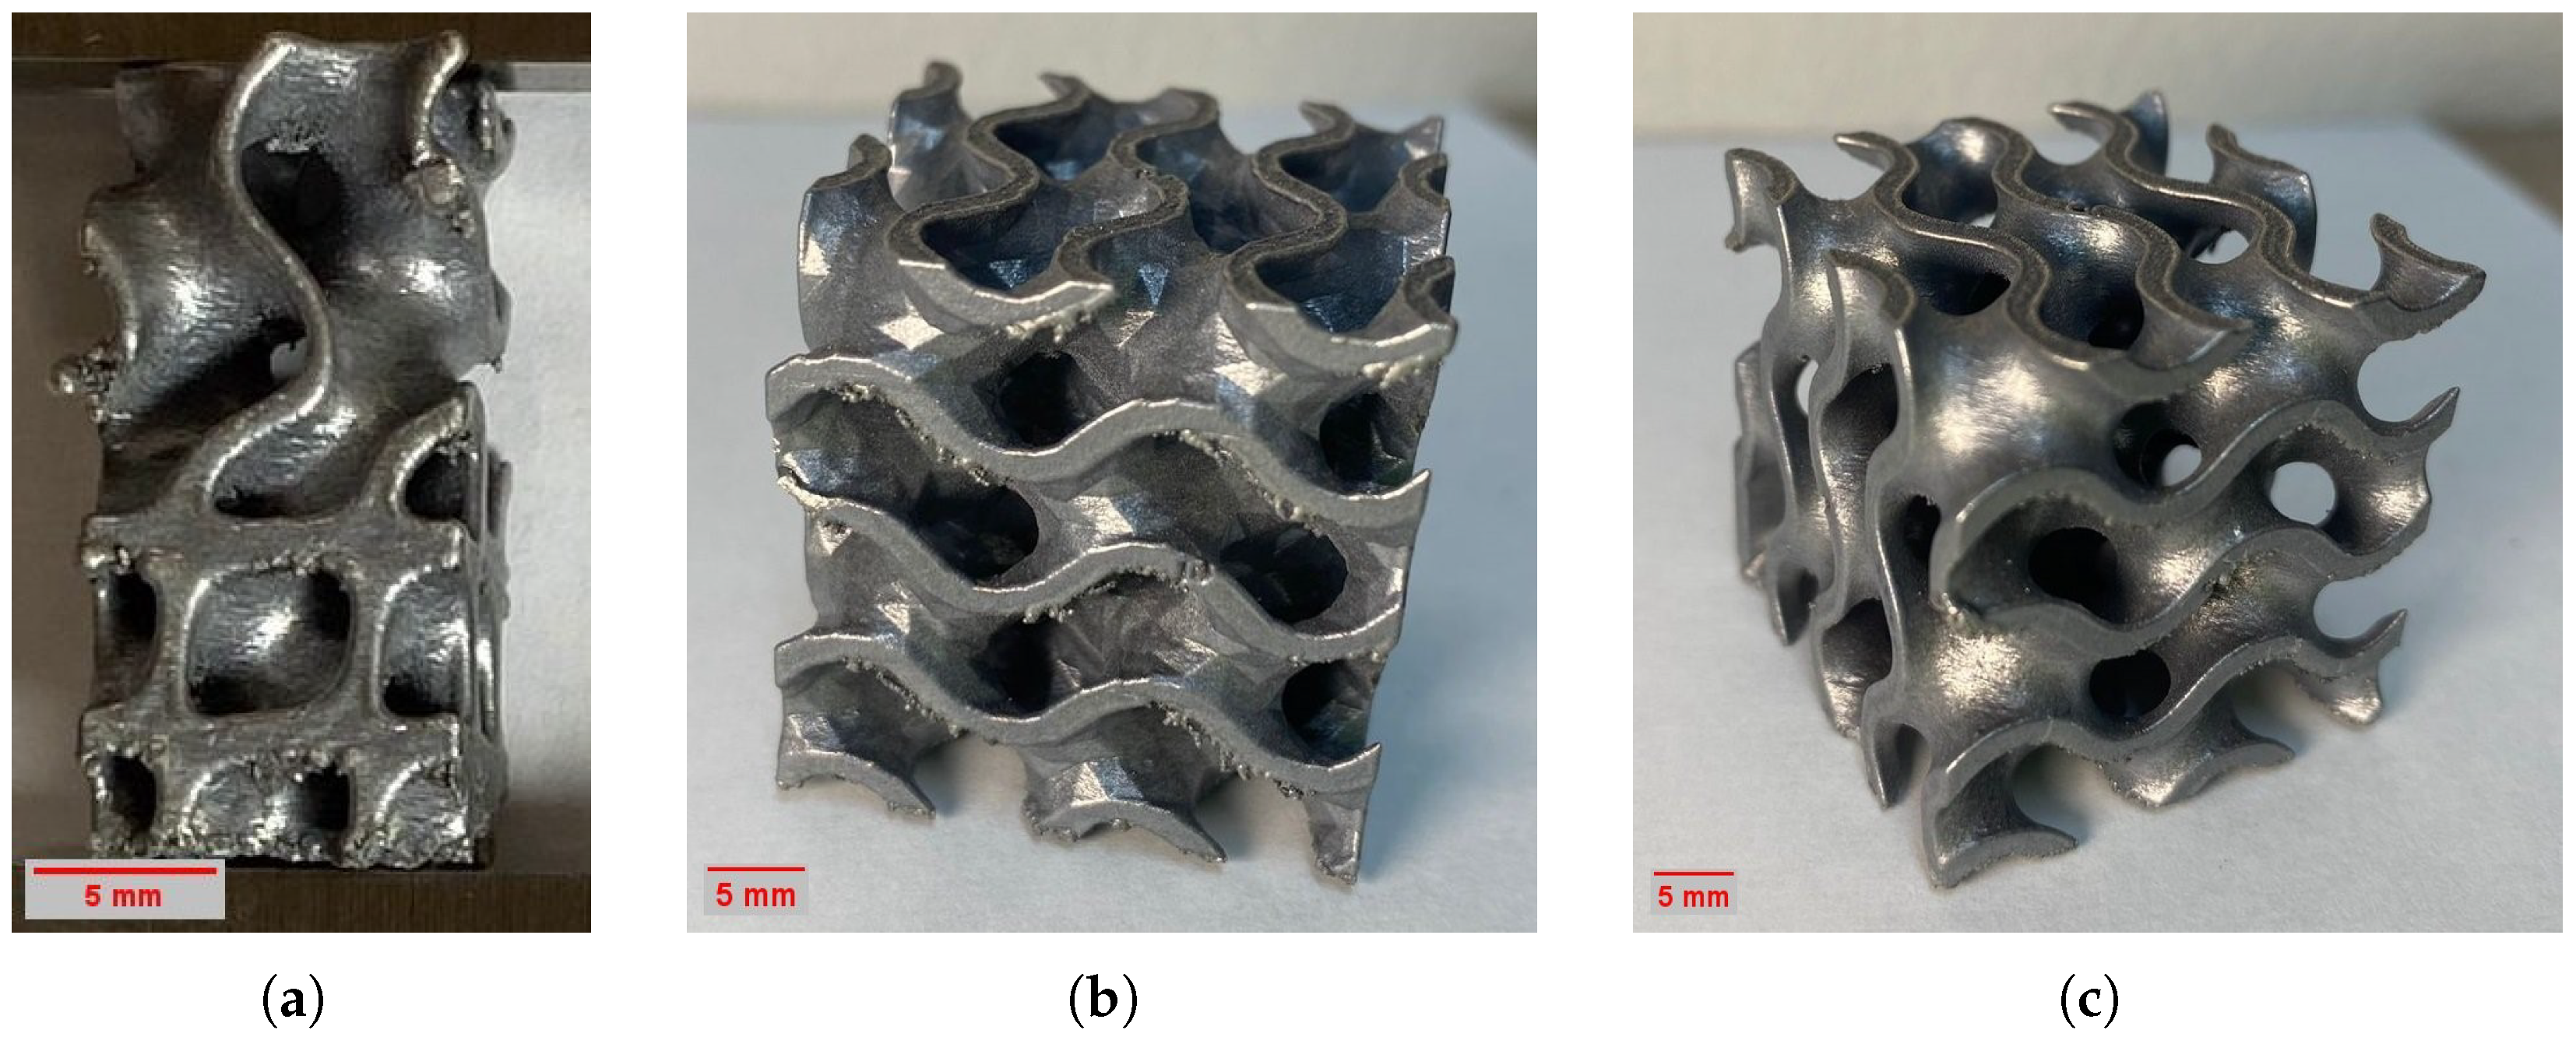
3. Among the fabricated samples, one corresponds to a hybrid gyroid-diamond structure, while the other two feature double gyroid with wall offset geometries. These configurations were evaluated based on their functional properties, highlighting their high mechanical strength combined with low weight, controlled permeability-which is particularly relevant for applications in bone implants and medical devices-as well as their high specific surface area, making them suitable for use in heat exchangers and catalytic materials. The printed samples are shown in
Figure 1.
Three image stacks of the printed samples were acquired using a GE Inspection Technologies Phoenix V TOMEX M 300/180 X-ray tomograph (Wunstorf, Germany). A total of 2352 images were obtained in DCM format with a 16-bit resolution. The acquisition parameters for each stack are detailed in
Table 1. The tube voltage was set to 200 kV, with a current of 180 µA and an exposure time of 250 ms per projection. Projections were acquired over a 360° rotation to minimize reconstruction artifacts and to ensure isotropic resolution. The reconstructed voxel size was 47 µm (laterally isotropic). This resolution was selected to achieve a balance between field of view and signal-to-noise ratio. This resolution was selected to balance field of view and signal-to-noise ratio, while ensuring that pores of interest were sampled by multiple voxels, following the rule of thumb that at least 3–5 voxels are required for reliable detection and ≥10 voxels for accurate quantification.
All projection images were corrected for detector dark current and flat-field response. Projections from stacks with different exposure parameters were scaled by the ratio of (current × exposure time) and calibrated using reference phantom scans to ensure a common CT-number scale. Overlapping regions (15%) between stacks were registered by cross-correlation and blended using histogram matching and linear feathering. Beam-hardening and ring-artifact corrections were applied prior to reconstruction, and final volumes were reconstructed using filtered backprojection with Parker weighting. The reconstructed volumes were further verified against the phantom to confirm uniformity and absence of stitching seams, while iterative reconstruction and denoising were applied when necessary to suppress residual artifacts.
Image processing was performed on a computer equipped with an 8th-generation Intel i5 processor (Santa Clara, CA, USA) and 12 GB of RAM, running the Windows 10 operating system. The open-source software ImageJ (version 1.53t) [
31] was used to apply the necessary algorithms. To facilitate processing, the images were initially converted to 8-bit format. Although 16-bit images offer greater color depth, they require significantly more storage space; converting them to 8-bit reduces file size considerably thereby simplifying storage and transfer when handling large datasets. Additionally, 8-bit images are processed more quickly, which is particularly advantageous when working with a high volume of images. While this conversion entails a certain degree of information loss, in this case the loss was not significant and was justified by the need to balance image quality with efficiency, accessibility, and practicality.
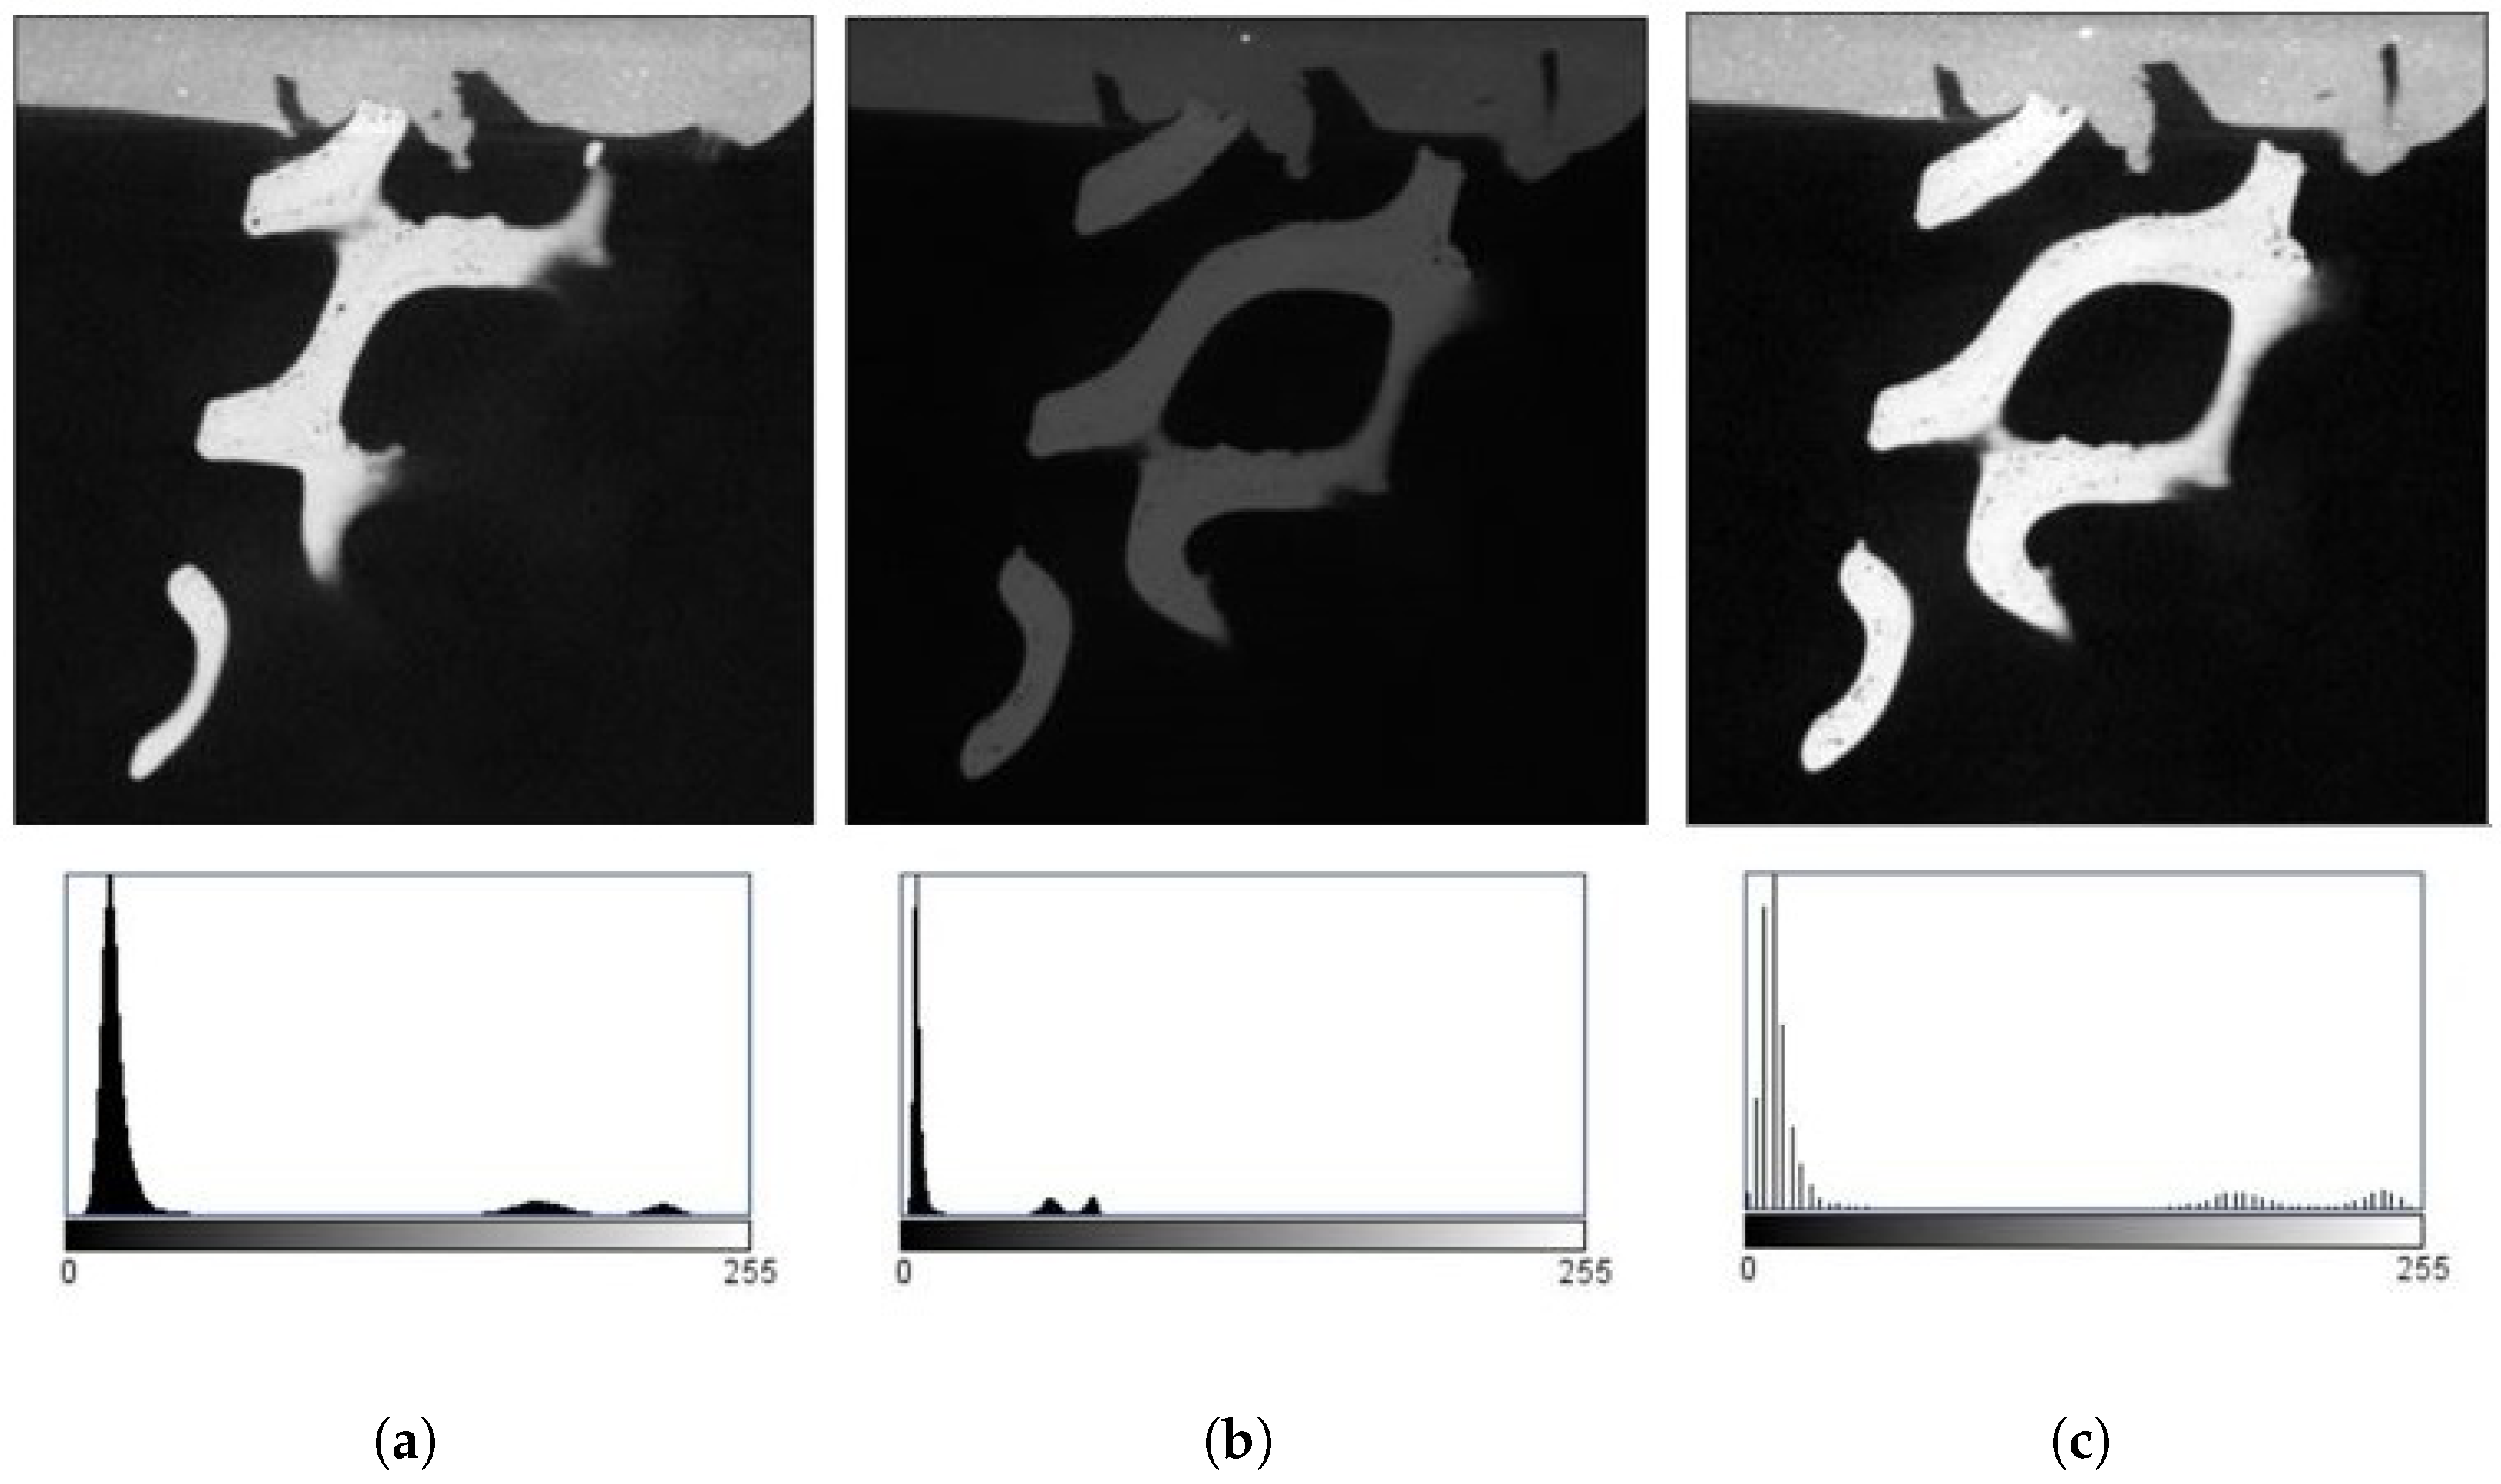
Due to the significant differences in the histogram shapes of some images in the stacks (See
Figure 2a,b), histogram normalization was performed to achieve a uniform distribution. This process improved both the contrast and the comparability among the images (See
Figure 2b,c).
Grayscale morphological reconstruction was employed as a crucial technique for identifying and refining pore structures in the tomographic images of the AlSi10Mg aluminum alloy. This technique is based on the concept of image reconstruction through iterative dilation using a geodesic structuring element [
32]. In this work, the implementation follows the approach developed by Forero et al. [
33], which adapts Vincent’s algorithm for its practical use within ImageJ through grayscale morphological operators. The primary objective is to enhance the definition of pore boundaries, enabling more precise detection and analysis.
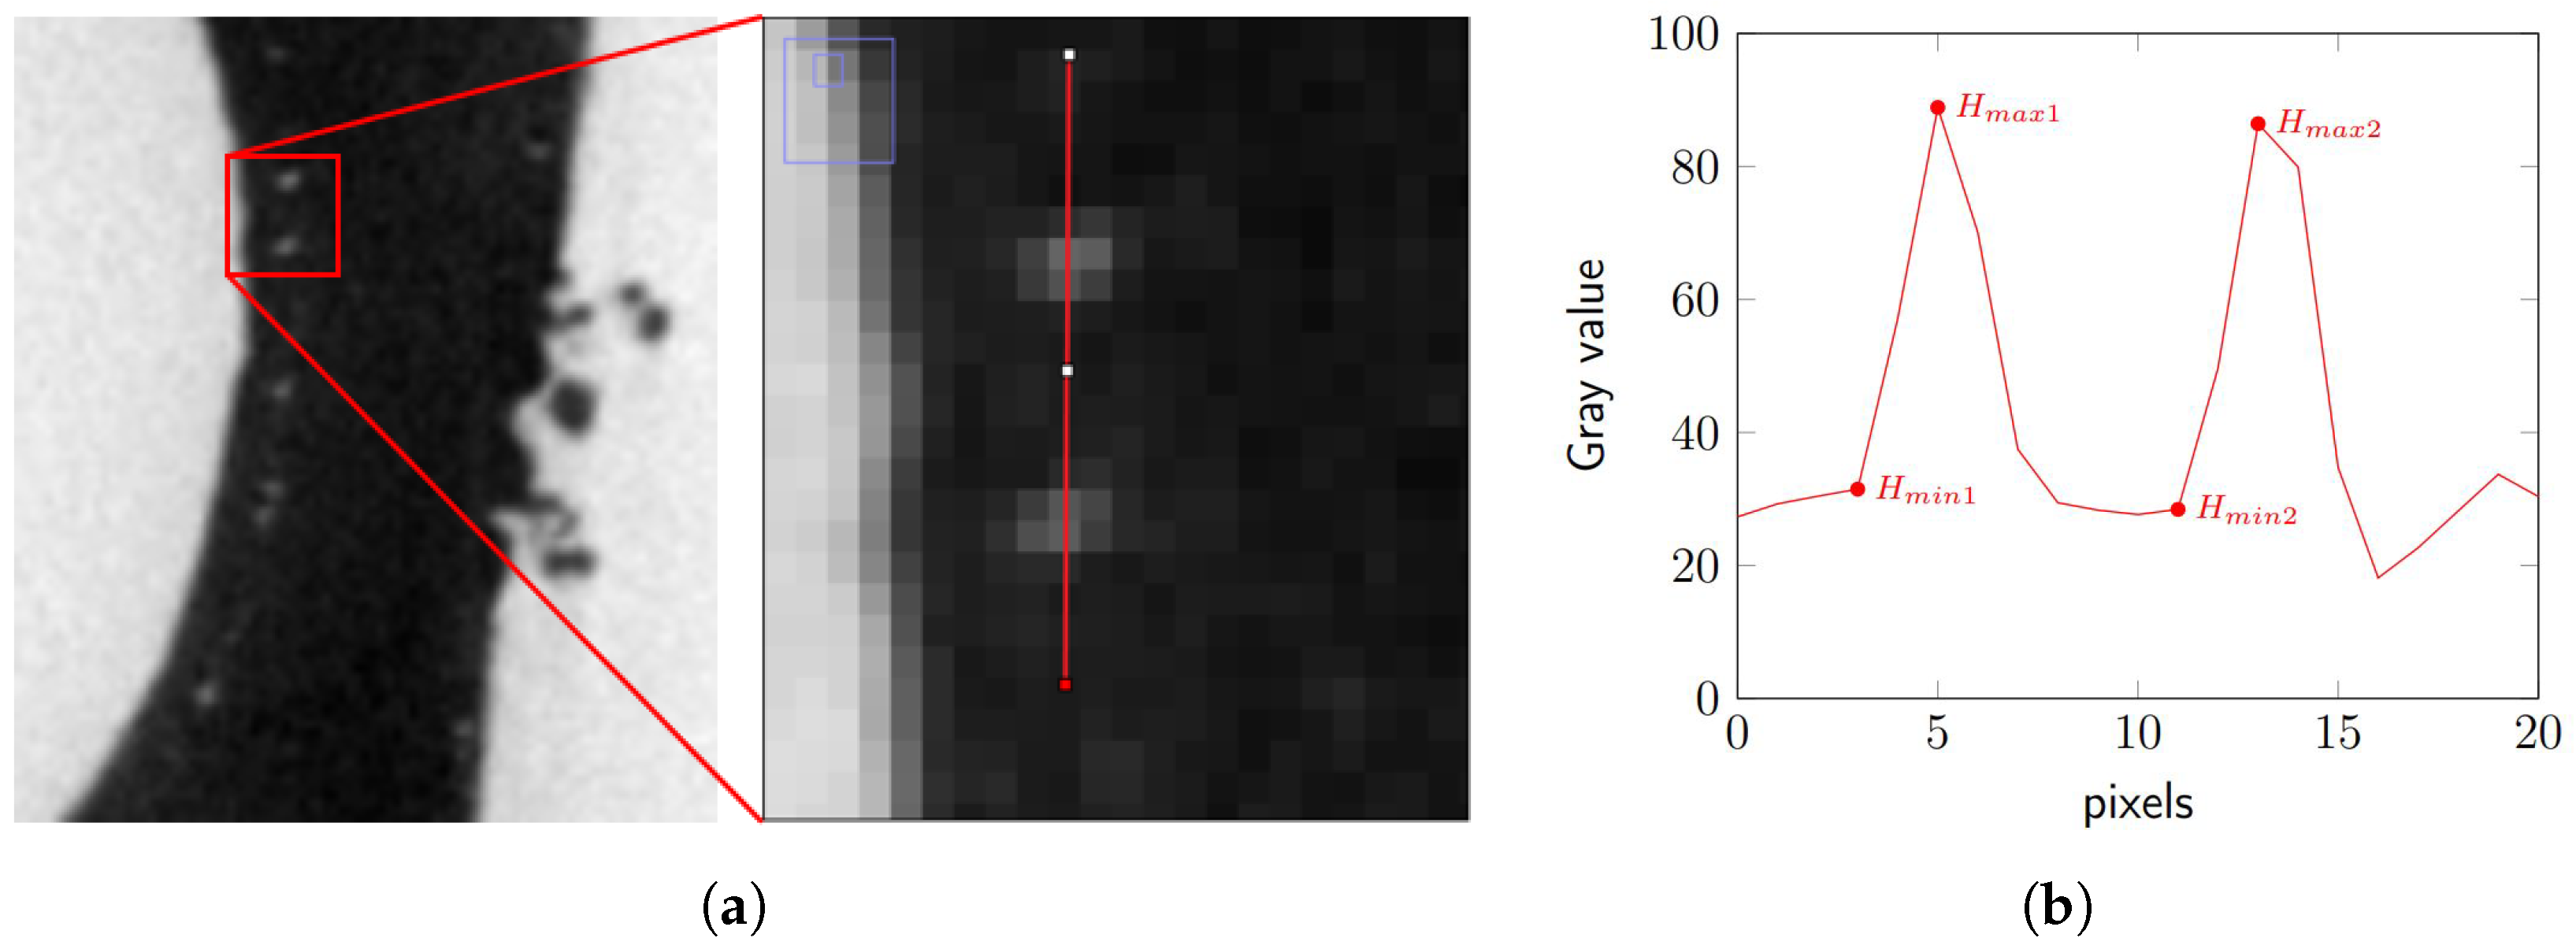
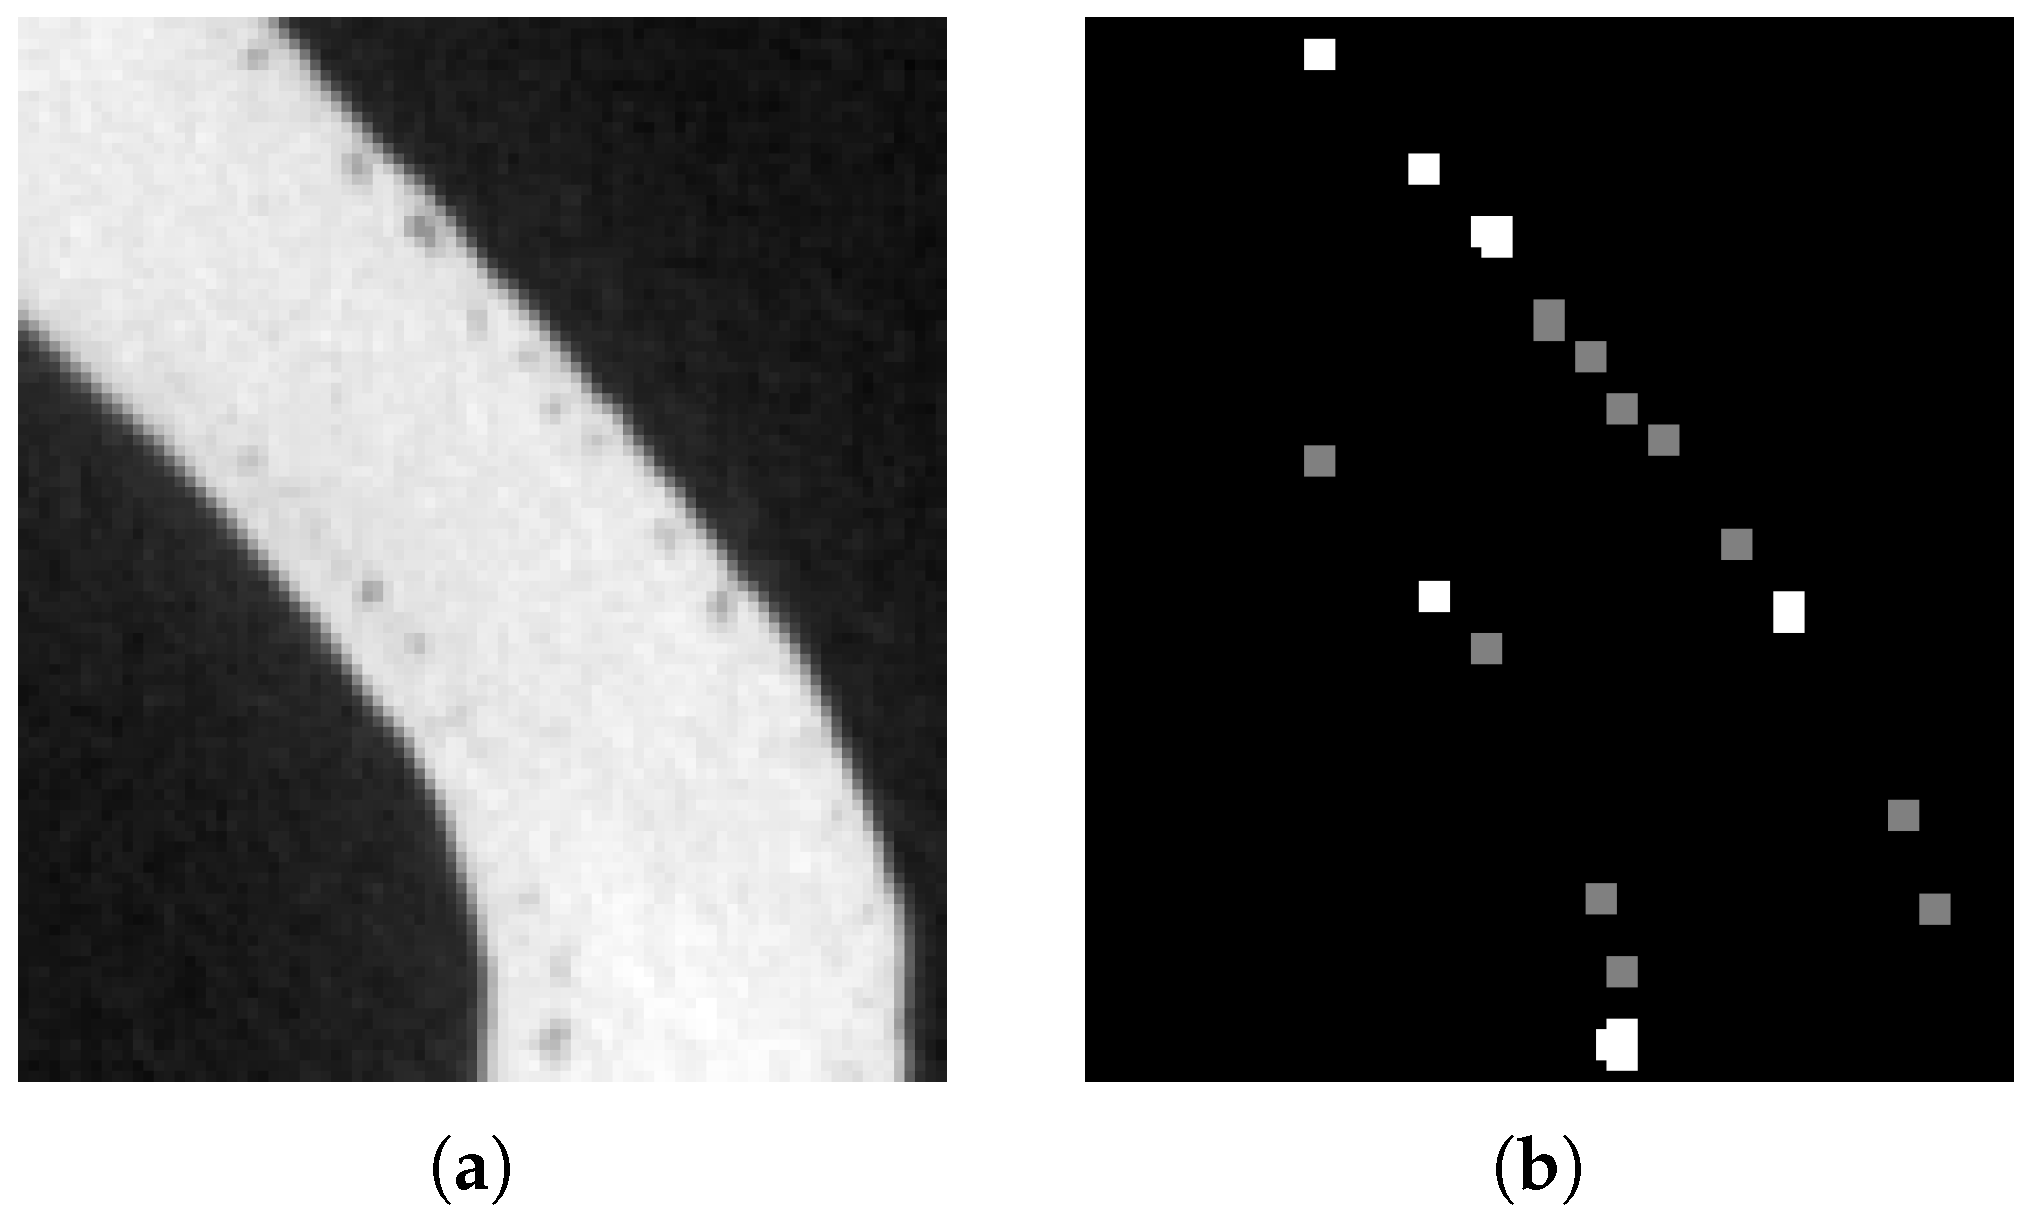
For this process, 200 dome-shaped structures, identified as pores were analyzed across 40 images, 20 from the GD stack and 20 from the G2 stack. The study focused on areas representing 10% of the total size of each original image (see
Table 2 and
Figure 3a), selected based on the criterion of containing at least five pores within each area. This choice ensured that the analyzed subvolumes corresponded to regions with a sufficient number of pores while avoiding the inclusion of large areas of empty space inherent to the gyroid lattice geometry. In this way, the selected regions provided consistent and statistically meaningful pore information without being biased by the surrounding voids.
As part of the morphological analysis, the height “H” of each pore was measured, as this metric quantifies the prominence or depth of the dome-like structures, which is essential for characterizing their geometry and assessing potential correlations with pore formation. The height was determined by drawing a line intersecting the domes and extracting the corresponding profile (see
Figure 3a,b).
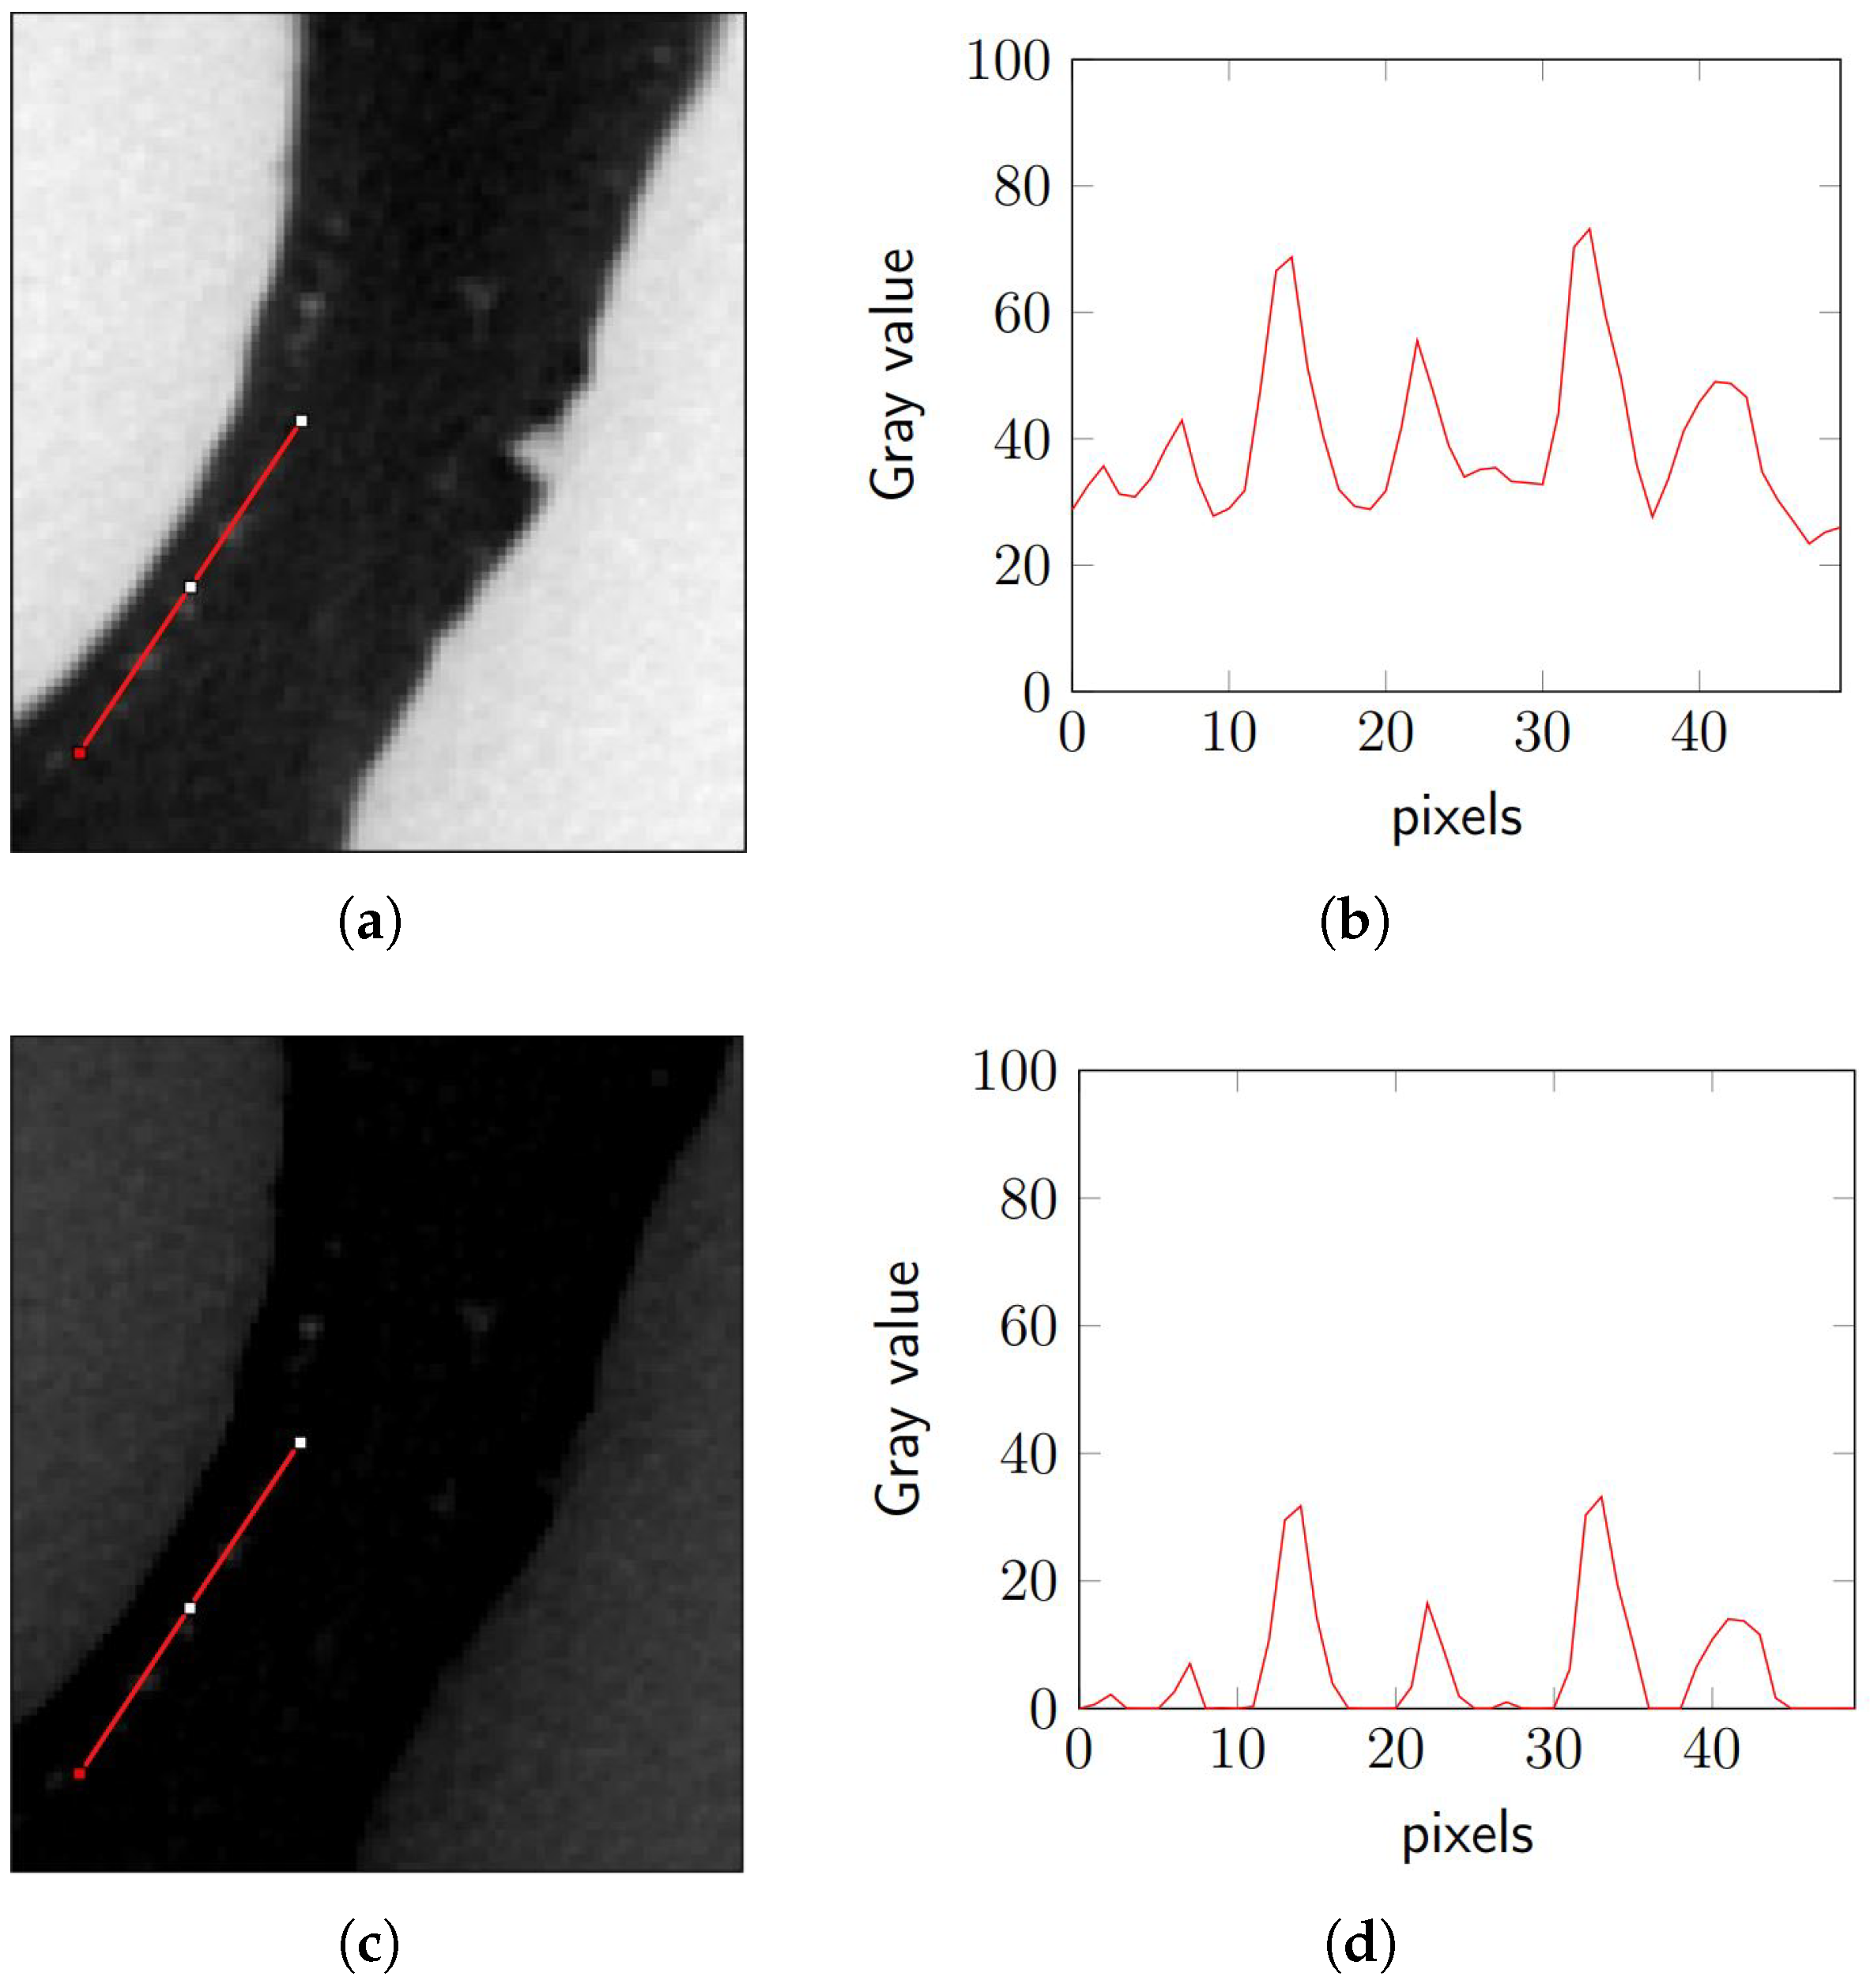
The height measured in each pore, expressed in grayscale levels, was used as a key parameter in the application of the morphological reconstruction algorithm, allowing for more precise localization and refinement of dome-shaped structures within the images. Based on these values, the average pore heights were calculated for stacks GD and G2, yielding 77.84 ± 20.40 and 57.02 ± 14.19 grayscale levels, respectively. These values reflect not only the local contrast between the porous regions and the surrounding material but also the variability in the depth of the recorded profiles. Morphological reconstruction was carried out iteratively by consistently applying the geodesic dilation process across all selected areas (see
Figure 4).
To determine the optimal binarization threshold that would allow the separation of dome-shaped pores from image defects, a Receiver Operating Characteristic (ROC) curve analysis was conducted. This analysis was performed using 40 images from the GD stack and 40 images from the G2 stack previously labeled with a grayscale value of 255 for pores and 128 for defects (see
Table 3 and
Figure 5). A study was carried out considering 30 binarization threshold values, ranging from 15 to 45.
The binarization process is based on converting grayscale images into binary images, where pixels with intensity values equal to or above the threshold are classified as part of the pores, while those below the threshold are considered defects. This distinction is crucial for accurate segmentation of porous structures and the elimination of irrelevant elements.
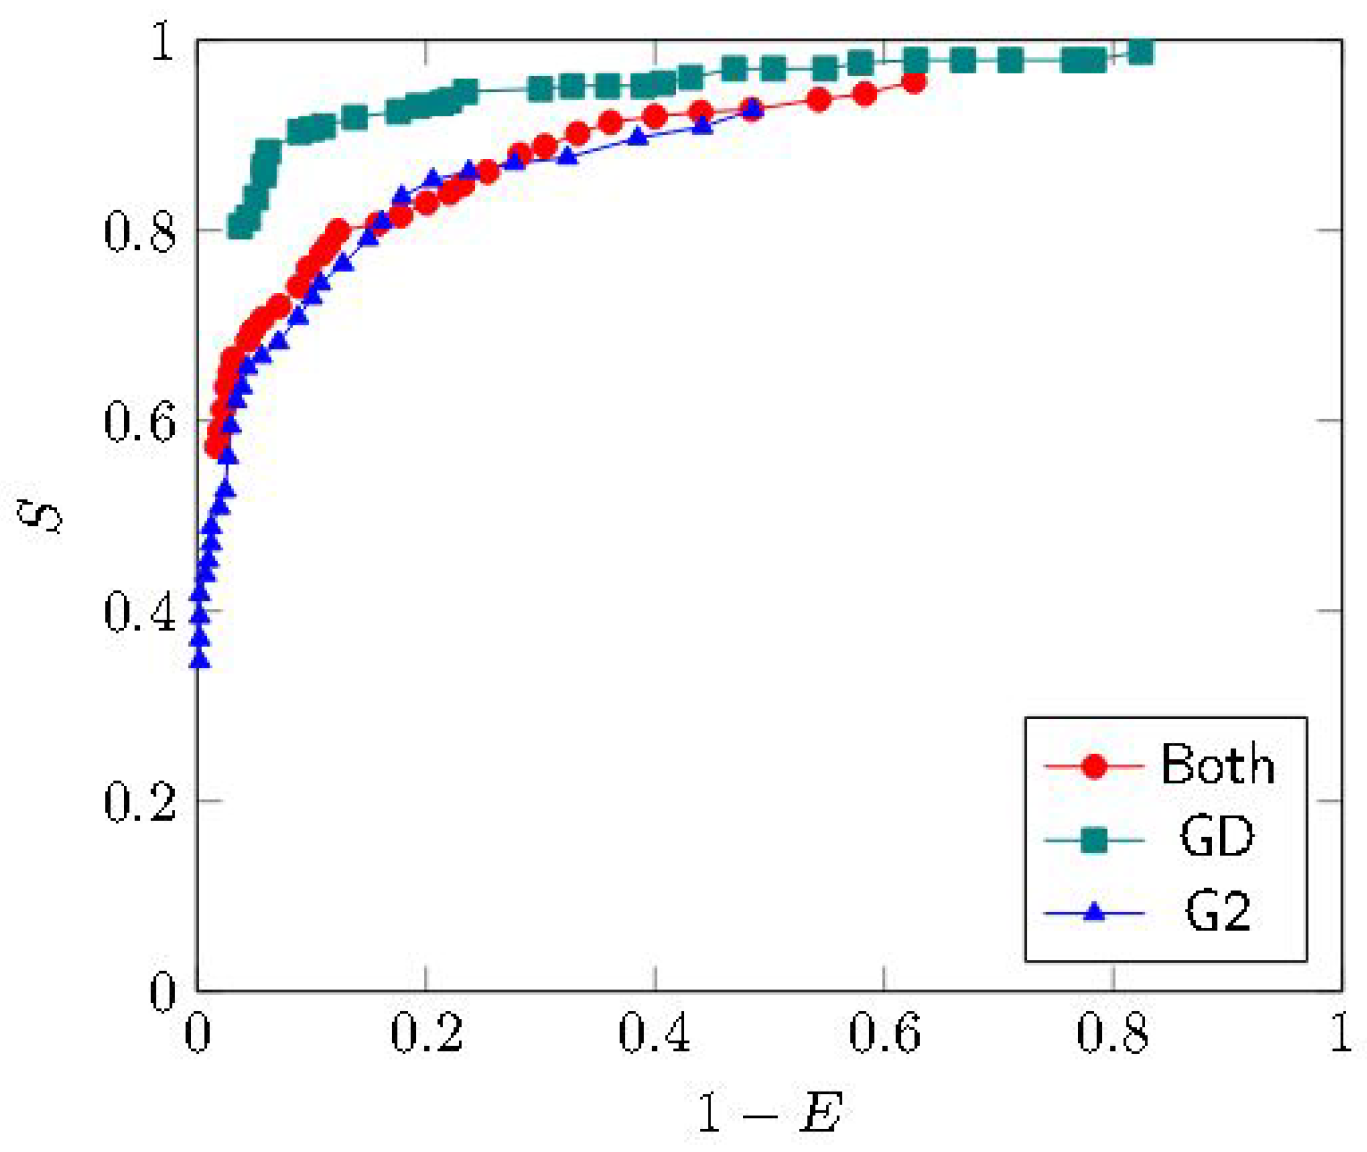
The analysis included the calculation of sensitivity (S) and specificity (E) for each applied threshold. The resulting ROC curve [
34], presented in
Figure 6, enabled the evaluation of the relationship between the true positive rate and the false positive rate at different thresholds. The optimal thresholds for the GD and G2 stacks, as well as for their combined dataset, are detailed in
Table 4, highlighting the differences in optimal binarization intensity for each image stack.
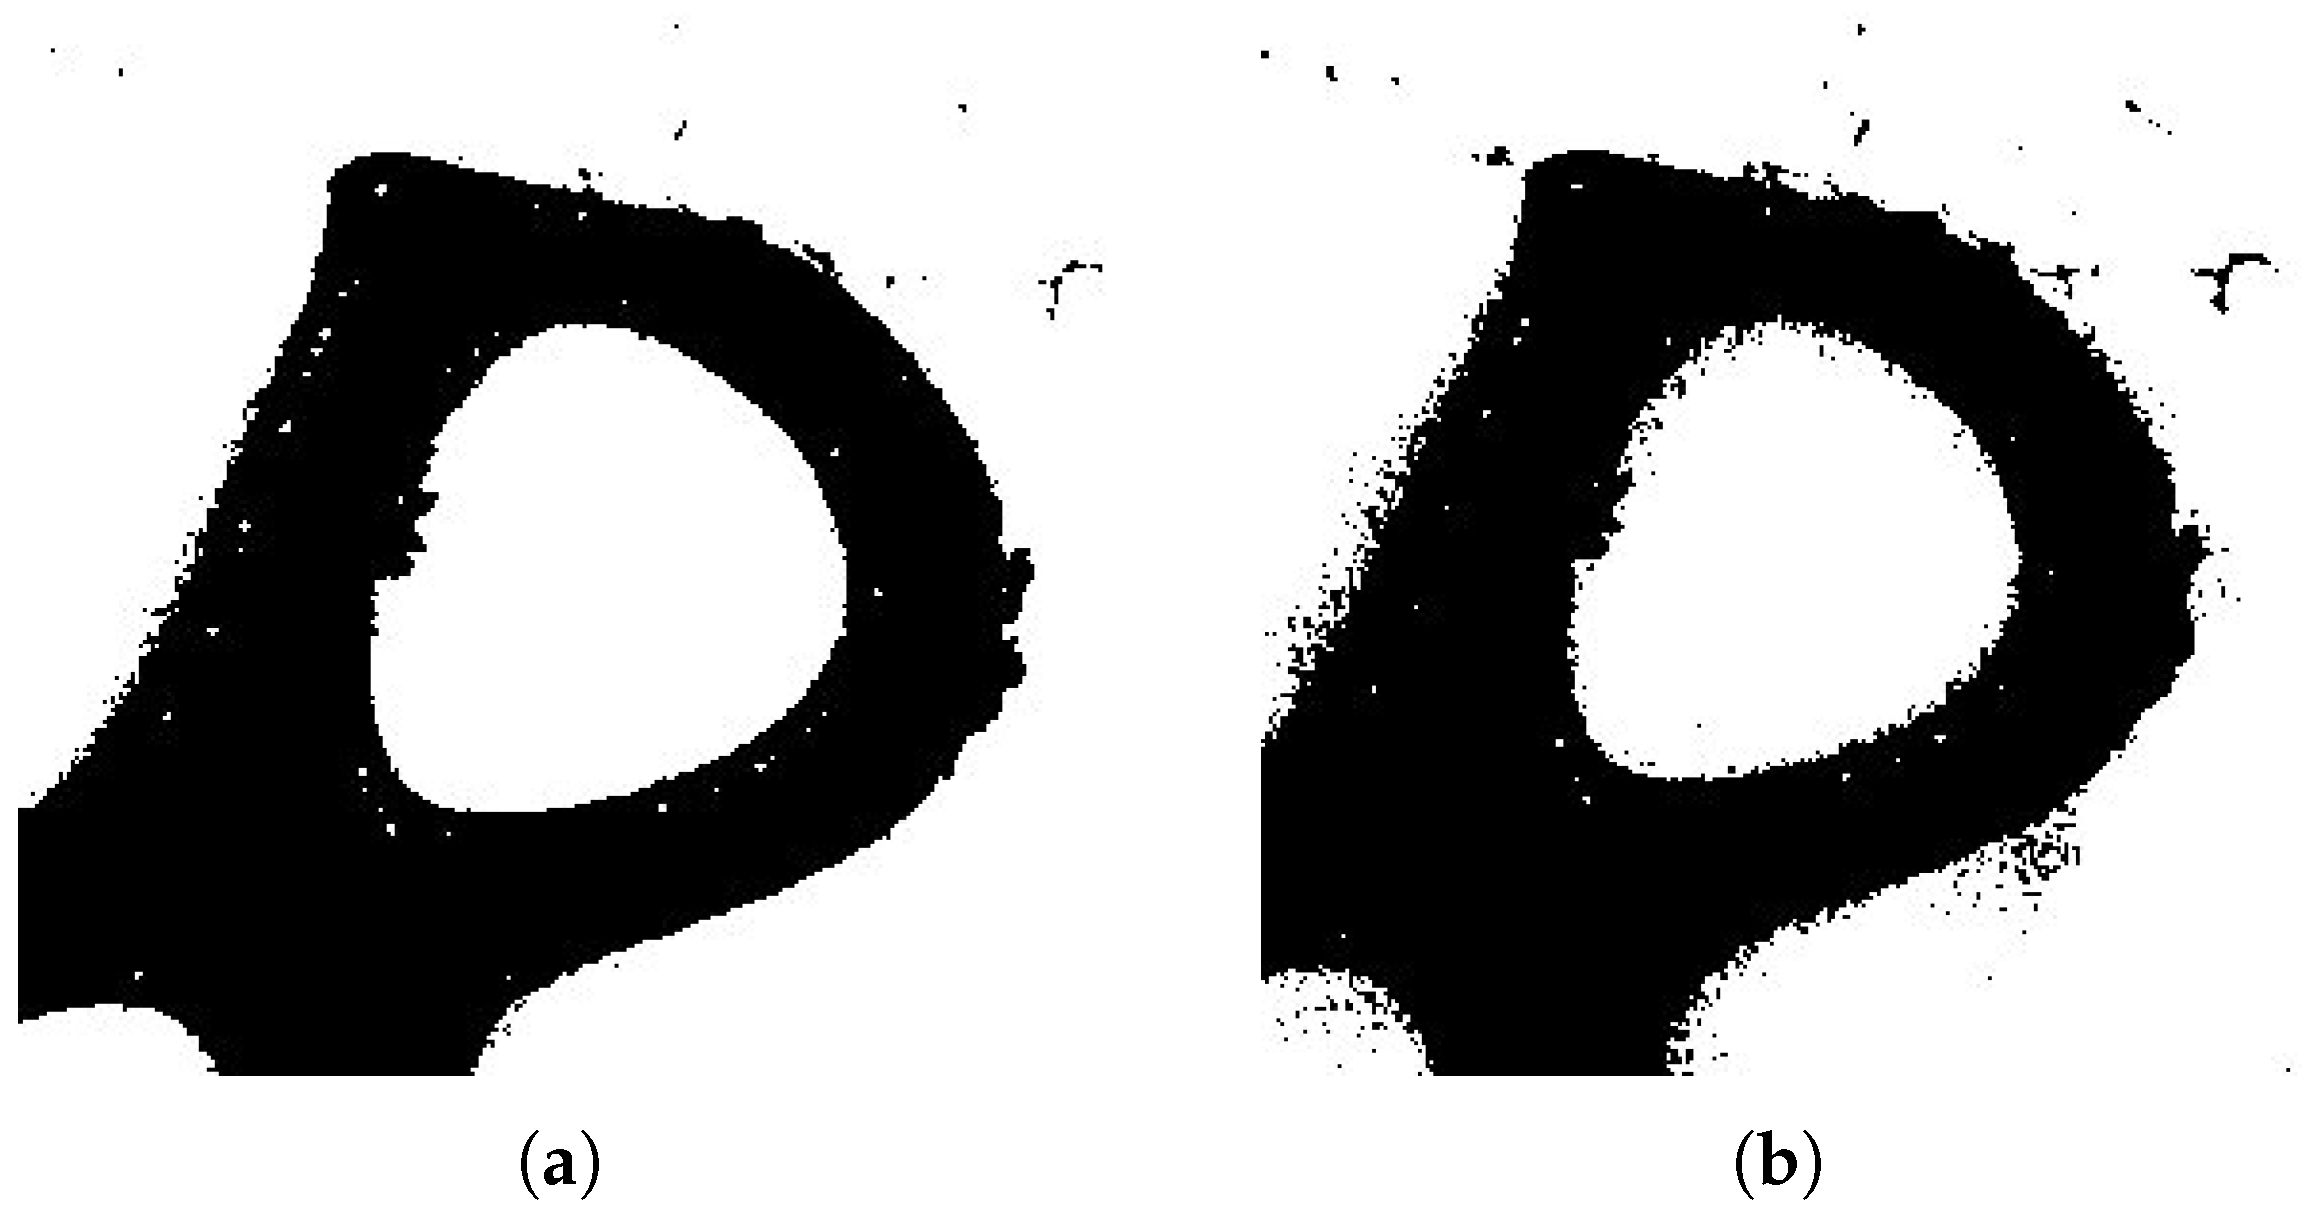
It is important to note that although the most effective binarization threshold for the combined image stacks was 31, the differences in intensity levels between the image sets indicate that a single threshold may not always be suitable for each specific case. This underscores the need for an individualized application to achieve optimal segmentation results (see
Figure 7).
A potential way forward to reduce this dependency on individualized adjustments could involve adaptive thresholding methods or machine learning-based segmentation trained on additive manufacturing datasets.
The labeling and filtering process of the binarized images was carried out using 18-connectivity in three dimensions, a fundamental criterion for identifying and grouping porous elements. Since some labeled volumes could correspond to undesired defects, two main filters were applied to improve the accuracy of the segmentation:
Unit Volume Filter: This filter was implemented as a noise-reduction step, removing isolated single voxels generated during binarization (see
Figure 8b). These unit elements do not correspond to physical pores but to imaging artifacts. By discarding only one-voxel clusters, the filter preserves all real pore structures, including small pores, while reducing spurious noise in the binarized image.
Two Consecutive Layers Filter: This filter was used to remove labels associated with volumes that do not consist of at least two consecutive layers. A “layer” was defined as the 2D section or slice of a volume (see
Figure 8c). This filter ensures that pores spanning multiple layers are correctly identified and not mistakenly discarded.
Given the isotropic voxel size of 0.047 mm and the continuity conditions imposed by the applied filters, the smallest physically resolvable pore in this study corresponds to approximately two voxels in size (≈0.09 mm).
Table 5 presents the number of labels obtained before and after applying the described filters to the G2 stack, using a threshold of 22 and a height of 57 grayscale levels. The application of the filters resulted in a significant reduction in the number of labels, thereby improving the quality and accuracy of the segmentation.
The region growing method is used to segment and group adjacent pixels that share similar characteristics, such as intensity, with the goal of reconstructing regions that coherently represent the original shape and contour of the pores. In this study, it was employed to identify and isolate pore structures in the previously obtained binarized images. The algorithm follows the quantitative region-growing segmentation approach described by Forero et al. [
35], which performs iterative voxel aggregation under 18-neighborhood connectivity and intensity homogeneity criteria, ensuring accurate identification of three-dimensional pore structures.
For each image, the region growing algorithm begins by selecting a set of initial pixels (seeds) in regions considered representative of the pores. From these seeds, the algorithm expands the region by incorporating neighboring pixels with similar intensity. The process continues until no more pixels can be added to the region without violating the intensity homogeneity criterion. This approach ensures that the identified regions remain consistent with the morphological characteristics of the pores and eliminates the incorrect segmentation of non-porous areas.
The results of this process can be observed in
Figure 9, which displays the outcomes obtained for one of the image stacks. The regions segmented by the region growing algorithm represent the most well-defined and isolated pore structures, enabling a more precise quantification of the material’s porosity.
This method also facilitates noise reduction and enhances the quality of the segmented images by ensuring that only regions with homogeneous characteristics are grouped. This is essential for porosity analysis in complex materials such as the AlSi10Mg aluminum alloy.
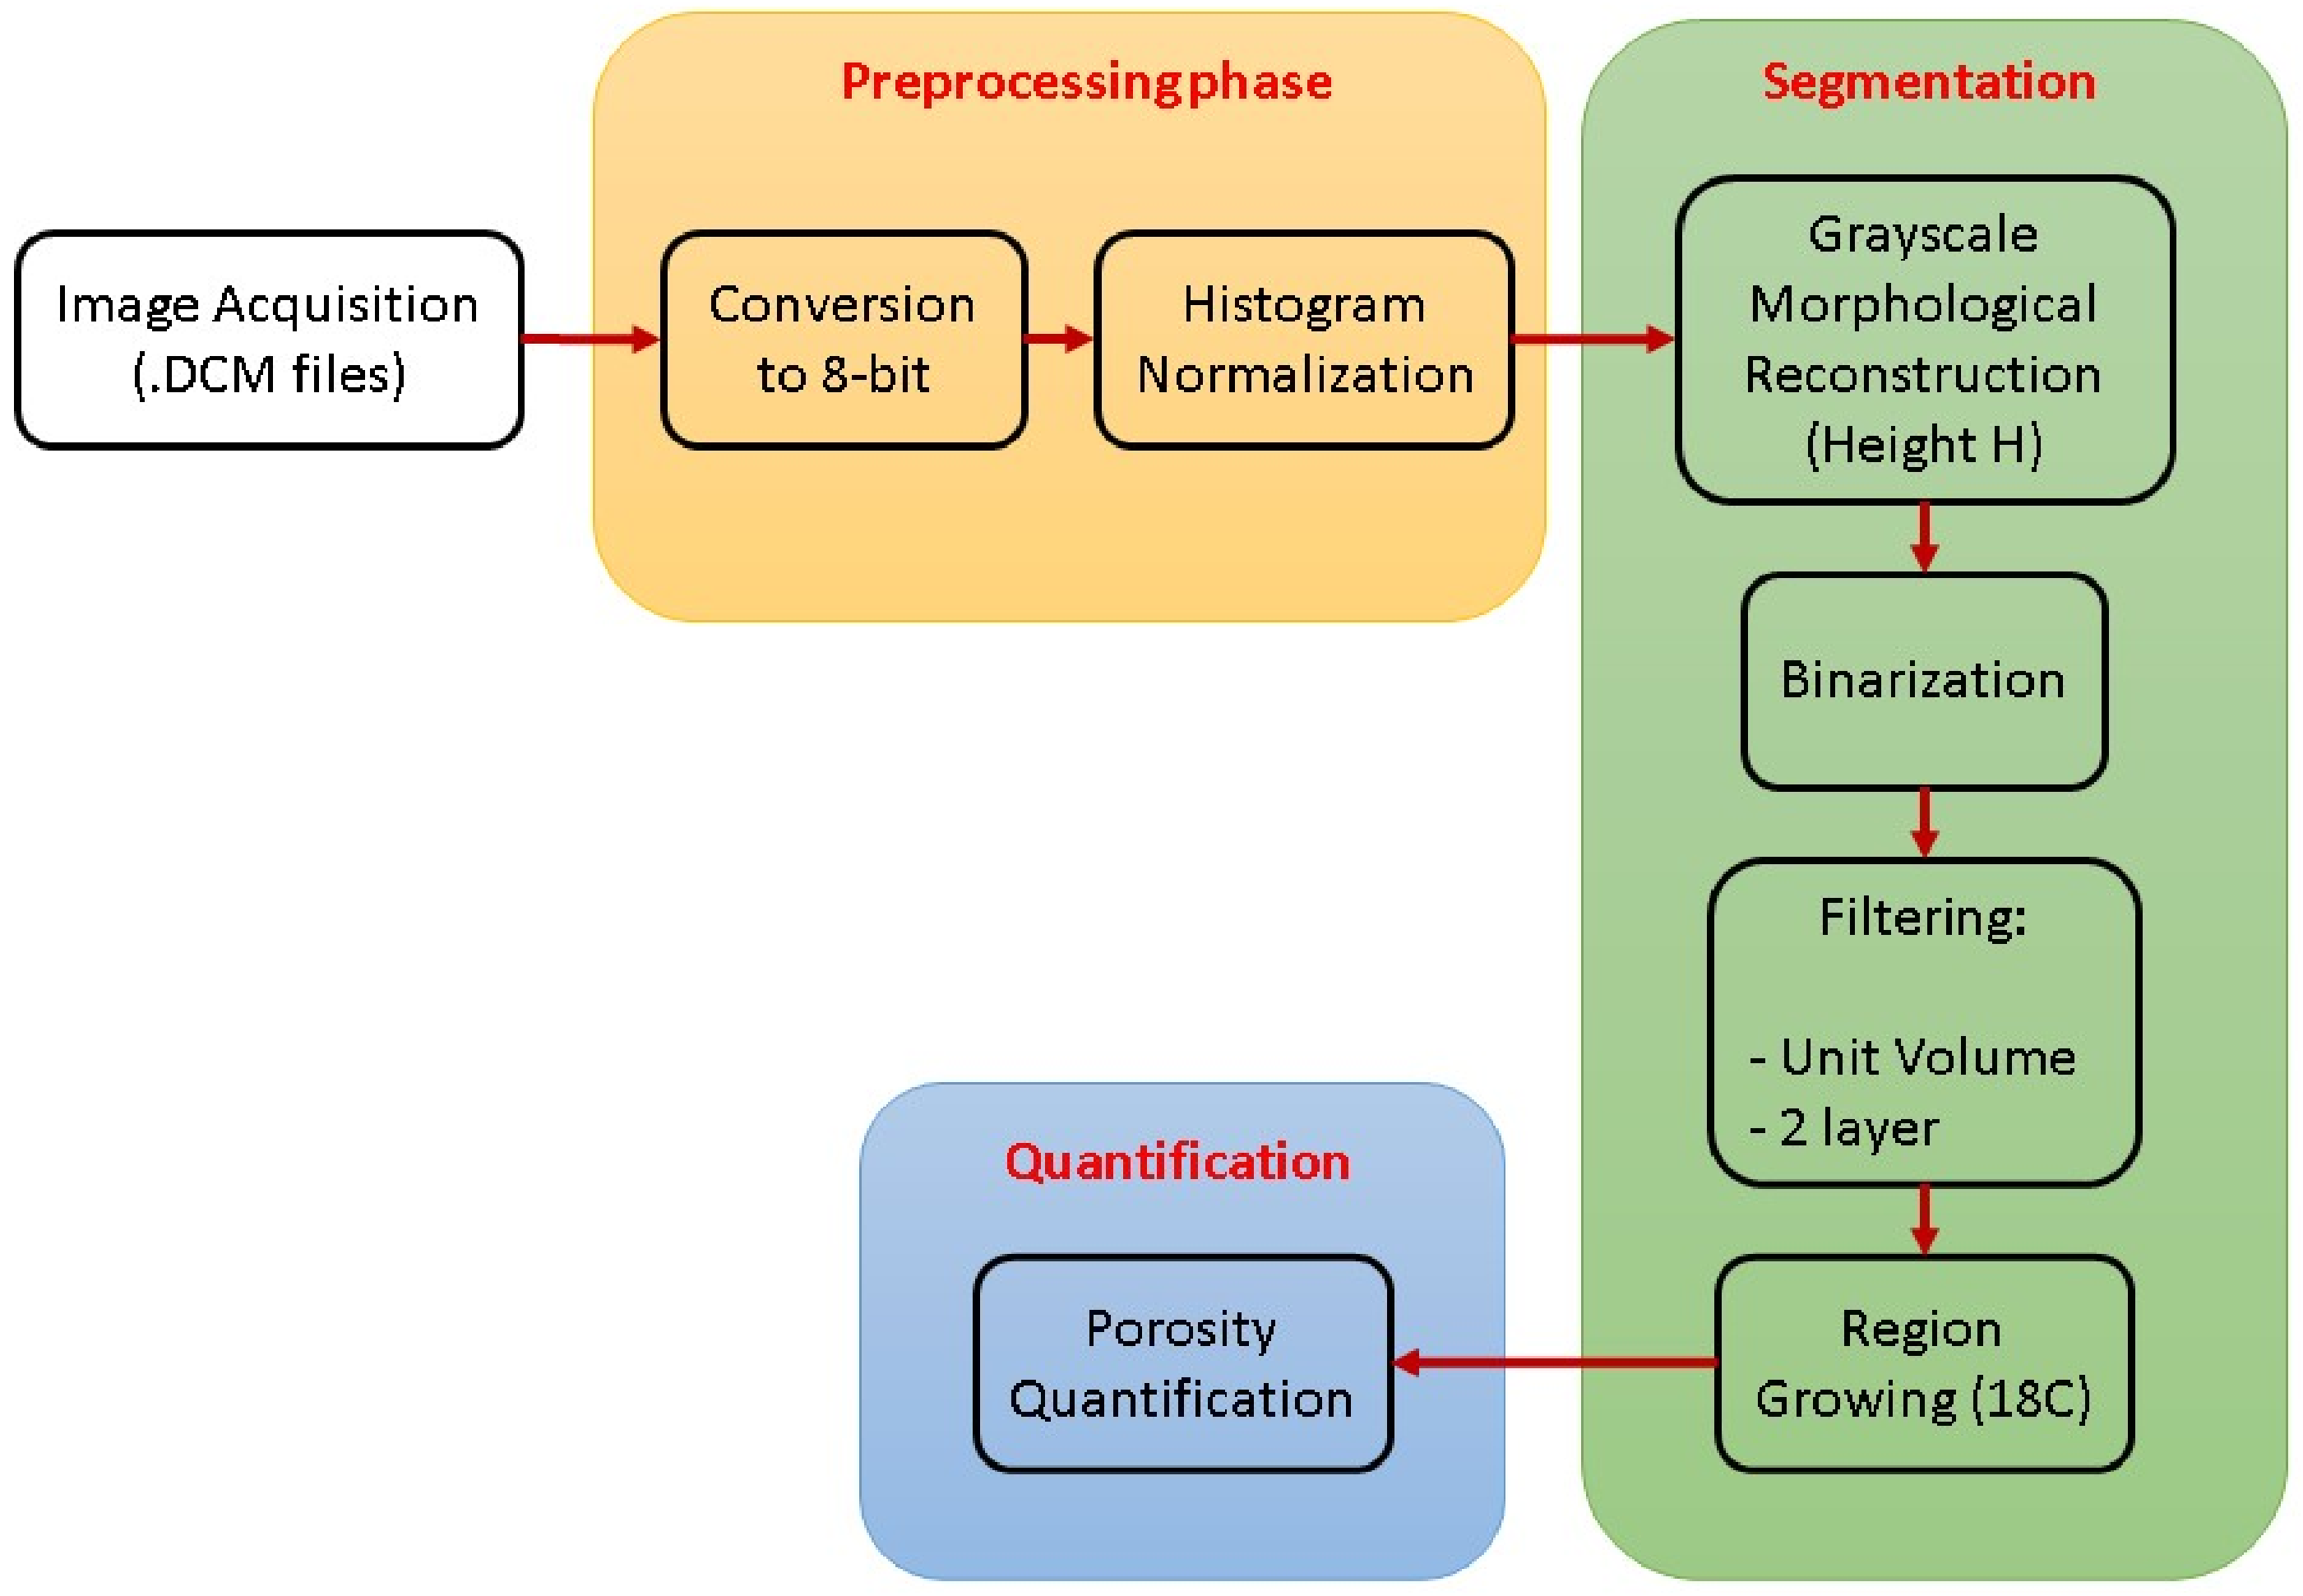
Figure 10 presents the image processing flow diagram used for porosity quantification. This diagram outlines the main steps of the procedure, including tomographic image acquisition, preprocessing through 8-bit conversion and histogram normalization, and the subsequent segmentation phase. The latter incorporates grayscale morphological reconstruction, threshold optimization, unit volume and two-layer continuity filtering, followed by an 18-connectivity 3D region-growing algorithm. This structured sequence enables the precise identification of porous regions and their volumetric quantification, ensuring consistency and repeatability throughout the analysis.
The calculation of the porosity percentage was based on the volume of pores previously identified through segmentation in the processed image stack. Subsequently, the initial images were binarized to determine the total volume of the part. For this step, the Otsu binarization method [
36] was used, which automatically optimizes the binarization threshold to efficiently separate the regions of interest (see
Figure 11).
Once the initial image stack was binarized, white voxels (with a value of 255) were counted in both this stack and the one obtained after morphological growth, as shown in
Table 6. These data, extracted from the histogram of the binarized images, are essential for calculating the porosity percentage of the part.
The porosity percentage “P” was calculated using the classical volume-based equation, expressed as:
However, since the analysis was performed using three-dimensional digital images, where the physical volume is not directly available but rather represented by discrete data, an equivalent formulation based on the number of voxels was employed:
Voxel size information for each image stack was identified using ImageJ software by accessing the metadata embedded in the DICOM files (see
Table 7). These voxel dimensions, expressed in cubic millimeters and provided by the tomography system, are essential for converting the number of voxels into the physical volume of each part. This information enables accurate volume estimations required for subsequent density calculations.
To obtain the number of voxels corresponding to the volume of the part, the number of voxels present in the initial binarized stack was subtracted from those identified after morphological growth. This calculation is essential for determining the solid volume of the part, as expressed in the following formula:
3. Results
For the image stacks G1 and G2, porosity and density were calculated using a height value “H” of 67, a binarization threshold of 31, a filter of two consecutive layers, and a growth threshold of 5. Although the GD stack is used in other sections of this work, it was excluded from the quantitative analysis because the mass employed to fix the part to the tomograph interfered with the accurate measurement of its volume. Consequently, only the G1 and G2 stacks were considered for porosity and density evaluation.
Table 8 and
Table 9 summarize the results obtained for the aluminum alloy samples.
Table 8 reports the calculated porosity, volume, mass, and density, while
Table 9 presents the corresponding errors with respect to the real material density. The values demonstrate consistent measurements with low deviations, indicating that the methodology applied was appropriate for the characterization of these samples.
The G1 and G2 stacks exhibit very low porosities of 0.060% and 0.073%, respectively, with densities of 2.708 g/cm3 and 2.704 g/cm3. These results are in close agreement with the reference density of the alloy, which supports the accuracy of the adopted approach. The similarity between the two stacks suggests a homogeneous behavior of the material under the conditions studied, with no significant variations in the pore distribution or density values.
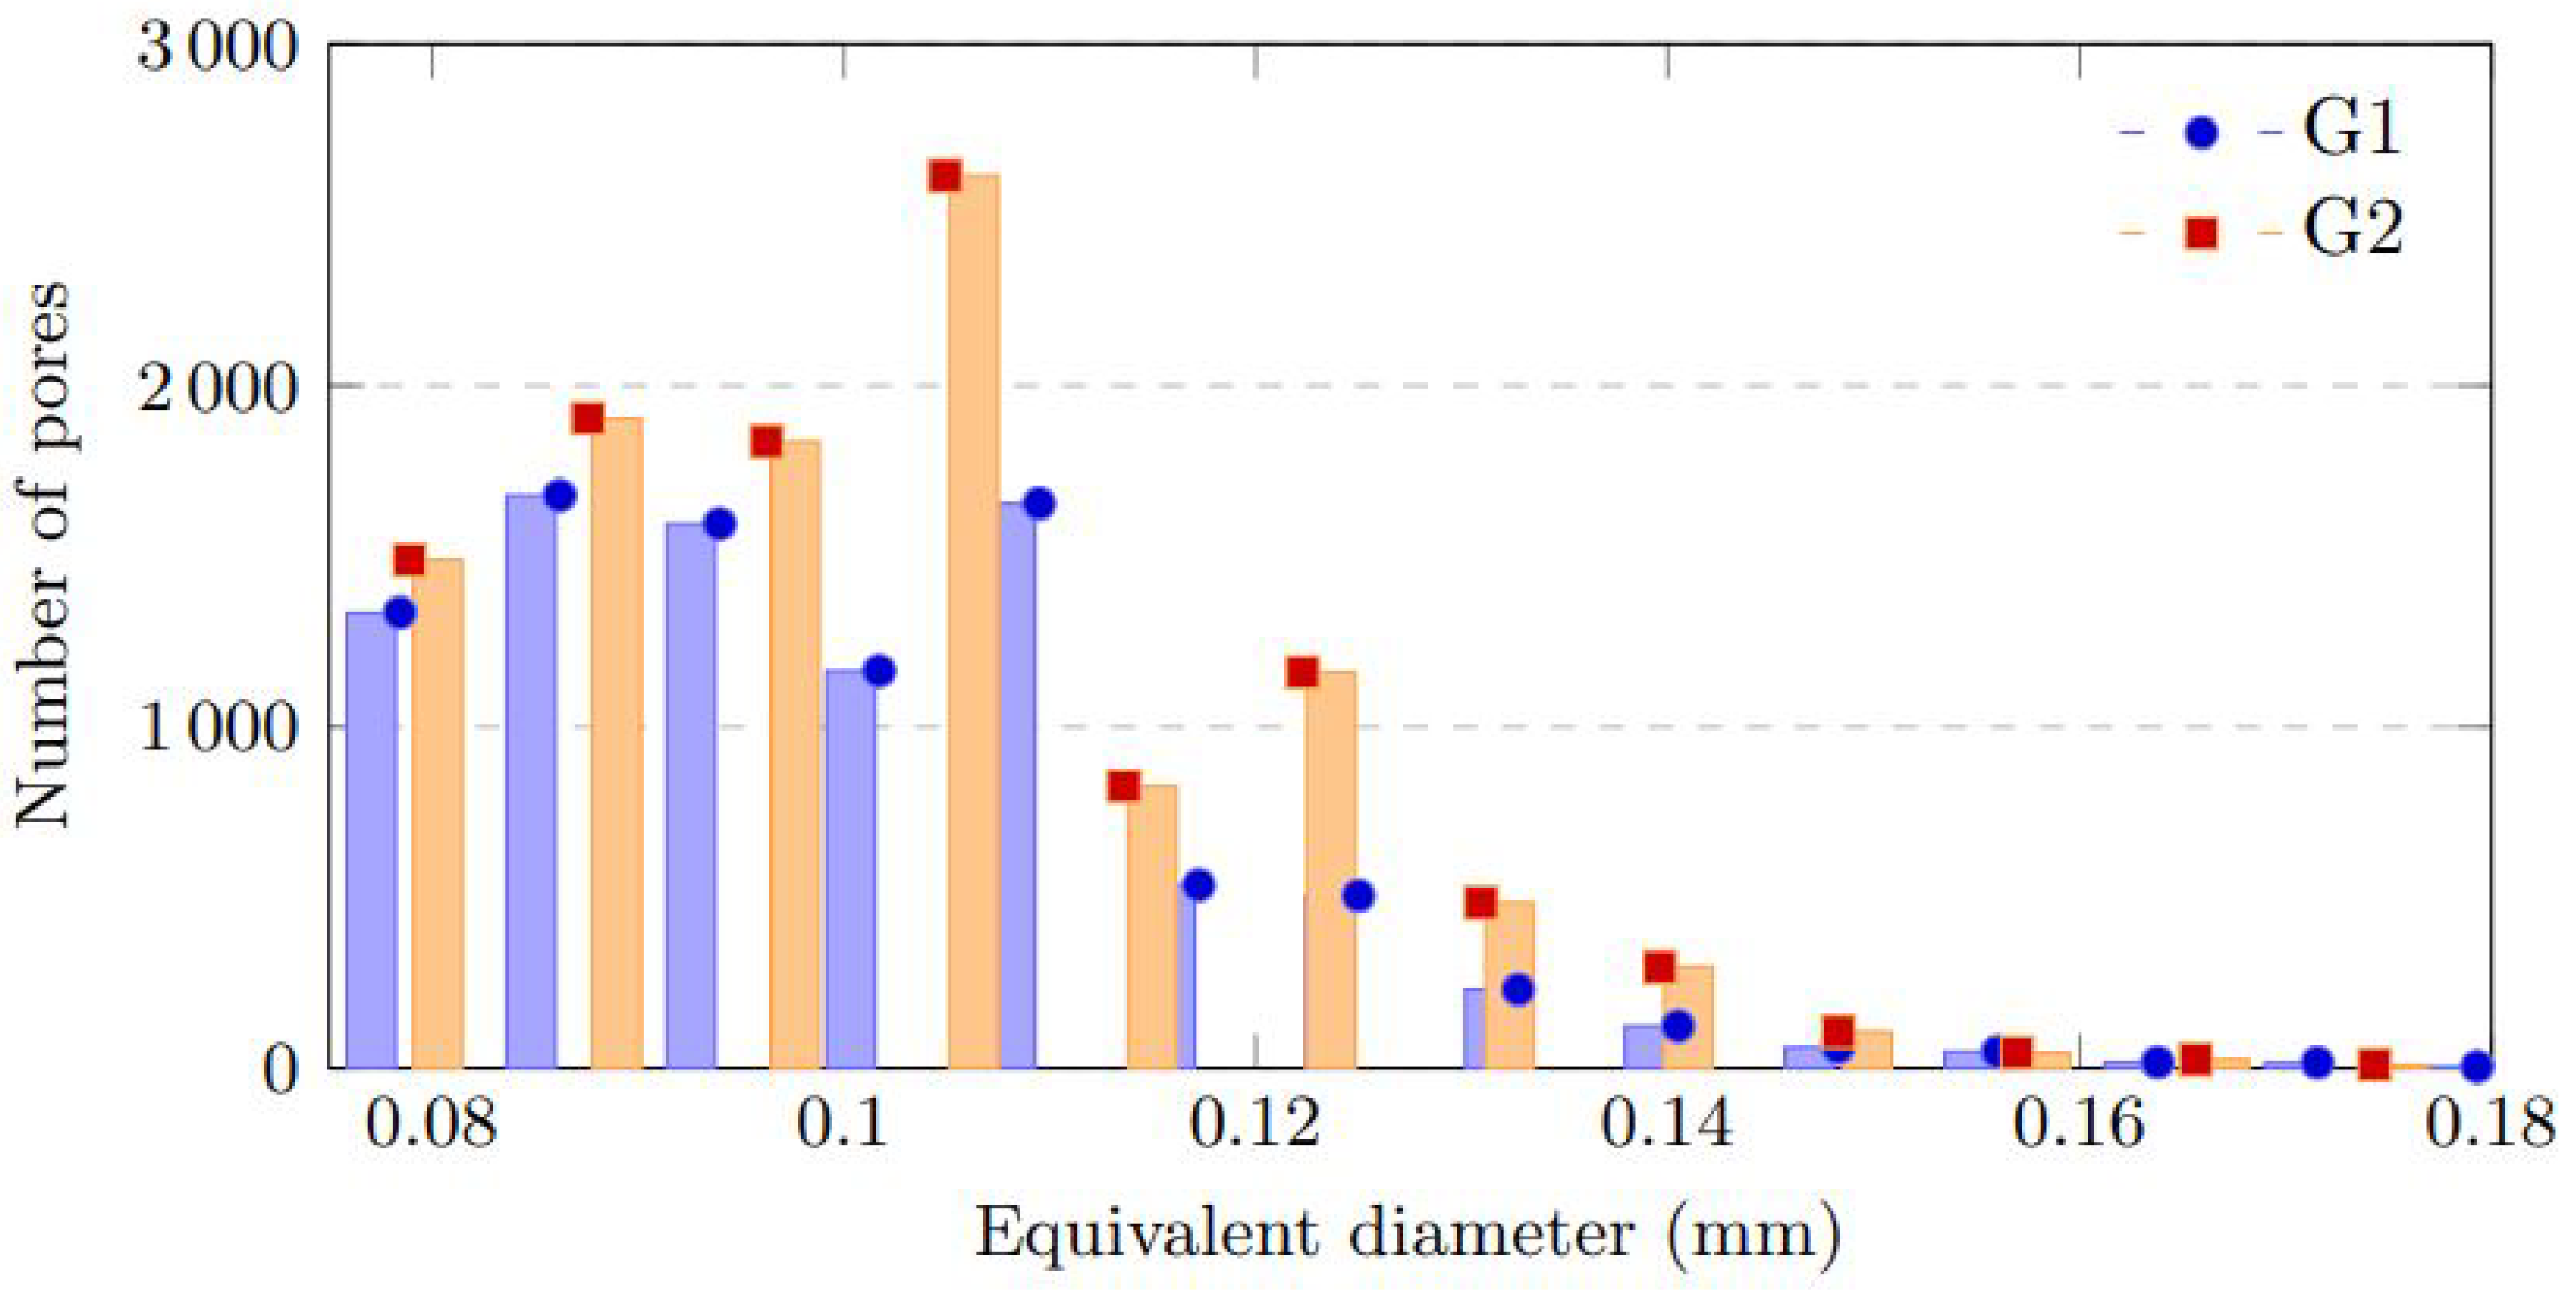
Figure 12 shows the histograms corresponding to stacks G1 and G2. In both cases, the distributions are positively skewed toward smaller pores, with the highest frequencies between 0.09 and 0.11 mm. Only a small fraction of pores exceeds 0.15 mm, confirming that the porosity is dominated by fine, dispersed voids rather than large defects.
In addition to the volumetric porosity and density results, the pore size distribution was analyzed based on the equivalent diameter of each pore, defined as the diameter of a sphere with the same volume as the pore. This parameter provides a normalized measure of pore size that facilitates comparison between irregularly shaped defects.
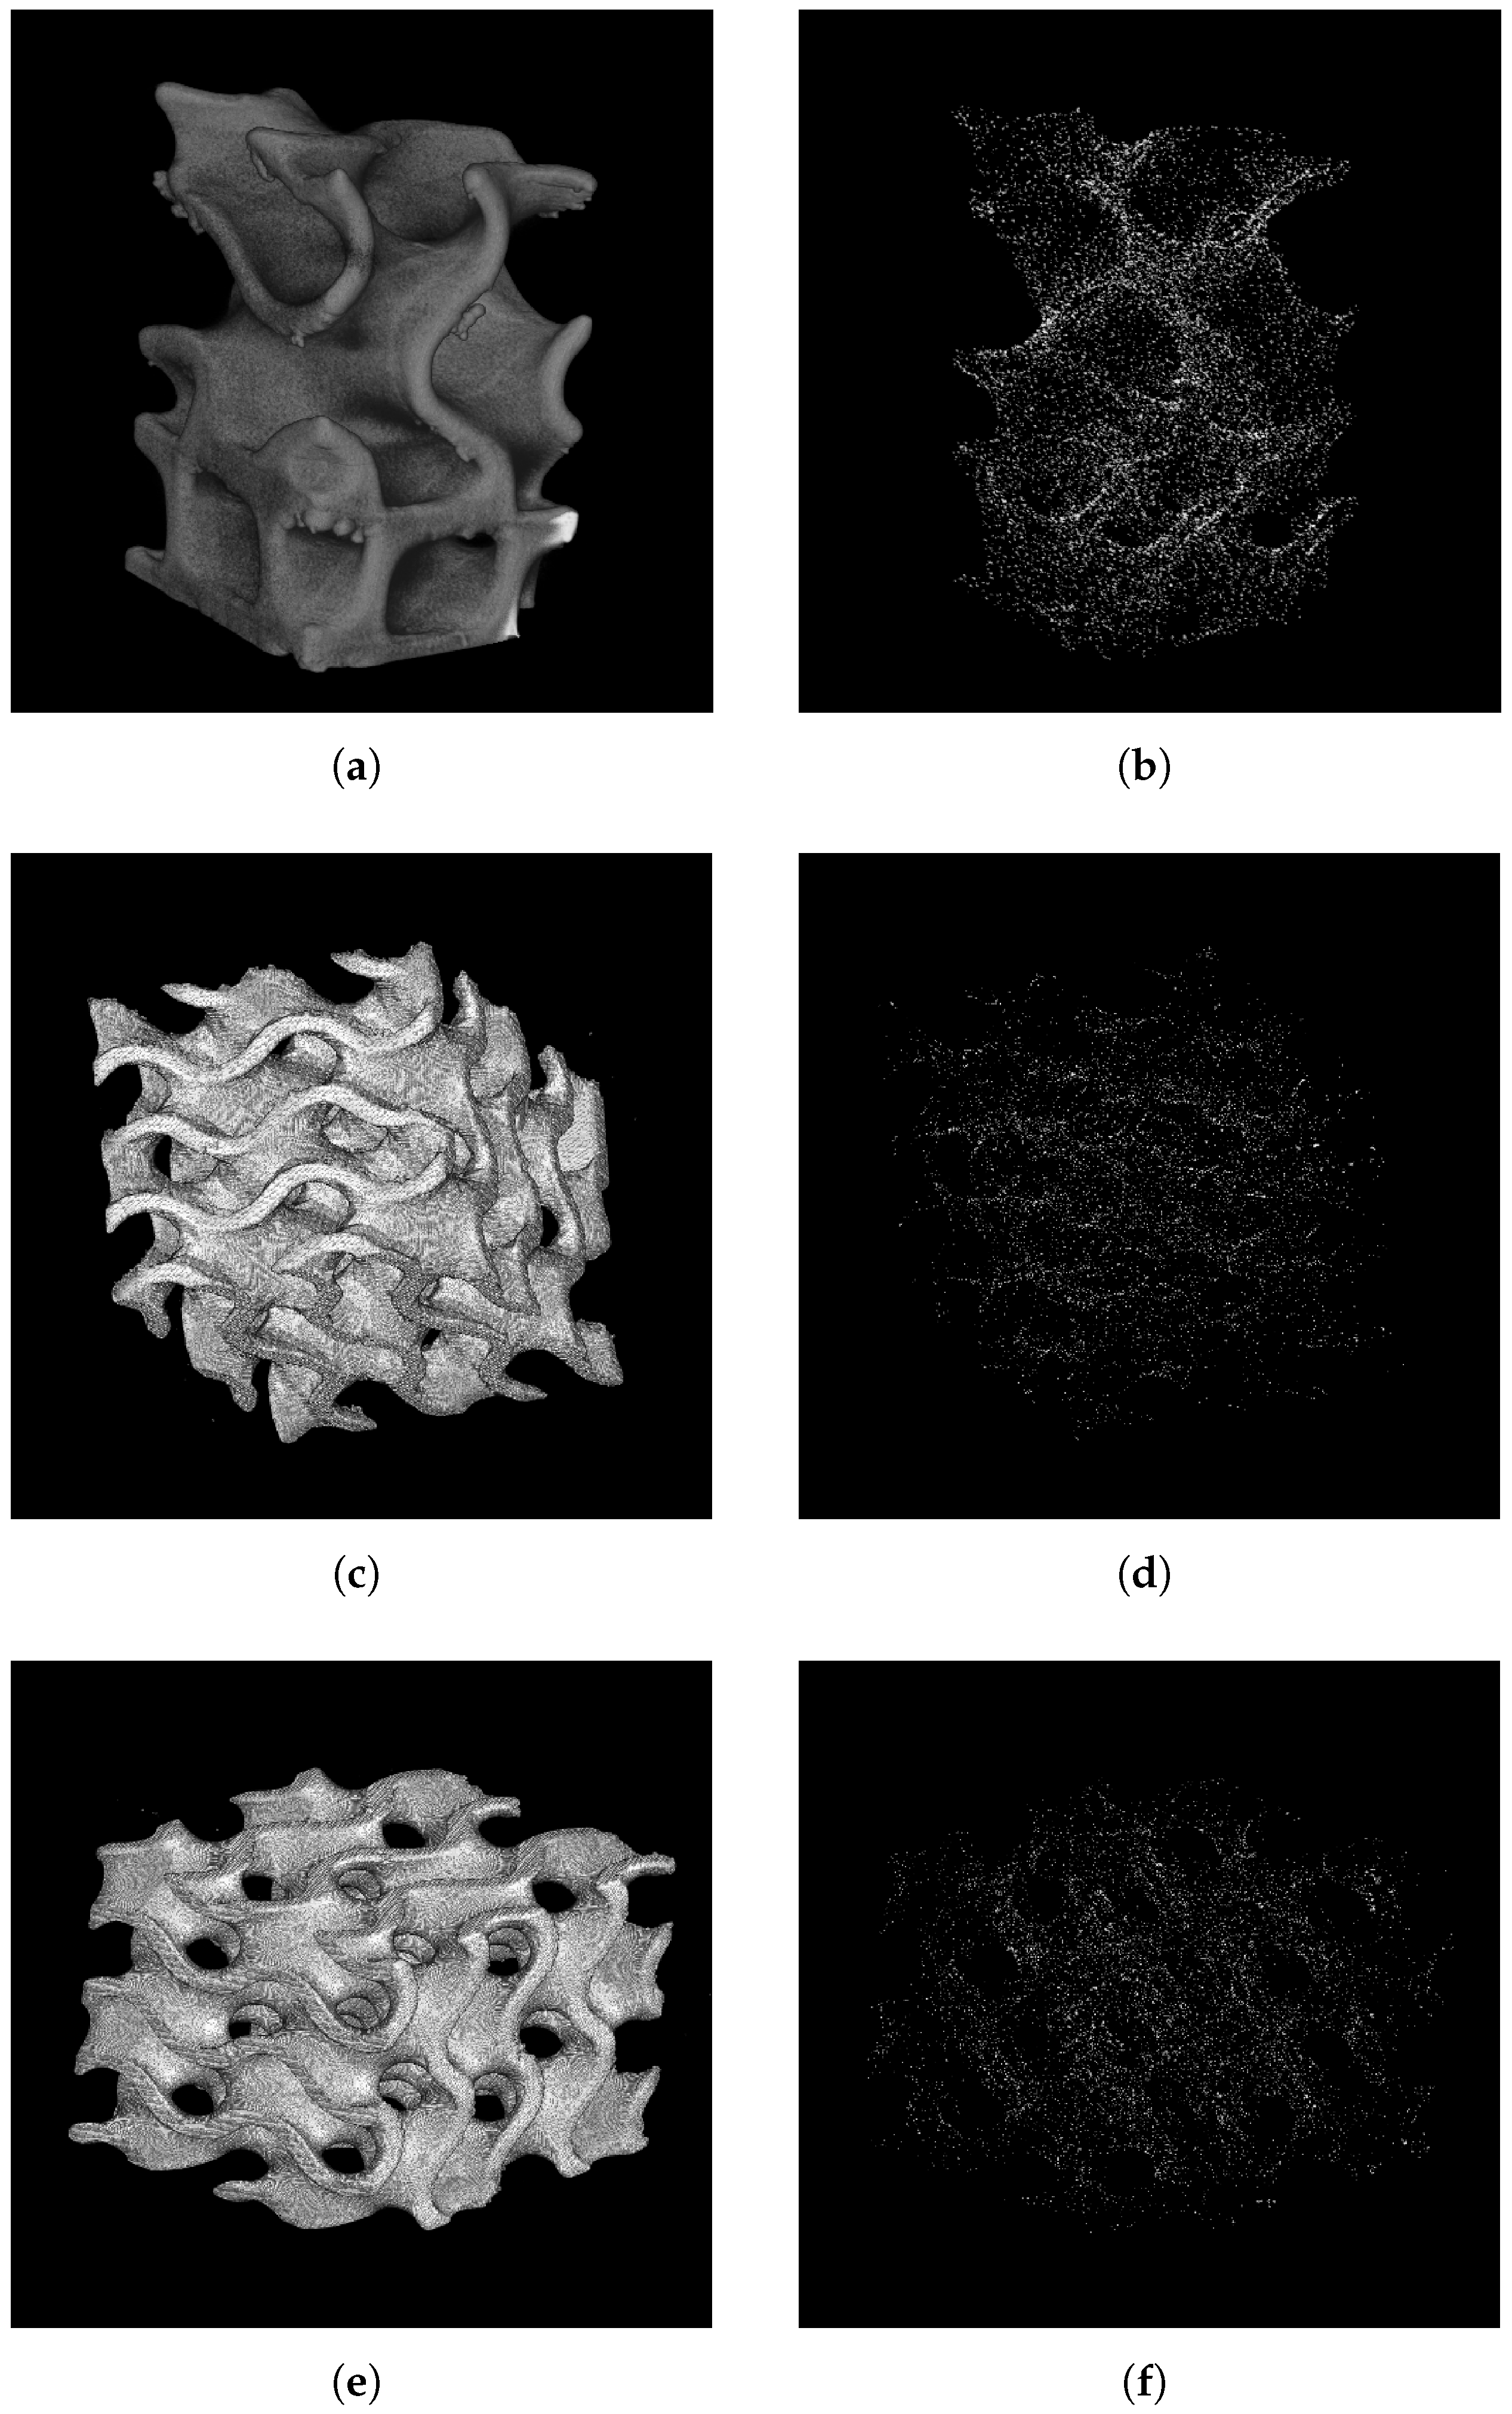
Figure 13 provides the 3D reconstructions of the samples, where the distribution of pores can be visually assessed, further reinforcing the quantitative findings.
Table 10 summarizes the main descriptive statistics for both pore volume and equivalent diameter. For G1, the mean pore volume is
mm
3 and the mean equivalent diameter is 0.099 mm, while for G2 these values are
mm
3 and 0.101 mm, respectively. The medians follow the same trend (0.094 mm and 0.101 mm for G1 and G2), and the narrow standard deviations (0.019 mm for both samples) together with the P10–P90 intervals (0.075–0.123 mm) confirm that most pores fall within a limited range of small sizes.
These findings complement the volumetric porosity results in
Table 8, showing that the material exhibits a homogeneous distribution of fine pores with no evidence of critical defects that could compromise the mechanical integrity of the alloy.
4. Discussion
The results obtained in this study confirm the suitability of X-ray computed tomography (XCT) combined with digital image processing for accurate porosity characterization in additively manufactured AlSi10Mg alloys. The calculated porosity values for samples G1 and G2 (0.060% and 0.073%, respectively) are in close agreement with values reported in the literature for AlSi10Mg fabricated by laser powder bed fusion (L-PBF). This supports the robustness of the adopted workflow, which integrates grayscale morphological reconstruction, optimized thresholding, and region-growing segmentation.
The pore size distribution analysis further demonstrated that the microstructure is dominated by small and nearly spherical pores, with equivalent diameters mainly between 0.075 and 0.123 mm and mean values of approximately 0.10 mm for both samples. The narrow dispersion observed in the histograms, together with the low standard deviations (0.019 mm), indicates a homogeneous distribution of fine pores with no evidence of large or interconnected voids. These findings are consistent with previous studies on AlSi10Mg produced under stable L-PBF conditions, where gas entrapment typically results in isolated, sub-100 µm pores rather than critical defects.
The complementary analysis of pore volume further supports this observation: the mean individual pore volumes ( mm3 for G1 and mm3 for G2) are extremely low, reinforcing the conclusion that porosity is mainly composed of dispersed microvoids. However, the use of a fixed global threshold-although validated through ROC-based calibration-may limit the detection of local variations between image stacks. Future work could explore adaptive thresholding or machine learning-based segmentation to enhance reproducibility and capture subtle contrast differences between datasets.
Overall, this study confirms that XCT combined with advanced image processing is a powerful and reliable approach for porosity characterization in L-PBF aluminum alloys. By providing both quantitative and morphological insight-through complementary analysis of pore volume, size distribution, and equivalent diameter-the methodology supports process optimization and quality assurance while offering a framework for extension to other alloys and lattice structures.
