Abstract
Laser additively manufactured duplex stainless steels contain mostly ferrite in the as-built parts due to rapid solidification of the printed layers. To achieve duplex microstructures (ferrite and austenite in roughly equal proportions) and, thus, a good combination of mechanical properties and corrosion resistance, an austenitic stainless steel powder (X2CrNiMo17-12-2) and a super duplex stainless steel powder (X2CrNiMoN25-7-4) were mixed in different proportions and the powder mixtures were processed via PBF-LB/M (Laser Powder Bed Fusion) under various processing conditions by varying the laser power and the laser scanning speed. The optimal process parameters for dense as-built parts were determined by means of light optical microscopy and density measurements. The austenitic and ferritic phase formation of the mixed alloys was significantly influenced by the chemical composition adjusted by powder mixing and the laser energy input during PBF-LB/M. The austenite content increases, on the one hand, with an increasing proportion of X2CrNiMo17-12-2 in the powder mixtures and on the other hand with increasing laser energy input. The latter phenomenon could be attributed to a slower solidification and a higher melt pool homogeneity with increasing energy input influencing the phase formation during solidification and cooling. The desired duplex microstructures could be achieved by mixing the X2CrNiMo17-12-2 powder and the X2CrNiMoN25-7-4 powder at a specific mixing ratio and building with the optimal PBF-LB/M parameters.
1. Introduction
Duplex stainless steels consist of a two-phase microstructure (roughly 50% ferrite and 50% austenite) combining the beneficial properties of ferritic and austenitic stainless steels [1,2]; they typically show high strength, toughness and superior corrosion resistance (particularly chloride stress corrosion and chloride pitting corrosion). Compared to austenitic stainless steels such as X2CrNiMo17-12-2 steel, duplex stainless steels contain higher amounts of chromium and molybdenum, with both being ferrite stabilizing elements and lower amounts of nickel being an austenite stabilizer. In addition, nitrogen is added to the steels to improve corrosion resistance and high-temperature stability of the duplex structure by stabilizing the austenite; furthermore, interstitially dissolved nitrogen leads to an increase in strength through solid solution strengthening without significant deterioration of the elongation at fracture [3]. The high strength of duplex stainless steels provide significant cost benefits since thinner sections for the components can be used; they are therefore used extensively in the offshore oil and gas industry and in the chemical industry [1,2].
Laser additive manufacturing of metals has been of great interest in recent years. A wide range of metallic materials, such as nickel alloys, titanium alloys, aluminum alloys, copper alloys as well as iron-based alloys, have been processed via laser additive manufacturing [4,5,6,7,8]. Steel grades available for laser additive manufacturing are mainly austenitic stainless steels, maraging steels, precipitation hardenable stainless steels, as well as tool steels. The steels described above satisfy typical requirements of the material properties required for successive PBF-LB/M production; this means that they provide, inter alia, a sufficient weldability to prevent crack formation during fast solidification and cooling during PBF-LB/M [8].
Nevertheless, laser additive manufacturing of duplex stainless steels has not been reported extensively. The duplex microstructure with a roughly equal proportion of ferrite and austenite is not achievable in the as-built condition using conventional duplex stainless steels, such as X2CrNiMoN22-5-3 or X2CrNiMoN25-7-4 [9,10,11]. The as-built parts show a mainly ferritic microstructure due to high cooling rates (~106 K/s), which suppresses the transformation from δ-ferrite to austenite during cooling in laser additive manufacturing. The limited solubility of nitrogen in ferrite leads to the formation of chromium nitrides, negatively influencing the corrosion behavior and mechanical properties of these steels [10,12]. To attain the duplex microstructure and eliminate unwanted phases, the parts can be further processed by heat treatment (solution annealing) [13,14]. Austenite is reported to form at subgrain boundaries or lattice defects during the heat treatment; however, the solution treatment leads to a reduction of dislocation density, resulting in lower hardness and strength of the annealed parts [10,11,15].
The Schaeffler diagram is an empirical description of the microstructures of the weld metal that result from welding different compositions [16]. It is divided into different zones, for example, austenite (A), ferrite (F), martensite (M) as well as various mixed zones, depending on the Cr equivalent and the Ni equivalent of the alloys; this diagram has been used to predict the cast or weld metal microstructures in austenitic stainless steels and duplex stainless steels; however, it is known that the Schaeffler diagram does not predict duplex microstructures very well when the weld metal is solidified rapidly [17]. The A + F zone is narrowed when the solidification rate is increased. The upper limit of the A + F zone is shifted downwards, and the lower limit upwards [18]. The duplex stainless steels may have a very small amount of austenite in rapid solidification conditions, as shown in the laser additively manufactured parts [9,10,11].
In order to attain duplex microstructure in the as-built state, Köhler et al. mixed an austenitic stainless-steel powder (AISI 316L) with a duplex stainless steel powder (AISI 318LN) at various mixture ratios and built parts via L-PBF (Laser Powder Bed Fusion) process using different energy densities [19]. It was reported that 30 wt% AISI 318LN added to AISI 316L leads to an A/F (roughly 50/50) microstructure in the as-built condition. The strength, as well as the corrosion resistance of this new alloy, is superior to that of pure AISI 316L. In addition to the properties, ferritic-austenitic phase formation was addressed, which was reported to be extremely sensitive to different energy inputs. The influencing factor was assumed to be the different cooling modalities with different energy inputs. Chemical homogeneity, without determining it quantitatively, was seen as another factor determining phase formation in the processing of powder mixtures; however, in this work, the influence of different laser energy inputs on the solidification behavior and, thus, on the ferritic and austenitic phase fractions, was not fully understood. For this reason, it is of interest to gain a deeper understanding of how different chemical compositions and different laser energy inputs influence the phase composition of PBF-LB/M processed duplex stainless steels. In this context, it is also of interest how energy density-dependent chemical heterogeneities affect the phase formation when using powder mixtures.
The present work is motivated by the partial lack of knowledge about the phase formation of duplex stainless steels in the PBF-LB/M process when using powder mixtures as a function of chemistry and energy input, taking into account chemical homogeneity; thus, the objective of this study is to understand if and how the addition of pre-alloyed austenitic steel powders to pre-alloyed duplex stainless steel powders can reduce the formation of delta ferrite in powder blends to the extent that the as-built parts have a microstructural phase ratio of as close to 50% austenite and 50% ferrite as possible. As an important factor, the influence of the volume energy on the component quality and microstructure is to be focused on in particular. Therefore, an austenitic stainless steel X2CrNiMo17-12-2 (AISI 316L) was mixed with a super duplex stainless steel X2CrNiMoN25-7-4 (AISI F53) at various mixing ratios. A parameter study on the base alloys X2CrNiMo17-12-2, X2CrNiMoN25-7-4 and the mixed alloy 50% X2CrNiMo17-12-2 + 50% X2CrNiMoN25-7-4 was conducted to determine the influence of the key laser parameters on the porosity of the as-built parts. The optimal process parameters were subsequently used to build parts from the further powder mixtures. The microstructure of the base alloys and the mixed alloys were investigated by means of light optical microscopy (LOM), image analysis, X-ray diffraction methods (XRD) and electron backscatter diffraction (EBSD). The influence of laser energy input on the chemical homogeneity and microstructure of the duplex stainless steels and the phase transformation during PBF-LB/M were addressed.
2. Materials and Methods
2.1. Initial Steel Powder
An austenitic stainless steel X2CrNiMo17-12-2 (AISI 316L) and a super duplex stainless steel X2CrNiMoN25-7-4 (AISI F53) were selected as the base alloys for the alloy mixing. The austenitic stainless steel powder (Printdur 4404, −53 + 20 µm) was delivered from Deutsche Edelstahlwerke Specialty Steel GmbH & Co. KG, Krefeld, Germany, and the duplex stainless steel powder (SAF2507, −63 + 20 µm) was delivered from Sandvik Osprey Limited, Neath, UK. Both steel powders were atomized with nitrogen gas. The chemical composition of the powders is presented in Table 1 (provided by the powder suppliers).

Table 1.
Chemical composition of the initial powders and the powder mixtures (in mass %).
2.2. Powder Mixing
The X2CrNiMoN25-7-4 powder was mixed with the X2CrNiMo17-12-2 powder by using a 3D shaker mixer (TURBULA® Type T2F) at a rotating speed of 101 min−1 for 6 min in a 500 mL container with a total mass of 200 g. The proportions of the two powders were varied as follows (in mass %):
- 25% X2CrNiMo17-12-2 + 75% X2CrNiMoN25-7-4 (Mixture 25-75)
- 50% X2CrNiMo17-12-2 + 50% X2CrNiMoN25-7-4 (Mixture 50-50)
- 60% X2CrNiMo17-12-2 + 40% X2CrNiMoN25-7-4 (Mixture 60-40)
- 75% X2CrNiMo17-12-2 + 25% X2CrNiMoN25-7-4 (Mixture 75-25)
The mixing container turns in a three-dimensional motion (rotation, translation and inversion). A homogeneous powder mixture could be achieved in a very short mixing time due to the ever-changing, rhythmically pulsing motion. The calculated average chemical composition of the powder mixtures is depicted in Table 1.
2.3. PBF-LB/M Parameter Study
Cubic samples (4 × 4 × 5 mm3) were manufactured on a PBF-LB/M facility Aconity MINI (Aconity, Herzogenrath, Germany) equipped with a single-mode fiber laser (maximal laser power of 400 W); they were built on a platform of AISI 304 stainless steel with a diameter of 140 mm. The process chamber was purged with nitrogen gas with a high purity of 99.99% and the oxygen content in the process chamber was lower than 50 ppm.
The qualities of the parts strongly depend on the process settings. To determine the optimal process parameters a parameter study was carried out for the X2CrNiMo17-12-2 alloy, for the X2CrNiMoN25-7-4 alloy and the mixed alloy 50% X2CrNiMo17-12-2 + 50% X2CrNiMoN25-7-4, respectively. The volume energy introduced via the laser can be considered as a central parameter [8], which determines the melting and microstructure formation behavior in the PBF-LB/M process; this volume energy density EV under the various process conditions is calculated according to the following equation [20,21]:
where P is the laser power, H is the hatch distance, v is the scanning speed, and L is the thickness of the layer.
In order to adjust the laser energy input in the parts, the key parameters laser power was varied in the range of 200–350 W, and laser scan speed was varied in the range of 400–1200 mm/s. The other process parameters were kept constant and are listed in Table 2. The volume energy density in the function of laser power and laser scan speed is presented in Figure 1, where the points plotted correspond to the parameter values used for the parameter study. EV is varied in the range from 33 J/mm3 to 175 J/mm3.

Table 2.
PBF-LB process parameters.
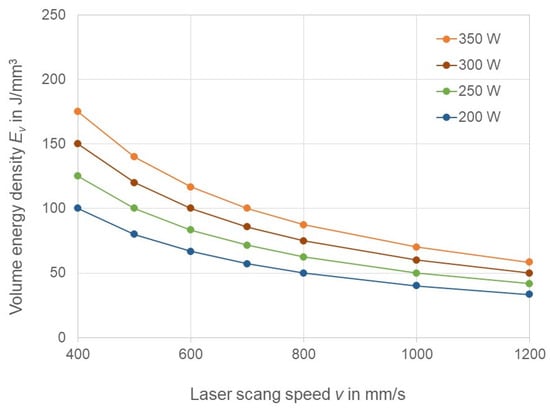
Figure 1.
Laser energy density in the function of laser power and laser scan speed.
In addition to the small cubes, cubic samples with a dimension of 10 × 10 × 5 mm3 were built with a laser power of 250 W and a laser scan speed of 800 mm/s (referred to as standard parameters) in the corresponding build jobs. These are used for XRD, spark-optical emission spectrometry (S-OES) and EBSD measurements.
2.4. Powder Analysis
The particle size distributions of the initial powders were determined by means of a laser diffraction testing instrument (Malvern Mastersizer 2000, Malvern, UK). The particle morphology was investigated by scanning electron microscopy (SEM, CAMSCAN CS44, Cambridge, UK). The particle microstructure was investigated by light optical microscopy (LOM, Axiophot, ZEISS, Jena, Germany). The flowability of the powders was determined by means of Hall flow-testing (funnel opening Ø2.5 mm) according to ISO 4490:2018. The apparent density was measured according to ISO 697:1981. The tap density of the powder was measured after 1250 tap cycles with a JEL STAV II device (J. Engelsmann AG, Ludwigshafen, Germany).
2.5. Material Characterization of PBF-LB/M Parts
The as-built parts were detached from the building platform by applying wire-electro-discharge machining; they were characterized by means of light optical microscopy, subsequent digital image analysis and XRD. The parts were cut in a vertical (building) direction and mounted in resin. The vertical sections of the parts were ground with sandpapers (120/320/600/1200 SiC-Grits) and polished with 3 µm diamond suspension and 0.02 µm SiO2 suspension. The macro sections of the parts were examined with a Leica MZ16 stereomicroscope and the microstructure was investigated using a light microscope (Zeiss Axioplan, Jena, Germany). The parts were etched with the color etchant Beraha I (100 mL stock solution (1000 mL H2O + 200 mL HCl + 24 g (NH4)HF2) + 1 g K2S2O5) for 15 s, except that the parts of 75% 316L + 25% X2CrNiMoN25-7-4 was etched with the color etchant Lichtenegger und Bloech (100 mL H2O + 20 g (NH4)HF2 + 0.5 g K2S2O5) for 5 min to distinguish the ferritic and austenitic phase fraction and their morphology. The porosity of the parts was determined by image analysis on the macro section images. The software ImageJ (Version 1.53c, Bethesda, MD, USA) was used for this investigation. The resolution of the images is about 5.8 µm/Pixel.
2.6. Ferritic and Austenitic Phase Quantification
Phase quantification in PBF-LB/M-manufactured ferritic-austenitic steels was addressed in the publication by Becker et al. [22]; there, among others, the powder mixtures 25-75, 50-50, and 75-25 shown in the present work served as a basis. Within the scope of the investigations by Becker et al., XRD using the Bragg–Brentano geometry and subsequent quantification by the Rietveld method was evaluated as a valid method for quantification; however, in the present work, quantitative image analysis and XRD using the Debye-Scherrer method are also considered, which were already determined for the powder mixtures mentioned in the work by Becker et al. Only the phase quantification for the Mixture 60-40 was determined for the present work. The different phase quantification methods are described as follows:
- (1)
- Bragg–Brentano + Rietveld:
Phase quantification using the Rietveld method was carried out with the aid of MAUD software [22]. For elimination of the XRD device-specific reflection broadening, evaluations were performed using Al2O3 powder (crystallography open database (COD card 1000032) having a grain size of less than 1 μm. The considered phases for phase quantification were fcc iron (COD card 9008469) and bcc iron (COD card 9008536).
The diffraction patterns, which served as the basis for the phase quantification using the Rietveld method, were recorded using a Bruker D8 Advanced system, which works according to the Bragg–Brentano method. The following parameters describe the measurement: emitted radiation: Cu-Kα with a wavelength of 1.5406 Å, 2ϴ range: 30–90°, step size: 0.02°, hold time per step: 10 s. During the experiment the sample was rotated around its vertical spatial axis so that the entire surface of the sample was scanned.
- (2)
- Debye–Scherrer method:
For the quantitative phase analysis using the Debye–Scherrer procedure a mobile X-ray diffractometer of type µ-X360n (Pulstec) was used; this emits Cr-Kβ radiation with a wavelength of 0.22898 nm. The voltage used was 30 kV and the beam was focused using a 2 mm collimator. The working distance was 20 ± 0.5 mm and the X-ray incidence angle was 18°. With the help of this arrangement, the (220) austenite and the (221) ferrite reflexes were detected. Based on the intensity of these two reflections, the phase quantification was carried out according to ASTM E975-13 [22].
2.7. EBSD/EDS
EBSD investigations were carried out on the PBF-LB/M-produced powder mixture 60-40 to show, as an example, how the ferritic and austenitic phase fractions are arranged. For this purpose, a MIRA3 scanning electron microscope (Tescan) equipped with a Nordlys nano detector (Oxford) and Aztec software (Oxford) was used. The acceleration voltage of the electron beam was 20 keV, and the working distance was 17 mm with a step distance of 0.26 µm, a binning factor of 4 × 4 and an exposure time of 7.98 ms. In order to obtain information about the distribution of the chemical elements in addition to the phase distribution, an EDS mapping was recorded at the same time. For this, an Aztec Energy Advanced System from Oxford Instruments was used.
3. Results and Discussion
3.1. Powder Properties
The particle morphology of both the X2CrNiMo17-12-2 powder and the X2CrNiMoN25-7-4 powder is shown in Figure 2. The powders, particularly the X2CrNiMo17-12-2 powder, show many particles in irregular shape and many satellite particles; this indicates intensive collision of the particles during gas atomization. Under turbulent conditions in gas atomization, finer particles move faster and solidify more quickly than coarse ones and fine solidified particles may collide with coarse particles (in a liquid or semi-solid state), resulting in the physical joining of the particles [23]. In addition, many large particles seem to have insufficient time to spheroidize before solidification is completed.
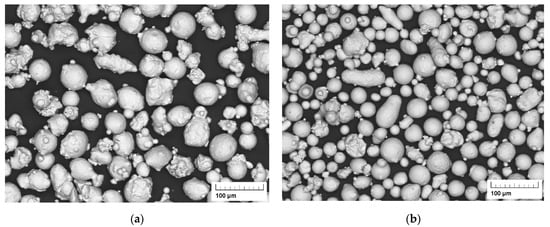
Figure 2.
SEM images of particle morphology of the initial powders: (a) X2CrNiMo17-12-2; (b) X2CrNiMoN25-7-4.
The representative polished sections of the powder particles are presented in Figure 3. There is only a low amount of hollow particles. Both powders were atomized with nitrogen (N2) gas. It is known that the gas porosity in the N2-atomized powders is much lower than that in the Ar-atomized powders. N2 gas which is entrapped in the molten droplets during gas atomization would tend to dissolve and redistribute throughout the droplets, whereas entrapped argon remains as a gas-containing bubble [24].

Figure 3.
Light micrographs of polished cross-sections of the initial powders: (a) X2CrNiMo17-12-2; (b) X2CrNiMoN25-7-4.
The particle size distributions of the X2CrNiMo17-12-2 powder and the X2CrNiMoN25-7-4 powder are shown in Figure 4. The X2CrNiMo17-12-2 powder shows a relatively large particle size compared to the X2CrNiMoN25-7-4 powder. The median particle diameter d50 of the X2CrNiMo17-12-2 powder and the X2CrNiMoN25-7-4 powder is about 43 µm and 41 µm, respectively. There are very few fine particles (smaller than the nominal lower fraction limit of 20 µm) in the powders.
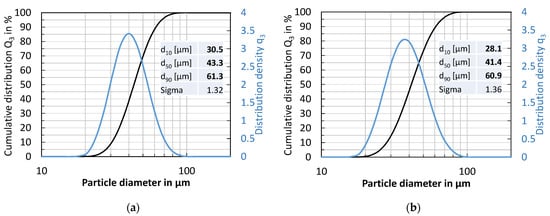
Figure 4.
Particle size distribution of the initial powders: (a) X2CrNiMo17-12-2; (b) X2CrNiMoN25-7-4.
The flow property and the packing density of the respective powders are listed in Table 3. The Hausner ratio H, which is used in a wide variety of industries as an indication of the flowability of a powder, is calculated according to Equation (2)
where is the freely settled bulk density (apparent density) of the powder, and is the tap density of the powder. A Hausner ratio larger than 1.25–1.4 is considered to be an indication of poor flowability [25].

Table 3.
Powder properties.
The two initial powders show good flowability, although many large particles have an irregular shape and satellite particles. The good flowability of the powders, which is favorable for the homogeneous spreading of the powders in PBF-LB/M as well as the formation of a powder layer with high relative density, should be associated with the relatively large particle size (particularly the X2CrNiMo17-12-2 powder). The bulk density of the X2CrNiMo17-12-2 powder is higher than that of the X2CrNiMoN25-7-4 powder, possibly due to the better flow property and relatively high density (8.0 g/cm3 for X2CrNiMo17-12-2 and 7.8 g/cm3 for X2CrNiMoN25-7-4). In addition, the powder properties of the powder mixture 50-50, which fall between those of the two initial powders, are also given in Table 3.
3.2. Porosity of As-Built Parts and Process Window
The cubes of one building job are shown in Figure 5. The cubic samples have a cross-section of 4 mm × 4 mm and a height of 5 mm. The outer surface of the samples built with various process parameters looks quite different. It is smooth and shiny at high laser energy input, while it is rough and matt at low laser energy input; this indicates that high laser energy input enhanced the melting and fusion of the powder particles. Large and hot welding pools could be achieved at high laser energy input.
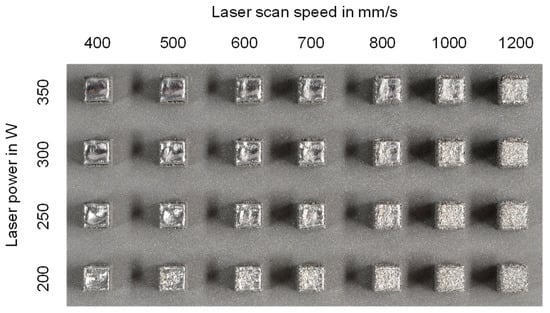
Figure 5.
Examples of as-built cubes in the function of laser power and laser scan speed (Top view, part dimension: 4 × 4 × 5 mm3, alloy: X2CrNiMoN25-7-4).
The chemical composition of the as-built samples was determined using S-OES (QSG750, OBLF GmbH, Witten, Germany) and the results are given in Table 4. The chemical composition of the as-built parts is very close to that of the corresponding initial powders and powder mixtures. The nitrogen content of the as-built parts is slightly lower than that of the powders, indicating possible degassing during PBF-LB/M (as reported by Boes et al. [26]).

Table 4.
Chemical composition of the as-built parts using the initial powders and the various powder mixtures was determined using S-OES (in mass %).
The porosity of the as-built parts in various processing conditions is presented in Figure 6, Figure 7 and Figure 8. It is clearly seen that the porosity is influenced by the laser energy input during PBF-LB/M processing. At high energy inputs (for example, a laser power of 350 W and laser scan speed of 400 mm/s), there are a few spherical or near-spherical pores in the parts. At low laser energy inputs (for example, laser power 200 W and laser scan speed 1200 mm/s), plenty of pores in irregular shapes appear.
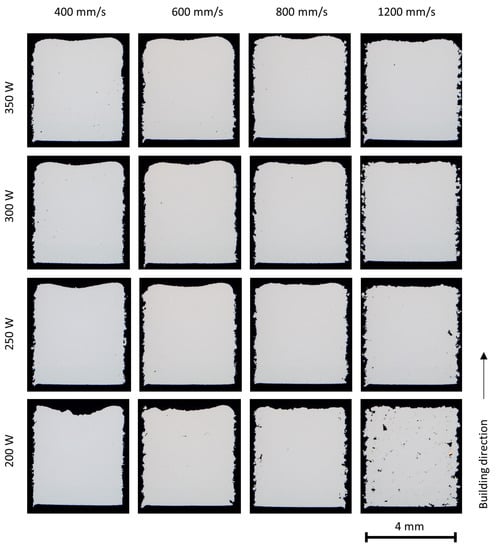
Figure 6.
Stereo microscopy of the X2CrNiMo17-12-2 parts (4 × 4 × 5 mm3) built with various process parameters.
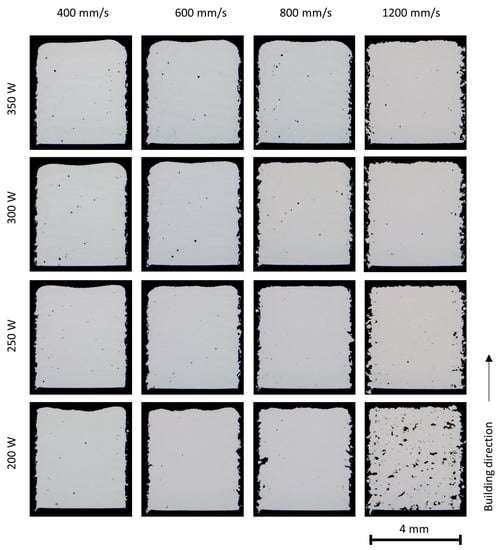
Figure 7.
Stereo microscopy of the X2CrNiMoN25-7-4 cubes (4 × 4 × 5 mm3) built with various process parameters.
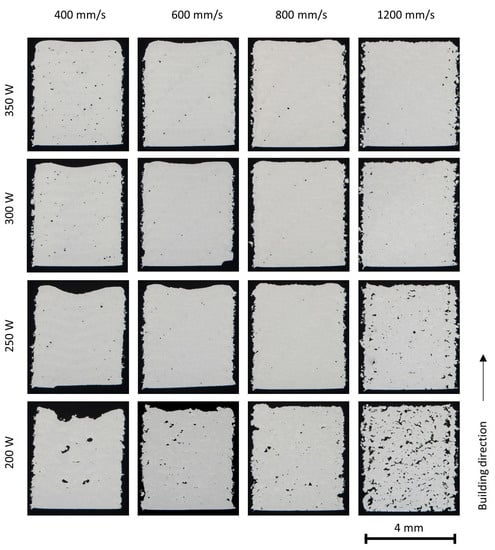
Figure 8.
Stereo microscopy of the 50% X2CrNiMo17-12-2 + 50% X2CrNiMoN25-7-4 cubes (4 × 4 × 5 mm3) built with various process parameters.
The irregular pores, known as lack of fusion pores, are caused by insufficient melting and fusion of the powder particles. Higher laser energy density leads to a more complete melting of the particles and an increasing overlap between two adjacent layers, reducing or eliminating the lack of fusion pores [8,27]; however, with too high a laser energy input, the melting mode will transit to the keyhole mode [28]. Large keyhole pores in near-spherical shape are generated at the melt pool bottom when the vapor cavity formed due to metal evaporation collapses.
Pore bands were observed in the parts built at relatively high laser energy input; this is more clearly seen in the parts of duplex stainless steels, and is attributed to the scan strategy. In this study, a stripe pattern scan strategy with a 10 mm stripe length and a rotation of 37° in the scan direction between the successive layers was applied. The laser scan vector may end or start inside the parts at specific layers. At the starting point and the end point of a laser scan vector, the laser scan speed is lowered due to the limitation of the scanner mechanism and the resultant high laser energy input often leads to keyhole porosity.
In general, the X2CrNiMo17-12-2 steel powder showed excellent welding ability and dense parts could be built in a broad process window. A higher amount of porosity has been found in the duplex stainless steel X2CrNiMoN25-7-4 and in the mixed alloys. The differences in porosities could possibly be attributed to the powder properties and the physical properties of the alloys, such as surface tension and viscosity as well as laser absorption ability.
The porosity values of the as-built parts, which were determined based on image analysis, are given in Figure 9. A highly dense part (99.9% relative density) could be achieved with a laser power of around 250 W and a laser scan speed of around 800 mm/s for all three alloys; this parameter set is therefore determined as the standard parameter for all the rest powder mixtures.

Figure 9.
Porosity of the parts built with various process parameters: (a) X2CrNiMo17-12-2; (b) X2CrNiMoN25-7-4; (c) 50% X2CrNiMo17-12-2 + 50%X2CrNiMoN25-7-4.
3.3. Influence of Chemistry on the Microstructure
Based on the porosity of the as-built parts, the parameter set with a laser power of 250 W and a laser scan speed of 800 mm/s was determined as the standard parameter set for the various powder mixtures. The microstructures of the parts built with the standard parameters are presented in Figure 10. By etching with Beraha I, austenite remains white while ferrite appears blue or brown. By etching with Lichtenegger and Bloech (only for Mixture 75-25), the ferrite appears white while austenite is colored.
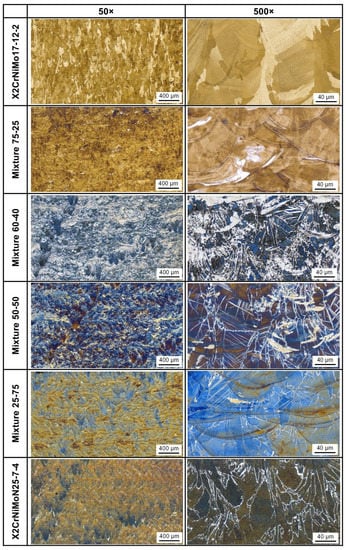
Figure 10.
Light optical microscopy of the as-built parts from the initial powders and the various powder mixtures. The parts were built under the standard process condition (Laser power 250 W, laser scan speed 800 mm/s). The etchant Beraha I was used for all the samples except the sample Mixture 75-25, which was etched with Lichtenegger and Bloech. Building direction is upward for all images.
The austenitic stainless steel X2CrNiMo17-12-2 (AISI 316L) exhibits a completely austenitic microstructure in the as-built condition, while the duplex stainless steel X2CrNiMoN25-7-4 shows a very small amount of austenite at the ferrite grain boundaries; moreover, the common epitaxial grain growth in the building direction, extended over several successive layers, can be observed in the as-built parts. The high temperature gradient and high solidification velocity of the melt pools promote such grain structures [29]. The content of austenite increases with increasing the X2CrNiMo17-12-2 proportion in the powder mixtures. The Cr equivalent is remarkably reduced with the increasing proportion of the austenitic stainless steel in the powder mixture, which is favorable for the formation of austenite.
The austenite in the PBF-LB/M samples can be classified into three categories in terms of their distinctive morphology and size; this includes the austenite at the ferrite grain boundaries, the Widmanstätten austenite across the ferrite grains and the austenite isles at the melting pool boundaries. The first formation of austenite grains develops with the process of nucleation and growth at the ferrite grain boundaries. In addition, the austenite can also precipitate in the form of Widmanstätten plates at the grain boundaries or intergranularly within ferrite grains [30,31].
In this study, Widmanstätten plates of austenite are formed inside the ferrite in the case of the mixed alloys (for example, Mixture 25-75 and Mixture 50-50). Austenite isles are also formed at the melt pool boundaries as the proportion of X2CrNiMo17-12-2 is increased, particularly in the mixed alloys Mixture 50-50 and Mixture 60-40. The Widmanstätten austenite is also increased with the addition of X2CrNiMoN25-7-4 to the powder mixture, both in size and in the amount. It was reported that Widmanstätten austenite forms from 700 °C to 1100 °C in duplex stainless steel close to X2CrNiMoN25-7-4 [32]. At 800–900 °C, the Widmanstätten austenite can easily decompose into fragments resulting from the inter-diffusion of alloying elements. As the Widmanstätten plate growth observed in the PBF-LB/M samples is continuous, it may be inferred that its formation occurs at the upper-temperature limits.
The microstructure of the mixed alloy Mixture 75-25 is completely different compared to other mixtures. The matrix is austenite and a very small amount of ferrite is observed (white phase revealed by Lichtenegger und Bloech). The ferrite is mainly distributed at the melt pool boundaries.
The inhomogeneity of microstructures in different regions of the as-built parts can be attributed to the incomplete fusion of the powder mixtures. The so-called “intrinsic heat treatment (IHT)” induced by the complex thermal cycles in PBF-LB/M also increases the inhomogeneity of the microstructures.
The austenite contents of the as-built duplex stainless steels, which were determined by Becker et al. [22] for mixtures 25-75, 50-50 and 75-25 by XRD and image analysis, are presented in Figure 11; moreover, the austenite level of Mixture 60-40, which was determined within the present work, is displayed; it shows clearly that the austenite content increases with the increasing proportion of X2CrNiMo17-12-2 powder in the mixed alloys. The duplex microstructure (roughly 50% austenite and 50% ferrite) is expected to be achieved by mixing approximately 55% X2CrNiMo17-12-2 powder with 45% X2CrNiMoN25-7-4 powder.
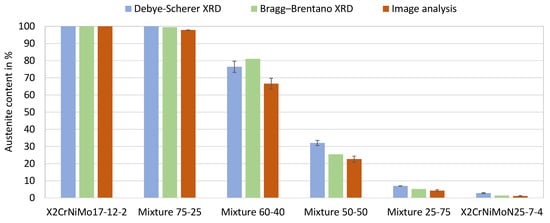
Figure 11.
Phase fractions in the as-built duplex stainless steels. The parts were built under the standard process condition (Laser power 250 W, laser scan speed 800 mm/s).
3.4. Influence of Laser Energy Input on the Microstructure
In the previous section, it was shown how the microstructure and the correlating austenitic and ferritic phase fractions change as a function of the chemical composition. Now the influence of different laser energy inputs on the microstructure and in particular on the proportions of the ferritic and austenitic phases is to be discussed on the basis of light microscopic images and, as an example, on an EBSD and EDS mapping.
The influence of laser energy input on the microstructure of the monolithic duplex stainless steel X2CrNiMoN25-7-4 is clearly seen in Figure 12. The white austenite phase at the grain boundaries is revealed by the etchant Beraha I. In addition, fine austenite particles are also precipitated in the ferrite at higher laser powers such as 300 W and 350 W. The austenite content increases considerably with increasing the laser power, indicating that slow solidification during PBF-LB/M is favorable for the austenite precipitation; this is attributed to the lower cooling rates with higher energy inputs, which provide more time for the solid-state transformation from δ-ferrite to austenite; furthermore, it is conceivable that the lower solidification rate causes stronger melt segregation with austenite-stabilizing elements such as Ni; this can lead to a higher austenite content at the end of solidification.
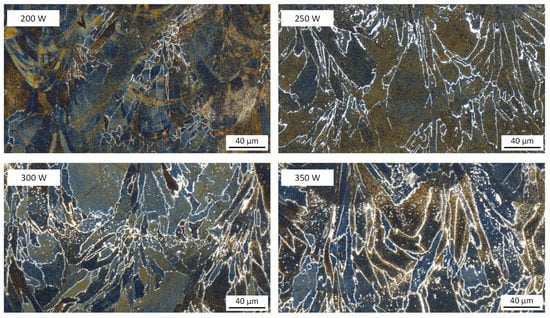
Figure 12.
Influence of laser energy input on the microstructure of the monolithic duplex stainless steel X2CrNiMoN25-7-4 (laser power 200–350 W, laser scan speed 800 mm/s), examined by using light optical microscopy. Building direction is upward for all images.
The influence of laser energy input on the microstructure of the duplex stainless steel powder mixture is shown in Figure 13. There is much more austenite in the mixed stainless steel 50% 316L + 50% X2CrNiMoN25-7-4 (Mixture 50-50), compared to the monolithic X2CrNiMoN25-7-4. The size and the amount of the Widmanstätten plates increase significantly with decreasing the laser scan speed. As the laser energy input is increased, the cooling time increases, resulting in more nitrogen diffusion in ferrite and subsequent growth of austenite predominantly as Widmanstätten plates across the ferrite grains. Similar results have been found in laser-welded samples [33]. On the other hand, the large austenite isles in rapid solidification conditions (laser scan speed 1000 mm/s) are probably caused by incomplete fusion of the X2CrNiMo17-12-2 and the X2CrNiMoN25-7-4.
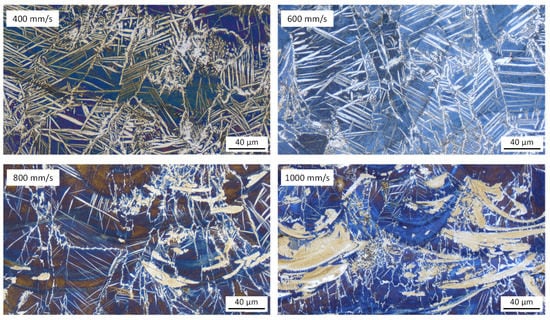
Figure 13.
Influence of laser energy input on the microstructure of Mixture 50-50 (laser power 250 W, laser scan speed 400–1000 mm/s), examined by using light optical microscopy. Building direction is upward for all images.
The aforementioned results can also be seen from the EBSD and EDS images in Figure 14, which shows the microstructure of the mixture 60-40. First of all, it can be seen from the phase image that the ferritic matrix is mainly located in the lower melt pool regions. In addition, ferrite is seen sporadically on the grain boundaries and within the austenite grains. The grain orientation image shown in Figure 14b shows different grain types. On the one hand, elongated grains are detected in the direction of the center of the melt pool, which have grown along the maximum temperature gradient, while on the other hand, in the melt pool center, where the elongated grain growth ends, there are finer equiaxed grains. In addition, individual grains extend across melt pool lines, suggesting the occurrence of epitaxial grain growth. The elemental distributions of Cr and Ni belonging to the EBSD mapping are shown in Figure 14d–e. It can be clearly seen that the ferritic areas in Figure 14a have a higher concentration of the ferrite-stabilizing element Cr, while a lower Ni content is detected at these locations; this suggests that the formation of the ferrite isles is due to a lack of melt mixing during PBF-LB/M fabrication. Areas with higher proportions of X2CrNiMoN25-7-4 tend towards ferritic solidification while a locally higher concentration of X2CrNiMo17-12-2 powder particles favors austenitic solidification. The same effect is suspected for the formation of austenite isles already seen in further discussion. Since it cannot be ruled out at this point that the local difference in chemical composition was only induced afterwards, e.g., by the secondary energy input from the melting and cooling of the subsequent layers, further investigations are still required. In the future, it is conceivable to compare pre-alloyed powders with powder mixtures of the same chemical composition. In this way, the effect of chemical heterogeneity in the use of powder mixtures and specifically on the solidification and the associated phase composition can be clearly characterized.
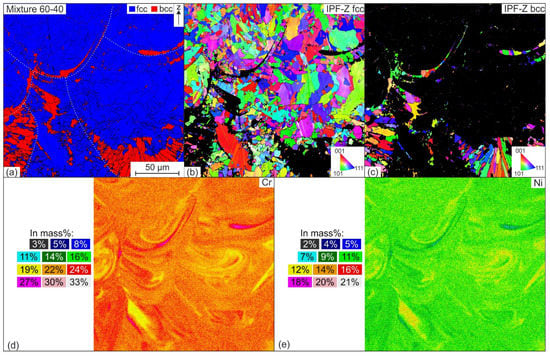
Figure 14.
EBSD and EDS measurements of Mixture 60-40: (a) phase image, (b,c) inverse pole figures in the z-direction; elemental distribution of (d) Cr and (e) Ni.
3.5. Thermodynamic Calculation
To help interpret and discuss the experimental results of the microstructural investigations, thermodynamic equilibrium calculations and Scheil solidification calculations were performed with Thermo-Calc software (Version 2020a, Database TCFE7) on the austenitic stainless steel X2CrNiMo17-12-2, the duplex stainless steel X2CrNiMoN25-7-4 and the mixed steel 50% X2CrNiMo17-12-2 + 50% X2CrNiMoN25-7-4 (Figure 15). Equilibrium calculations are used to estimate the effect of chemical composition on the phase transformation. Scheil solidification calculations are used to predict the fractions of austenite and ferrite.
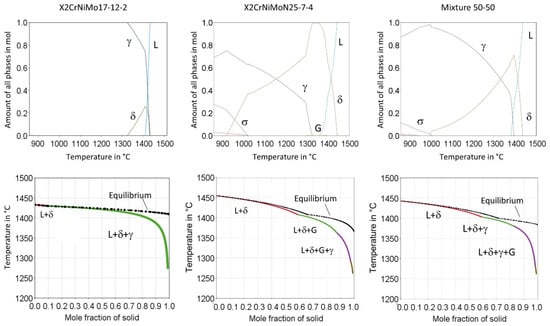
Figure 15.
Thermodynamic calculation of the austenitic stainless steel 316L and the duplex stainless steels.
For X2CrNiMo17-12-2 steel, simulations suggest that delta ferrite is firstly precipitated from the liquid phase and austenite is precipitated subsequently; however, it is known from the literature that at high cooling rates, primary austenitic solidification occurs preferentially to primary ferritic solidification due to formation-kinetic reasons [34]. Therefore, it is suspected that the performed Scheil simulations do not adequately describe the solidification conditions in the PBF-LB/M process for the steel X2CrNiMo17-12-2.
Solidification of the duplex stainless steel X2CrNiMoN25-7-4 starts in the ferrite phase, but ferrite transforms into austenite below the solidus temperature. Compared to the austenitic steel the range of ferrite is extended to lower temperatures with increased contents of Cr and Mo and lower Ni contents, leading to a higher ferrite fraction after solidification. It was shown that the austenitic phase fraction in the PBF-LB/M fabricated steel X2CrNiMoN25-7-4 was extremely low, and was also strongly dependent on the laser energy used. The different cooling modalities caused by different laser energies are not considered in the Scheil simulations. Accordingly, a comparison between simulation and reality is difficult. Nevertheless, the simulations provide a first idea about the solidification processes in the steel X2CrNiMoN25-7-4 during PBF-LB/M.
In the solidification simulation for the mixture 50-50, in addition to the inaccuracy mentioned, there is the problem of possible chemical heterogeneity, which has already been exemplified by the EDS mappings in Figure 14. Within the framework of the simulations, a melt with maximum homogeneity is assumed, which in the case of the mixture does not reflect reality in any way. For this reason, the simulations are not suitable for predicting solidification modalities, especially for the solidification of powder mixtures in the PBF-LB/M process.
Additionally, the alloys become more prone to sigma phase formation with increased contents of Cr and Mo and lower Ni contents. Similar results have also been reported by other researchers [19,35].
4. Conclusions and Outlook
The austenitic stainless steel X2CrNiMo17-12-2 powder and the super duplex stainless steel X2CrNiMoN25-7-4 powder were mixed in different proportions to achieve the duplex microstructures in the as-built condition.
The powder mixtures were processed via PBF-LB/M under different processing conditions by varying the laser power and the laser scanning speed. The optimal process parameters for dense parts were determined using light optical microscopy and density measurements.
The phase transformation of the mixed alloys was significantly influenced by the chemical composition of the alloys and the solidification rate of the parts.
- By increasing the proportion of X2CrNiMo17-12-2 powder in the powder mixtures and, therefore, an increasing amount of austenite stabilizer nickel in the powder mixture the austenite content could be increased.
- With increasing laser energy input and therefore increased overall sample temperatures and decreased solidification rate, the austenite content could be increased.
- The desired duplex microstructures (roughly 50/50 austenite/ferrite) could be achieved under appropriate processing conditions.
In future works, the mechanical specimens and the corrosion samples of the monolithic alloys and the mixed alloys will be built with ‘‘Standard’’ process parameters to maintain the same thermal input into the samples. The mechanical properties and the corrosion properties of the steels will be examined and compared.
Author Contributions
Conceptualization, C.C., L.B., J.B., J.L., V.U., M.S. and S.W.; methodology, C.C., L.B., E.G., J.B., J.L., V.U. and M.S.; software, C.C.; validation, C.C. and L.B.; formal analysis, C.C. and L.B.; investigation, C.C., L.B. and J.B.; resources, V.U., S.W and R.F.-H.; data curation, C.C. and L.B.; writing—original draft preparation, C.C. and L.B.; writing—review and editing, E.G., J.B., J.L., V.U., M.S., S.W. and R.F.-H.; visualization, C.C.; supervision, J.L., V.U, M.S. and S.W.; project administration, J.B., J.L., V.U. and M.S.; funding acquisition, V.U., S.W. and R.F.-H. All authors have read and agreed to the published version of the manuscript.
Funding
This research was funded by the German Research Foundation (DFG), grant number TH 531/20-2, UH 77/12-2, WA 1672/30-2.
Data Availability Statement
Data from the study presented can be received from the corresponding author upon request.
Acknowledgments
The authors thank the German Research Foundation (DFG) for its financial support within the research project “N-alloyed stainless steels for additive manufacturing using L-PBF—Fundamental investigations of powder production, microstructure formation and related material properties” (TH 531/20-2, UH 77/12-2, WA 1672/30-2).
Conflicts of Interest
The authors declare no conflict of interest.
References
- Charles, J. Duplex Families and Applications: A Review Part 1: From Duplex Pioneers up to 1991; Stainless Steel World, KCI Media Group: Shanghai, China, 2015. [Google Scholar]
- Gunn, R.N. Duplex Stainless Steels: Microstructure Properties and Applications; Abington Publishing: Cambridge, UK, 1997. [Google Scholar]
- Gavriljuk, V.G.; Berns, H. High Nitrogen Steels: Structure, Properties, Manufacture, Applications; Springer: Berlin, Germany, 1999. [Google Scholar]
- DebRoy, T.; Wei, H.L.; Zuback, J.S.; Mukherjee, T.; Elmer, J.W.; Milewski, J.O.; Beese, A.M.; Wilson-Heid, A.; De, A.; Zhang, W. Additive manufacturing of metallic components–Process, structure and properties. Prog. Mater. Sci. 2018, 92, 112–224. [Google Scholar] [CrossRef]
- Fayazfar, H.; Salarian, M.; Rogalsky, A.; Sarker, D.; Russo, P.; Paserin, V.; Toyserkani, E. A critical review of powder-based additive manufacturing of ferrous alloys: Process parameters, microstructure and mechanical properties. Mater. Des. 2018, 144, 98–128. [Google Scholar] [CrossRef]
- Gu, D.D.; Meiners, W.; Wissenbach, K.; Poprawe, R. Laser additive manufacturing of metallic components: Materials, processes and mechanisms. Int. Mater. Rev. 2012, 57, 133–164. [Google Scholar] [CrossRef]
- Herzog, D.; Seyda, V.; Wycisk, E.; Emmelmann, C. Additive manufacturing of metals. Acta Mater. 2016, 117, 371–392. [Google Scholar] [CrossRef]
- Yin, Y.; Tan, Q.; Bermingham, M.; Mo, N.; Zhang, J.; Zhang, M.-X. Laser additive manufacturing of steels. Int. Mater. Rev. 2021, 67, 487–573. [Google Scholar] [CrossRef]
- Davidson, K.; Singamneni, S. Selective Laser Melting of Duplex Stainless Steel Powders: An Investigation. Mater. Manuf. Process. 2016, 31, 1543–1555. [Google Scholar] [CrossRef]
- Hengsbach, F.; Koppa, P.; Duschik, K.; Holzweissig, M.J.; Burns, M.; Nellesen, J.; Tillmann, W.; Tröster, T.; Hoyer, K.-P.; Schaper, M. Duplex stainless steel fabricated by selective laser melting—Microstructural and mechanical properties. Mater. Des. 2017, 133, 136–142. [Google Scholar] [CrossRef]
- Saeidi, K.; Kevetkova, L.; Lofaj, F.; Shen, Z. Novel ferritic stainless steel formed by laser melting from duplex stainless steel powder with advanced mechanical properties and high ductility. Mater. Sci. Eng. A 2016, 665, 59–65. [Google Scholar] [CrossRef]
- Mohammed, G.R.; Ishak, M.; Aqida, S.N.; Abdulhadi, H.A. Effects of Heat Input on Microstructure, Corrosion and Mechanical Characteristics of Welded Austenitic and Duplex Stainless Steels: A Review. Metals 2017, 7, 39. [Google Scholar] [CrossRef] [Green Version]
- Papula, S.; Song, M.; Pateras, A.; Chen, X.-B.; Brandt, M.; Easton, M.; Yagodzinskyy, Y.; Virkkunen, I.; Hänninen, H. Selective Laser Melting of Duplex Stainless Steel 2205: Effect of Post-Processing Heat Treatment on Microstructure, Mechanical Properties, and Corrosion Resistance. Materials 2019, 12, 2468. [Google Scholar] [CrossRef] [Green Version]
- Saeidi, K.; Alvi, S.; Lofaj, F.; Petkov, V.I.; Akhtar, F. Advanced Mechanical Strength in Post Heat Treated SLM 2507 at Room and High Temperature Promoted by Hard/Ductile Sigma Precipitates. Metals 2019, 9, 199. [Google Scholar] [CrossRef] [Green Version]
- Kunz, J.; Boontanom, A.; Herzog, S.; Suwanpinij, P.; Kaletsch, A.; Broeckmann, C. Influence of hot isostatic pressing post-treatment on the microstructure and mechanical behavior of standard and super duplex stainless steel produced by laser powder bed fusion. Mater. Sci. Eng. A 2020, 794, 139806. [Google Scholar] [CrossRef]
- Guiraldenq, P.; Duparc, O.H. The genesis of the Schaeffler diagram in the history of stainless steel. Met. Res. Technol. 2017, 114, 613. [Google Scholar] [CrossRef]
- David, S.; Vitek, J.; Reed, R.; Hebble, T. Effect of Rapid Solidification on Stainless Steel Weld Metal Microstructures and Its Implications on the Schaeffler Diagram; Technical Report (ORNL/TM-10487); Oak Ridge National Laboratiry: Oak Ridge, TN, USA, 1987. [Google Scholar]
- Röttger, A. Ressourceneffizienz in der Werkstofftechnik; Ruhr-Universität Bochum: Bochum, Germany, 2020; ISBN 978-3-943063-36-3. [Google Scholar]
- Köhler, M.L.; Kunz, J.; Herzog, S.; Kaletsch, A.; Broeckmann, C. Microstructure analysis of novel LPBF-processed duplex stainless steels correlated to their mechanical and corrosion properties. Mater. Sci. Eng. A 2020, 801, 140432. [Google Scholar] [CrossRef]
- Thijs, L.; Verhaeghe, F.; Craeghs, T.; Van Humbeeck, J.; Kruth, J.-P. A study of the microstructural evolution during selective laser melting of Ti–6Al–4V. Acta Mater. 2010, 58, 3303–3312. [Google Scholar] [CrossRef]
- Sander, J.; Hufenbach, J.; Giebeler, L.; Wendrock, H.; Kühn, U.; Eckert, J. Microstructure and properties of FeCrMoVC tool steel produced by selective laser melting. Mater. Des. 2016, 89, 335–341. [Google Scholar] [CrossRef]
- Becker, L.; Boes, J.; Lentz, J.; Cui, C.; Uhlenwinkel, V.; Steinbacher, M.; Fechte-Heinen, R.; Theisen, W.; Weber, S. Quantification of extremely small-structured ferritic-austenitic phase fractions in stainless steels manufactured by laser powder bed fusion. Materialia 2022, 22, 101393. [Google Scholar] [CrossRef]
- Özbilen, S. Satellite formation mechanism in gas atomised powders. Powder Met. 1999, 42, 70–78. [Google Scholar] [CrossRef]
- Janowski, G.M.; Biancaniello, F.S.; Ridder, S.D. Beneficial effects of nitrogen atomization on an austenitic stainless steel. Met. Mater. Trans. A 1992, 23, 3263–3272. [Google Scholar] [CrossRef]
- Cain, J. An alternative technique for determining ANSI CEMA standard 550 flowability ratings for granular materials. Powder Hand. Proc. 2002, 14, 218–220. [Google Scholar]
- Boes, J.; Röttger, A.; Theisen, W.; Cui, C.; Uhlenwinkel, V.; Schulz, A.; Zoch, H.-W.; Stern, F.; Tenkamp, J.; Walther, F. Gas atomization and laser additive manufacturing of nitrogen-alloyed martensitic stainless steel. Addit. Manuf. 2020, 34, 101379. [Google Scholar] [CrossRef]
- Tan, Q.; Liu, Y.; Fan, Z.; Zhang, J.; Yin, Y.; Zhang, M.-X. Effect of processing parameters on the densification of an additively manufactured 2024 Al alloy. J. Mater. Sci. Technol. 2020, 58, 34–45. [Google Scholar] [CrossRef]
- King, W.E.; Barth, H.D.; Castillo, V.M.; Gallegos, G.F.; Gibbs, J.W.; Hahn, D.E.; Kamath, C.; Rubenchik, A.M. Observation of keyhole-mode laser melting in laser powder-bed fusion additive manufacturing. J. Mater. Process. Technol. 2014, 214, 2915–2925. [Google Scholar] [CrossRef]
- AMertens, A.; Reginster, S.; Contrepois, Q.; Dormal, T.; Lemaire, O.; Lecomte-Beckers, J. Microstructures and Mechanical Properties of Stainless Steel AISI 316L Processed by Selective Laser Melting. Mater. Sci. Forum. 2014, 783–786, 898–903. [Google Scholar] [CrossRef]
- Kim, Y.J. Phase Transformations in Cast Duplex Stainless Steels, Ames (IA); Ames Lab: Ames, IA, USA, 2004. [Google Scholar]
- Lippold, J.C. Welding Metallurgy and Weldability; John Wiley & Sons, Inc.: Hoboken, NJ, USA, 2015. [Google Scholar]
- Ohmori, Y.; Nakai, K.; Ohtsubo, H.; Isshiki, H. Mechanism of widmannstätten austenite formation in a delta/gamma duplex stainless steel. ISIJ Int. 1995, 35, 969–975. [Google Scholar] [CrossRef]
- Muthupandi, V.; Srinivasan, P.B.; Seshadri, S.; Sundaresan, S. Effect of weld metal chemistry and heat input on the structure and properties of duplex stainless steel welds. Mater. Sci. Eng. A 2003, 358, 9–16. [Google Scholar] [CrossRef]
- Leone, G.L.; Kerr, H.W. The Ferrite to austenite transformation in stainless steels. Weld. J. 1982, 61, 13–21. [Google Scholar]
- Köse, C.; Kaçar, R. Mechanical Properties of Laser Welded 2205 Duplex Stainless Steel. Mater. Test. 2014, 56, 779–785. [Google Scholar] [CrossRef]
Publisher’s Note: MDPI stays neutral with regard to jurisdictional claims in published maps and institutional affiliations. |
© 2022 by the authors. Licensee MDPI, Basel, Switzerland. This article is an open access article distributed under the terms and conditions of the Creative Commons Attribution (CC BY) license (https://creativecommons.org/licenses/by/4.0/).