Article

On the Accurate Prediction of Residual Stress in a Three-Pass Slot Nickel-Base Repair Weld by Numerical Simulations

1
Department of Mechanical, Aerospace and Civil Engineering, University of Manchester, Sackville Street, Manchester M13 9PL, UK
2
Materials Industrial Research and Technology Centre (MIRTEC), 32200 Ritsona, Greece
3
Australian Nuclear Science and Technology Organisation (ANSTO), Lucas Heights, NSW 2234, Australia
4
School of Mechanical and Manufacturing Engineering, University of New South Wales Sydney, Kensington, NSW 2052, Australia
5
EC2-Modélisation, 69100 Villeurbanne, France
6
Institute for Nuclear Research (INR), 115400 Pitesti, Romania
7
Department of Mechanical Engineering, Imperial College London, South Kensington Campus, London SW7 2AZ, UK
*
Author to whom correspondence should be addressed.
J. Manuf. Mater. Process. 2022, 6(3), 61; https://doi.org/10.3390/jmmp6030061
Submission received: 21 April 2022 / Revised: 18 May 2022 / Accepted: 27 May 2022 / Published: 1 June 2022

Abstract

:
The activities within a European network to develop accurate experimental and numerical methods to assess residual stresses in structural weldments are reported. The NeT Task Group 6 or NeT-TG6 project examined an Alloy 600 plate containing a three-pass slot weld made with Alloy 82 consumables. A number of identical specimens were fabricated and detailed records of the manufacturing history were kept. Parallel measurement and simulation round robins were performed. Residual stresses were measured using neutron diffraction via five different instruments. The acquired database is large enough to generate reliable mean profiles, to identify clear outliers, and to establish the systematic uncertainty associated with this non-destructive technique. NeT-TG6 gives a valuable insight into the real-world variability of diffraction-based residual stress measurements, and forms a reliable foundation against which to benchmark other measurement methods. The mean measured profiles were used to validate the accuracy achieved by the network in the prediction of residual stresses.

1. Introduction

Welding involves severe thermal and mechanical loads occurring simultaneously [1,2] which result in cyclic inelastic deformation of the material adjacent to the fusion zone, and thus generate residual distortions and stresses in the component. Residual stresses (RS) within a component can adversely affect its structural integrity and reduce its lifetime as it becomes more susceptible to degradation mechanisms such as stress corrosion cracking, fatigue and creep [3,4,5,6]. Weld residual stresses in Nickel alloys are important due to the susceptibility of such alloys to primary water stress corrosion cracking when used as part of dissimilar metal welds (DMW) in pressurized water reactor primary circuits in nozzles, boiler tubes and penetrations of the reactor pressure vessel, among others [7,8,9]. These alloys are used because they offer similar thermal expansion coefficients to low alloy pressure vessel steels [10,11]. Nickel Alloy 600 is commonly used in applications that operate in demanding environments that involve high temperatures and require corrosion resistance to both organic and inorganic compounds and alkaline solutions [12]. The use of the matching filler, Alloy 82, in dissimilar metal welds has been shown to affect the susceptibility of such welds to primary water stress corrosion cracking (PWSCC) [13]. It is thus essential to accurately estimate residual stresses in these components after welding, especially in cases where there is no option for heat treatment to relieve them, and where they might affect the structural integrity of nuclear safety critical components [14,15,16].
The European Network on Neutron Techniques Standardization for Structural Integrity (NeT) was first established in 2002 with the mission to develop improved experimental and numerical methods and standards to reliably characterize residual stresses in structural welds. Previous benchmarks launched by the network have developed best practices for accurate finite element (FE) prediction and measurement of weld residual stresses in a single weld bead laid on an AISI 316L plate, NeT Task Group 1 (NeT-TG1) [17,18,19,20,21], and in a three-pass weld deposited in a slot in an AISI 316L(N) plate, NeT Task Group 4 (NeT-TG4) [22,23,24,25]. The Net Task Group 6 project (NeT-TG6) was started in early 2012. It examines a three-pass slot weld made in an Alloy 600 plate with Alloy 82 filler using the tungsten-inert-gas (TIG) welding process. To date, the network have reported residual stress measurements [26], thermo-mechanical material properties [27], material characterization practices [28] and a preliminary overview of the modelling campaign [29]. This study presents the RS predictions of a simulation campaign conducted by several participants using a protocol. It first describes the manufacturing of the benchmark and the material characterization of the weld that was conducted and assisted the modelling. It then describes the modelling methodology and finally presents a comparison of the RS predictions and a robust Bayesian mean of measurements.

2. Materials and Methods

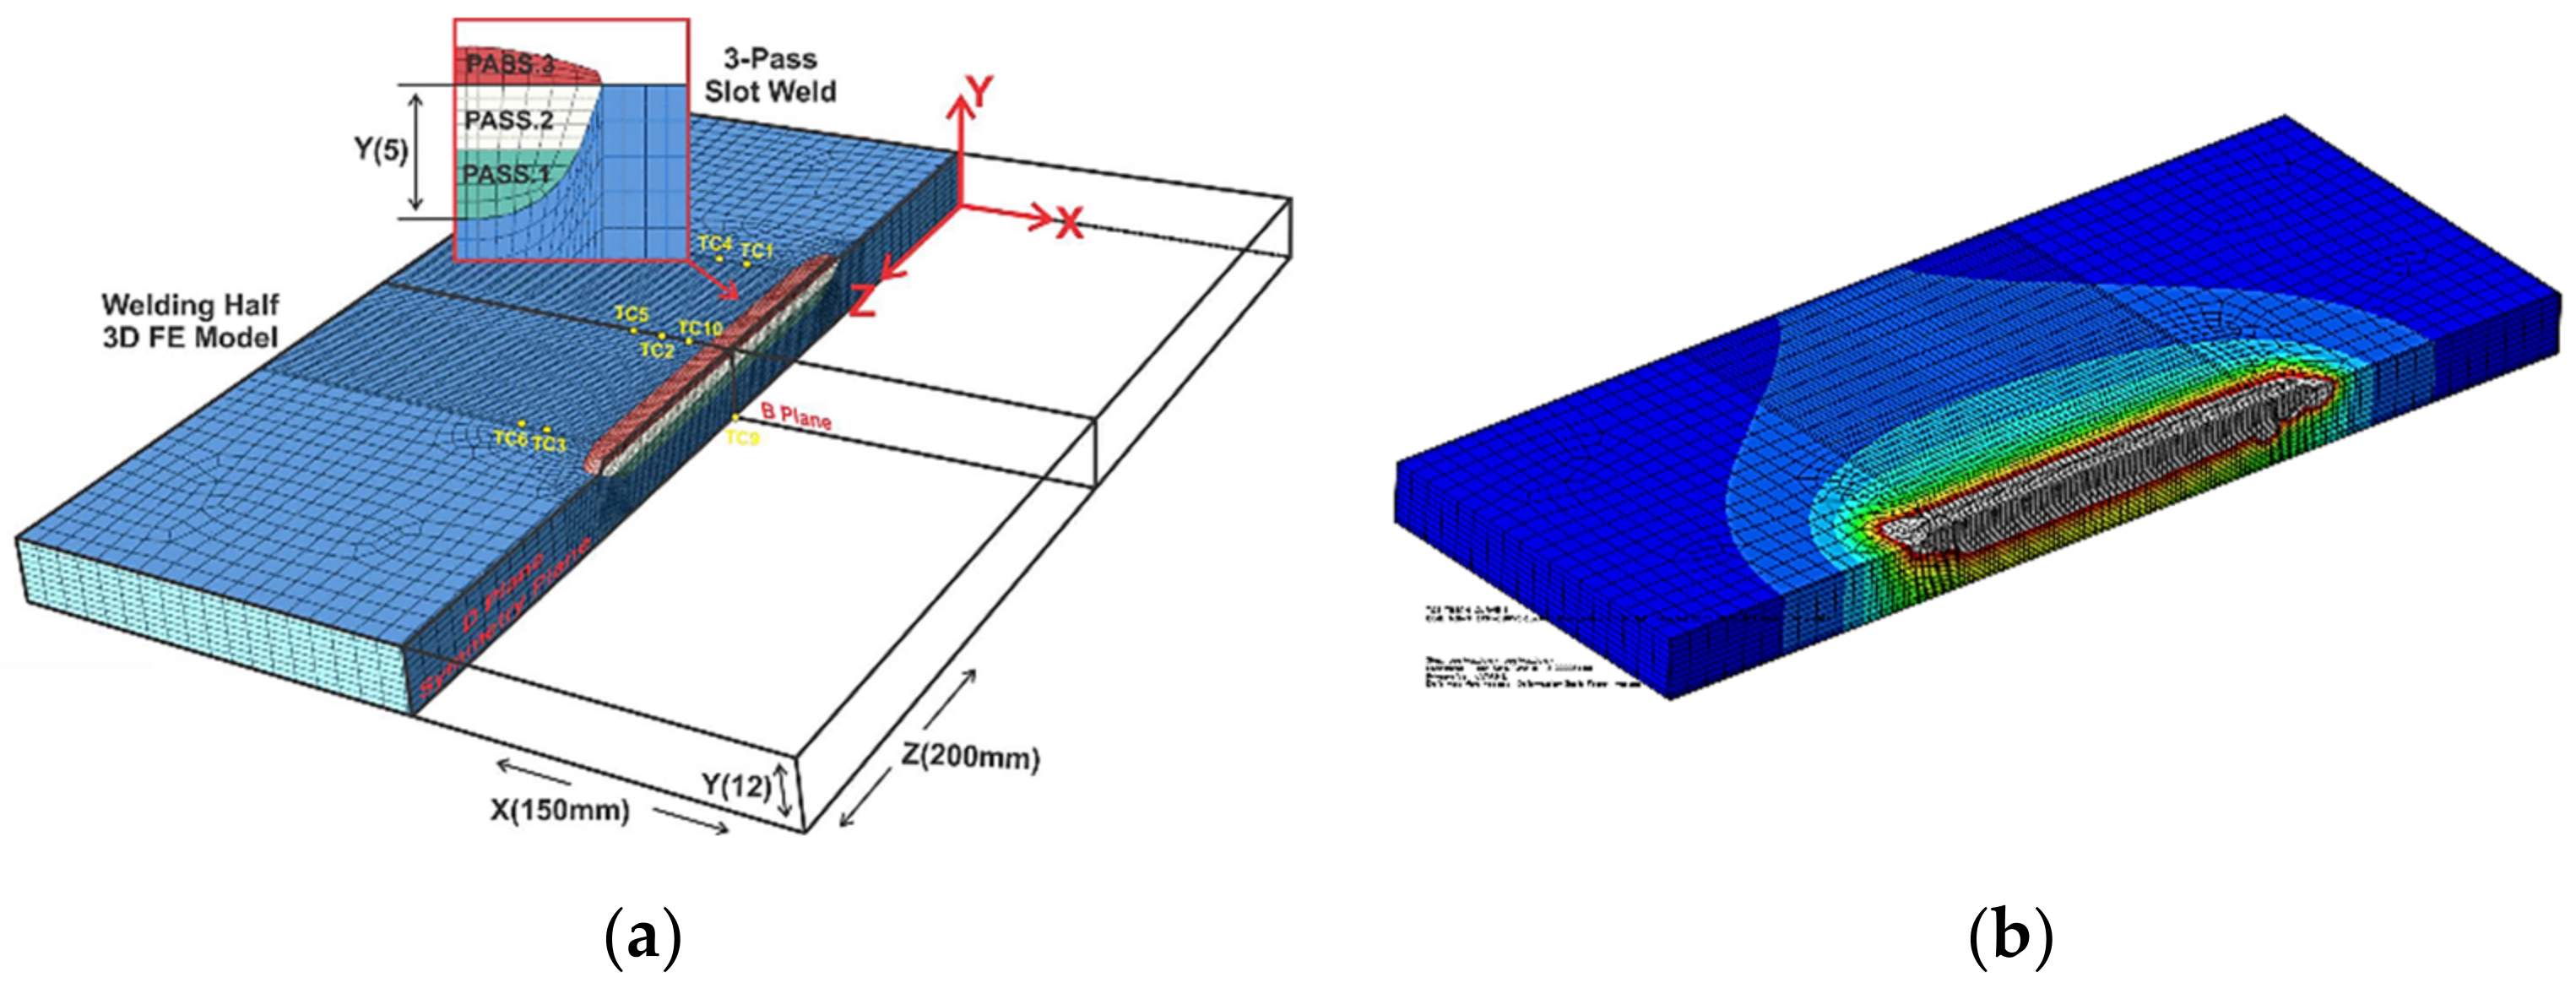
2.1. The NeT-TG6 Benchmark Specimen

The NeT-TG6 specimen is an Alloy 600 Ni-Cr alloy plate (also referred to as Inconel 600), with a machined slot in the middle of the top surface, filled with three superimposed weld passes of Alloy 82 filler made using a TIG welding process. The chemical compositions and mechanical properties of the base and filler materials are presented in Table 1 and Table 2, respectively. An automated TIG welding machine was employed for welding the plates at the Électricité de France (EdF) laboratory in Chatou in France. Figure 1 shows a typical NeT-TG6 specimen before and after welding, and the drawings with the dimensions of the plate and the slot size. The dimensions were carefully selected to allow for sufficient structural self-restraint of the plate while remaining thin enough to ensure that neutron diffraction (ND) measurements of RS are still feasible. Figure 1c illustrates planes D and B that correspond to the longitudinal plane along the weld centre line (WCL) and the transverse plane at weld middle length (WML), respectively. Figure 1e,f shows the thermocouple positions at the top and back face, respectively
Nine specimens were successfully manufactured in three batches. The weld process parameters are summarized in Table 3. All specimens were instrumented with arrays consisted of 12 thermocouples. The specimens were left unclamped and free to distort during welding. Laser distortion measurements were conducted on all plates after welding, and on one plate an in-process measurement was performed after each weld pass. One plate was used for an initial transverse contour method residual stress measurement (measuring longitudinal stresses), followed by extraction of stress-free reference pins for neutron diffraction measurements, and slices for material characterization and microscopy. The reference pins accompanied a second specimen in the neutron diffraction measurements round robin. A larger trial plate with three grooves was welded in the exact same way as the NeT-TG6 specimens, but the individual grooves were filled with one, two and three pass welds, respectively, and then used for characterization purposes. A transverse contour method cut was initially performed in the transverse plane at WML to study the evolution of residual stresses after each pass. Slices were then extracted to be used for optical metallography and Vickers micro-indentation studies in order to reveal the evolution of the fusion zone and the thermomechanical history of the materials after each subsequent pass. The inferred fusion boundary profiles along with the recorded thermocouple histories were used to calibrate the welding heat sources by all participants in the simulation round-robin.

2.2. Residual Stress Measurements Round Robin

Neutron diffraction residual stress measurements were performed on a single NeT-TG6 specimen, using neutrons from both reactor and neutron spallation sources. To date, five independent series of measurements have been performed, all controlled by a detailed measurements protocol [31]. Three orthogonal stress components were measured at defined locations along several defined lines. Measurements were also made on the stress-free reference pins extracted at representative locations from a second specimen. Data analysis was informed by simple macroscopic studies (i.e., metallography) to distinguish the fusion zone, as well as chemical composition studies such as electron micro-probe analysis that revealed dilution effects of each successive weld pool with melted parent material and re-melted weld beads.
Three different approaches were used to analyse the ND data.
  • The first was to use data from the reference pins to establish the stress-free lattice spacing. This method is well established, and was used successfully in NeT-TG4 round robin.
  • The second was based on position fitting. The laser scans of the plates after welding and the macrographs acquired were used to infer the exact measurement locations [28] in the deformed welded plate. In particular, the profiles of the plate used for reference pin extraction and the plate used for ND RS measurements were compared. Transverse cross sections at WML and longitudinal cross sections on the WCL were etched to reveal the fusion zone profiles. The RS measurements were modelled using SSCANSS [32] software to locate their exact positions in the deformed plate. The exact measurement locations of the gauge volume at each measurement point were then superimposed to the scanned profiles and the macrographs. This enabled the accurate estimation of a parent-weld fraction within the gauge volume at locations close to the fusion boundary.
  • The small thickness of the plate (~12 mm) also allowed also the calculation of theoretical strain-free values based on the assumption that the normal stress is almost zero. This approach was justified by the results of preliminary FE simulations [33].
The relatively large data set acquired at five instruments allowed the calculation of a Robust Bayesian Estimate (RBE) of the mean using the ‘Duff Data’ method individually for each stress component. The RBE of the mean has already been implemented within NeT Task Group 4 [34]. It is less susceptible to outliers, and thus allows a more reliable characterization of the residual stress distribution in the component. The actual RBE uncertainties were calculated by subtracting the systematic uncertainties from each data set, and provided a more realistic approximation of the uncertainties associated with the neutron diffraction measurements. Detailed descriptions of the measurements, the analysis methodology and the RBE calculation are given in [26].

2.3. Residual Stress Simulation Round Robin

The simulation round robin activities were controlled by a simulation protocol [33], which was followed by all participants and contained:
  • the plate geometry
  • a comprehensive list of the pre-programmed welding process parameters (reproduced in Table 3)
  • thermocouple data acquired from nine specimens obtained using the thermocouple array presented in Figure 1e,f
  • transverse weld fusion boundary profiles and cross-sectional areas for one, two, and three pass welds made in a trial plate using the exact welding parameters as for the NeT-TG6 specimens
  • Recommended thermo-physical and physical properties for Alloy 600 material
  • Recommended mechanical properties for Alloy 600 plate and Alloy 82 weld metal (discussed in more detail below)
Six organisations participated in the simulation campaign. These were The University of Manchester from UK (UoM), The Australian Nuclear Science and Technology Organisation (ANSTO), EC2 Modélisation from France (EC2), Imperial College from UK (IC), Institute of Nuclear Research in Romania (INR) and Doosan Babcock from UK (DB). A total of eleven simulations were completed and reported in sufficient detail. Details of the submitted analyses are given in Table 4. Three finite element packages were used, namely Code_Aster, ANSYS and ABAQUS, with the latter being the most popular. Model sizes varied considerably, incorporating between ~10,000 and ~100,000 elements. Both linear and quadratic elements were employed. Weld residual stress simulations are normally performed in two stages as uncoupled thermal and mechanical analyses, with the transient temperature field predicted by the thermal analysis used as the “load” for the subsequent mechanical analysis. Validation then also proceeds in two stages: the thermal solution is compared with temperatures measured by the thermocouple arrays, and the predicted fusion boundary profiles are compared with metallographic sections extracted from representative welded plates.

2.3.1. Thermal Analyses

Recall that the simulation protocol specified the plate geometry, the material properties, the weld paths and process parameters. These should not vary between participants. No recommendations were made on the handling of convective and radiative heat losses from the plates. Experience with previous NeT projects has shown that heat losses from the plates only affect the later stages of cooling when temperature gradients in the plate are small: they have little effect on the peak temperatures achieved as the weld torch traverses the plate. This leaves the implementation of the welding heat source as the key analysis variable to be examined.
The finite element thermal simulations of the welding process were conducted by employing volumetric heat sources with spatial flux distributions to represent the energy introduced by the arc to the weld pool. The best known example is the Goldak double ellipsoid heat source [35], although there are several types available, often incorporated into specialized welding heat-source fitting tools [36]. The weld deposition process can be simulated using a moving heat source, the entire bead can be deposited at once, and a so-called “block-dumped” analysis, or even a simple 2D analysis may be used [37,38,39]. These three options use progressively fewer computational resources. All participants in the round-robin performed 3D analyses. INR used a block dumped approach, which allowed the use of a quarter model with symmetry planes at planes B and D. The remaining participants performed moving heat source simulations, using half models with a single symmetry plane at plane D. An example model, developed by ANSTO and also used for UoM simulations, is presented in Figure 2a. This also shows the locations of the selected “virtual” thermocouples used for heat source calibration and the initially defined weld beads. Figure 2b shows an example of a calibrated thermal analysis, plotting the maximum temperatures reached throughout the three-pass welding process.
The recommended methodology to calibrate the thermal analysis was based on experience in the NeT-TG1 [17,40] and NeT-TG4 [23,41] round robins. The participants were given the following accuracy targets:
  • “The predicted cross-sectional area of fused weld/parent metal at mid-length of each of the three beads shall be within ±20% of the mean measured fused area of the trial beads.
  • The analysis should reproduce the observed mid-length transverse fusion boundary profiles.
  • The analysis should reproduce the observed longitudinal fusion boundary envelope.
  • The predicted increases in temperature, Δθ = (θpeak − θ0), at mid-length far-field thermocouple positions (TC5, TC7, TC8, TC9, and TC12, see [42]) should agree with the recommended mean measured increases, Δθmean, to within 10%. Note that results from symmetrically arranged thermocouples on opposite sides of the bead may be combined.
  • Analysts should strive to achieve similar levels of agreement for the mid-length near-field thermocouples (TC2, TC10 and TC11, see [42]), and for the thermocouple arrays at the start and stop ends.”
These accuracy targets are consistent with those recommended by the weld modelling guidelines in the R6 structural integrity assessment procedure [14,43]. A simple measure of the overall accuracy achieved by a simulation is the root-mean-square (RMS) error between predicted and measured temperature rises over a range of thermocouples. The RMS error was evaluated for the “far-field” thermocouples at weld mid-length, as follows:
Error RMS = 1 n n θ Ti , peak θ Ti , 0 Δ θ Ti , mean Δ θ Ti , mean 2
where n is the number of thermocouple responses taken into account, T is temperature, Δ is temperature rise, the suffixes Ti identify individual thermocouple locations, the suffix mean indicates mean measured data, and the suffixes 0 and peak refer to FE predictions of initial and peak temperature respectively.

2.3.2. Mechanical Analyses—Constitutive Behaviour

Experience with other NeT Task Groups has indicated that the assumed material constitutive behaviour is the most important variable affecting the final residual stress state in an unrestrained welded plate, once a calibrated thermal load is achieved.
The TG1 and TG4 benchmarks were made from AISI 316L steel, which exhibits mixed isotropic–kinematic hardening behaviour. The simulation campaigns for NeT-TG1 and NeT-TG4 showed that accurate predictions of the final residual stresses required the use of mixed isotropic–kinematic hardening models [24,25,40]. The testing performed on the NeT-TG6 materials showed that both Alloy 600 and Alloy 82 exhibit mixed hardening behaviour. Thus, participants in NeT-TG6 were advised to assume mixed hardening, and avoid simple isotropic and kinematic hardening.
The Lemaitre–Chaboche model is primarily designed to predict the material response upon cyclic loading, where the cyclic load can be imposed either mechanically or thermally [44]. The isotropic–kinematic formulation of this model allows the simulation of both the Bauschinger effect and cyclic hardening with plastic shakedown. Both are important phenomena during welding [45]. The isotropic hardening component, which defines the evolution of the yield surface, σ0, as a function of the equivalent plastic strain, is defined as follows:
σ 0 = σ | 0 + Q inf 1 e b ε ¯ pl
where σ|0 is the yield stress at zero plastic strain,   ε ¯ pl is the equivalent plastic strain and Qinf and b are material parameters. Qinf defines the maximum change in the yield surface size and b defines the rate at which the size of the yield surface changes as plastic strain develops. The kinematic hardening component is defined as a combination of a kinematic term and a relaxation term. The kinematic hardening law is defined as follows:
α · = i   C i 1 σ 0 σ α ε ¯ ˙ pl γ i α ε ¯ ˙ pl
where Ci and γi are material parameters, σ and α are the stress and back-stress tensors, σ0 is the equivalent stress defining the size of the yield surface, and ε ¯ ˙ pl is the equivalent plastic strain rate [44,45]. (Note that the translation of the yield surface in stress space is described via the back-stress tensor.). Thus, seven parameters must be fitted per temperature. This is usually achieved using data from an isothermal uniaxial symmetric strain-controlled cyclic test. Aside from yield strength σ|0, two parameters are fitted per back-stress tensor (i.e., C1γ1, C2γ2) to describe the kinematic hardening response and two parameters (Qinf, b) to describe the isotropic hardening component at each temperature. The choice of two back-stresses is based upon prior experience with AISI 316L steel, where this is sufficient to achieve an accurate response. Despite the large number of parameters in the fitted model, it is not possible to develop a single set of kinematic parameters that can accurately define the yield strength and hardening both for first loading (monotonic behaviour), and subsequent cyclic unloading and re-loading. It is also observed that the cyclic isotropic hardening behaviour is strain-range dependent.
An example of the different fitted behaviour achieved is presented in Figure 3. The experimental response of a 2.5% Tensile Strain Range (TSR) cyclic test at room temperature using Alloy 600 is plotted against the predicted stresses from two models. One model used Chaboche kinematic parameters fitted to the first monotonic response of the cyclic test data (cycle-1 fit) and the second used the reloading response after the first load reversal in compression (cycle-2 fit). It can be seen that both fitting strategies produce very similar stresses at the load reversals. However, the cycle-1 fit better describes the first monotonic response and produces a lower Bauschinger effect at the initial stages of yielding in the following cycles whereas the cycle-2 fit under-predicts the stresses during the initial stages of the first monotonic response and better captures the Bauschinger effect [46] thereafter. Isothermal cyclic test data were made available to NeT-TG6 participants in two stages:
  • The simulation protocol [42] included Alloy 600 test data obtained at 1.5% TSR, and surrogate data for the weld metal, namely 1.5% TSR testing performed on Alloy 182, the manual metal arc welding filler equivalent to Alloy 82.
  • Additional testing was performed at UoM using a spare plate of alloy 600 and a fabricated alloy 82 weld pad. The tests were performed at 2.5% TSR for temperatures between 20–600 °C and the results of this study are presented in [27].
Both raw test data and a series of Chaboche fits were supplied to the round robin participants in the simulation protocol, allowing them the option to re-fit the data if desired. In all cases the participants made use of the parameter fits, although EC2 used the data to fit an additional elasto-plastic mixed-hardening Prager model, and INR generated additional fits using three back-stresses. Some participants used the parameters fitted to the first monotonic response for both parent and weld material, while some used cycle-1 fitted parameters for parent material and cycle-2 fitted parameters for the weld, based on experience gained from TG4 specimens. UoM made use of data from the additional testing for a second contribution to the weld modelling campaign.
Unlike previous NeT Task groups, no simulations were performed using pure kinematic or pure isotropic hardening. The choices made for the simulations discussed here are given in Table 4. It is also customary to make assumptions about “annealing”—namely the temperature or temperature range over which a heated material loses its hardening “memory”. Most simulations used a simple, single-stage annealing functionality set at 1050 °C based on the observations made by the characterization studies (i.e. metallography, Vickers hardness). In ABAQUS, this defines the temperature at which the radius of the yield surface is reset to its unhardened level. As mentioned earlier, the specimen was unrestrained during welding. Therefore, the only constraints required were any symmetry planes plus restraint against rigid body motion. Temperature-dependent physical properties (Young’s modulus (E), Poisson ratio (v) and thermal expansion (α)) were provided in the protocol to all participants and used for both parent and the weld materials [42], and are presented in Table 5. The majority of mechanical analyses employed the Chaboche mixed isotropic–kinematic hardening model [44]. Table 6 lists the different sets of the temperature-dependent Chaboche hardening parameters as inferred from 1.5% and 2.5% TSR isothermal tests using Alloy 600 material. Table 7 lists the sets of the temperature-dependent Chaboche hardening parameters as inferred from 1.5% and 2.5%TSR isothermal tests on Alloy 182 and 82 weld metal, respectively.

3. Results and Discussion

An example of the thermocouple responses from nine NeT-TG6 specimens compared with the predicted responses for the third pass is given in Figure 4 for the thermocouples located at top and bottom surface at WML of the plate and nearby the start and stop positions. The repeatability of the recorded thermocouple histories was very good, as shown by the recorded thermal transients presented in Figure 4. The predicted responses are generally in very good agreement with the measured ones.
The RMS accuracy targets achieved for each weld pass were calculated based on the thermocouples on the top surface (i.e., TC2–TC11, TC5–TC12), those on the bottom surface (i.e., TC7–TC8 and TC9) of the plate, and all the mid-length far-field thermocouples. These are presented in Figure 5. All the thermal simulations achieved RMS errors of less than 10%, with the exception of the Doosan analysis for pass 3. The highest RMS errors were observed for the top surface thermocouples in the final pass. This is reasonable, since they are at their closest to the heat source and hence more sensitive to the details of the heat source such as its shape and size, in addition to its overall intensity.
The etched slices used for hardness and optical metallography studies are presented in Figure 6a,b. The macrographs revealed the fusion zone of each individual weld bead and a ~1 mm distinct coarse-grained heat affected zone (CGHAZ) surrounding the fusion boundary (Figure 6b). The CGHAZ appears to be much softer than the unaffected parent material in the hardness contour maps (Figure 6a). The latter also revealed an under-match between the mechanical properties of weld and parent and progressive cyclic hardening of parent material beneath the weld and in the first weld bead laid.
The measured and predicted fusion zones at WML are presented in Figure 6c. The predicted fusion zone shape and size at each pass is presented using the 1375 °C isotherm. The hardness maps acquired for the single pass weld in a three-slot plate may be compared with the predicted maximum temperatures reached in a calibrated thermal analysis to reveal two important features of material property development in the welded plates. The first is that the “soft parent” coarse-grained recrystallized zone develops when temperatures exceed ~1200 °C and the second is a zone adjacent to the coarse-grained region where the parent material ceases to harden in the temperature range between ~900 °C and ~1200 °C.

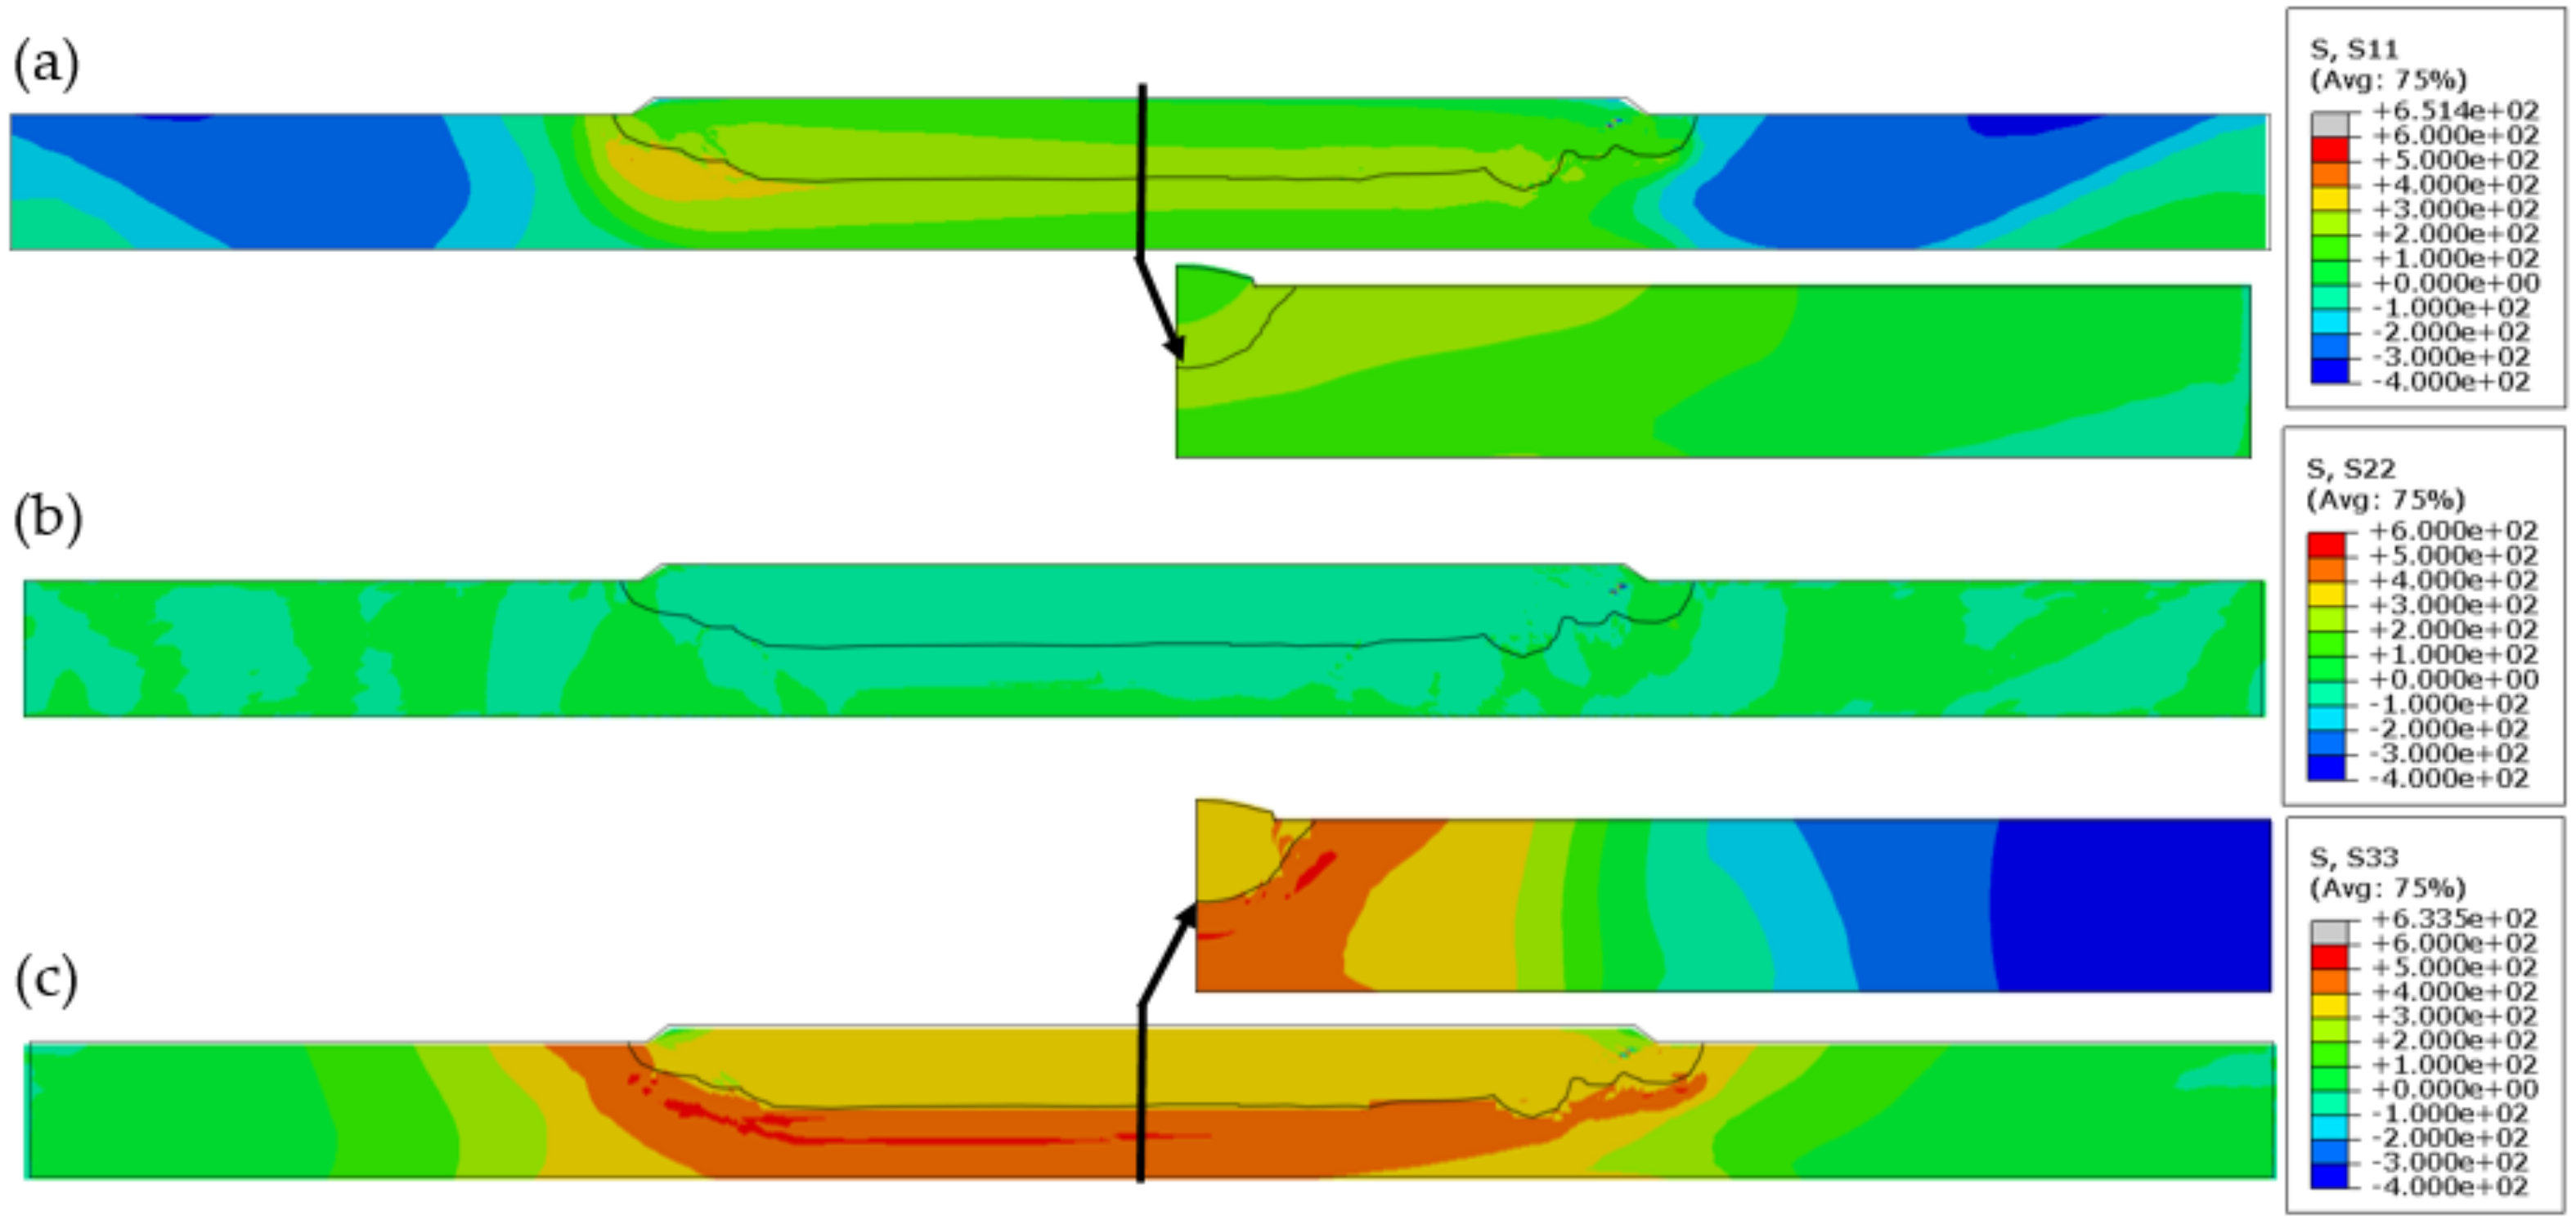
3.1. Contour Maps of Residual Stress Distribution

Contour maps for representative transverse, normal and longitudinal stresses on planes D and B are presented in Figure 7, for the UoM-B analysis. The assumed final fusion zone profile is indicated by a black line. The predicted stresses in the fusion zone are generally lower than those in adjacent parent material, especially in the longitudinal direction, due to the weld/parent under match. The transverse stresses are tensile at the centre of plane D, balanced by compressive stresses near the ends of the plate (Figure 7a). The simulations also predict reasonably low normal stresses on this thin plate (Figure 7b). The longitudinal stresses are tensile in the weld region, balanced by compressive stresses near the edges of the plate in plane B (Figure 7c). The developed stress distribution is indicative of the long-range structural restraint around the central slot containing the weld. A gradient in stress is observed along the weld, with the highest tensile stresses beneath the weld stop position, in both transverse and longitudinal directions.

3.2. Comparison Line Plots of Measured and Predicted Residual Stress Data
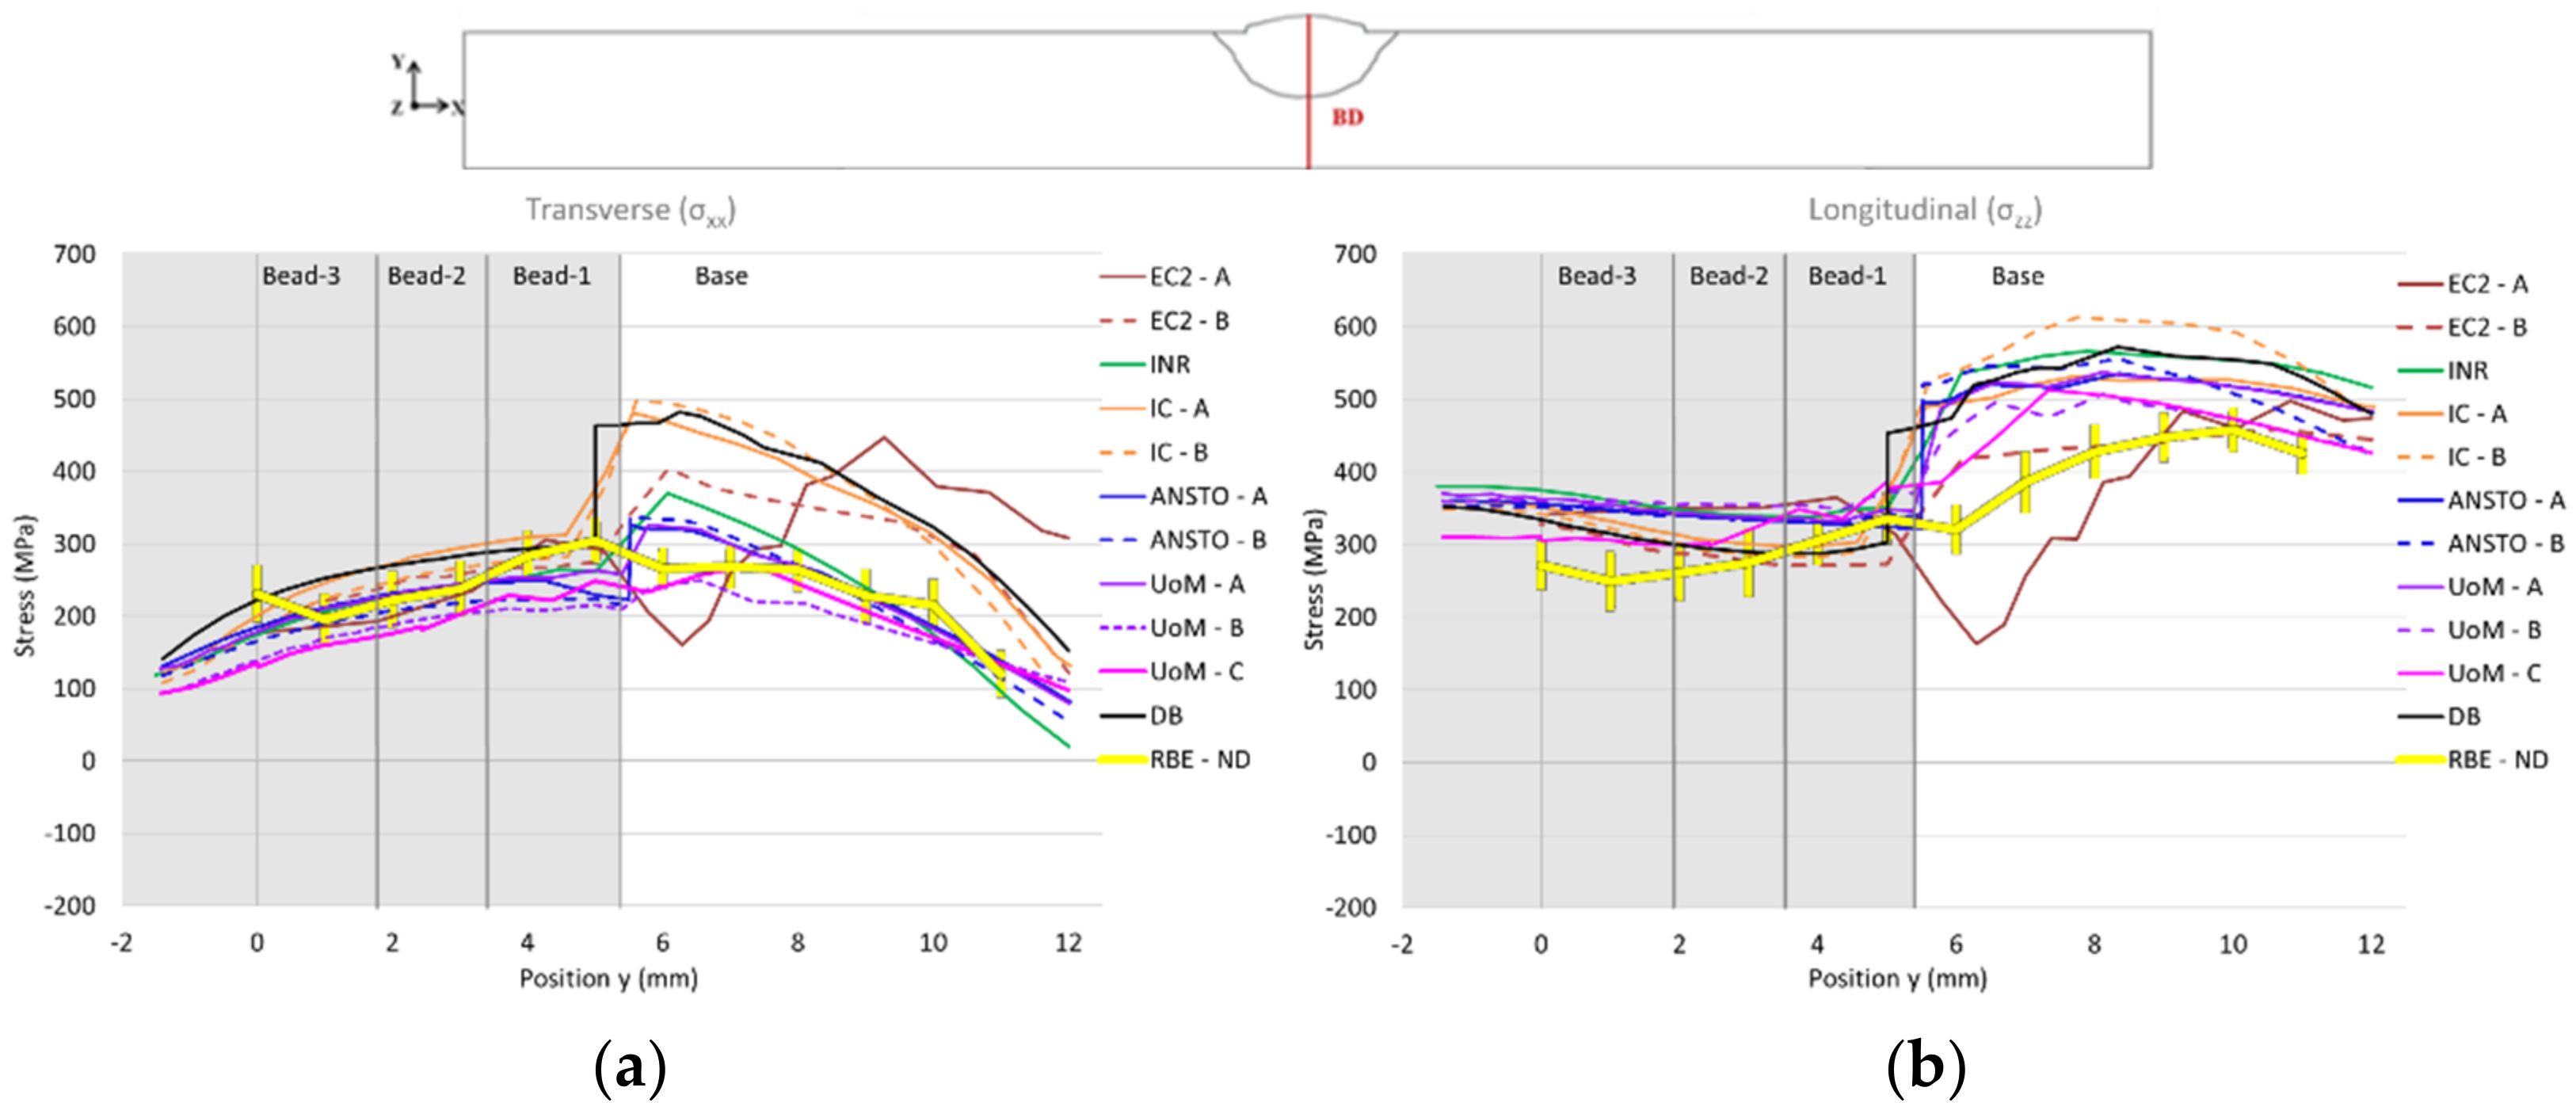
3.2.1. Line BD

Line BD is the most informative line for examining the accuracy of residual stress predictions, as it passes through several zones that have been subjected into different thermo-mechanical histories, namely the three weld beads, the HAZ, and the cyclically hardened parent zone near the back face. Transverse and longitudinal stress predictions from the simulation campaign are plotted in Figure 8. The RBE mean is plotted in yellow, and the error bars are the actual RBE uncertainties after subtracting the systematic uncertainty from each individual set [26]. The following observations may be made:
  • Both longitudinal and transverse measured stresses are tensile throughout the depth of the plate on line BD. The measured transverse stresses peak within the first pass of the weld metal and decrease to almost zero at the bottom surface of the plate (Figure 8a), whereas the longitudinal stresses are lower in the fusion zone than in the base metal, and then rise as the back face is approached (Figure 8b). The two stress components are similar in both distribution and magnitude within the fusion zone.
  • There is a general tendency to slightly over-predict longitudinal stresses over the whole depth of the plate. In particular, almost all simulations predict higher longitudinal stresses in the fusion zone where the second and the third passes have been laid which suggests that the just deposited material is softer than modelled. Additionally, all simulations over predict the longitudinal stresses in the CGHAZ and the adjacent cyclically hardened zone.
  • The UoM-C simulation performs better in the region adjacent to the fusion boundary as it takes into account a soft parent zone (Figure 8b). The EC-B simulation also predicts lower stresses in this region. It employed the Prager constitutive behaviour and a more aggressive annealing behaviour.
  • Most of the simulations predict the transverse stress profile reasonably well. The simulations that used Chaboche parameters fitted to 1.5% TSR cyclic tests appear to match measurements slightly better than those that used parameters fitted to 2.5% TSR cyclic tests, regardless of the annealing scheme employed. The latter tend to slightly under-predict the transverse stresses (Figure 8a).
  • Both the IC and the DB simulations predicted unusually high transverse stresses in the parent material ligament. This appears to be due to their modelling shorter weld beads than the remainder of the simulations (see discussion of line D7.5 below), which increases the structural restraint imposed on the weld region.
  • The EC2 simulations made use of an annealing scheme that affected both the kinematic back-stress and yield surface diameter, which is expected to be more aggressive in its effects on stresses near the fusion zone. In addition, the EC2-A simulation exhibited stress oscillations which appear to be associated with the Chaboche model implementation in Code_Aster.
  • The simulations that did not account for switching from parent to weld the material properties of regions that reached 1375 °C eventually ended with significant jumps in the stress prediction within the fusion zone. The jumps are more profound in the longitudinal stress component.

3.2.2. Line B2

Line B2 extends in the transverse direction 2 mm below the top surface at weld mid-length, and goes through the weld close to the pass-2 and pass-3 boundary. It also passes through the CGHAZ in the parent material either side of the weld. The longitudinal and transverse stress predictions from simulations are plotted with the calculated RBE stresses in Figure 9. The following observations may be made:
  • Most simulations predict the transverse stresses relatively well (Figure 9a). It should be noted that since ANSTO and UoM share the same thermal analysis, the lower stresses predicted in the UoM-B and UoM-C simulations are associated with the use of Chaboche parameters fitted to 2.5% TSR tests.
  • Longitudinal stresses are also predicted well (Figure 9b). There is noticeable scatter in predictions close to the weld fusion boundary. This is most probably due to a combination of differing assumptions about the weld/parent boundary location (and therefore the switch of properties), and whether the softer CGHAZ has been explicitly modelled.

3.2.3. Line D7.5

Line D7.5 is 7.5 mm below the top surface and extends along the welding direction in the cyclically hardened parent material underneath the weld that has undergone three thermo-mechanical cycles. Predicted and measured stresses are compared in Figure 10. The following observations can be made:
  • The transverse stress profiles appear to be more accurately predicted by simulations with lower RMS errors in the thermal solution (Figure 10a). This is evident both in the cyclically deformed parent zone underneath the fusion zone but also in the ligaments at the start and stop ends, where there is clear evidence that different simulations have assumed/predicted different weld bead lengths, with a consequent effect on the levels of tensile stress near the centre of the plate.
  • The measured longitudinal stresses in parent material beyond the weld zone are in good agreement with the simulations (Figure 10b). However, all the simulations over predict the tensile stresses in the cyclically hardened parent zone underneath the fusion zone. This is an area that presents challenges for both ND measurements, where the inferred stresses are affected by the proportion of weld and parent material assumed in the gauge volume, and for simulations, where weld, CGHAZ and parent material are all present, and not necessarily fully represented.

4. Conclusions

Nine NeT-TG6 specimens were manufactured using a robotic TIG welding process to ensure consistency, each instrumented with 12 thermocouples. This approach provides accurate definition of the thermal transients associated with welding for later use in simulations.
Post-welding microscopic characterization and hardness mapping determined that the Alloy 82 weld metal is under-matched compared with the Alloy 600 parent plate, and that both constituents show evidence of cyclic hardening due to the cyclic thermo-mechanical loading imposed during welding. They also revealed the presence of a soft re-crystallized coarse-grained heat affected zone adjacent to the fusion zone where temperatures exceeded ~1200 °C during welding
Isothermal cyclic testing performed on both alloy 600 plate and Alloy 82 extracted from a weld pad revealed that both materials show mixed isotropic–kinematic hardening behaviour, with a pronounced Bauschinger effect, and cyclic isotropic hardening at a lower rate than previously observed in the AISI 316L used for previous NeT benchmarks.
The neutron diffraction residual stress measurement round robin undertaken on NeT-TG6 produced reliable robust Bayesian estimates of the residual stress field with sufficient reliability to validate the results of the simulation round robin.
Most of the thermal simulations performed for NeT-TG6 achieved a root-mean-square error in the predicted weld mid-length temperature rises of better than ±10%. The most accurate analysis achieved RMS errors of 2.9% or less at the same location.
All simulation participants adopted mixed isotropic–kinematic hardening models. These models were calibrated relevant isothermal cyclic test data at two different strain ranges.
The predicted residual stresses were generally in good agreement with measured stresses, with the following areas where performance could be improved or there was significant scatter between different predictions:
  • The transition region between weld and parent material where the softened re-crystallized CGHAZ occurs. Most simulations over-predicted longitudinal stresses in this region.
  • The weld region itself, where there is evidence that longitudinal stresses are generally slightly over predicted.
  • Parent material in the ligament beneath the weld that does not reach temperatures where softening can occur. Here, transverse stresses in particular were affected by the differences in modelled weld length between simulations, and those simulations that modelled welds that were too short, over-predicted stresses.

Author Contributions

Conceptualization, weld modelling, writing, V.A.; conceptualization, supervision and review, M.C.S.; weld modelling, O.M.; weld modelling and review, A.V.; weld modelling, L.D.; weld modelling, V.D.; weld modelling, P.K. All authors have read and agreed to the published version of the manuscript.

Funding

This research was funded by the EPSRC Industrial CASE Award Nº1502808, and the EPSRC Fellowship in Manufacturing, “A whole-life approach to the development of high integrity welding technologies for Generation IV fast reactors”, EP/L015013/1.

Data Availability Statement

Not applicable.

Acknowledgments

The authors wish to acknowledge the contribution from Tamba Dauda from Doosan Babcock, who participated in the weld modelling campaign. The authors are also grateful and wish to acknowledge the substantial in-kind contributions made by Carsten Ohms (JRC, Petten) and Anastasios Youtsos (Democritus, Athens) the founders of NeT for 20 years now as well as all the participants within the NeT network for performing the non-destructive measurements. The authors would also like to acknowledge the support from EdF in France, who co-sponsored this research and fabricated the weldments.

Conflicts of Interest

The authors declare no conflict of interest. The funders had no role in the design of the study; in the collection, analyses, or interpretation of data; in the writing of the manuscript, or in the decision to publish the results.

References

  1. Withers, P.; Bhadeshia, H.K.D.H. Residual stress. Part 2—Nature and origins. Mater. Sci. Technol. 2001, 17, 366–375. [Google Scholar] [CrossRef]
  2. Radaj, D. Heat Effects of Welding: Temperature Field, Residual Stress, Distortion; Springer: Berlin/Heidelberg, Germany, 2012. [Google Scholar]
  3. Withers, P. Residual stress and its role in failure. Rep. Prog. Phys. 2007, 70, 2211–2264. [Google Scholar] [CrossRef] [Green Version]
  4. Francis, J.; Bhadeshia, H.K.D.H.; Withers, P. Welding residual stresses in ferritic power plant steels. Mater. Sci. Technol. 2007, 23, 1009–1020. [Google Scholar] [CrossRef]
  5. Bouchard, P. Residual Stresses in Lifetime and Structural Integrity Assessment. In Encyclopedia of Materials: Science and Technology; Buschow, K.H.J., Ed.; Elsevier: Oxford, UK, 2001; pp. 8134–8142. [Google Scholar] [CrossRef]
  6. Dak, G.; Pandey, C. A critical review on dissimilar welds joint between martensitic and austenitic steel for power plant application. J. Manuf. Process. 2020, 58, 377–406. [Google Scholar] [CrossRef]
  7. Ballinger, R.G. Light water reactors: Materials of construction and their performance. In Proceedings of the International Conference on Plant Materials Degradation—Application to the Stress Corrosion Cracking of Ni-Base Alloys, Moret-Sur-Loing, France, 6–9 November 2008. [Google Scholar]
  8. Clement, R. PWRs systems and operation. In Proceedings of the International Conference on Plant Materials Degradation—Application to the Stress Corrosion Cracking of Ni Base Alloys, Moret-Sur-Loing, France, 6–9 November 2008. [Google Scholar]
  9. Scott, P.M.; Combrade, P. General corrosion and stress corrosion cracking of Alloy 600 in light water reactor primary coolants. J. Nucl. Mater. 2019, 524, 340–375. [Google Scholar] [CrossRef]
  10. Scott, P.M.; Benhamou, C. An overview of recent observations and interpretations of IGSCC in nickel base alloys in PWR primary water. In Proceedings of the Tenth International Conference on Environmental Degradation of Materials in Nuclear Power Systems-Water Reactors, Snowmass, CO, USA, 10 August 2001; TMS (The Minerals, Metals & Materials Society): Lake Tahoe, NV, USA, 2001. [Google Scholar]
  11. Yun, E.; Chung, H.; Jang, C. Evaluation of Primary Water Stress Corrosion Cracking Resistance of Three Heats of Alloy 600 in 400 °C Hydrogenated Steam Condition. Metals 2018, 8, 130. [Google Scholar] [CrossRef] [Green Version]
  12. Pollock, T.M.; Tin, S. Nickel-Based Superalloys for Advanced Turbine Engines: Chemistry, Microstructure and Properties. J. Propuls. Power 2006, 22, 361–374. [Google Scholar] [CrossRef]
  13. International Atomic Energy Agency. Stress Corrosion Cracking in Light Water Reactors: Good Practices and Lessons Learned, in Nuclear Energy Series; IAEA: Vienna, Austria, 2011. [Google Scholar]
  14. Sanderson, A. Four Decades of Electron Beam Development at TWI. Weld. World 2006, 51, 37–49. [Google Scholar] [CrossRef]
  15. Schultz, H. Electron Beam Welding; Abington Publishing: Cambridge, UK, 1993. [Google Scholar]
  16. Zhu, S.-P.; Zhang, X.; Jiang, C.; Chen, G.; Song, X.; Hu, D. Advances in structural integrity and reliability analysis for critical components. Adv. Mech. Eng. 2018, 10, 1–3. [Google Scholar] [CrossRef]
  17. Smith, M. NeT bead-on-plate round robin: Comparison of transient thermal predictions and measurements. Int. J. Press. Vessel. Pip. 2008, 86, 96–109. [Google Scholar] [CrossRef]
  18. Smith, M. NeT bead-on-plate round robin: Comparison of residual stress predictions and measurements. Int. J. Press. Vessel. Pip. 2008, 86, 79–95. [Google Scholar] [CrossRef]
  19. Bate, S.; Charles, R.; Warren, A. Finite element analysis of a single bead-on-plate specimen using SYSWELD. Int. J. Press. Vessel. Pip. 2008, 86, 73–78. [Google Scholar] [CrossRef]
  20. Bouchard, P. The NeT bead-on-plate benchmark for weld residual stress simulation. Int. J. Press. Vessel. Pip. 2008, 86, 31–42. [Google Scholar] [CrossRef]
  21. Truman, C.; Smith, M. The NeT residual stress measurement and modelling round robin on a single weld bead-on-plate specimen. Int. J. Press. Vessel. Pip. 2008, 86, 1–2. [Google Scholar] [CrossRef]
  22. Muránsky, O.; Smith, M.; Bendeich, P.; Holden, T.; Luzin, V.; Martins, R.; Edwards, L. Comprehensive numerical analysis of a three-pass bead-in-slot weld and its critical validation using neutron and synchrotron diffraction residual stress measurements. Int. J. Solids Struct. 2012, 49, 1045–1062. [Google Scholar] [CrossRef]
  23. Smith, M.C.; Smith, A.C.; Ohms, C.; Wimpory, R.C. The NeT Task Group 4 residual stress measurement and analysis round robin on a three-pass slot-welded plate specimen. Int. J. Press. Vessel. Pip. 2018, 164, 3–21. [Google Scholar] [CrossRef]
  24. Smith, M.C.; Muránsky, O.; Austin, C.; Bendeich, P.; Xiong, Q. Optimised modelling of AISI 316L(N) material behaviour in the NeT TG4 international weld simulation and measurement benchmark. Int. J. Press. Vessel. Pip. 2018, 164, 93–108. [Google Scholar] [CrossRef]
  25. Smith, M.C.; Smith, A.C. Advances in weld residual stress prediction: A review of the NeT TG4 simulation round robins part 2, mechanical analyses. Int. J. Press. Vessel. Pip. 2018, 164, 130–165. [Google Scholar] [CrossRef]
  26. Akrivos, V.; Wimpory, R.C.; Hofmann, M.; Stewart, B.; Muransky, O.; Smith, M.C.; Bouchard, J. Neutron diffraction measurements of weld residual stresses in three-pass slot weld (Alloy 600/82) and assessment of the measurement uncertainty. J. Appl. Crystallogr. 2020, 53, 1181–1194. [Google Scholar] [CrossRef]
  27. Akrivos, V.; Smith, M.C. The Thermo-Mechanical Behaviour of Alloy 600 and Alloy 82 Materials. In Proceedings of the ASME 2018 Pressure Vessels and Piping Conference PVP 2018, Prague, Czech Republic, 15–20 July 2018. [Google Scholar] [CrossRef]
  28. Akrivos, V.; Smith, M.C. Material Characterization on the Nickel-Based Alloy 600/82 NeT-TG6 Benchmark Weldments. In Proceedings of the ASME 2019 Pressure Vessels & Piping Conference PVP 2019, San Antonio, TX, USA, 14–19 July 2019. [Google Scholar] [CrossRef]
  29. Akrivos, V.; Smith, M.C.; Muransky, O.; Ohms, C.; Youtsos, A. A residual stress measurement and numerical analysis round robin on a three-pass slot nickel-base repair weld. Procedia Manuf. 2020, 51, 779–786. [Google Scholar] [CrossRef]
  30. Smith, M.C. NeT-TG6 The Manufacture of a Three-Pass Slot Weld Specimen in Inconel 600 Nickel/Chromium Alloy. June 2014. Available online: https://www.net-network.eu/tg6 (accessed on 21 April 2022).
  31. Ohms, C.; Bouchard, J.; Smith, M.C.; Smith, A.C. NeT-Task Group 6: Three-Pass Slot Weld Specimen in Inconel Nickel/Chromium Alloy Protocol for the Destructive and Non-Destructive Determination of Residual Stress in a Three-Pass Slot Weld Specimen in Inconel Nickel/Chromium Alloy. June 2015. Available online: https://www.net-network.eu/tg6 (accessed on 21 April 2022).
  32. James, J.; Santisteban, J.; Edwards, L.; Daymond, M. A virtual laboratory for neutron and synchrotron strain scanning. Phys. B: Condens. Matter 2004, 350, E743–E746. [Google Scholar] [CrossRef]
  33. Smith, M.C.; Muransky, O.; Akrivos, V.; Angles, J. The NeT Task Group 6 Weld Residual Stress Measurement and Simulation Round Robin in Alloy 600/82. In Proceedings of the ASME 2016 Pressure Vessels and Piping Conference PVP 2016, Vancouver, BC, Canada, 17–21 July 2016. [Google Scholar] [CrossRef]
  34. Wimpory, R.; Ohms, C.; Hofmann, M.; Schneider, R.; Youtsos, A. Statistical analysis of residual stress determinations using neutron diffraction. Int. J. Press. Vessel. Pip. 2008, 86, 48–62. [Google Scholar] [CrossRef]
  35. Goldak, J.; Chakravarti, A.; Bibby, M. A new finite element model for welding heat sources. Metall. Trans. B 1984, 15, 299–305. [Google Scholar] [CrossRef]
  36. FEAT. User Guide; Version 3.15.0; Feat Plus Limited: Bristol, UK, 2013; Available online: http://www.featplus.co.uk (accessed on 21 April 2022).
  37. Elcoate, C.; Dennis, R.; Bouchard, P.; Smith, M. Three dimensional multi-pass repair weld simulations. Int. J. Press. Vessel. Pip. 2005, 82, 244–257. [Google Scholar] [CrossRef] [Green Version]
  38. Muránsky, O.; Smith, M.; Bendeich, P.; Edwards, L. Validated numerical analysis of residual stresses in Safety Relief Valve (SRV) nozzle mock-ups. Comput. Mater. Sci. 2011, 50, 2203–2215. [Google Scholar] [CrossRef]
  39. Bendeich, P.; Muransky, O.; Hamelin, C.; Smith, M.; Edwards, L. Validated numerical analysis of residual stresses in safety relief valve (SRV) nozzle mock-ups: Influence of axial restraint on distortion and residual stress predictions. Comput. Mater. Sci. 2012, 62, 285–288. [Google Scholar] [CrossRef]
  40. Smith, M.; Wimpory, R.; Ohms, C. A review of the NeT Task Group 1 residual stress measurement and analysis round robin on a single weld bead-on-plate specimen. Int. J. Press. Vessel. Pip. 2014, 120–121, 93–140. [Google Scholar] [CrossRef]
  41. Smith, M.C.; Smith, A.C. Advances in weld residual stress prediction: A review of the NeT TG4 simulation round robin part 1, thermal analyses. Int. J. Press. Vessel. Pip. 2018, 164, 109–129. [Google Scholar] [CrossRef]
  42. Smith, M.C. NeT TG6 finite Element Simulation Protocol, Issue 1 for Phase 1 Simulations. January 2016. Available online: https://www.net-network.eu/tg6 (accessed on 21 April 2022).
  43. Hurrell, P.; Watson, C.; Bouchard, J.; Smith, M.; Dennis, R.; Leggatt, N.; Bate, S.; Warren, A. Development of Weld Modelling Guidelines in the UK. In Proceedings of the ASME 2009 Pressure Vessels and Piping Conference, Prague, Czech Republic, 26–30 July 2009; pp. 481–489. [Google Scholar] [CrossRef]
  44. Chaboche, J. Constitutive equations for cyclic plasticity and cyclic viscoplasticity. Int. J. Plast. 1989, 5, 247–302. [Google Scholar] [CrossRef]
  45. Smith, M.C.; Nadri, B.; Smith, A.C.; Carr, D.G.; Bendeich, P.J.; Edwards, L.E. Optimisation of Mixed Hardening Material Constitutive Models for Weld Residual Stress Simulation Using the NeT Task Group 1 Single Bead on Plate Benchmark Problem. In Proceedings of the ASME 2009 Pressure Vessels and Piping Conference PVP 2009, Prague, Czech Republic, 26–30 July 2009; pp. 303–318. [Google Scholar] [CrossRef]
  46. Muránsky, O.; Hamelin, C.; Smith, M.; Bendeich, P.; Edwards, L. The effect of plasticity theory on predicted residual stress fields in numerical weld analyses. Comput. Mater. Sci. 2012, 54, 125–134. [Google Scholar] [CrossRef]
Figure 1. NeT-TG6 specimen (a) before and (b) after welding. (c) Schematic representation of the NeT-TG6 specimen showing the dimensions of the plate; the blue lines indicate relevant residual stress measurement lines. (d) Typical instrumentation of thermocouples. Nominal thermocouple positions on the (e) top and (f) bottom surface of the specimen.
Jmmp 06 00061 g001
Figure 2. (a) Typical finite element half-model of NeT-TG6 specimen and (b) final predicted fusion profile of from ANSTO simulation.
Jmmp 06 00061 g002
Figure 3. Comparing the predicted responses after first load reversal of mixed hardening material models with different parameter fitting strategies.
Jmmp 06 00061 g003
Figure 4. Comparison of measured welding temperature transients during pass 3 with predictions from FE simulation (black dashed line) at thermocouples located at (a) mid-length bottom surface, (b) mid-length top surface, (c) start position and (d) stop position.
Jmmp 06 00061 g004
Figure 5. RMS errors inferred from temperature rises at (a) top, (b) bottom and (c) all mid-length thermocouples.
Jmmp 06 00061 g005
Figure 6. A depiction of (a) Vickers hardness distribution after one, two, and three passes, (b) transverse weld macrographs showing weld fusion zone and CGHAZ, (c) predicted fusion boundary profiles from ANSTO thermal analysis (1375 °C isotherm). (NOTE that the 3-slot plate used for metallographic and micro-indentation studies was ~1.6 mm thicker than the actual NeT-TG6 specimens).
Jmmp 06 00061 g006
Figure 7. Predicted (a) transverse, (b) normal and (c) longitudinal stresses on planes D and B from UoM−B simulation.
Jmmp 06 00061 g007
Figure 8. Comparison of the predicted (a) transverse and (b) longitudinal stresses on line BD from the different welding simulations performed with the ND-based Bayesian mean (RBE−ND).
Jmmp 06 00061 g008
Figure 9. Comparison of the predicted (a) transverse and (b) longitudinal stresses on line B2 from the different welding simulations performed with the ND-based Bayesian mean (RBE−ND).
Jmmp 06 00061 g009
Figure 10. Comparison of the predicted (a) transverse and (b) longitudinal stresses on line D7.5 from the different welding simulations performed with the ND-based Bayesian mean (RBE−ND).
Jmmp 06 00061 g010
Table 1. Summary of chemical composition (wt%) for Alloy 600 parent plate and Alloy 82 filler wire.
MaterialCSiMnCrNiSNbTiFe
Alloy 6000.070.120.4815.5474.350.0010.100.0069.33
Alloy 820.0090.083.2520.872.70.0012.60.3190.59
Table 2. Summary of material properties (certificate) for Alloy 600 parent plate and Alloy 82 filler wire.
MaterialYield Stress 0.2% (MPa)Ultimate Tensile Strength (MPa)Elongation (%)
Alloy 60040170640.4
Alloy 8238062035
Table 3. Summary of welding procedure for NeT-TG6 specimen [30].
ParameterPass 1Pass 2Pass 3
Plate MaterialAlloy 600
Welding ProcessGTAW
Filler WireAlloy 82
Wire Diameter1 mm
Arc PolarityDC Electrode (−)
Shielding GasArgon
Tungsten Electrode2% Lantane
Arc Length4 mm
Electrode Diameter2.4 mm
Gas Cup ID8 mm
Gas Flow Rate10–12 L/min
Gas Pre-PurgeStart − 5 s
Arc On StartStart + 0 s
Starting Current0 A
Start of Ramp Up StartStart + 0 s
End of Ramp Up StartStart + 1 s
Pulsing Frequency1 Hz
Peak Welding Current240 A
B/G Welding Current200 A
Arc Voltage10.3–11.2 V
Start of Wire FeedStart + 2.5 s
Peak Wire Feed Speed1.7 m/mn
B/G Wire Feed Speed1.5 m/mn
Travel Speed70.0 mm/min
WeavingNone
End of TravelEnd + 0 s
Start of Ramp DownEnd + 0 s
End of Wire FeedEnd + 1.5 s
End of Ramp DownEnd + 6.5 s
Final Current5–10 A
Start of TravelStart + 4.5 sStart + 4.5 sStart + 4.6 s
Inter-pass Temperature20 °C ± 10 °C50–60 °C50–60 °C
Table 4. Summary of the details of the different weld modelling attempts by all NeT participants.
OrganisationFE PackageElementsConstitutive BehaviourAnnealingHeat Source
EC2-ACode Aster
(3D half model)
~30,000 Linear hexahedral Chaboche—1.5%TSR monotonic fit parent/weld800–950 °C Linear two stageMoving (triangular shaped)
EC2-BCode Aster
(3D half model)
~10,000 Quadratic hexahedral Prager—1.5%TSR monotonic fit parent/weld800–950 °C Linear two stageMoving (triangular shaped)
INRANSYS
(3D 1/4 model)
25,470 Quadratic hexahedralChaboche—1.5%TSR monotonic fit parent/weld1100 °C Single stageFixed (block dump)
IC-AAbaqus
(3D half model)
69,380 Linear hexahedralChaboche—1.5%TSR monotonic fit parent/weld1050 °C Single stageMoving (Goldak elllipsoid)
IC-BAbaqus
(3D half model)
69,380 Linearc hexahedralChaboche—1.5%TSR monotonic/cycle 2 fit parent/weld1050 °C Single stageMoving (Goldak elllipsoid)
ANSTO-AAbaqus
(3D half model)
40,722 Quadratic hexahedralChaboche—1.5%TSR monotonic fit parent/weld1050 °C Single stageMoving (Goldak elllipsoid) FEAT-WMT
ANSTO-BAbaqus
(3D half model)
40,722 Quadratic hexahedralChaboche—1.5%TSR monotonic/cycle 2 fit parent/weld1050 °C Single stageMoving (Goldak elllipsoid) FEAT-WMT
UoM-AAbaqus
(3D half model)
40,722 Quadratic hexahedralChaboche—1.5%TSR monotonic fit parent Cycle-2 fit weld1050 °C Single stageMoving (Goldak elllipsoid) FEAT-WMT
UoM-BAbaqus
(3D half model)
40,722 Quadratic hexahedralChaboche—2.5%TSR monotonic fit parent Cycle-2 fit weld1050 °C Single stageMoving (Goldak elllipsoid) FEAT-WMT
UoM-CAbaqus
(3D half model)
40,722 Quadratic hexahedralChaboche—2.5%TSR monotonic fit parent Cycle-2 fit weld
>1200 °C Soft parent
1050 °C Single stageMoving (Goldak elllipsoid) FEAT-WMT
DBAbaqus
(3D half model)
100,862 Quadratic hexahedralChaboche—1.5%TSR monotonic fit parent/weld1050 °C Single stageMoving (Goldak elllipsoid)
Table 5. Temperature-dependent thermo-physical and elastic properties used for both Alloy 600 and Alloy 82 materials [42].
Temperature
(°C)
Heat Capacity
(J kg−1 °C−1)
Temperature
(°C)
Thermal Conductivity
(W m−1 C−1)
Temperature
(°C)
Poisson RatioYoung’s Modulus
(MPa)
20444270.0142200.31213,745
100465770.015193.3208,229
2004861270.016148.9206,161
3005021770.0168204.4203,403
4005192270.0177260199,955
5005363270.0195315.6197,887
6005784270.0213371.1194,439
70059525270.023426.7190,302
8006116270.0248482.2186,165
9006287270.0265537.8182,028
12047338270.0283600180,000
13167669270.0301700172,000
10270.0318800164,000
11270.0336900154,000
12270.03531000143,000
13270.03711150115,000
126078,258
1315.639,300
13712000
Table 6. Temperature dependent Chaboche parameters of (a) Alloy 600 material from isothermal (a) 1.5% TSR and (b) 2.5% TSR cyclic tests. The proportional limit stress (σ0) and the four kinematic hardening parameters (C1, C2, γ1, γ2) were fitted to the first monotonic response. The two isotropic hardening parameters (Qinf, b) were fitted to the first three cycles [42].
Temperature
(°C)
Proportional Limit Stress
σ0 (MPa)
C1
(MPa)
C2
(MPa)
γ1γ2Qinf
(MPa)
b
(a)
20229399,9509630.1252666.420416
200221.6359,00010,950252666.4808
400187.4244,60016,432252666.4158.610
600182300,8005612252666.414810
700178.9259,0002526252666.44560
850125.527,1061460.5252666.400
10505000252666.400
12001000252666.400
14001000252666.400
(b)
20229113,39016,8932127123151.511.5
200221.690,00015,2842127123808
400187.461,95113,3612127123236.25
60018252,73210,8722127123151.416
700178.940,000552621271234560
850125.527,1061460.5212712300
10505000212712300
12001000212712300
14001000212712300
Table 7. Temperature-dependent Chaboche parameters of Alloy 182 material from isothermal 1.5%TSR cyclic tests with the proportional limit stress (σ0) and the four kinematic hardening parameters (C1, C2, γ1, γ2) fitted to (a) the first monotonic response or (b) the monotonic response of the second cycle. (c) The mechanical properties for Alloy 82 from isothermal 2.5%TSR cyclic tests with the proportional limit stress (σ0) and the four kinematic hardening parameters (C1, C2, γ1, γ2) fitted to the monotonic response of the second cycle. The two isotropic hardening parameters (Qinf, b) of all sets were fitted to the first three cycles [42].
Temperature
(°C)
Proportional Limit Stress
σ0 (MPa)
C1
(Mpa)
C2
(Mpa)
γ1γ2Qinf
(Mpa)
b
(a)
20220.75114,0607572.5204489.4202.51.65
20019761,185.56654.2589.41851.45
400163.7559,899700489.4301.53
600151.2568,079.56331.589.42434
700148.565,133548689.456.518
850125.527,1061460.589.400
105061.75511953889.400
1200100089.400
1400100089.400
(b)
20128.593,74228,362.5982.5233.35202.51.65
200116.480,70521,295982.5233.351851.45
400133.777,30912,600982.5233.35301.53
600137.548,2247817982.5233.352434
70014040,961.58000982.5233.3556.518
850125.512,0003000982.5233.3500
105061.7530001000982.5233.3500
12001000982.5233.3500
14001000982.5233.3500
(c)
2013596,9026017588.1114.7239.12.4
20011081,0724054588.1114.72881.8
40011562,9403450588.1114.7355.41.8
60014025,6463082588.1114.7279.63.8
70014020,0002700588.1114.756.518
850125.512,0002000588.1114.700
100061.7530001000588.1114.700
10505000588.1114.700
12001000588.1114.700
1400200588.1114.700
Publisher’s Note: MDPI stays neutral with regard to jurisdictional claims in published maps and institutional affiliations.

