Article

Tooling and Infusion Design Strategies to Reduce Trade-Offs in Forming and Infusion Quality of Multi-Textile CFRPs †

1
Bristol Composites Institute, School of Civil, Aerospace, and Mechanical Engineering, University of Bristol, Bristol BS8 1TH, UK
2
Albany Engineered Composites, Inc., Rochester, NH 03687, USA
*
Author to whom correspondence should be addressed.
This paper is an extended version of conference paper Budwal, N.; Kasper, K.; Goering, J.; Ward, C. Flexible low-cost tooling solutions for a one-shot resin infusion of a 3D woven and multi-textile preform. Procedia Manuf.2020, 51, 856–863.
J. Manuf. Mater. Process. 2022, 6(3), 62; https://doi.org/10.3390/jmmp6030062
Submission received: 30 April 2022 / Revised: 7 June 2022 / Accepted: 8 June 2022 / Published: 9 June 2022

Abstract

:
Achieving right-first-time-manufacture (RFTM) of co-infused textile assemblies is challenging, without improving the accessibility to design knowledge of trade-offs between different tooling and infusion strategies. As demonstrated in previous work, the choice between a flexible or rigid mould material can result in trade-offs between dimensional accuracy and geometrical precision. Similarly, the choice of an infusion strategy can result in trade-offs in infusion quality and time. Building on past work, an investigation into forming variability across the length of six co-infused multi-textile components, with three different tooling inserts and two infusions set-ups, was conducted. To quantitatively assess variation, a method adapting principles of statistical process control was employed to analyse the yarn crimp measured from high-resolution cross-sectional scans of the components. The results were compared to a geometrical and dimensional analysis of the manufactured parts presented in a previous work. The analysis represents a method for capturing forming differences in textile preforms, which can be used to inform designs for the manufacture of textile CFRPs. The results were used to improve a hybrid rigid-flexible tooling design for an infused multi-textile component.

1. Introduction

Co-infused assemblies of mid-large aerostructures (i.e., integrated door surrounds, wing skins, fuselage sections, etc.) have the potential for significant reductions in weight and labour, due to a reduced need for bonding and assembly [1]. Obtaining right-first-time-manufacture (RFTM) of these large scale co-infused assemblies is difficult to achieve without correctly identifying and understanding potential sources of defects or scrapped parts early in their design [2]. Currently, iterative design cycles, where design and manufacturing engineers require a feedback loop between design and prototype, result in a lengthy process and higher associated costs [3]. Concurrent engineering (CE) principles can be used to transition from iterative design for manufacture (DfM) to more simultaneous DfM, reducing design hours and improving manufacturability [4].
One approach to CE requires effective knowledge management strategies, to enable designers to make more informed decisions. For manufacturing co-infused assemblies, an effective knowledge management system would allow designers to foresee manufacturing problems with infusion or tooling strategies, prior to manufacture [5]. There are two hurdles to developing such a system: (1) Capturing the manufacturing knowledge associated with different infusion and tooling strategies, and component materials and geometries; (2) Structuring the captured knowledge to enable its reusability.
This paper focuses on the first hurdle, working to expand the understanding of design trade-offs in tooling or infusion strategies for carbon-fibre reinforced plastics (CFRPs). There is a general lack of process know-how for tooling design as it relates to specific geometries or reinforcement types. This is especially true for textile-reinforced composites [5]. Following a series of infusion set-ups with multi-textile preforms, this paper presents a methodology for capturing quantitative data that can inform future designs. The structuring and organization of this knowledge is addressed in a complementary work [5].
Historically, most CFRPs used in aircraft have been 2D laminates made from autoclave processing and mainly present in secondary structural components, such as wing movables (flaps, spoilers, etc.). These CFRPs are primarily pre-impregnated materials made from 2D unidirectional and woven plies. More recently CFRPs have been accepted for primary aerostructures, including horizontal and vertical stabilizers. The development of through-thickness reinforced textile preforms can further expand the use of CFRPs into more primary aerostructures. Textile CFRPs can offer improved mechanical and manufacturing performance efficiency, especially in components where high damage tolerance is required. One such use of 3D textile CFRPs is exemplified in the CFM International LEAP engine, found in the Airbus A320 Neo and Boeing 737Max, where both the fan blades and fan casings are made from 3D woven-RTM preforms [6].
Furthermore, a combination of textile forms (weaving, braiding, stitching, knitting) can be used for additional tailoring of reinforcement, to manufacture fully integrated structures, and these set-ups are referred to as multi-textile preforms. Multi-textile preforms can be fabricated into a range of complex geometries, incorporating features with variable thicknesses, contours, and seams. By co-infusing these preforms, weight and costs can be saved, as exemplified by the examples listed in Table 1 [1].

2. Background

2.1. Challenges with Manufacture

Difficulties in manufacturing large textile assemblies come from the forming and moulding process steps. This is largely attributed to the tooling design and infusion strategy. For forming fibre reinforcements, the reinforcement type, process, and tools need to be carefully considered, to ensure consistent quality and reduce part–part variation. The drapability and compressibility of textile reinforcements can vary significantly, depending on the preform architecture. For example, 3D woven preforms are incorporated through thickness binder yarns that create a more stable preform structure that is less sensitive to handling compared to traditional dry-fibre lay-ups. In contrast, biaxial braided structures can be manipulated by changing the braid angle, length, and width of the preform when preforming. In addition to forming limitations due to reinforcement type, implementing the correct tooling strategy, from preform loading to tool closing, can reduce the risk of forming defects, such as fibre misalignment, fibre bridging, fibre damage, pinching, or wrinkle formation.
Shifting the focus onto moulding (infusion, consolidation, and cure), from tool closure to part demoulding, understanding the compaction and permeability of a preform can reduce the likelihood of these defects affecting the part quality and fibre volume fraction (FVF). The permeability of the reinforcement will decrease when force is applied to compact a preform. This consolidation pressure is not always uniform, and as mentioned previously, various reinforcements have varying compaction and relaxation responses [12]. Therefore, it is difficult to achieve uniform consolidation pressure and resin content for complex geometry multi-textile assemblies, resulting in defects such as porosity, dry spots, and resin-rich zones, which cause a non-uniform load distribution and undesirable structural performance [13]. For vacuum infusion processes, both dry and wet preform responses due to resin pressure and textile compressibility need to be considered to accurately capture these effects on reinforcement consolidation and cured part thickness.
Software models have been developed to overcome these issues through simulation prior to any physical trials [14]. However, while models can use real permeability data to simulate the wet out of parts, the tooling designs require significant input from manufacturing engineers, to give accurate constraints; reducing the usefulness of these models to inform tooling and infusion design concurrently [13]. Furthermore, these models are still largely in development, take time to run, and need data to validate [13,14]. Therefore, a designer informed about tooling types and infusion strategies could minimize the number of simulations that have to be run to achieve RFTM, resulting in a faster, more cost-efficient, and economical design process. Automating these feedback loops is necessary for cost-effective design and reducing risk of unwanted variation in manufacture.

2.2. Manufacturing Analyses

Gupta et al. presented a review on automated manufacturability analysis as a part of DfM procedures in the late 1990s. The review identified three defining characteristics for evaluating the manufacturability of designs: (1) Determine if the design can be manufactured; (2) If manufacturable, evaluate the difficulty with which the design can be manufactured; (3) If not manufacturable, identify potential problems with the design [15]. Manufacturing analyses are often presented as DfM rules or guidelines to support RFTM and minimize committed production costs. Examples include the work by Haffner et al. [16], to identify DfM guidelines for a range of geometries and production volumes for advanced composite manufacturing processes; and Konstantopoulos et al. [13], in systematically evaluating where defects or uncertainty can arise in the supply, prep, forming, filling, and curing steps of liquid composite moulding (LCM) processes.
As evident in Sivanathan’s review of DfM/A rules covering geometry limitations for laminated CFRPs [17], the procedure towards DfM has not evolved much since the 1990s. One exception is the work by SAAB Aerostructures that proposed a DfM framework for commercial CFRP products [18]. Most companies produce in-house DfM guidelines, limiting available design knowledge for the wider CFRP community. Additionally, when DfM rules are published, they include knowledge rules that cannot easily be adapted to components with different materials or geometries. Butenko et al. proposed the development of a standard system for categorizing DfM rules, based on their relevance to different CFRP manufacturing stages [19]. However, there has still not been much uptake of this system.
Cong and Zhang defined manufacturability as the “compatibility between the process constraint and the design parameters” and controllability over quantitative indices, representative of cost, time, and quality. As demonstrated by investigating porosity in laminates, they employed a systematic approach to manufacturability analysis using a hierarchal system of quality indices associated with the main manufacturing steps. Their process was limited by failing to highlight how more qualitative or tacit knowledge in DfM rules can be transformed into quantitative indices. More research is needed to translate manufacturing observations into more explicit, discrete, or quantitative formats, to improve the reusability in design and capture lessons learnt from costly or failed designs. In this paper, methods for statistical process control are adapted from six sigma practices, to better capture quality differences between components with different manufacturing approaches.

3. Methodology

3.1. Previous Work

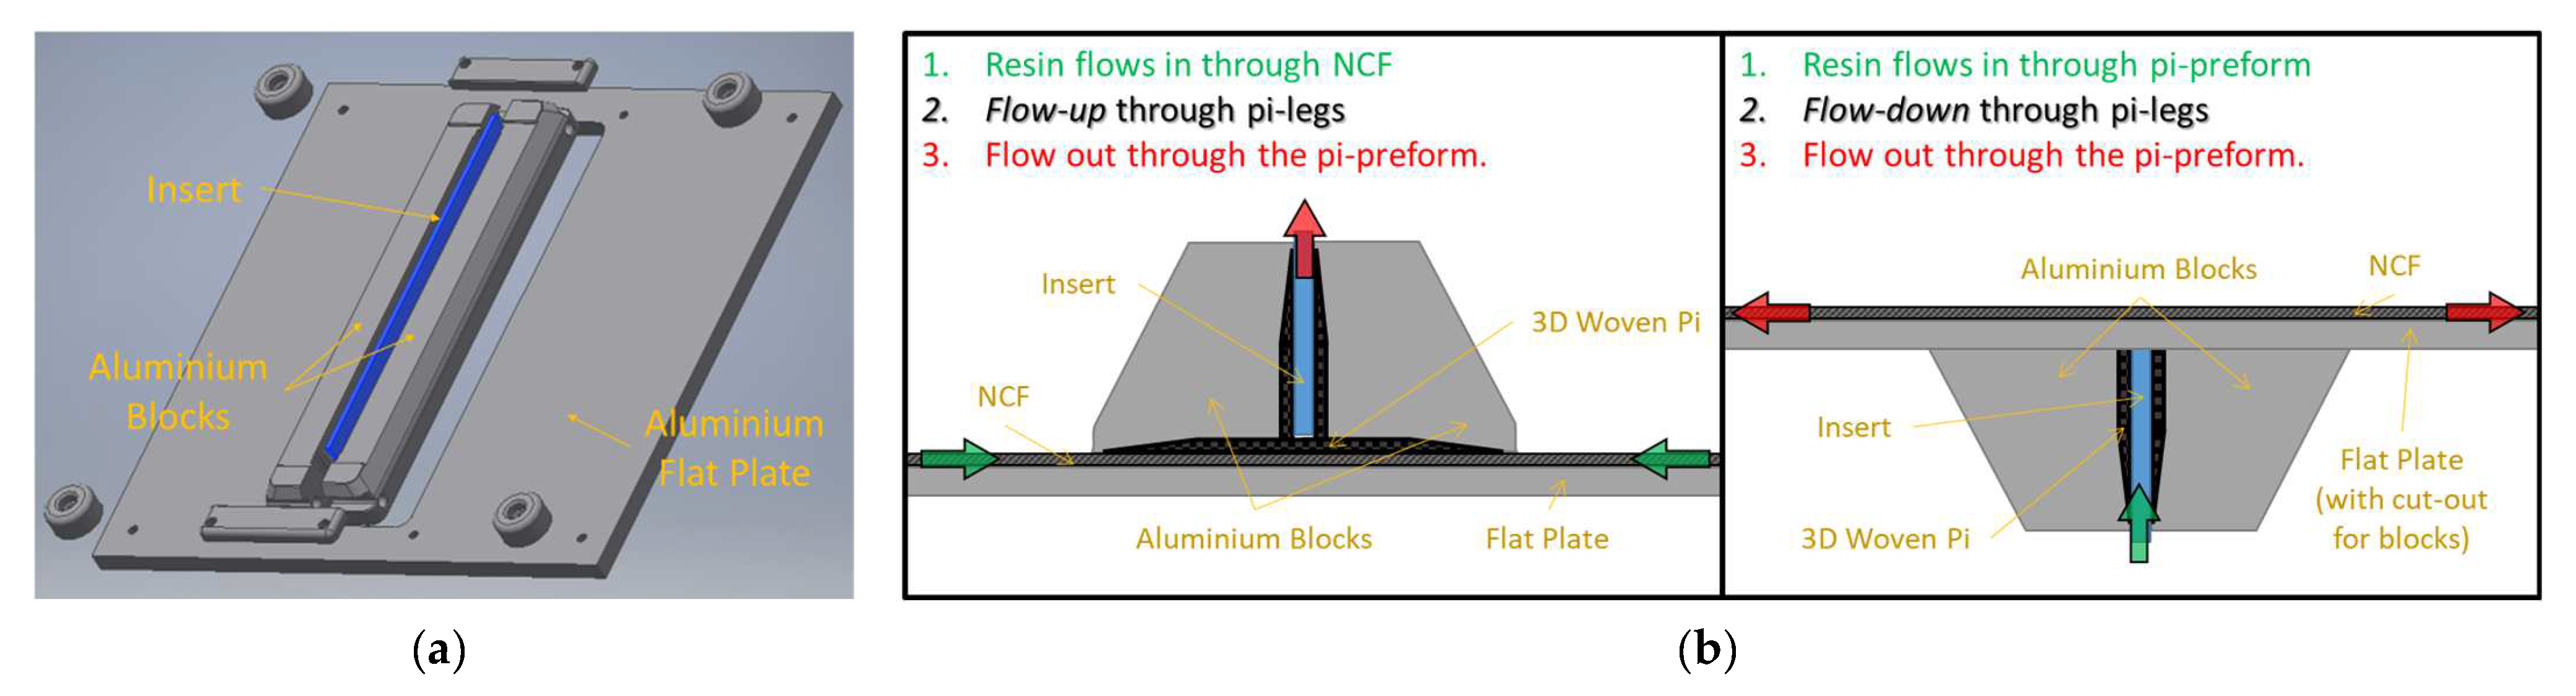
3.1.1. Materials and Manufacture
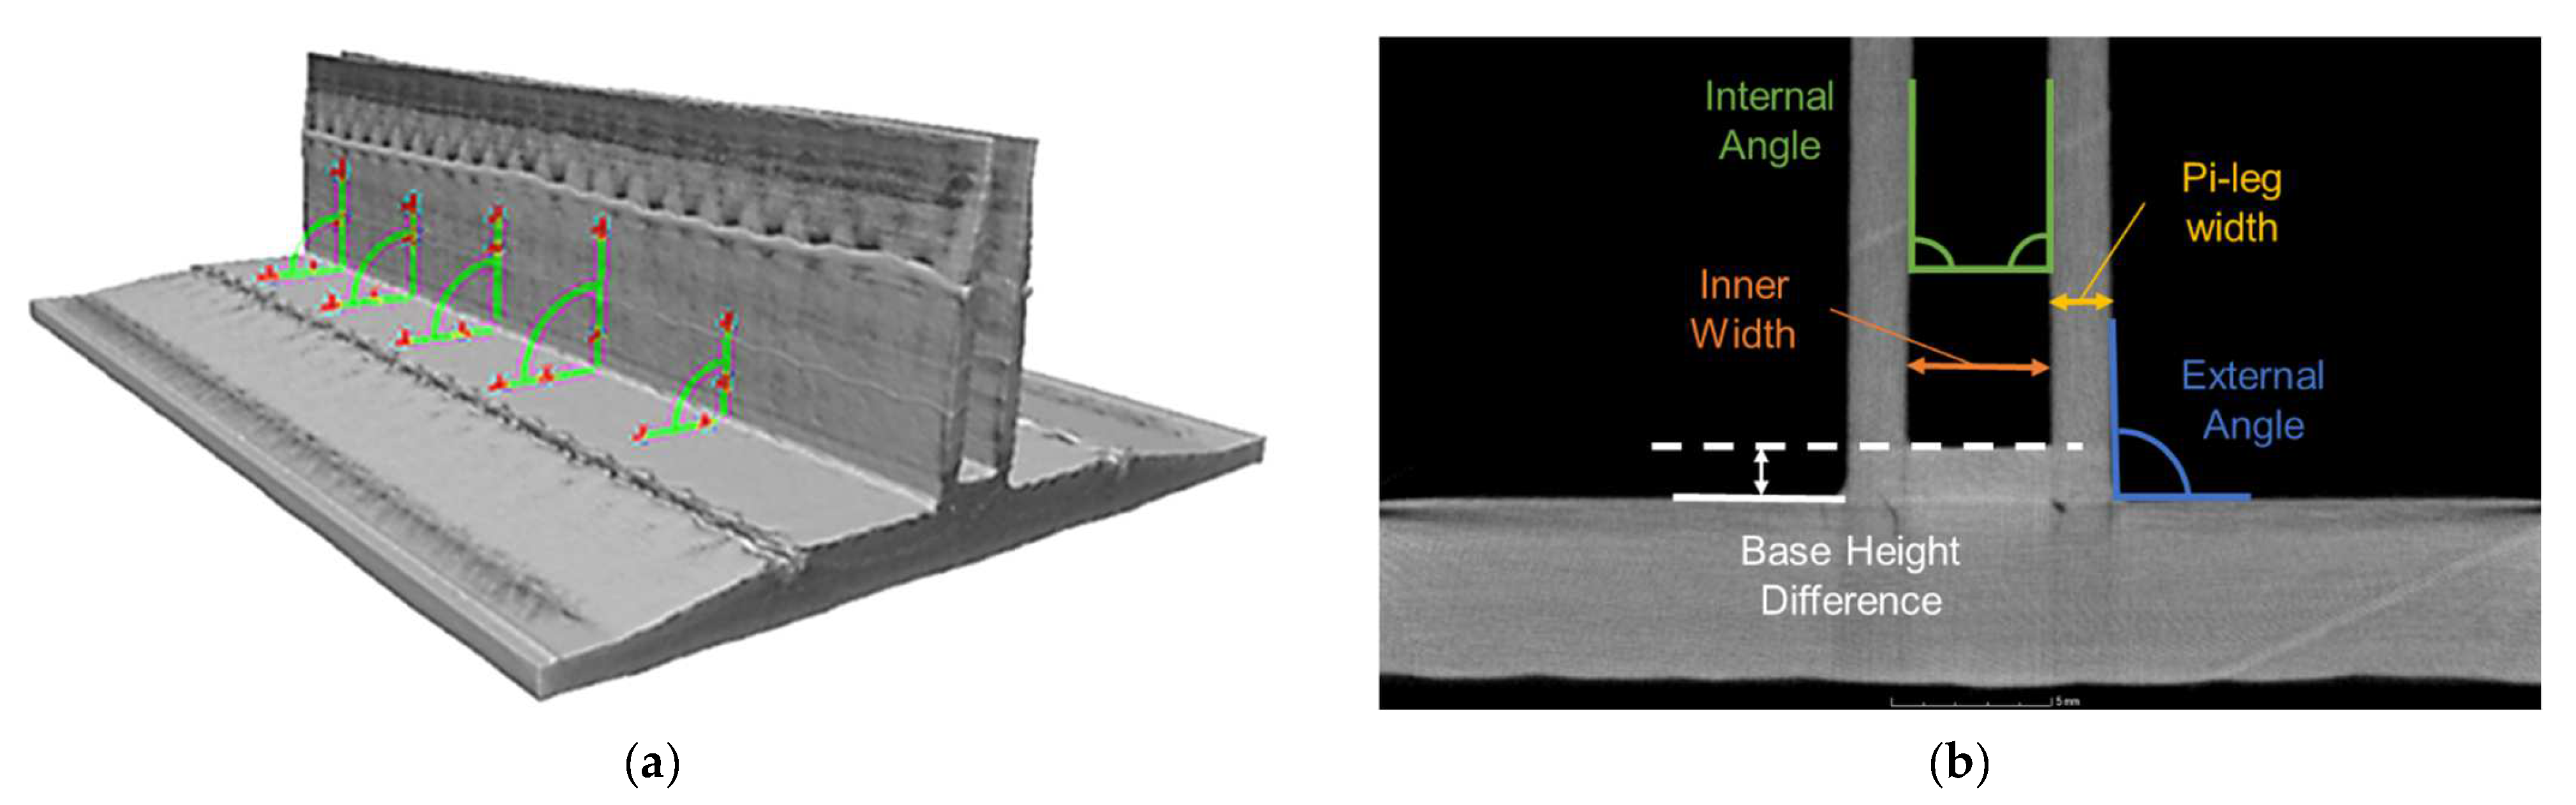
Six components were manufactured with a multi-textile pi-stiffened geometry, representative of a stiffened aerostructure. The components consisted of a 3D woven pi-preform on a non-crimp fabric (NCF) skin and were infused as per the manufacturing details in [1]. The pi-preforms were woven by Albany Engineered Composites, Inc. with Hexcel IM7TM 6K and 12K carbon fibre. Four plies of Formax™ 750 gsm triaxial (−45/0/+45) 24K carbon fibre fabric made up the skin. The modular aluminium tool, shown in Figure 1a, was used to investigate the impact of two infusion strategies (flow ‘up’ and ‘down’) and three tooling insert materials (silicone, polyetherimide, and aluminium). Both infusion set-ups are shown in Figure 1b, with green and red arrows representing the location of resin inlets and outlets. For each infusion trial, an insert was placed between the pi-legs, the aluminium blocks were placed on the outer sides of the pi-legs, and the assembly was loaded onto the flat plate infusion tool. The preforms were infused at 120 °C with Solvay PRISM™ EP2400 RTM resin and cured at 180 °C for 2 h. Table 2 lists the manufacturing data for the infusions. Refer to [1] for additional information on insert design and manufacture, and pi-NCF forming and moulding process steps.

3.1.2. CT Analysis

The analysis captured trade-offs between the controlled net surfaces, fibre volume fraction (FVF), and ease of manufacture. All six parts were sectioned and scanned using a Nikon XT H-225 X-ray Computed Tomography (CT) system. Reconstruction of the images into a 3D volume was performed using Nikon CT-Pro. Cross-sectional profiles of the components were evaluated at five locations along the part length using Volume Graphics VGStudio MAX 2.2.7 software, as shown in Figure 2a. Five measurements were taken with each cross-sectional profile, as shown in Figure 2b, to capture the external geometrical conformation of the parts.

3.2. Extended Through-Thickness Analysis

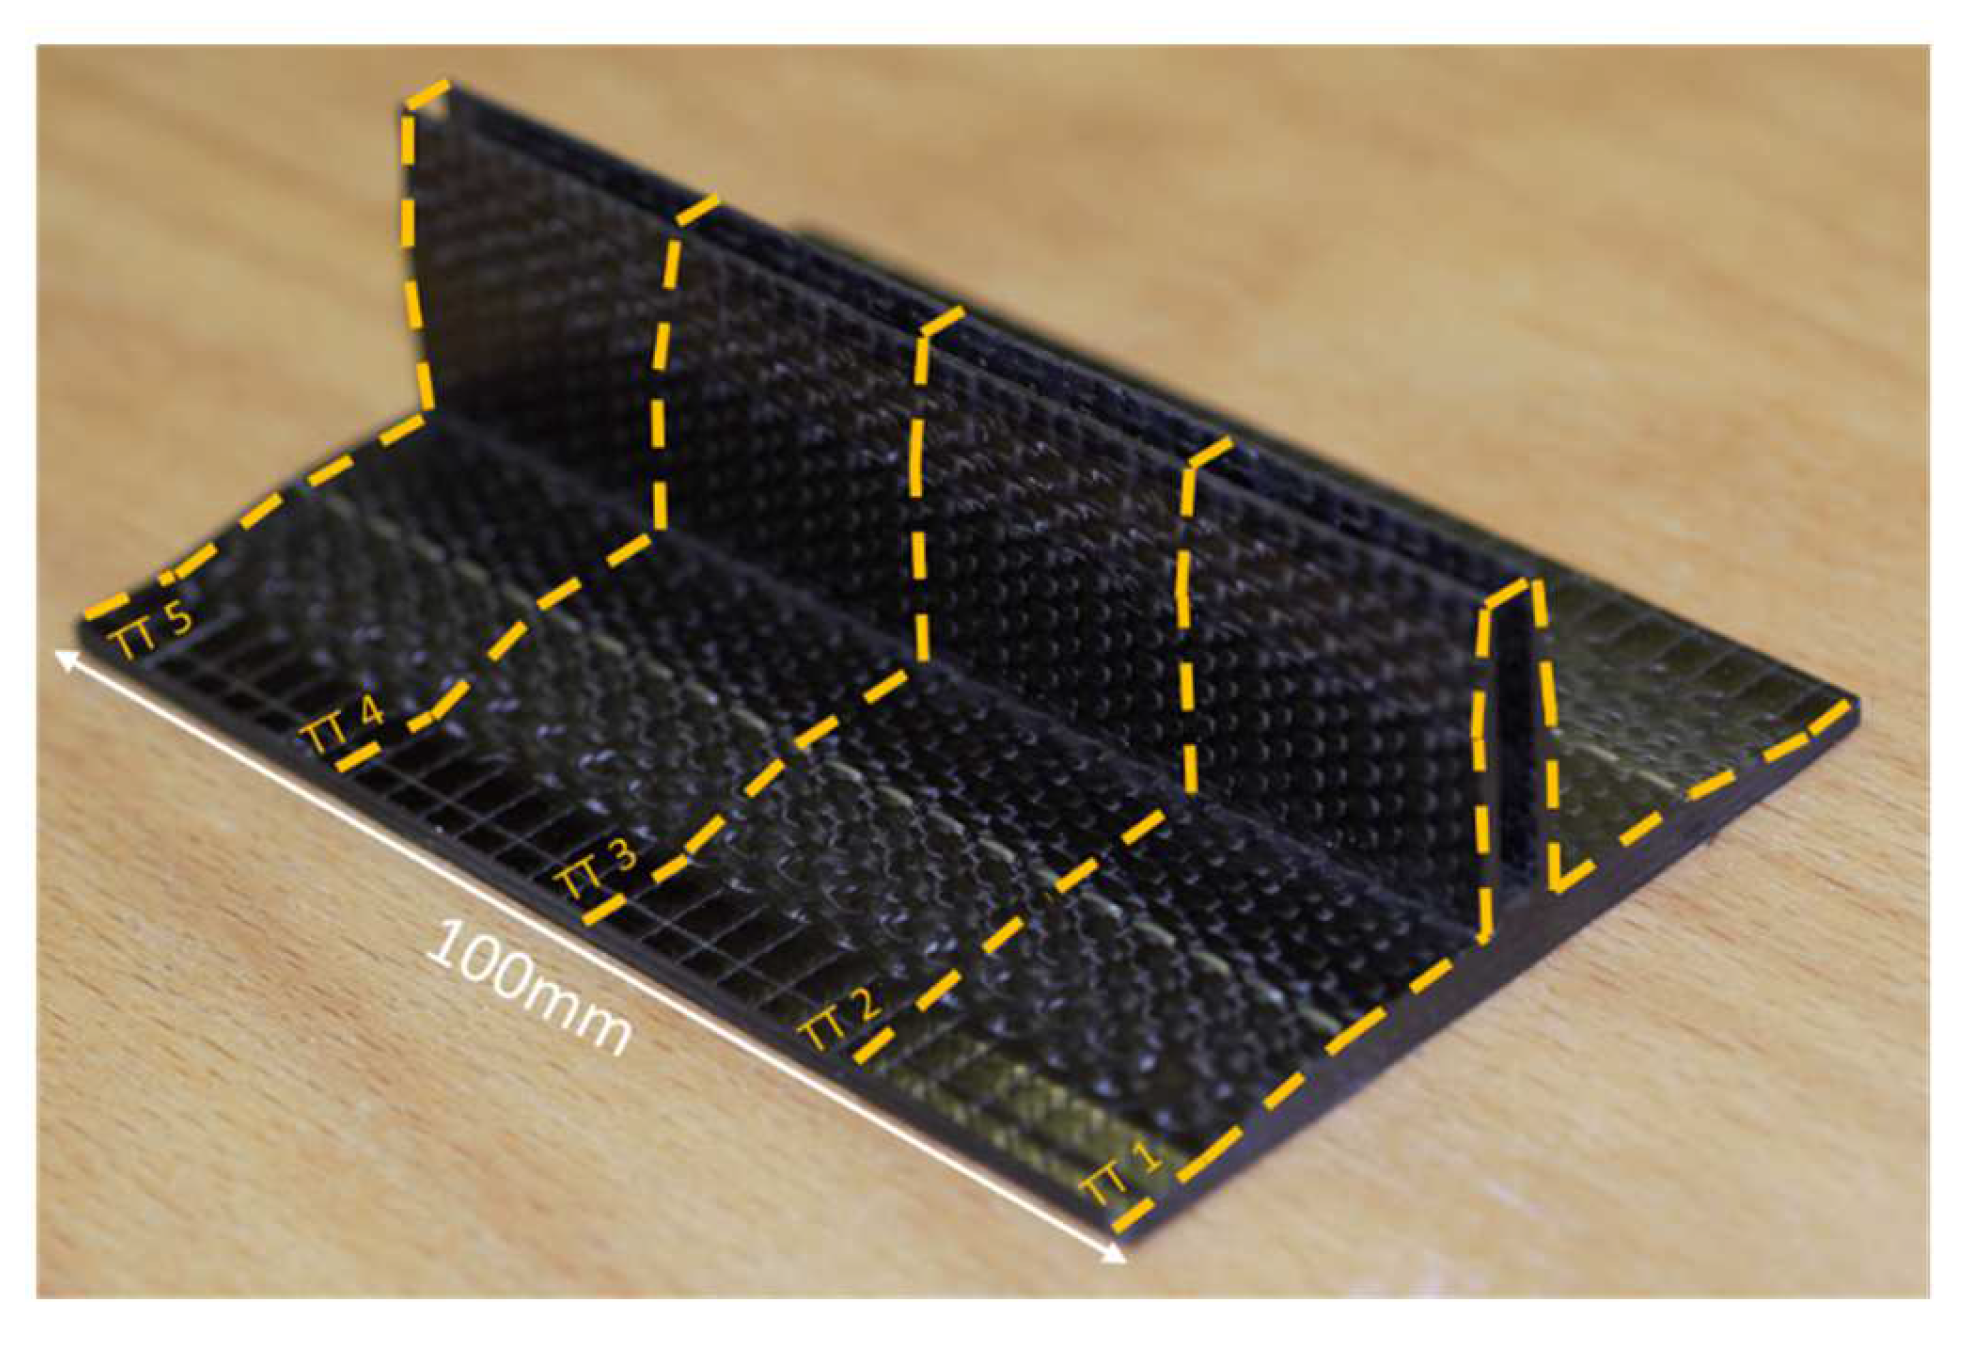
3.2.1. Sample Preparation

The samples were carefully sectioned by wet cutting using a Sharp & Tappin Compcut 200 saw by University of Bristol workshop. Samples of 2 mm thickness were trimmed at 25 mm intervals along the total 100 mm length of the pi-NCF components, as shown in Figure 3. The sections were carefully tracked along the length and labelled with a sample and through thickness (TT) number. Prior to scanning, the samples were manually wiped with a diacetone cloth to remove machining grease. No sample polishing was required.

3.2.2. Data Capture

An EPSON Expression 12000XL high resolution digital scanner was used to obtain cross-sectional images of the 2-mm samples. The sections were loaded into the scanner and images taken at a 2400 dpi resolution for a total of 5 scans per component. Each scan covered an area of roughly 87 × 40 mm (8210 × 3770 pixels). Between scans, a microfibre cloth was used to keep the glass of the scanner free of debris.

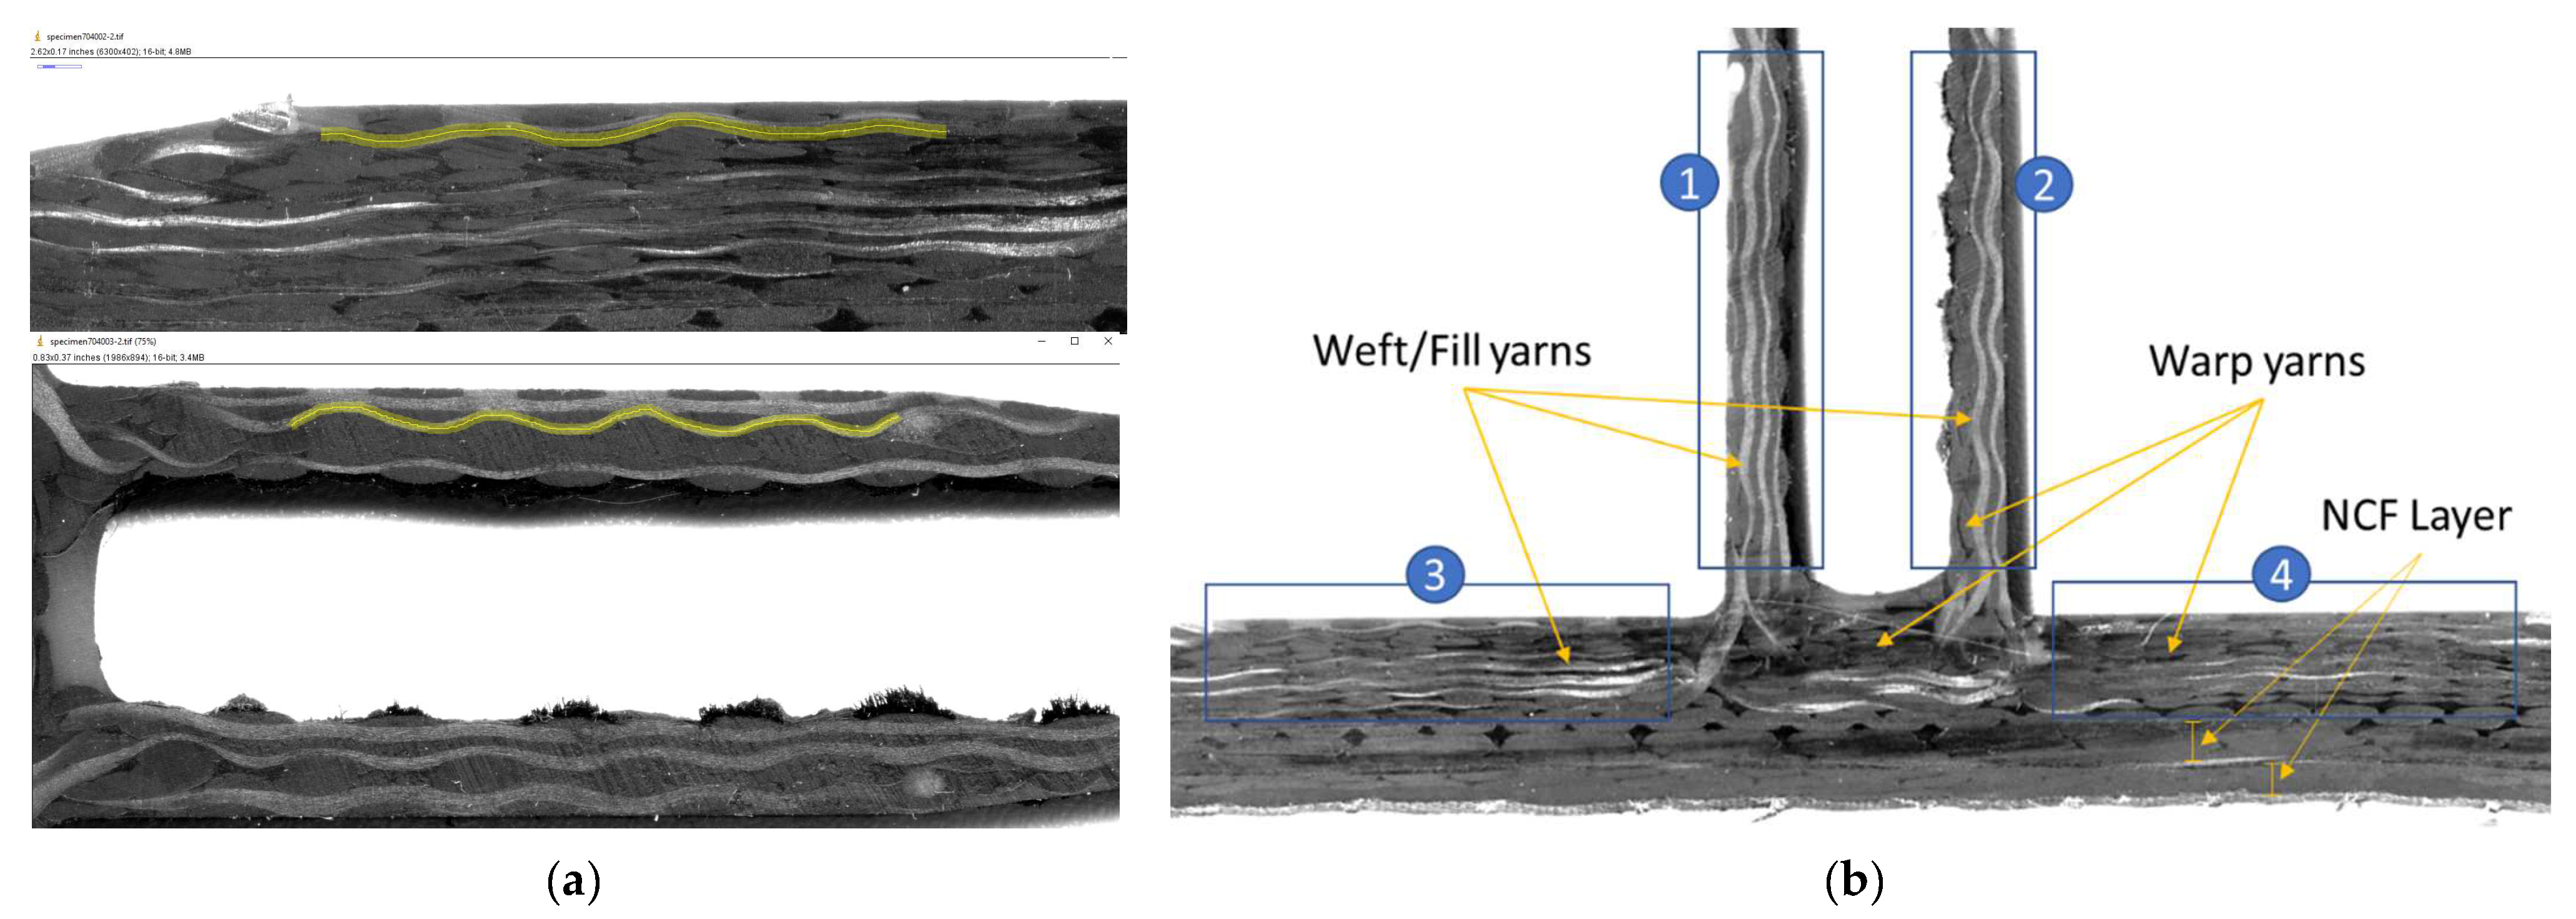
3.2.3. Image Analysis

The files were analysed using ImageJ v1.53 software. Crimp, C, is defined as the measure of waviness or undulation in its yarns. This can be measured by taking the angle of deviation from a straight line or as the ratio of difference in curved path length over its straight length. For textile composites, typically angular measurements are made, but this can be difficult to measure repeatedly with varying standards of scanned images [20]. For this reason, crimp factors were estimated using Equation (1), where LC is the net length of a yarn in crimp, and LT is curved path length of the yarn.
C = L T L C L C
A visual representation of LC and LT is shown in Figure 4. The undulation of the crimped yarn results in LC being less than LT. Using ImageJ, the freehand tracing tool with a line width of 15 pixels (~0.16 mm) was applied to capture LC and LT (see Figure 5a). For each sample, measurements were taken in the four zones labelled in Figure 5b.

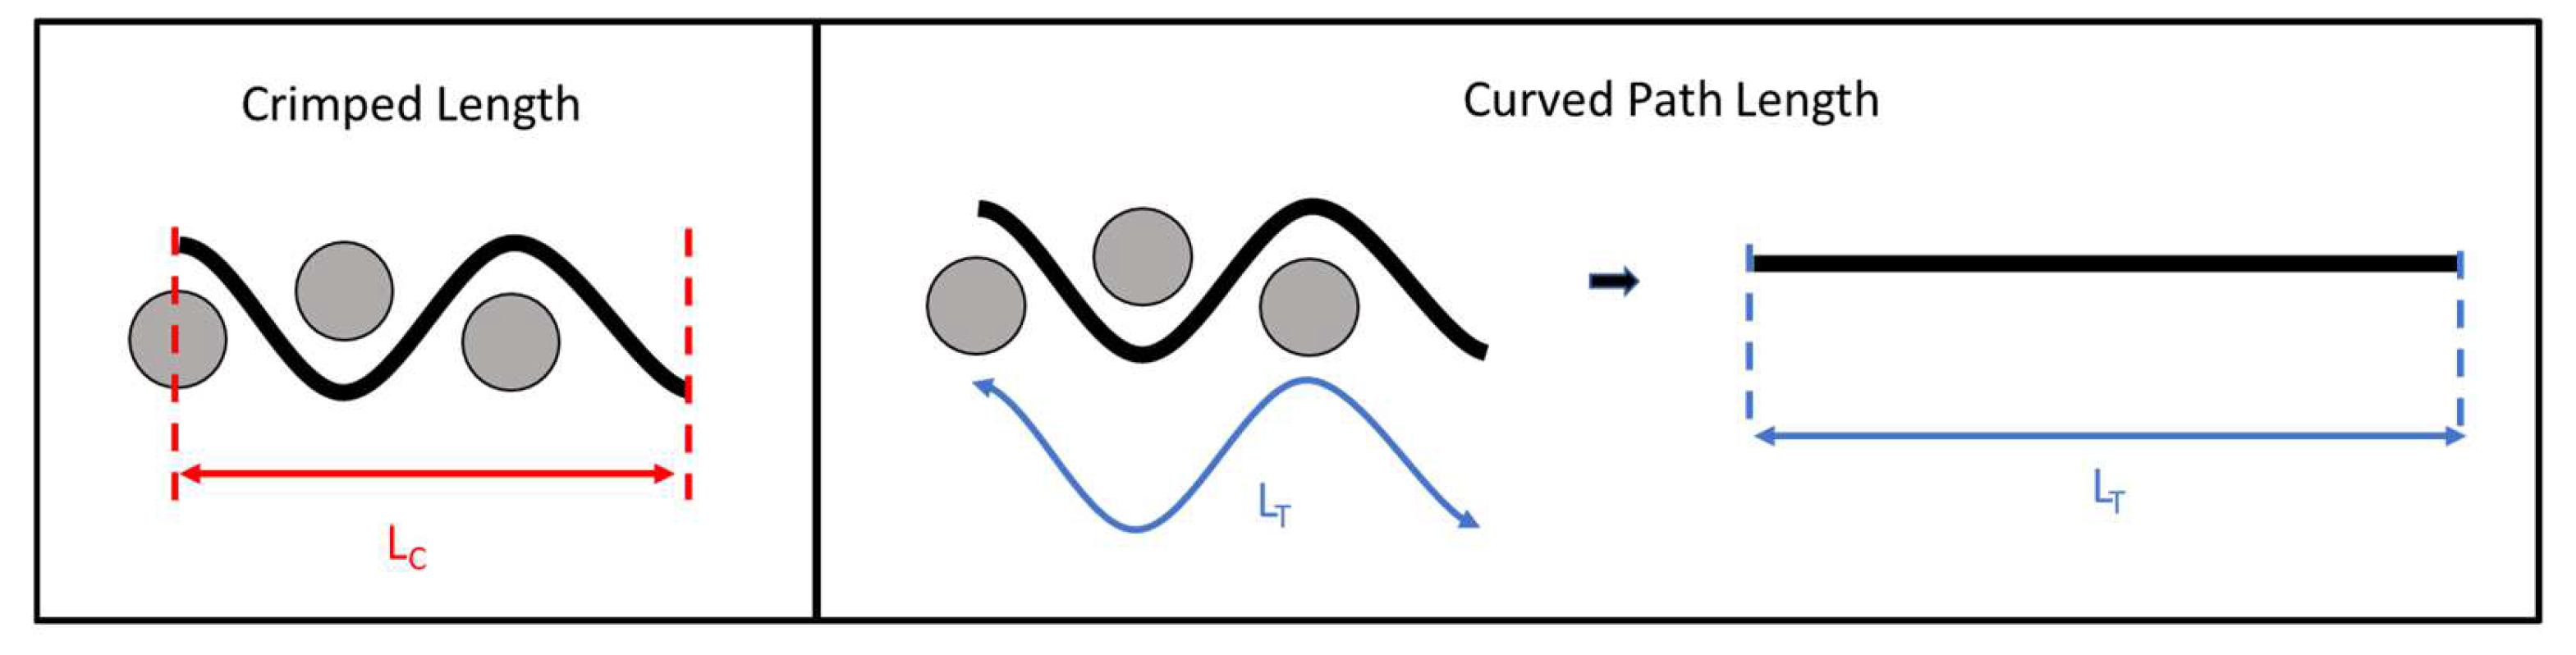
3.2.4. Data Analysis

To analyse the quantitative crimp data for each sample, X ¯ -R control charts were created using Matlab. Classically, control charts present the evolution of a group of measurements over time. This allows multiple subgroups of measurements to be presented in the chart. In production, control charts are a six sigma tool for identifying root causes for sources of error or trends present on the charts. By mapping to time in a production setting, the measurements can be linked to different operators, toolsets, machinery, or material batches. Additionally, the control charts can help monitor the stability of the process with time. When applied to a product or a component, an X ¯ -R control chart can capture insights on design choices or manufacturing error TT for one component, or across an average measurement for similar components.
X ¯ -R control charts have two plots, measuring both the process mean ( X ¯ ) and process variation (or range, R) over time. The X ¯ chart measures the deviation of the average of a subgroup of measurements from X ¯ , while the R chart presents the change in range of subgroups. For each chart, an upper control limit (UCL) and lower control limit (LCL) is determined assuming the dataset follows a normal distribution. The Matlab control chart function uses Shewhart control rules (see https://uk.mathworks.com/help/stats/controlchart.html). Shewhart defined control limits as three times the standard deviation of the measurement mean [21]. To represent crimp data for each component, X ¯ -R control charts were plotted against TT intervals, replacing the time dependence in the charts. The raw measurements for crimp are provided in Table 3.

4. Results and Analysis

4.1. Results—Summary of Previous Work

External geometrical conformation was assessed by the average and standard deviation of measurements taken from the CT scans of each component, presented graphically in Figure 6. The dotted lines represent the design targets for each measurement. The infusion quality of each part was characterized visually, based on the presence of dry spots and resin cracks in the CT scans (shown in Figure 7). FVFs could not be taken from the CT results, but these gave an indication of porosity in the part and at the pi-NCF interface [1].
Figure 6 revealed that the ALUP and ALDO parts had higher geometrical precision and lower variation across the length of the pi-preform. The SIDO and SIUP parts resulted in the smallest average pi-leg width, suggesting improved consolidation. Additionally, the SIUP and SIDO parts had higher accuracy to the design targets in base height difference, external angle, and internal angle measurements, but possessed a more uneven surface finish. The high variability in base height difference measurements suggests that this was due to a handling and forming issues during preform loading.
When comparing the observations in Figure 7 with the infusion data presented in Table 3, a faster infusion resulted in poorer infusion quality. The “up” infusion strategy with approximately a 30% increase in peak flow rate had shorter fill times, but resulted in dry spots on the surface and porosity for the ALUP and SIUP parts. This porosity was not present in the ULUP part, which suggests it is a result of the variation in processing due to a longer infusion time. Extending the infusion time for the ALUP/SIUP set-ups could eliminate the larger void presence but additional trials are required to verify this.
Finally, in Figure 7, the ULUP/ULDO had an elevated presence of resin cracking along the pi’s internal channel, suggesting that the use of the ULTEM™ insert contributed to the formation of resin rich regions, which are prone to cracking. Cracking was also present on the external and internal radii of the pi-legs in the ALDO part, and the external radius of the pi legs in SIUP parts.

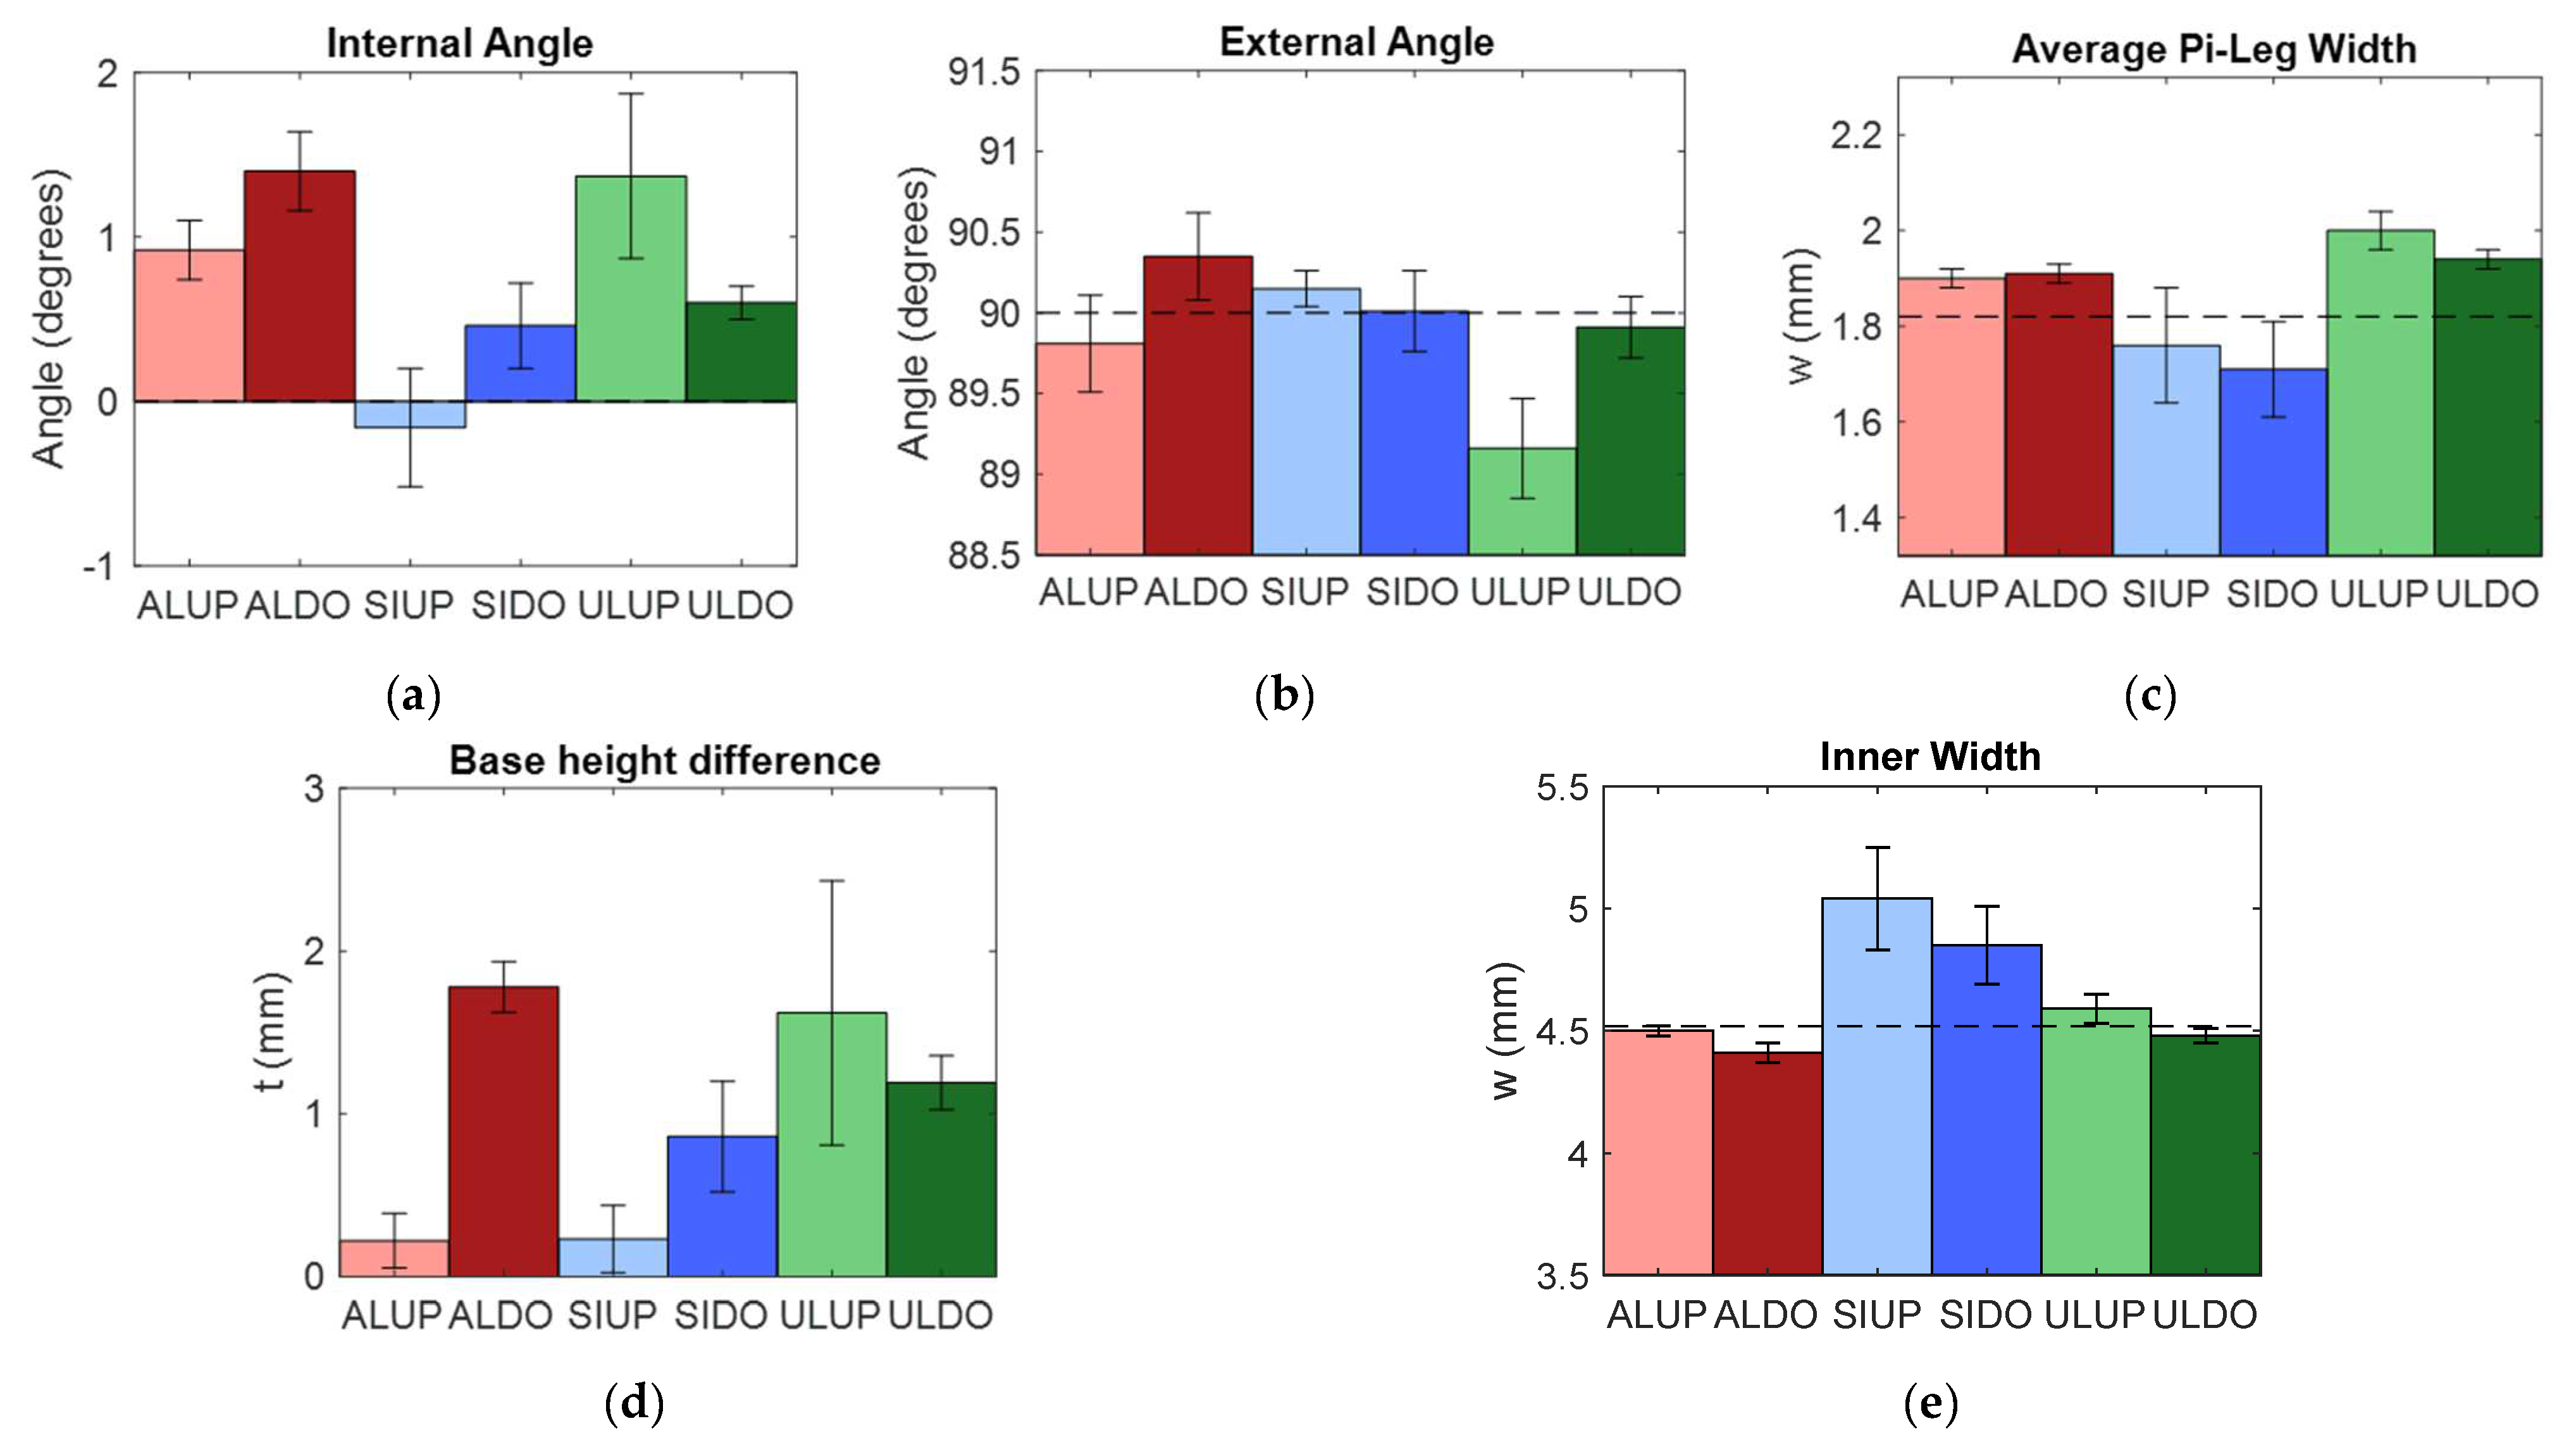
4.2. Results-Extended TT Analysis

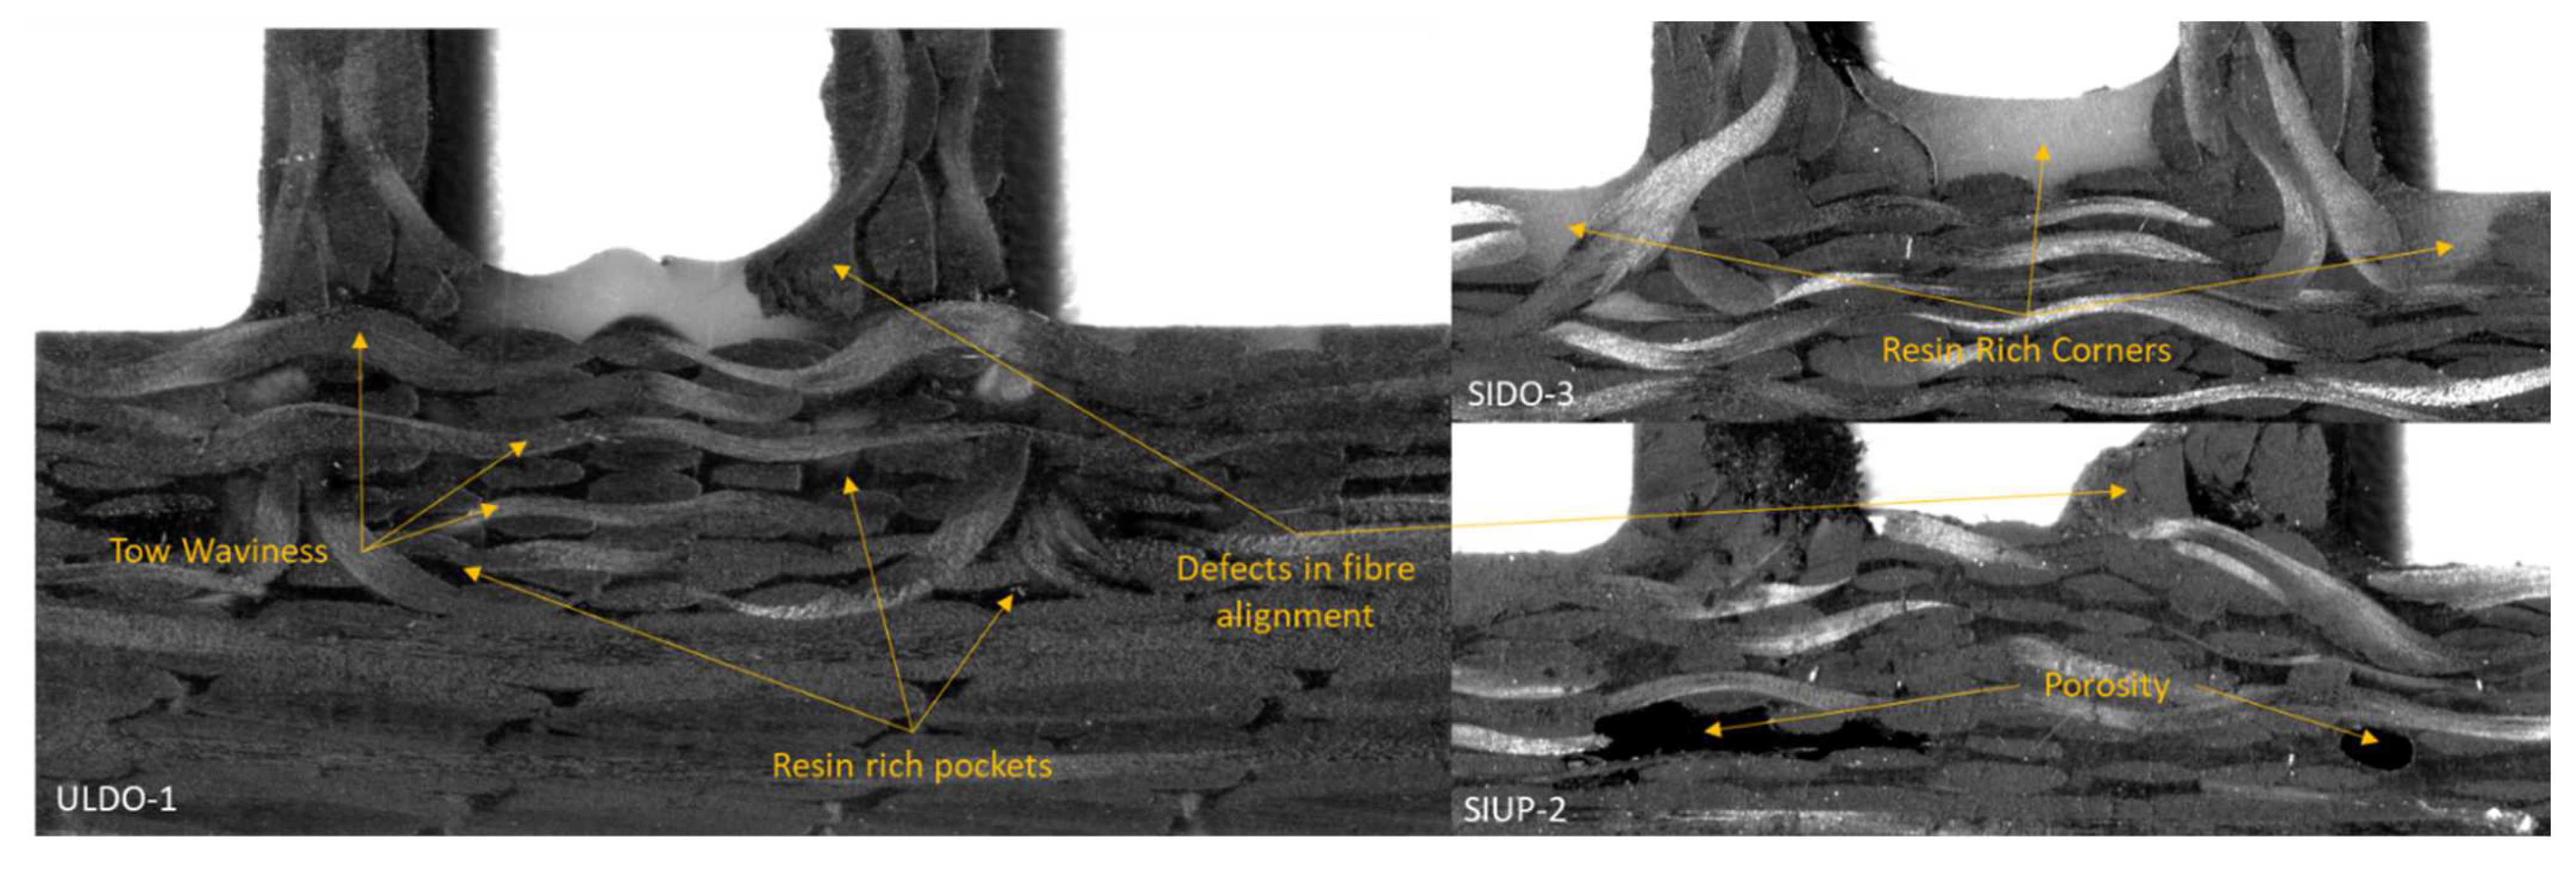
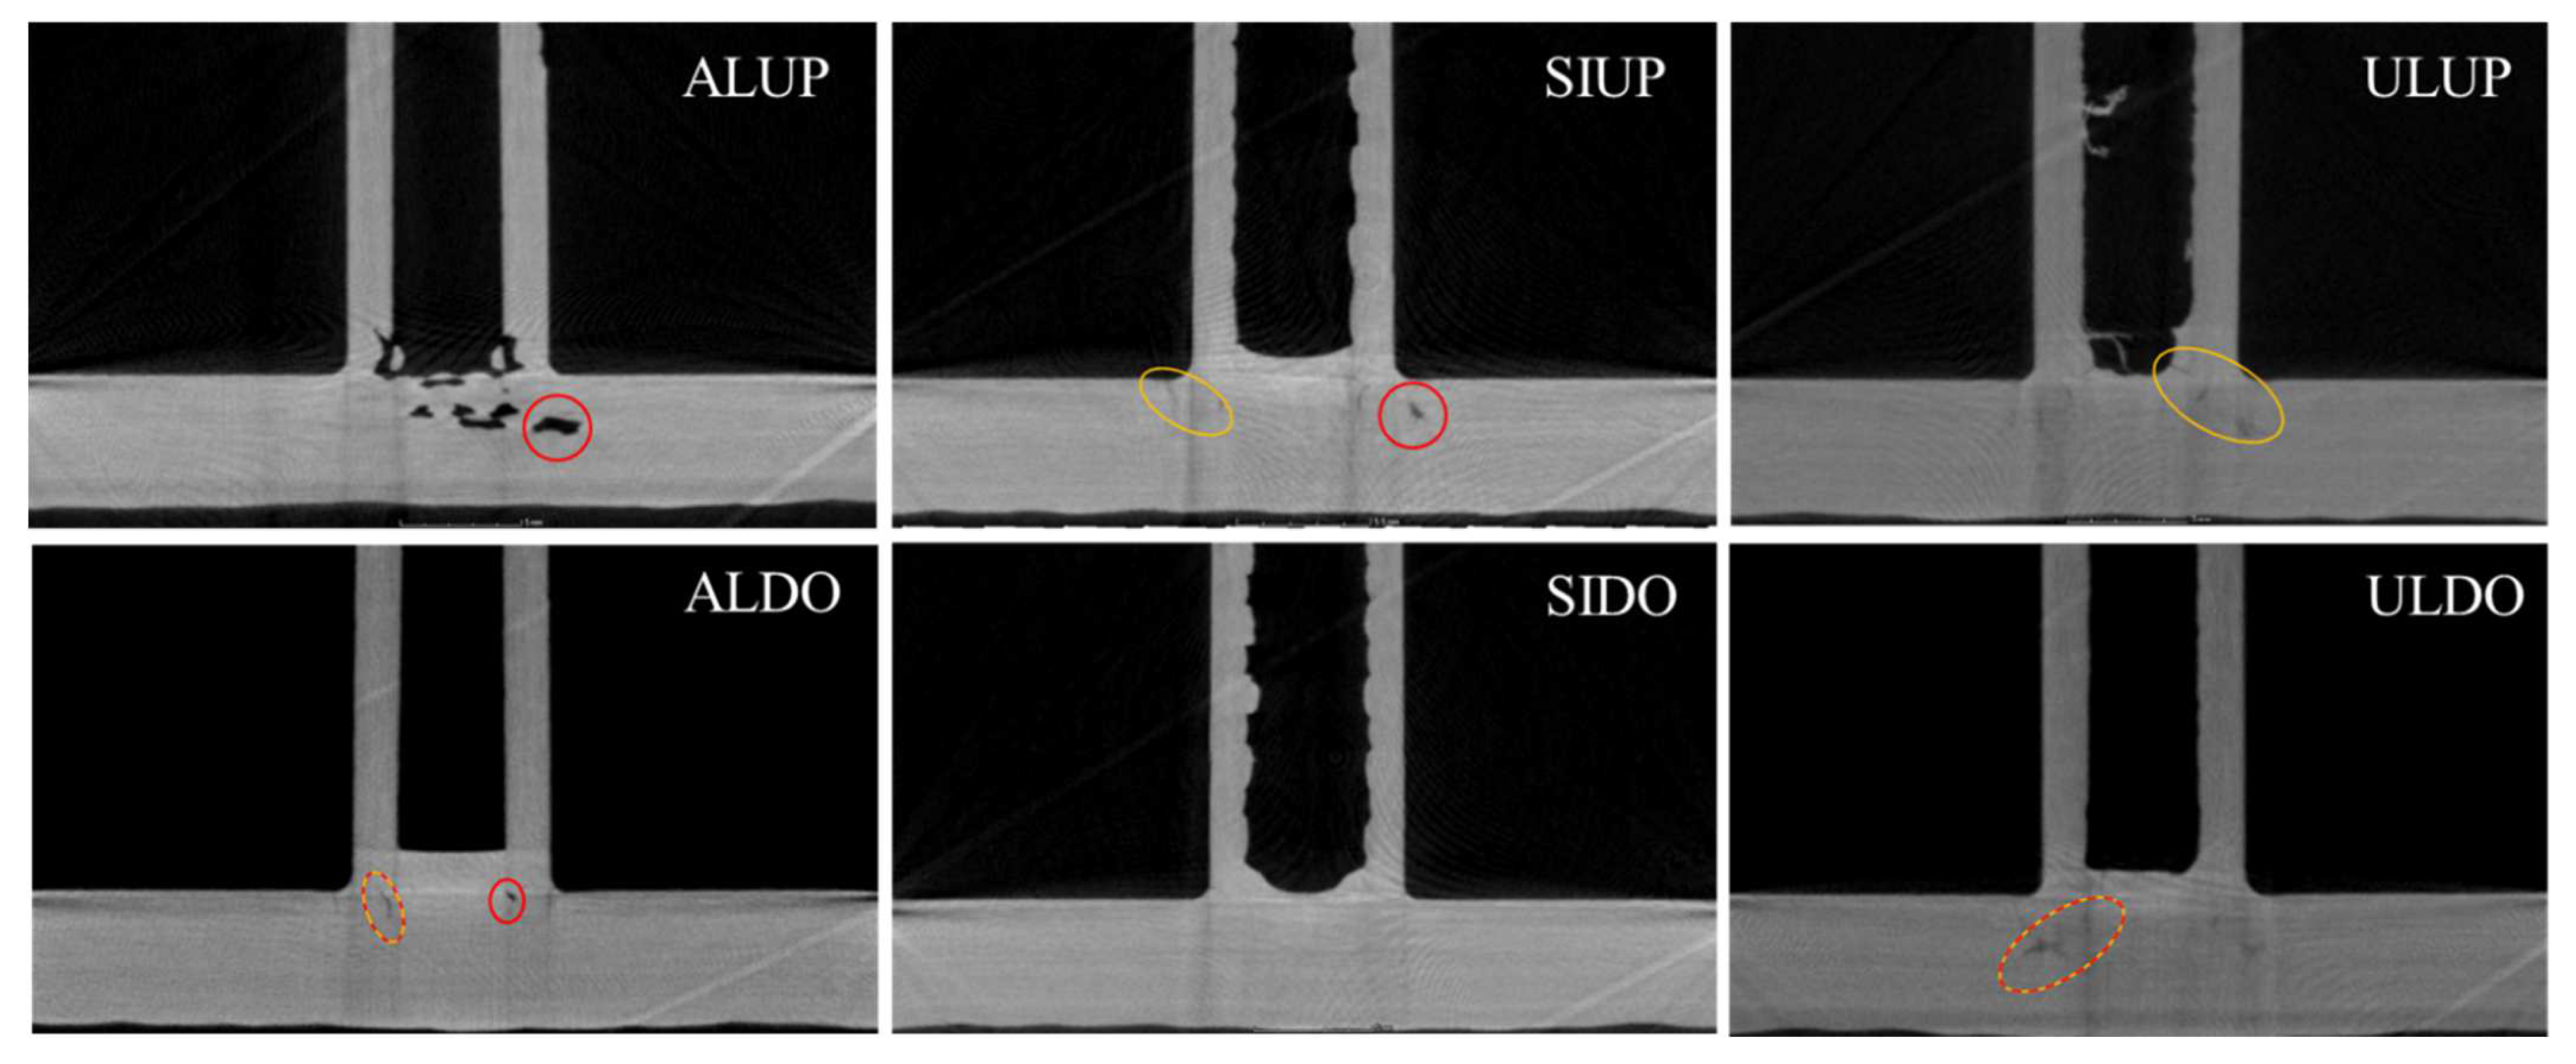
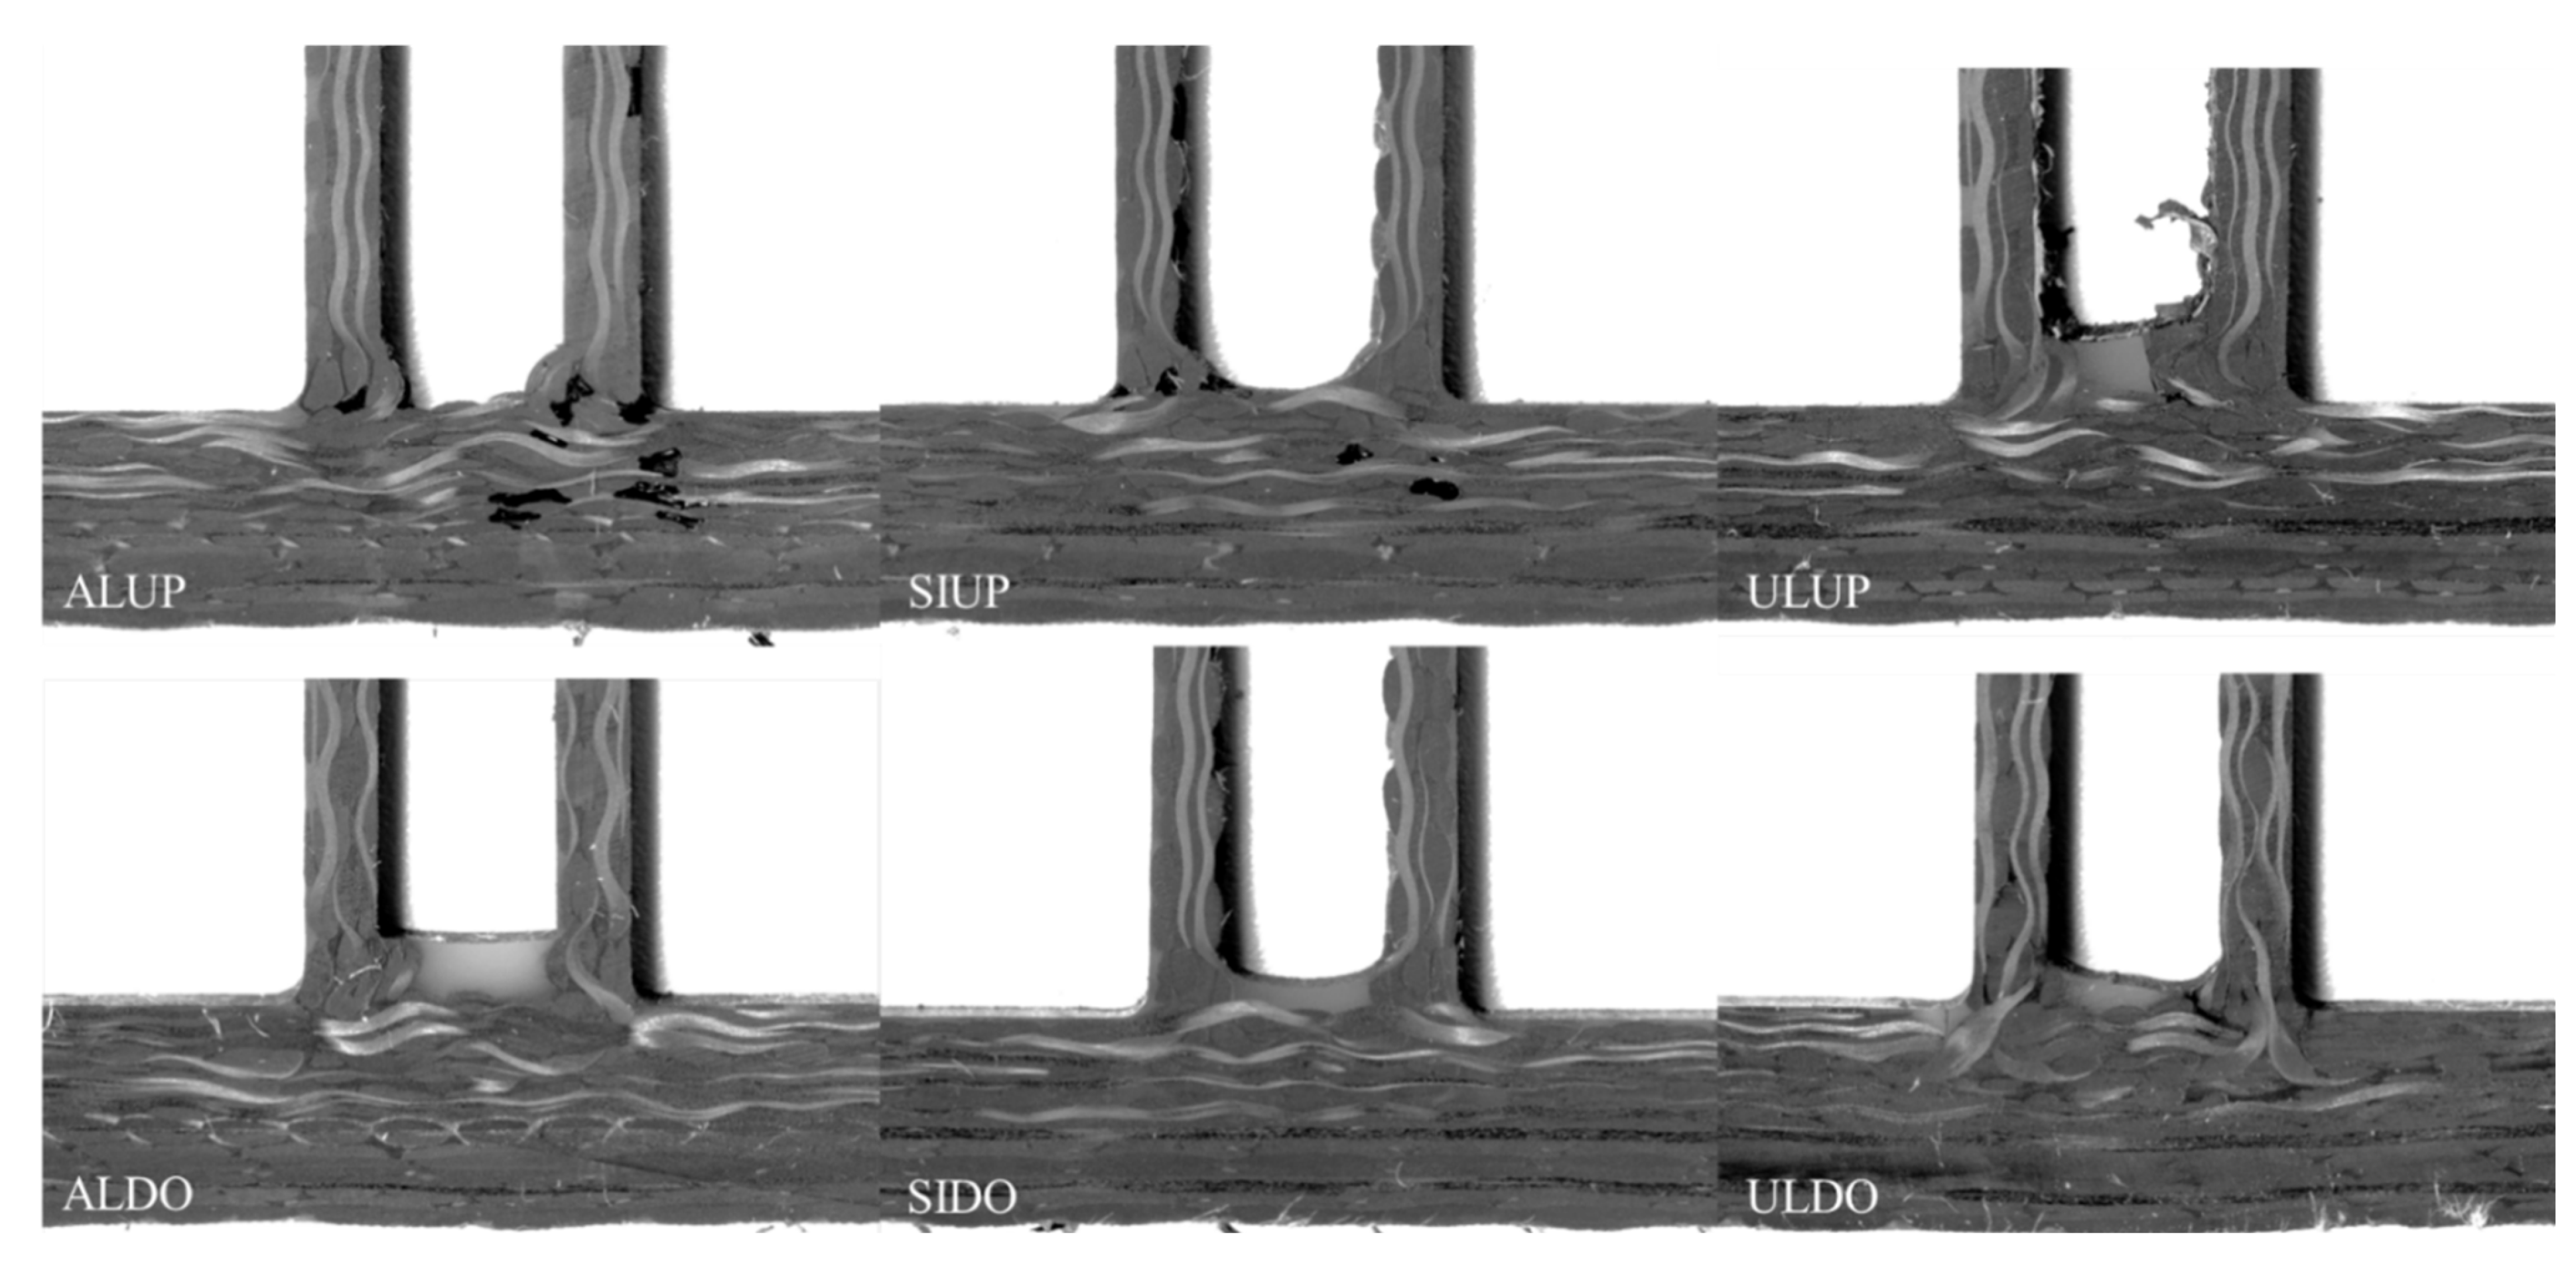
4.2.1. Cross-Sectional Images

There was insufficient clarity in the CT scans to investigate the preforming and infusion quality of the parts post-demoulding. The presence of a Bekanox® (a hybrid kevlar/stainless steel fibre; http://old.swicofil.com/bekintex.html) resulted in minimizing the detail produced by the CT scans (Figure 8). Examples of cross-sectional images taken using the high-resolution scanner are shown in Figure 9. The images revealed details of tow waviness, defects in fibre alignment, resin rich zones, and cracking, as exemplified in Figure 9. Table 4 presents a map of the defects observed TT in each part.
Across all parts, defects in fibre alignment were seen to different degrees. This was mostly prevalent at the inner base of the pi, where pinching of fibres in the upstanding pi legs was possible. Fibre pinching was more pronounced with rigid aluminium and ULTEM® inserts, whereas with a flexible insert, such as silicone, it was less common. This indicates it could have been caused by difficulty the during forming and tool loading processes, when the insert was loaded between the pi-legs and the outer aluminium blocks were closed around the preform. With the silicone insert, less force was required to load the preform into the tool and to demould the infused component. The insert could be stretched and pulled for both assembly and removal. The flexibility of the silicone resulted in easier assembly and manufacture, contributing to an improved forming quality in these components.
Large zones of resin richness were observed in the corners and inner base of the pi-preforms. In addition to these large zones, there were smaller resin-rich pockets within each part. Due to the lighting, distinguishing resin richness and porosity was difficult in the scanned images. This was mitigated by cross-referencing the CT scans from the previous work for each component. The analysis verified the cracking identified in the CT scans stemmed from resin rich areas identified in the images. Although resin rich pockets were observed across all parts, there was a higher presence of resin richness in the flow “down” configurations. The images also confirmed the higher resin richness of the ULUP/ULDO parts, as hypothesized in previous work analysing the CT scans.
With the high-resolution images, fibre paths could be traced, and defects in alignment within the different components were identified. In some parts, there was misalignment in the NCF where the pi was tooled, causing a curvature in the NCF ply. This was more common in the down infusions. Waviness and crimp was quantitatively evaluated through the control chart analysis. However, overall, the defects observed with this process demonstrate the need to establish a standardized process for documenting qualitative DfM rules, to eliminate unexpected sources of variation in manufacture in the tooling or process design stages.

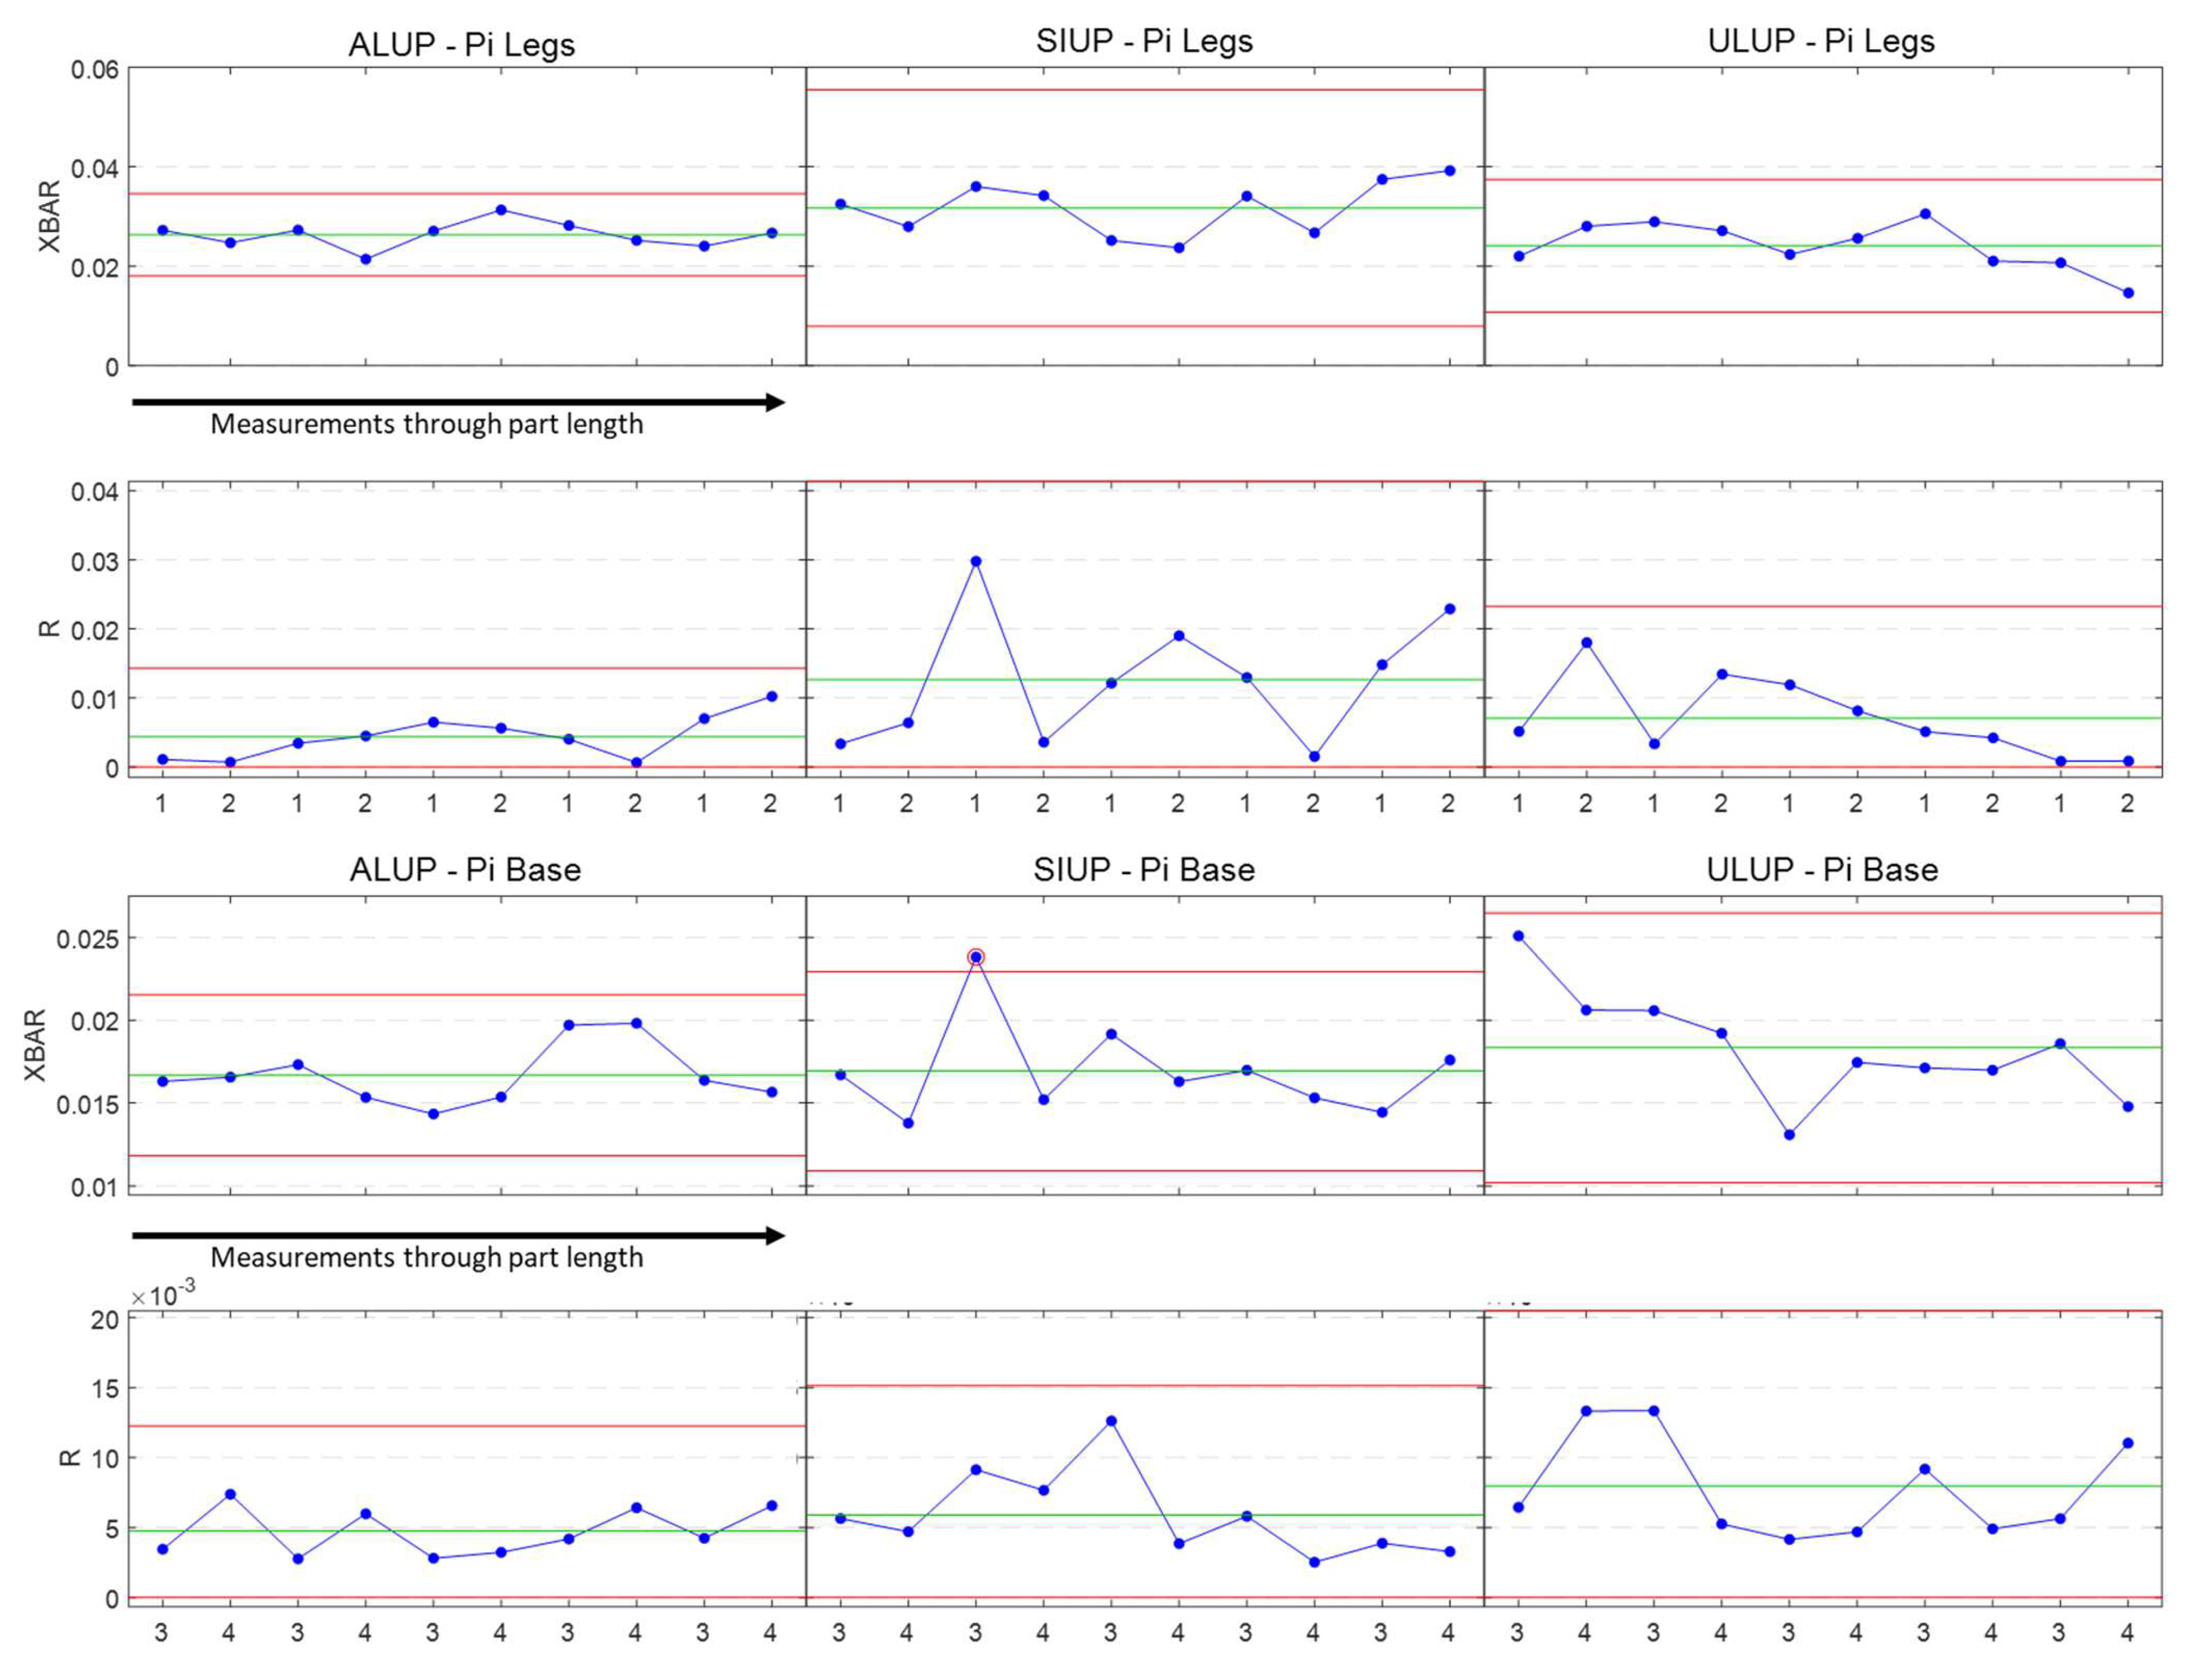
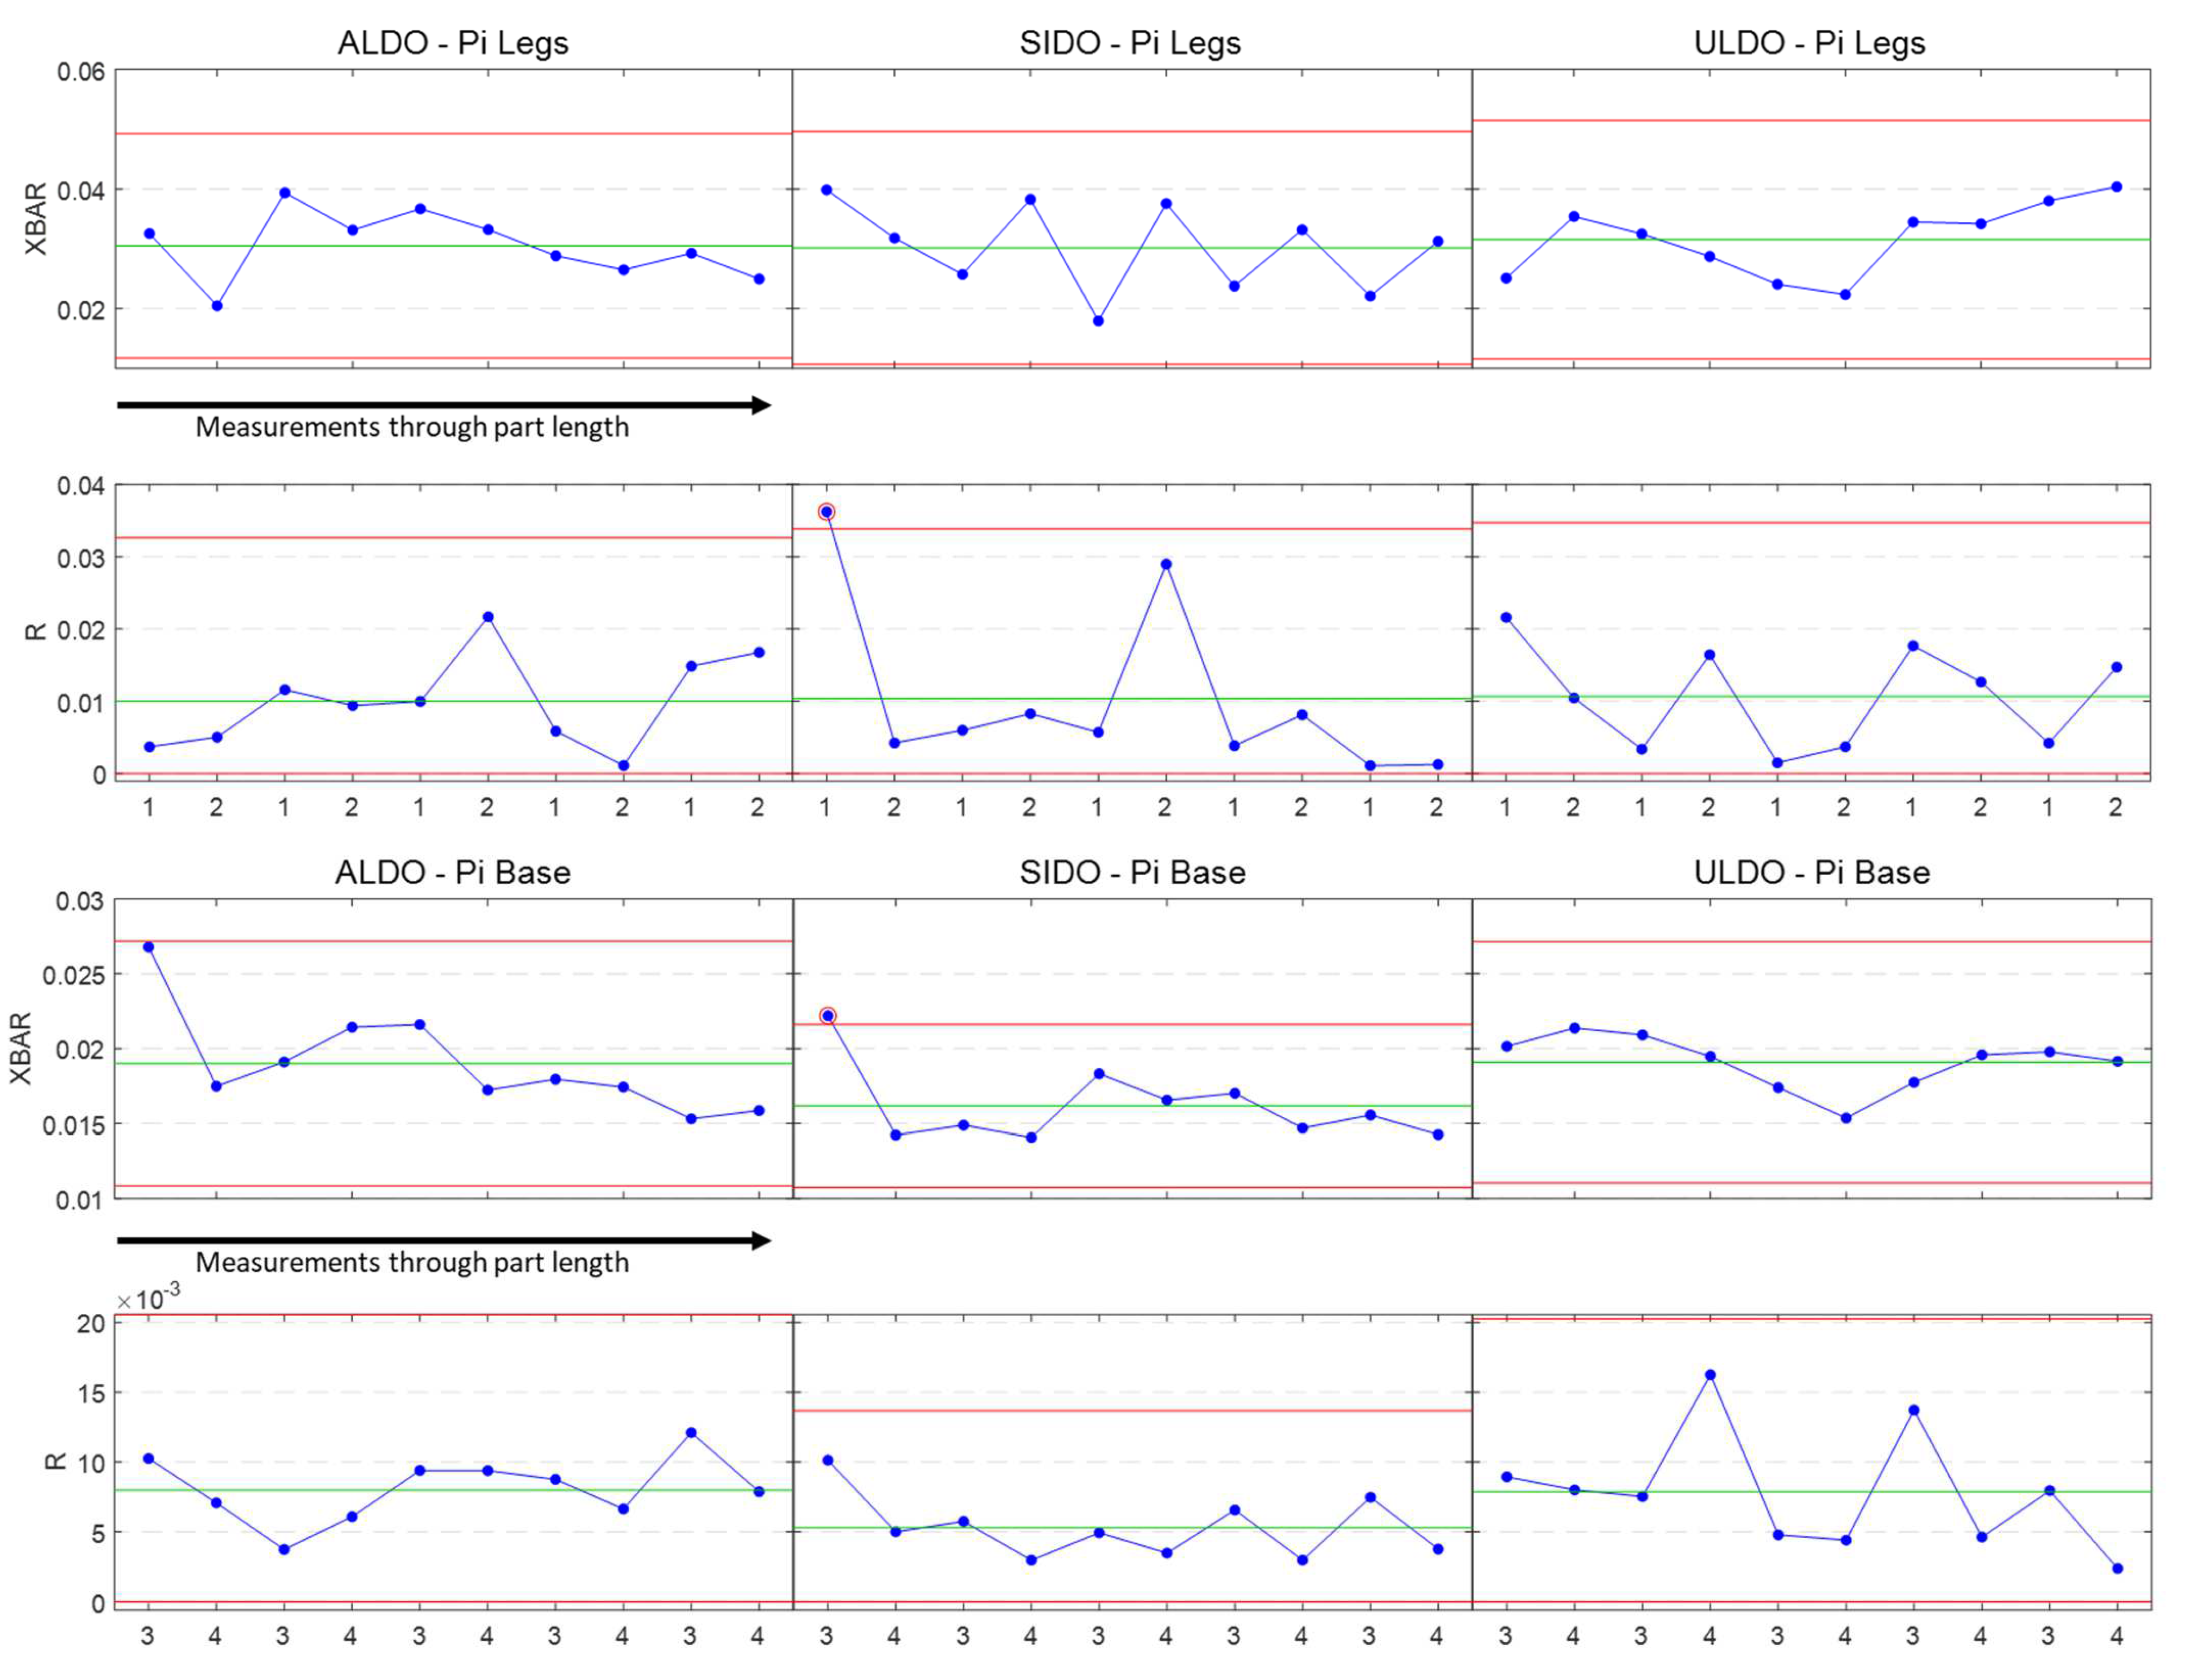
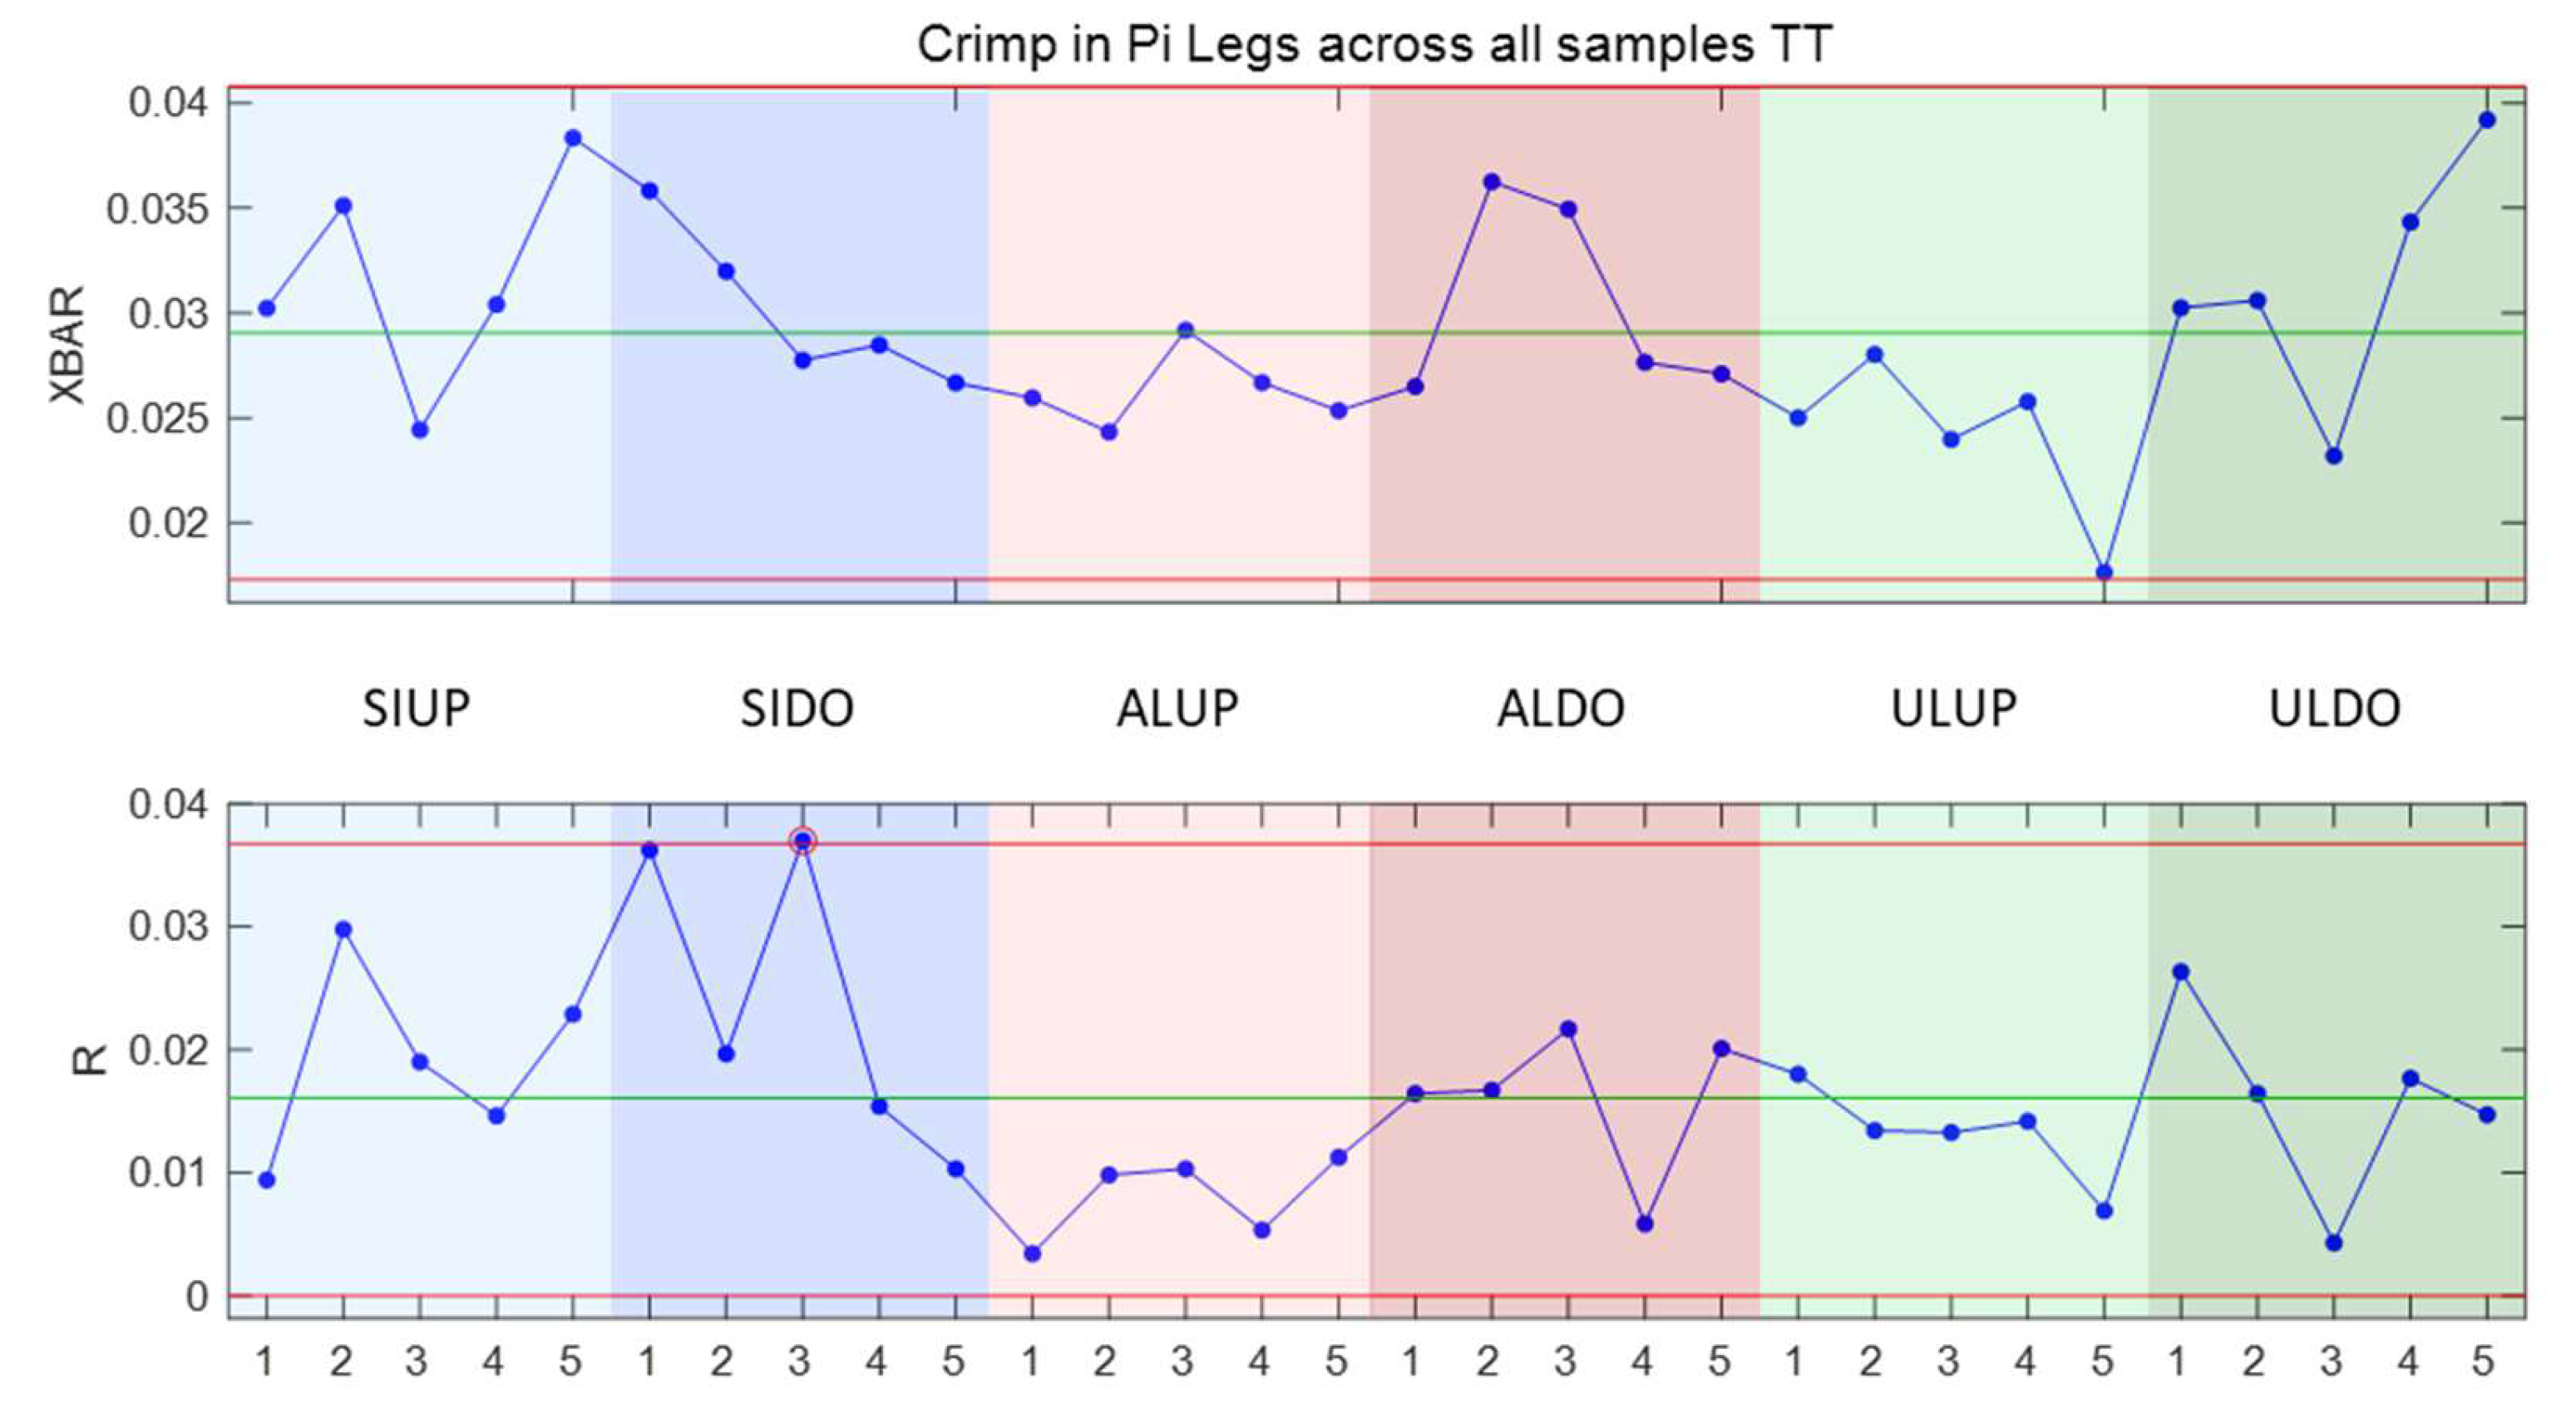
4.2.2. Crimp Data Control Charts

The X ¯ -R control charts created for each sample are displayed in Figure 10 and Figure 11. Measurements in the base of the pi and upstanding legs of the pis were separated. For each sample, 10 datasets were charted, with a subgroup size of 2–3 measurements. These datasets correspond to measurement sets taken from each of the five scans per sample. The numbers on the x-axis correspond to the measurement areas labelled in Figure 5b. In Figure 10 and Figure 11, the X ¯ measurements represent average crimp factor (calculated by Equation (1)) for a subgroup of measurements, and the R measurements highlight the range of crimp factors for each subgroup.
A summary of observations made from the control charts are listed in Table 5. The control charts indicated that: (1) For all infusions, the preforms were better consolidated in the base of the pi-section than the legs of the pi. The choice of tooling insert and infusion strategy did not have a noticeable impact on the level or range of crimp present in the pi base. (2) For both the flow “up” and “down” configurations, aluminium inserts resulted in the lowest crimp and range of crimp. In the flow “up” configuration, the silicone insert resulted in the highest crimp and largest range. Evaluating these crimp values with the geometry measurements presented in Figure 6, shows that SIUP/SIDO parts resulted in the lowest pi-leg thickness, but not the lowest crimp values. This suggests the silicone insert solution did not evenly consolidate the textile reinforcement, as evidenced by the higher degree of crimp in these parts compared to the ALUP/ALDO parts.

5. Discussion

To better understand and interpret the observations recorded, to inform tooling and infusion design guidelines, a larger dataset of TT measurements is required for each sample. Therefore, a final X ¯ -R control chart was created to present pi-leg measurements across all sample TT measurements (Figure 12). The centrelines on these charts were calculated from the crimp data of all parts. By combining these data, the variation between the different infusion strategies and tooling inserts could be directly compared. Due to its more pronounced effect on the data, only the pi-leg measurements were consolidated.
The average crimp and TT variation in crimp in pi-legs for flow “down” parts was greater than the flow “up” configurations. From the high resolution scans, these parts also had a higher resin richness and lower porosity. Therefore, the “down” infusion set-up induced variability, which can likely be attributed to difficulty in bagging the assembly with this set-up. In terms of the tooling insert, average crimp and variation in crimp were lower with more rigid inserts (aluminium) for both “up” and “down” configurations. Along the part length, the SIUP/SIDO parts had the highest variation in range (R) of crimp, which means within a part there were large discrepancies between the measured crimp values per cross-section. On the other hand, the ULUP/ULDO parts had a low variation in R but higher variation in X ¯ . This suggests that with the ULTEM® inserts, variability was induced across the part length, rather than internally, within a cross-section. This is supported by the observations from a previous work that documented the difference in handling and loading characteristics between rigid and flexible inserts [1]. The greater difficulty of manufacture with more rigid inserts is more likely to cause global variability across the part length, whereas a flexible material, that is easier to load, can induce unexpected localised variabilities.
To achieve RFTM, it is necessary to understand how manufacturing variability and risks are impacted by these different strategies in designing an infusion set-up and mould. Design guidelines for mould or tooling material selection and design typically account for:
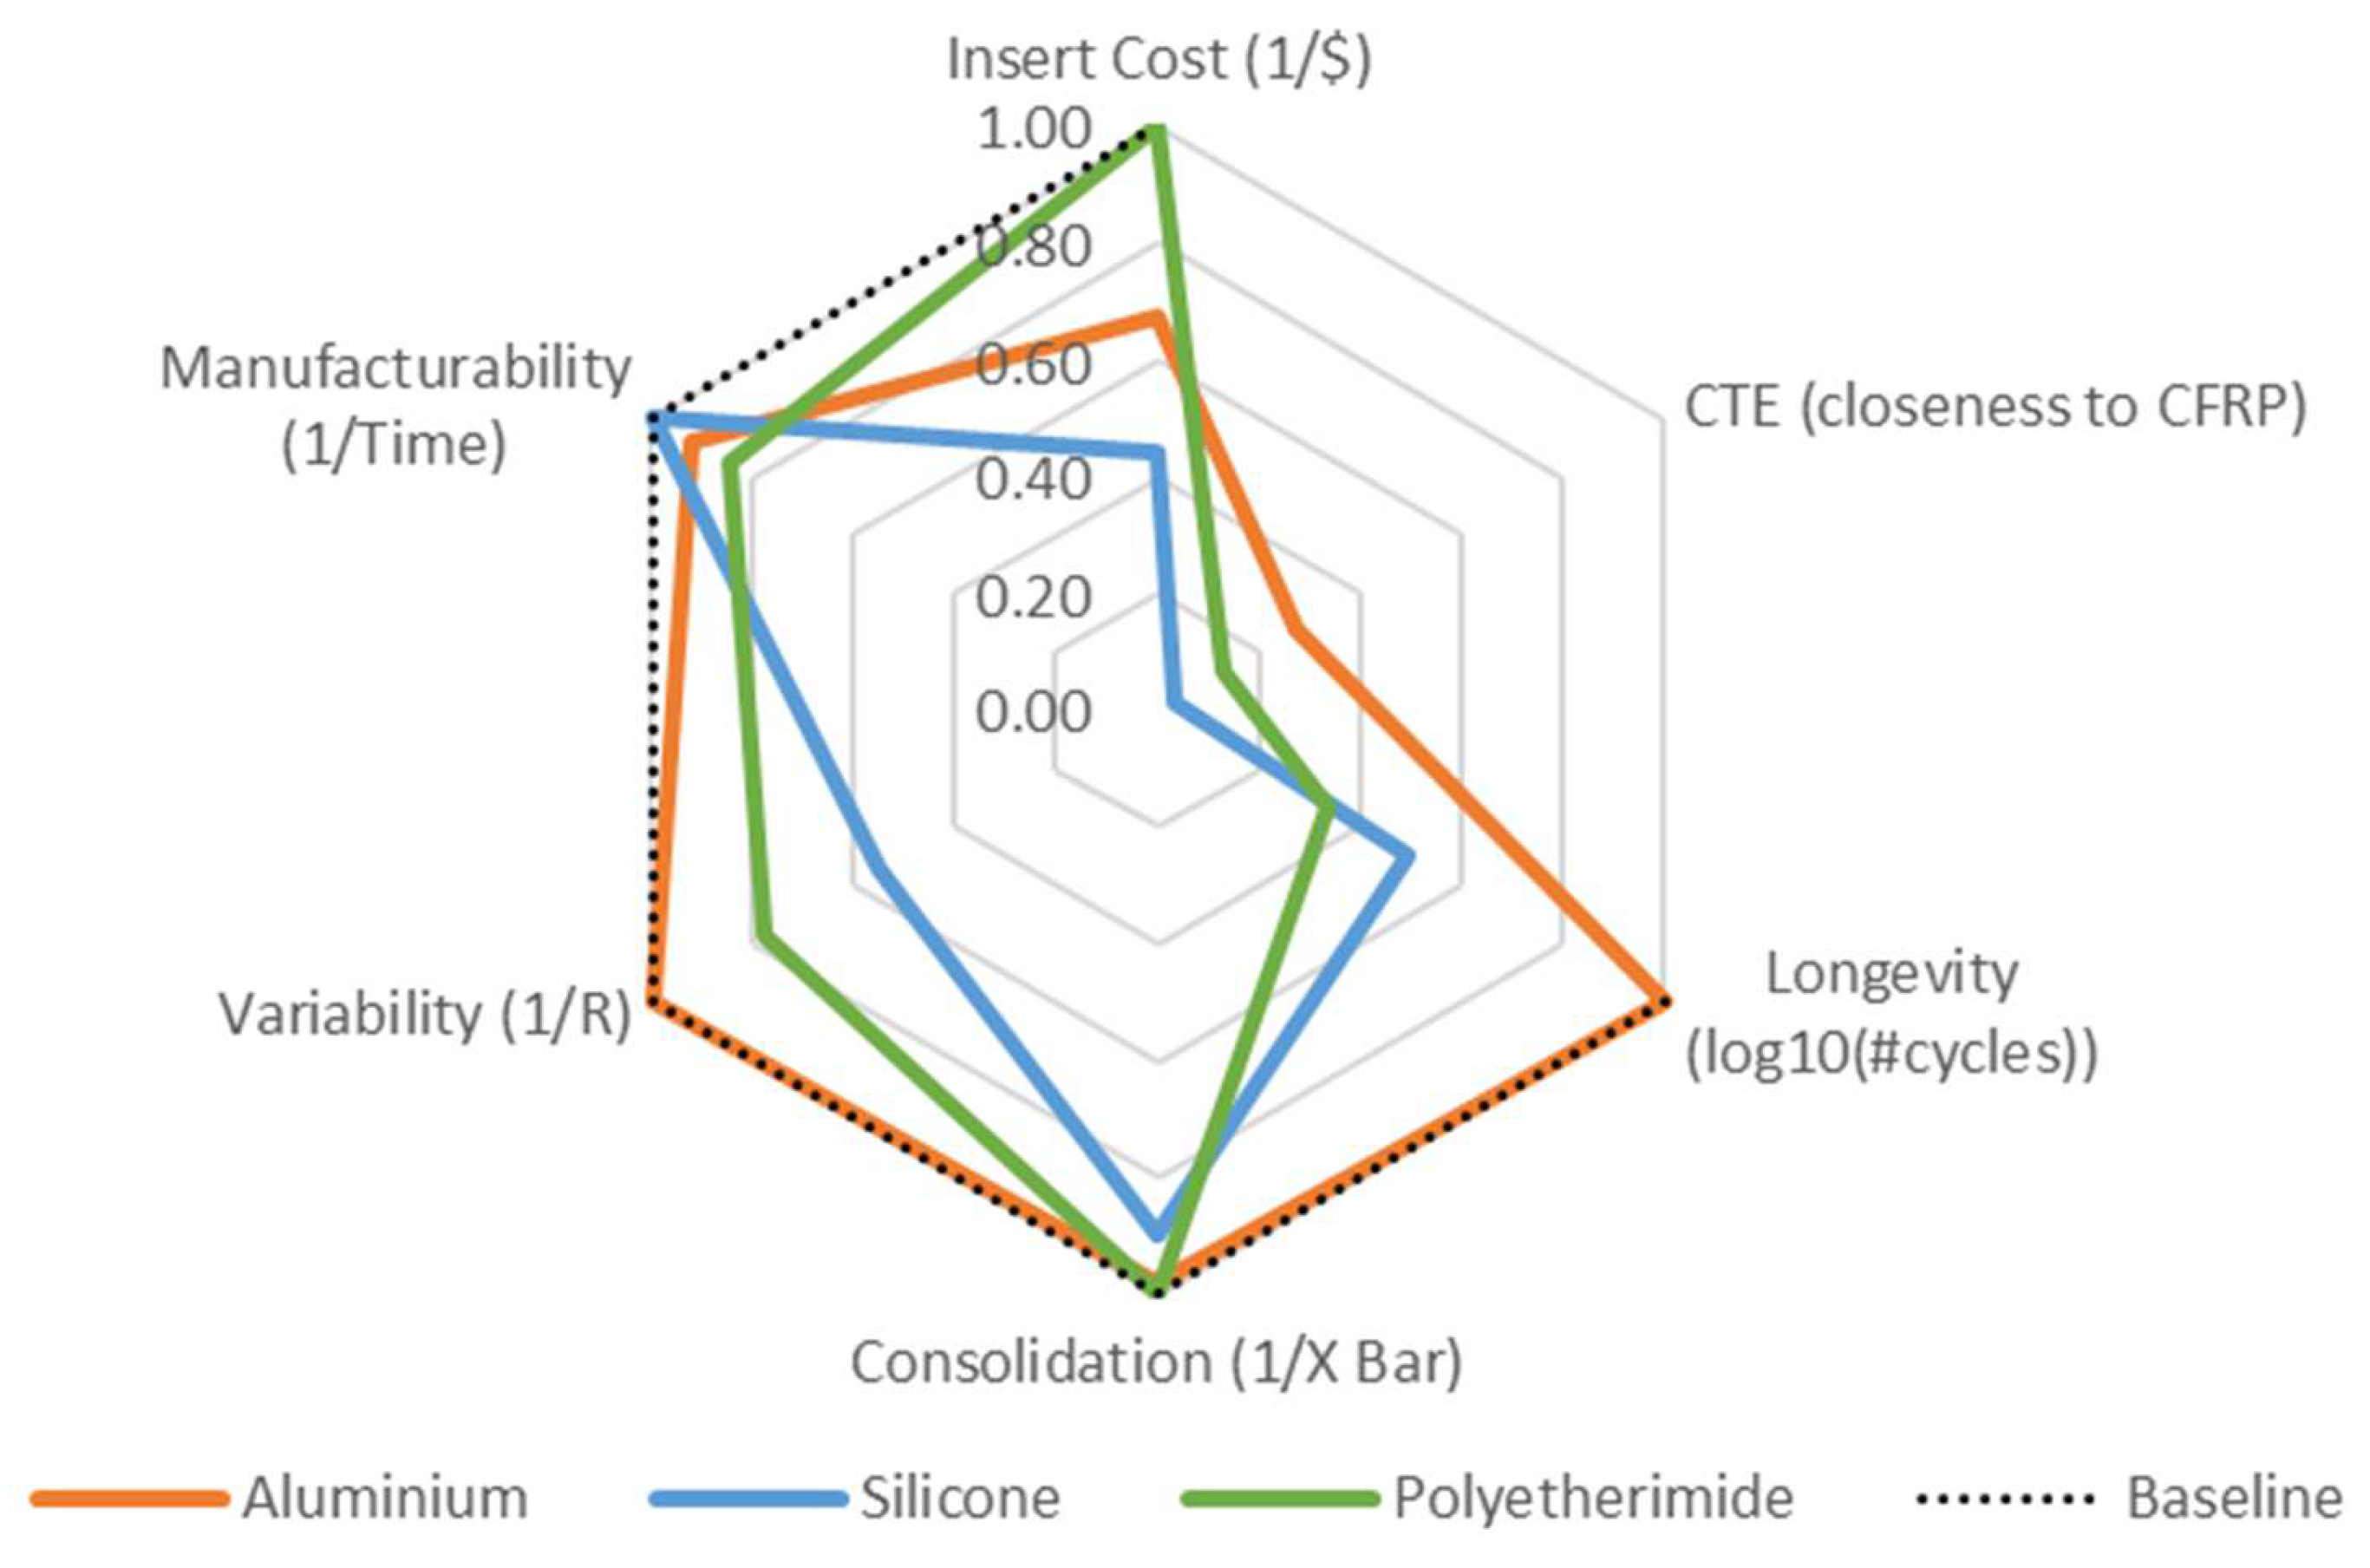
  • Cost of Materials and Machining: Raw material costs form only part of tooling costs. The machinability of the materials and manufacturing processes drive tooling costs up. For example, Invar, while having a similar raw material cost to composites, is extremely costly to machine [1].
  • Service Temperature and Coefficient of Thermal Expansion (CTE): Service temperature must exceed the cure temperature of the resin selected. Additionally, if different materials are coupled, the effect of CTE mismatch needs to be accounted for, to ensure part consolidation and geometry. (For example, silicone has a much higher CTE compared to metals).
  • Durability/Longevity: Tooling longevity and durability factors in maximising reusability. For high volume process, tools must resist thermal and mechanical deformation over repeated curing and demoulding cycles. With low volume infusion processes, a balance between ease of manufacture and durability is required.
When considering the design for an infusion tool for a complex multi-textile component, as the work presented in Section 5 supports, additional factors must be considered:
  • Consolidation/Infusion Quality: With dry fibre reinforcements, preform consolidation is achieved within the tool design. Sometimes an additional step to remove bulk from the preform is required for high fibre volume fraction requirements.
  • Manufacturability: Tooling design can have a large impact on TAKT time and turnover rates. As demonstrated in this work, ease of manufacture can induce local variabilities in a part, resulting in unintended consequences from the forming and tool loading process steps.
To support design, pertaining to consolidation, infusion quality and manufacturability, simulation efforts do not yet go far enough in informing design. Furthermore, the emphasis of simulation currently is on conventional tooling materials. For elastomeric or rapid prototyping materials, there is an even more limited body of information. Figure 13 summarises the trade-offs in the key tooling design factors identified between aluminium, silicone, and ULTEM®. The inserts were evaluated using values normalised to a baseline metric, determined for each design factor. Insert cost, CTE, longevity, and manufacturability were determined based on the cost and tooling suitability analysis presented in [1]. The baseline was set to equal the lowest cost, least number of tooling cycles, and shortest manufacturing time across all insert materials. The CTE values were normalised according to proximity to the estimated CTE for CFRPs. No baseline was defined for the CTE design factor, due to its dependence on design intent; for example, whether the design is intended to rely on expansion of the tooling material to consolidate a preform. Consolidation and variability were defined as a measure of crimp and variation in crimp, using the data from the control charts averaged across both flow “up” and flow “down” configurations. These baseline values were set to equal the lowest crimp and variation in crimp in the pi-legs.
The radar chart demonstrates how these attributes shifted with a different tooling inserts. The most notable source of differences are range in crimp, longevity, and cost with insert type. This analysis helps to systematically capture design trade-offs in variability and ease of manufacture for achieving production rate and quality targets. For example, while use of a silicone insert can improve ease of manufacture, it ranks lower on cost and variability design factors. On the other hand, the aluminium insert results in low variability and better consolidation, with a slight difference in manufacturing rates. In order to reuse this knowledge to enable RFTM design, a KBS can work in a similar network fashion to the radar plot, to determine the preferred tooling design requirements and promote understanding of cost–quality trade-offs. A modular ontology-based framework is under development to support a KBS design tool for high-performance textile CFRPs.

6. Conclusions

As the previous work had begun to highlight, there are clear effects on part quality and defects from the different tooling materials used, while keeping a constant outer tool strategy. Utilising the flexibility of a material can result in trade-offs between ease of manufacture and internally induced part variation. Furthermore, there is a clear effect on part fill time from the injection strategy through being upside down. By employing an innovative and low-cost high-resolution scanning process, statistical process control was used to track variations within a component, to help inform design trade-offs in production rate and quality prior to manufacture.
This type of in-depth analysis, to accurately check the quality of internal parts (such as a 3D woven preform) through normal production means (CMM, Ultrasonic NDT, XCT) is often not possible, resulting in lost understanding of the defects and variability demonstrated in production parts. By utilizing the aforementioned DfM methodologies and employing knowledge systems for tooling and infusion design, potentially catastrophic defects can be avoided, without multiple part manufacture, testing, and tooling design iteration loops.

Author Contributions

Conceptualization, N.B.; methodology, N.B.; software, N.B.; validation, N.B.; formal analysis, N.B.; investigation, N.B.; resources, N.B.; data curation, N.B.; writing—original draft preparation, N.B.; writing—review and editing, N.B., K.K., J.G. and C.W.; supervision, K.K., J.G. and C.W.; project administration, N.B. and C.W.; funding acquisition, K.K., J.G. and C.W. All authors have read and agreed to the published version of the manuscript.

Funding

This research is supported by the Engineering and Physical Sciences Research Council through the EPSRC Centre for Doctoral Training in Composites Manufacture (grant: EP/L015102/1) and The Future Composites Manufacturing Hub (grant: EP/P006701/1).

Data Availability Statement

All data necessary to reproduce the results and support the conclusions are included within this paper.

Acknowledgments

The authors gratefully acknowledge Albany Engineered Composites, Inc. (Rochester, NH, USA), the Bristol Composites Institute lab staff, and University or Bristol engineering workshop staff for their support of this research.

Conflicts of Interest

The authors declare no conflict of interest.

References

  1. Budwal, N.; Kasper, K.; Goering, J.; Ward, C. Flexible low-cost tooling solutions for a one-shot resin infusion of a 3D woven and multi-textile preform. Procedia Manuf. 2020, 51, 856–863. [Google Scholar] [CrossRef]
  2. Gandi, M.V.; Thompson, B.S.; Fischer, F. Manufacturing-process-driven design methodologies for components fabricated in composite materials. Mater. Des. 1990, 11, 235–242. [Google Scholar] [CrossRef]
  3. Verhagen, W.J.C.; Bermell-Garcia, P.; van Dijk, R.; Curran, R. A critical review of Knowledge-Based Engineering: An identification of research challenges. Adv. Eng. Inform. 2012, 26, 5–15. [Google Scholar] [CrossRef]
  4. Sapuan, S.M. Composite Materials: Concurrent Engineering Approach; Butterworth-Heinemann: Oxford, UK, 2017. [Google Scholar]
  5. Budwal, N.; Kasper, K.; Goering, J.; Ward, C. Developing knowledge-based systems for the cost-effective product design of high-performance textile fibre-reinforced composites. In Proceedings of the Composites and Advanced Materials Expo, Dallas, TX, USA, 20 October 2021. [Google Scholar]
  6. Warren, K.C.; Lopez-Anido, R.A.; Goering, J. Experimental investigation of three-dimensional woven composites. Compos. Part A: Appl. Sci. Manuf. 2015, 73, 242–259. [Google Scholar] [CrossRef]
  7. Akin, M. Co-cured Manufacturing of Advanced Composite Materials Using Vacuum Assisted Resin Transfer Moulding. Master’s Thesis, Middle East Technical University, Ankara, Turkey, 2018. [Google Scholar]
  8. Deo, R.B.; Starnes, J.H.; Holzwarth, R.C. Low-Cost Composite Materials and Structures for Aircraft Applications. 2003. Available online: https://docshare.tips/mp-069ii-sm1-01_574a4c6cb6d87ff00a8b4ada.html (accessed on 20 April 2022).
  9. An Elegant Solution for a Big Composite Part. Available online: https://www.compositesworld.com/articles/an-elegant-solution-for-a-big-composite-part (accessed on 20 April 2022).
  10. Bannister, M.K. Development and application of advanced textile composites. Proc. Inst. Mech. Eng. Part L J. Mater. Des. Appl. 2004, 218, 253–260. [Google Scholar] [CrossRef]
  11. Cost Reduction Central to Airbus Future-Wing Programme. Available online: https://www.flightglobal.com/airframers/cost-reduction-central-to-airbus-future-wing-programme/132676.article (accessed on 10 January 2022).
  12. Rieber, G.; Jiang, J.; Deter, C.; Chen, N.; Mitschang, P. Influence of textile parameters on the in-plane Permeability. Compos. A Appl. Sci. Manuf. 2013, 52, 89–98. [Google Scholar] [CrossRef]
  13. Konstantopoulos, S.; Hueber, C.; Antoniadis, I.; Summerscales, J.; Schledjewski, R. Liquid composite molding reproducibility in real-world production of fiber reinforced polymeric composites: A review of challenges and solutions. Adv. Manuf. Polym. Compos. Sci. 2019, 5, 85–99. [Google Scholar] [CrossRef]
  14. Baran, I.; Cinar, K.; Ersoy, N.; Akkerman, R.; Hattel, J.H. A Review on the Mechanical Modeling of Composite Manufacturing Processes. Arch. Comput. Methods Eng. 2017, 24, 365–395. [Google Scholar] [CrossRef] [PubMed] [Green Version]
  15. Gupta, S.K.; Regli, W.C.; Das, D.; Nau, D.S. Automated manufacturability analysis: A survey. Res. Eng. Des. 1997, 9, 168–190. [Google Scholar] [CrossRef]
  16. Haffner, S.M. Cost Modeling and Design for Manufacturing Guidelines for Advanced Composite Fabrication. Ph.D. Thesis, Massachusetts Institute of Technology, Cambridge, MA, USA, 2002. [Google Scholar]
  17. Sivanathan, L. Developing Composites Design and Manufacturing in an SME for Assured Product Quality. Ph.D. Thesis, University of Bristol, Bristol, UK, 2020. [Google Scholar]
  18. Sundin, E.; Björkman, M. Development of a Design for Manufacturing and Assembly (DFM/A) methodology concerning products and components made in composites of Carbon Fiber Reinforced Plastics (CFRP) used in the Aerospace Industry. In Proceedings of the Swedish Production Symposium (SPS-16), Lund, Sweden, 25–27 October 2016. [Google Scholar]
  19. Butenko, V.; Albers, A. Improving the knowledge transfer from research to industry by developing demand-oriented design guidelines for fibre-reinforced plastics. Procedia CIRP 2018, 70, 41–46. [Google Scholar] [CrossRef]
  20. Miller, A.J. The Effect of Microstructural Parameters on the Mechanical Properties of Non-Crimp Fabric Composites. Ph.D. Thesis, Cranfield University, Cranfield, UK, 1996. [Google Scholar]
  21. X Bar R Control Charts. Available online: https://sixsigmastudyguide.com/x-bar-r-control-charts/ (accessed on 29 March 2022).
Figure 1. (a) Modular infusion tool design; (b) Flow “up” and “down” infusion set-ups with red and green arrows representing direction of resin flow.
Jmmp 06 00062 g001
Figure 2. (a) 3D reconstruction of pi-NCF geometry showing five locations of cross-sectional CT measurements along the part length; (b) Measurements taken from each of the five CT scan cross-sections, corresponding to the results presented in Section 4.1.
Jmmp 06 00062 g002
Figure 3. Sample map showing TT sections machined requiring eight cuts for each sample.
Jmmp 06 00062 g003
Figure 4. Visual representation of crimped length of yarn (LC) and curved path length of yarn (LT).
Jmmp 06 00062 g004
Figure 5. (a) Example of tracing tool for measuring yarn paths in ImageJ; (b) Cross-sectional image of Pi-NCF component labelling warp and weft yarns, NCF layers, and crimp measurement zones.
Jmmp 06 00062 g005
Figure 6. (ae) Results of CT analysis on pi-NCF geometry. Left to right: internal angle, external angle, average pi-leg width, base height difference, inner width.
Jmmp 06 00062 g006
Figure 7. CT cross-sections of pi-NCF parts. Yellow circles show indications of cracking, red highlights larger areas of porosity, a combination of red/yellow indicates both.
Jmmp 06 00062 g007
Figure 8. High-resolution scans of part cross-sections, as labelled in the bottom left corners.
Jmmp 06 00062 g008
Figure 9. Examples of different defects identified from cross-sectional images.
Jmmp 06 00062 g009
Figure 10. Control charts measuring change in crimp TT in flow-“up” parts (ALUP, SIUP, ULUP).
Jmmp 06 00062 g010
Figure 11. Control charts measuring change in crimp TT in flow-“down” parts (ALDO, SIDO, ULDO).
Jmmp 06 00062 g011
Figure 12. Control chart to represent variation in crimp of Pi legs across all samples TT.
Jmmp 06 00062 g012
Figure 13. Radar chart with normalized values representing suitability to key design requirements for all samples.
Jmmp 06 00062 g013
Table 1. Industry examples towards integration of composite assemblies.
ExampleDetailsRef.
McDonnell Douglas
AV-8B Strike Fighter wing and forward fuselage
Eliminated 60% of fasteners and reduced part count by 62% by co-curing subcomponents[7]
Dasa Airbus
A300 and A310 vertical tail fin
A 95% reduction in part count (from 2000 to 100)[8]
Airbus
A380 Rear Pressure Bulkhead
Transitioned to non-crimp fabric preform design with two-step cure and integrated pre-preg stiffeners[9]
Lockheed Martin
Joint Strike Fighter (F-35) inlet duct
Demonstrated that 36 kg of weight and USD 200,000 could be saved by using 3D woven stiffeners, eliminating 95% fasteners[10]
Airbus
Wing of Tomorrow
Developing an integrated dry-fibre infused wing structure for single-aisle aircraft, to simplify assembly and reduce fasteners[11]
Table 2. Manufacturing parameters and data for pi-NCF infusions.
Sample NameInsert
Material
Infusion StrategyInletOutletInfusion Time (min)Average Flowrate (g/min)Peak Flowrate (g/min)Estimated FVF (%)
ALUPAluminiumUpNCFPi8709070
ALDOAluminiumDownPiNCF45206068
SIUPSilicone 1UpNCFPi88015069
SIDOSilicone 1DownPiNCF50209068
ULUPULTEM™ 2UpNCFPi203010067
ULDOULTEM™ 2 DownPiNCF28207568
Table 3. Measured crimp (%) used for creating control charts.
SampleTT NumPi LegsPi Base
Zone 1 (%)Zone 2 (%)Zone 3 (%)Zone 4 (%)
SIUP13.13.42.53.11.72.01.41.21.61.4
25.12.13.63.22.71.82.71.61.11.8
33.11.93.31.41.72.61.41.91.51.5
44.12.82.62.72.01.41.71.61.61.4
54.53.02.85.11.41.61.31.91.61.7
SIDO12.25.83.03.42.11.72.81.31.21.7
22.92.33.44.21.81.31.41.41.31.6
32.11.52.35.22.02.01.51.71.81.4
42.62.22.93.72.01.31.71.61.41.3
52.32.23.23.12.01.41.31.41.61.2
ALUP12.82.72.52.41.81.41.72.11.41.5
22.92.61.92.41.61.61.91.61.21.8
32.43.02.83.41.31.61.41.71.41.4
43.02.62.62.52.12.11.71.62.32.0
52.82.12.23.21.61.41.91.81.11.8
ALDO13.13.42.31.82.23.32.51.51.62.2
23.44.52.83.82.11.91.72.41.82.3
33.24.24.42.22.22.61.71.71.32.2
43.22.62.72.62.12.01.32.11.41.8
52.23.73.31.72.21.01.41.21.62.0
ULUP11.92.51.93.72.62.82.11.61.62.9
23.12.72.03.42.91.71.61.71.92.2
31.62.83.02.21.51.41.12.01.81.5
43.32.81.92.32.11.11.92.01.51.7
52.12.01.51.41.71.62.22.11.31.0
ULDO11.43.63.04.12.61.71.82.22.51.7
23.13.42.03.72.51.72.02.81.81.2
32.52.32.42.02.01.61.61.31.61.7
42.64.34.12.82.61.21.52.21.91.7
53.64.03.34.82.51.71.71.82.02.0
Table 4. Map of defects observed TT on parts from scanned images.
SampleSIUPSIDOALUPALDOULUPULDO
TT#123451234512345123451234512345
DefectsOn scale of 1 (low/none) to 5 (high)
Dry spots/Voids 143311111124422111111111111111
Fibre misalignment 112211122123322132214233432123
Resin Rich Corners112212352313321332554543433333
Resin Rich pockets221221323222223233434434433343
Resin Cracking122211221122111321333342112121
Table 5. Control chart observations.
SubcategoryObservations
Flow “up” infusions
  • Average crimp ( X ¯ ) in the Pi legs was between 2.5 and 3%, and between 1.5 and 2% in the Pi Base.
  • Comparing across the different insert materials in Pi Legs
    SIUP had the highest X ¯ and largest R. The R chart also had the largest deviations from the centreline.
    ALUP had the lowest X ¯ and smallest R.
    ULUP presented a slight decreasing trend in both X ¯ and R across part length.
  • Comparing across the different insert materials in the Pi Base,
    One of the SIUP X ¯ values was beyond the UCL.
    ALUP had the lowest X ¯ and smallest R.
    ULUP had the highest X ¯ and largest R. In line with the Pi leg control charts, there was a slight decreasing trend in X ¯ .
Flow “down” infusions
  • Average crimp ( X ¯ ) in the Pi legs was between 3.5 and 4%, and between 1.5 and 2% in the Pi Base
  • Comparing across the different insert materials in Pi Legs
    SIDO and ALDO had a very similar average X ¯ and R across part length
    ALDO had a slight decreasing trend in X ¯ across part length.
    One of the SIDO R values was beyond the UCL. On average, the SIDO X ¯ values deviated more from than centreline than ALDO and ULDO.
  • Comparing across the different insert materials in the Pi Base,
    ALDO and ULDO had a very similar X ¯ and R across part length.
    ALDO had a slight decreasing trend in X ¯ across part length.
    One of the SIUP X ¯ values was beyond the UCL.
Publisher’s Note: MDPI stays neutral with regard to jurisdictional claims in published maps and institutional affiliations.

