Abstract
The Southwire Continuous Rod (SCR) process is widely used for producing low-oxygen copper rods, yet pore defects remain a significant challenge, affecting the performance and drawability of copper wire. In this study, the influence of casting speed on solidification behavior and porosity formation in low-oxygen copper casting rods was investigated by combining numerical simulation and plant trials. The simulation results indicate that increasing the casting speed elevates the flow velocity and impact depth of molten copper in the casting wheel. Simultaneously, higher casting speeds could raise the temperature of the casting rod and extend the liquid phase region, which suppresses the precipitation of dissolved gases from the melt. However, when the casting speed exceeds 26 t/h, the center temperature of the casting rod at the outlet remains close to the melting point of copper, retaining 10–20% liquid fraction. This predisposes the rod to remelting and the formation of remelt holes, and thus it fails to meet the design requirement for complete solidification of the SCR technology. Further industrial trials confirm that a casting speed of 23 t/h is optimal under current process conditions, yielding the lowest size and number of porosity defects in the casting rod.
1. Introduction
Copper wires are widely used in power transmission, electronics, and the automotive industry due to their excellent electrical conductivity, corrosion resistance, and mechanical properties. The production of copper wires primarily involves rod manufacturing and wire drawing. Among these, the low-oxygen copper rod (oxygen content ≤ 400 ppm) is a crucial raw material for producing high-quality copper wire. Rod manufacturing processes mainly include continuous casting and rolling (CCR), the upward drawing method, and the dip coating method. Among these, CCR technologies have become the most widely used due to their high production efficiency, low cost, and high quality. CCR technologies mainly include Southwire Continuous Rod (SCR, Carrollton, GA, USA), Contirod (SMS Meer, Mönchengladbach, Germany), and Properzi (Sordio, Italy) [1,2,3].
The SCR process represents the most prevalent CCR technology for copper rod production; its workflow is illustrated in Figure 1. The main process is as follows: Electrolytic copper is melted in a shaft furnace to form molten copper, then the melt flows sequentially through a slag pool, holding furnace, and ladle before being poured through a nozzle into the casting wheel of a five-wheel caster. The molten copper solidifies rapidly under water cooling to form a casting rod, which undergoes multiple rolling passes to produce an Φ 8 mm low-oxygen copper rod. The rod is then cleaned, waxed, coiled, and packaged for storage [1,4].
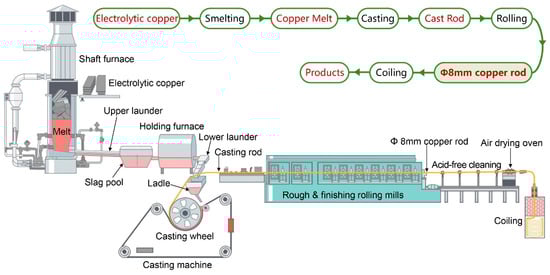
Figure 1.
Schematic diagram of SCR continuous casting and rolling production line.
During the SCR casting process, the melt passes through the slag pool and holding furnace and ladle before being cast in the five-wheel caster, which may introduce various defects, including inclusions and porosity. Porosity defects account for over 70% of casting defects in low-oxygen copper rods. Porosity defects severely impair the mechanical properties, electrical conductivity, and drawability of the final copper wire [4,5]. Moreover, pores act as stress concentration points, leading to reduced drawability and increased breakage rates during subsequent wire drawing.
The formation of porosity defects in the SCR casting process primarily stems from external gas entrapment and internal gas precipitation. External gas entrapment accounts for approximately 40–60% of porosity defects. It originates mainly from air or process gases being mechanically entrapped in the melt during dynamic casting processes [6,7] and subsequently “frozen” as isolated bubbles in the rapid solidification front. Internal gas precipitation accounts for approximately 30–50% of porosity defects, arising from the thermodynamic instability of dissolved gases in the melt. Under the short solidification time of the SCR process (<10 s), gases cannot fully escape, leading to precipitated bubbles being captured by grain boundaries to form dispersed or concentrated defects. This primarily involves the dissolution of supersaturated hydrogen in low-oxygen copper, which originates primarily from moisture in the raw materials, furnace atmosphere, etc. [8,9,10], as hydrogen solubility in molten copper varies sharply with temperature (solid state < 0.001 ppm; liquid state ~0.1 ppm). The solubility of hydrogen in molten copper at pouring temperature (~1150 °C) is high, but it will drop abruptly at the solidification temperature (~1085 °C), causing hydrogen supersaturation and the precipitation of H2 gas [11]. Although electrolytic copper raw materials undergo vacuum degassing, residual H2 (5–20 ppm) can reabsorb hydrogen from furnace gases or moisture during extended holding (>30 min). These microbubbles grow in the mushy zone (liquid fraction α = 0.2–0.8) with a volume expansion rate of up to 10 times. If the cooling rate is non-uniform (gradient > 50 K/mm), bubbles deform and are trapped by dendrites, forming micropores (<100 μm in diameter).
Although the porosity formation mechanisms in SCR casting are understood, there are no reports regarding the specific influence of SCR casting parameters on porosity formation. Therefore, this study combines numerical simulations with plant trials to investigate the effect of casting speed on the flow field, temperature field, liquid fraction, and porosity formation during SCR casting. The aim is to provide practical guidance for optimizing SCR continuous casting parameters to reduce porosity defect incidence, thereby enhancing the quality and performance of casting rods.
2. Materials and Methods
2.1. Plant Trials
The plant trials were conducted on an SCR3000 continuous casting and rolling production line with an annual capacity of 150,000 tons of low-oxygen copper rod at JXTC Ltd. (Yingtan, China) The production line comprised a shaft furnace, slag pool, holding furnace, ladle, five-wheel caster, rolling mill, etc. JCC-grade electrolytic copper with a purity ≥ 99.95% was used as the raw material
Based on the actual production capacity of the SCR3000 line, the experimental casting speed range was set at 21–24 t/h with variables of 21 t/h, 22 t/h, 23 t/h, and 24 t/h. All other conditions remained consistent with normal production. Each trial group was separated by a 3 min interval to ensure that there was no interference between experiments. Three casting rod samples were collected for each experiment, with a 1 min sampling interval between adjacent samples to minimize random error. The cross-sections of the samples were ground and polished, and porosity characteristics (size and number) were quantified using high-magnification optical microscopy.
2.2. Numerical Models of the SCR Casting Wheel
2.2.1. Geometric Model
To quantitatively analyze the effect of casting speed on the temperature field, melt length, and solidification front, a 1:1 finite element geometric model was built based on the geometric parameters of the SCR3000 five-wheel caster at JXTC Co., Ltd. The model primarily comprises the chamber (mold cavity), casting wheel, and steel strip, as shown in Figure 2. The inner and outer diameters of the casting wheel are 1120 mm and 1168 mm, respectively, and the cross-sectional area of the casting rod is 3800 mm2. Due to the large diameter of the casting wheel, the circumferential dimension of the mold cavity is far greater than the width. Therefore, heat transfer along the rod width was ignored, and only heat transfer along the rod thickness and casting direction was calculated to simplify the model and improve efficiency. In five-wheel continuous casting, complete solidification of the molten copper from liquid to solid by the 6 o’clock position is essential to prevent the backflow of molten copper and the formation of remelt holes [12]. Accordingly, a two-dimensional longitudinal section of the mold, extending to the arc length at the 6 o’clock region, was selected as the computational domain.
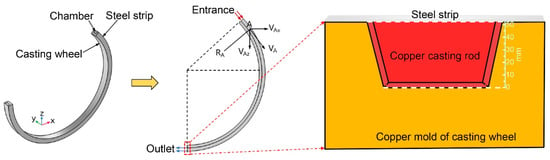
Figure 2.
Geometrical model of casting wheel in SCR technology.
2.2.2. Mathematical Calculation Model
The model calculates the solidification and heat transfer process of molten copper in the mold based on the Finite Element Method (FEM). The governing equations include the momentum equation for flow, the energy equation for heat transfer, and the k-ε turbulence model [13,14,15].
(a) Continuity equation:
(b) Momentum Equation:
where ρ is the fluid density, u is the velocity vector, p is the pressure, F is the volume force source term, I is the unit tensor, μ is the dynamic viscosity, and μT is the turbulent viscosity, expressed as follows:
where k is the turbulent kinetic energy and ε is the turbulent dissipation rate, calculated by the k-ε turbulence model:
where Cμ = 0.09, Cε1 = 1.44, Cε2 = 1.92, σk = 1.0, σε = 1.3.
The volume force source term F is calculated as follows:
where Fx and Fz are volume force components in the x and z directions, α is the liquid volume fraction, Amush is the mushy zone damping constant, δ denotes machine precision, u and w are velocity components in the x and z directions, and VAx and VAz are the components of the tangential velocity VA at point A in the x and z directions.
As shown in Figure 2, VA is calculated as based on geometric relations:
where V is the casting speed, F is the casting rate (mass flow), S is the rod cross-sectional area, and RA is the distance from point A to the rotation center. VA can be decomposed along x and z as follows:
where x and z are coordinates with the casting wheel geometric center as the origin.
(c) Energy equation:
where Cp is the fluid-specific heat capacity at constant pressure, λ is the fluid thermal conductivity, and Q is the heating power per unit volume (heat source term).
(d) Heat equation:
The lumped heat capacity method is adopted for phase change modeling, where the latent heat is included in the heat capacity as an additional term. The material heat capacity is expressed as follows:
α(T) is the phase change function. For pure solid, α(T) = 0; for pure liquid, α(T) = 1; L1→2 is the latent heat of phase change, with a value of 212.5 kJ/kg.
2.2.3. Boundary Conditions
The model includes flow boundary conditions and heat transfer boundary conditions.
(a) Melt inlet and rod outlet
The molten copper inlet is set as a pressure inlet, and the rod outlet is set as a velocity outlet (equal to the casting speed). The inlet temperature equals the pouring temperature.
(b) Wall boundary conditions
Walls in the flow domain enforce no-slip conditions. For heat transfer, walls use convective heat flux via Newton’s law of cooling:
where q is the convective heat flux, h is the convective heat transfer coefficient, Text is the cooling water temperature at the exit, and T is the temperature of the mold wall.
2.2.4. Physical Properties
The main physical property parameters of the three materials involved in the model calculation are shown in Table 1, Table 2 and Table 3.

Table 1.
The physical parameters of steel strip.
Table 2.
The physical parameters of copper mold for casting wheel.
Table 3.
The physical parameters of molten copper.
3. Results and Discussion
3.1. Flow Field Distribution of Molten Copper Within Casting Wheel
Figure 3 illustrates the flow fields of molten copper inside the casting wheel at different casting speeds. The results show that as casting speed increases, the inlet flow velocity of the molten copper increases from azure (indicating low velocity) to green (medium velocity), and locally to red (high velocity). This indicates an increase in the inlet velocity and the impact depth of the main stream, leading to increased turbulence (disorder) of the molten copper flow within the casting wheel. The increased chaotic nature of the molten copper flow increases bubble penetration depth and shortens bubble escape time, which is unfavorable for bubble flotation [16].
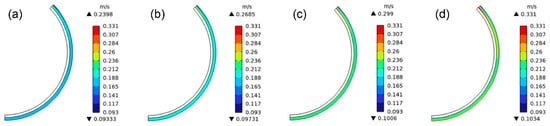
Figure 3.
Flow field distribution of molten copper within casting wheel at different casting speeds: (a) 22 t/h; (b) 24 t/h; (c) 26 t/h; and (d) 28 t/h.
3.2. Temperature Distribution of Casting Rod Within Casting Wheel
Figure 4 depicts the temperature fields of molten copper inside the casting wheel at different casting speeds. With increasing casting speed, the overall temperature in the casting wheel rises monotonically, with steeper temperature gradients in the upper region. This reflects that higher casting speeds increase heat input, shifting the thermal balance toward higher temperatures and extending the liquid pool length (defined as the distance from the meniscus to the solidification front). This phenomenon arises from increased heat load per unit time at higher casting speeds, prolonging heat conduction paths, thereby retarding the advancement of the solidification front [17,18].
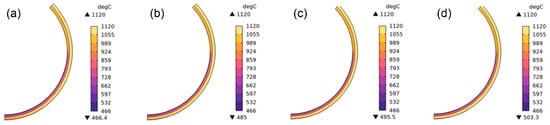
Figure 4.
Temperature distribution of casting rod within casting wheel at different casting speeds: (a) 22 t/h; (b) 24 t/h; (c) 26 t/h; and (d) 28 t/h.
For a more intuitive comparison of casting speed effects on rod temperature, cross-sectional temperatures at the outlet (6 o’clock position) were extracted, as shown in Figure 5. The horizontal axis represents distances from the bottom of the casting rod cross-section (see Figure 2). The temperature curve initially rises and then falls from the bottom to the center and then to the top. The bottom, being in direct contact with the water-cooled copper mold, has the highest cooling intensity and thus the lowest temperature. The temperature gradually increases towards the center, reaching a maximum, as cooling intensity is weakest there. Towards the top, the temperature decreases again due to contact with the water-cooled steel strip, which also provides effective cooling.
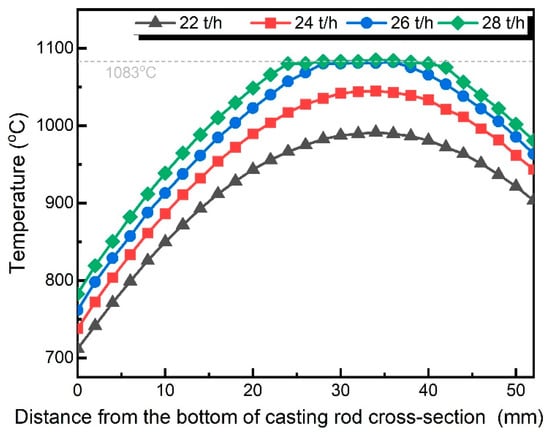
Figure 5.
Temperature curve of casting rod at different positions distance from the surface of the casting wheel.
Comparing temperature curves at different casting speeds reveals that the temperatures within the casting rod rise significantly with increasing casting speed. Increasing the casting speed markedly raises the outlet temperature of the casting rod, delaying the completion of solidification and extending the region where the copper remains fully liquid or partially molten. This delays significant hydrogen rejection to a larger residual liquid volume, thereby reducing the supersaturation level and suppressing the nucleation and growth of H2 pores during the critical solidification stage [19,20]. However, at casting speeds of 26 t/h and 28 t/h, the center temperature at the outlet approaches the melting point of copper (1083 °C), indicating that the copper in the rod center may still retain a liquid state and is not fully solidified.
3.3. Liquid Fraction Within Casting Rod
Figure 6 shows the distribution of the liquid fraction within casting rod at different speeds. Taking 22 t/h as an example, the molten copper is 100% liquid at the inlet. Moving clockwise, the color at the edges fades at the 3 o’clock position, and the central red liquid region narrows. By the 6 o’clock position, the entire section turns white (indicating 0 liquid fraction), signifying complete solidification. However, as casting speed increases, the depth of color extends further clockwise. At 26 t/h and 28 t/h, the center of the casting rod at the 6 o’clock position remains light blue rather than white, indicating 10–20% residual liquid. This is consistent with the temperature distribution results. This demonstrates that high speeds significantly extend the liquid region, retreat the solidification front, and sustain higher liquid fractions over larger areas, prolonging mushy zone residence time. These behaviors facilitate flotation and escape of entrained gases [21,22].
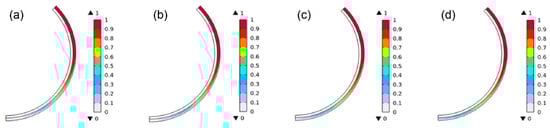
Figure 6.
Liquid fraction within casting rod at different casting speeds: (a) 22 t/h; (b) 24 t/h; (c) 26 t/h; and (d) 28 t/h.
As also shown from the solidification front position distance from the outlet in Figure 7, at 26 t/h and 28 t/h, the distance between the solidification front and the outlet is zero, implying that there is incomplete solidification and residual liquid phase in the casting rod center at the 6 o’clock position. It can easily trigger copper remelting and the formation of remelt hole defects, failing to meet the design requirement for full solidification of the continuous casting. In contrast, the solidification front is approximately 231 mm from the outlet at the casting speed of 22 t/h, indicating a significant forward shift in the solidification position. Under such conditions, excessive rapid solidification in the rod center region shortens the time available for gas escape, which may promote the expansion of pore size and an increase in pore numbers.
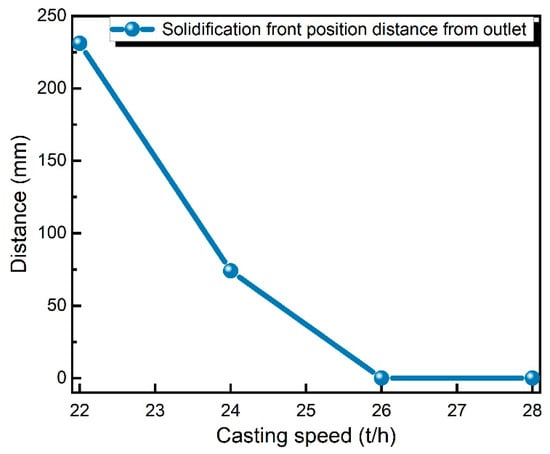
Figure 7.
Solidification front position distance from outlet changes with casting speed.
3.4. Plant Trials
To validate the simulations and factually reflect the relationship between casting speed and porosity defects, plant trials were conducted at 21 t/h, 22 t/h, 23 t/h, and 24 t/h. The morphology of porosity on the cross-sections of the trial casting rods was observed, and pore size and numbers were statistically analyzed, as shown in Figure 8 and Figure 9. The results indicate that porosity defects are clustered on the short side of the trapezoidal rod (the wheel–steel strip contact surface), with a few micropores scattered in other areas. This distribution characteristic is attributed to two coupled mechanisms: on the one hand, hydrogen bubbles float upward within the molten pool due to the significant density difference. Since the short side corresponds to the top of the casting cavity, bubbles tend to accumulate in the sub-surface region of the steel strip side. On the other hand, the heat extraction rate from the copper wheel (bottom) is generally higher than that from the steel strip (top). This asymmetry causes the solidification front to propagate primarily from the bottom upwards, effectively pushing the solute-rich liquid and potential shrinkage defects towards the upper region.
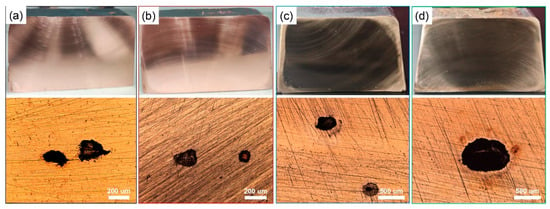
Figure 8.
Morphology of the cross-sections of casting rod at different casting speeds: (a) 21 t/h; (b) 22 t/h; (c) 23 t/h; and (d) 24 t/h.
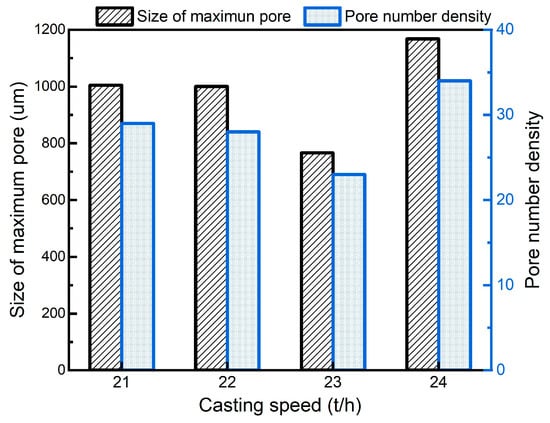
Figure 9.
Statistical results of porosity within casting rod at different casting speeds.
With the increase in casting speed, the maximum pore diameter initially decreases but then increases from 766 μm to 1167 μm when the casting speed reaches 24 t/h. Pore counts per unit area also decline to a minimum of 23 at 23 t/h and then rise to 34 at 24 t/h. This non-monotonic trend stems from a balance between the precipitation of dissolved gas in the molten copper and the flotation/escape of entrapped gas during casting. A low casting speed accelerates the solidification process, shortening the diffusion time required for dissolved gases to reach nucleation sites, leading to an increased pore nucleation rate. A high casting speed can effectively reduce the precipitation of the dissolved gas, but will also hinder the flotation/escape of entrapped gas, and it increases the possibility of remelt hole formation because some high-temperature molten copper remains at the center of the casting rod. The abrupt increase in porosity observed at 24 t/h suggests that the system crosses a critical hydrodynamic threshold. Below this speed (≤23 t/h), the buoyancy forces acting on hydrogen bubbles are sufficient to overcome the downward drag of the melt flow, facilitating gas escape. However, as the speed increases to 24 t/h, the inlet jet velocity and turbulent intensity rise effectively (Figure 3). This indicates that the downward flow velocity at the mold inlet may exceed the terminal rise velocity of small gas bubbles (governed by Stokes’ law). Consequently, the mechanism shifts from gas escape to mechanical entrapment, where bubbles are swept deep into the liquid sump. This explains the non-linear rebound in defect density within such a narrow speed interval. Thus, 23 t/h is the optimal casting speed under current conditions. This speed balances the suppression of gas precipitation with the requirement for gas escape time, achieving the maximum reduction in both the size and quantity of porosity defects.
The strong correlation between the numerical simulations and the plant trials reveals that the formation of porosity defects is fundamentally controlled by the competition between the solidification front position and the local temperature field. Specifically, at a high casting speed of 26 t/h, the simulation predicts a phenomenon in which the solidification end-point extends beyond the casting wheel outlet, retaining a liquid fraction of approximately 10–20% at the exit. This lack of complete solidification directly explains the experimental observation of large central shrinkage cavities and remelt holes in Figure 8 as the liquid core solidifies outside the effective cooling constraints of the casting wheel, leading to uncompensated shrinkage. Conversely, at the lower speed of 22 t/h, the simulation reveals significantly lower molten pool temperatures. This thermal condition reduces the hydrogen solubility limit and increases the thermodynamic driving force for premature gas bubble nucleation, which corresponds to the higher density of gas porosity observed in the experimental microstructure. Consequently, the optimal casting speed of 23 t/h represents a critical thermal balance. It maintains a sufficiently high temperature to suppress early hydrogen precipitation while ensuring that the solidification front remains entirely within the casting wheel, a prediction that is fully corroborated by the minimum porosity and optimal microstructure presented in Figure 9.
4. Conclusions
(1) Increasing casting speed elevates the flow velocity and impact depth of molten copper, leading to increasing melt flow turbulence and hindering the flotation and escape of entrapped gases.
(2) Higher casting speeds raise the rod temperatures and extend the liquid phase region within casting rod, which effectively reduces the precipitation of dissolved gases from the melt. However, when the casting speed exceeds 26 t/h, the rod center at the outlet remains 10–20% liquid phase, which is prone to causing remelt holes and fails to meet the design requirement for complete solidification.
(3) Plant trial results demonstrate that increasing the casting speed within the range of 21 t/h to 23 t/h effectively reduces the number and size of porosity defects in casting rods. However, both of them will increase significantly when the casting speed is further increased to 24 t/h.
Author Contributions
Conceptualization, L.Z. and H.Y.; methodology, T.W.; software, Z.W.; validation, Q.Y., T.W. and Y.Z.; formal analysis, T.W.; investigation, Q.Y.; resources, Q.Y. and D.T.; data curation, T.W. and Y.H.; writing—original draft preparation, Q.Y.; writing—review and editing, L.Z.; visualization, F.Z. and S.L.; supervision, H.Y.; project administration, Q.Y.; funding acquisition, L.Z. and Q.Y. All authors have read and agreed to the published version of the manuscript.
Funding
This research was funded by the Double First-Class University Initiative Fund of Nanchang University; as well as supported by the National Science Foundation of China, grant number 52404355; and the Research and Development Projects of Jiangxi Copper Corporation Limited, grant number SYYJ2023003. The APC was funded by National Science Foundation of China.
Data Availability Statement
The original contributions presented in this study are included in the article material. Further inquiries can be directed to the corresponding authors.
Conflicts of Interest
Authors Tao Wan, Yong Zhang and Zhiyong Wu were employed by the company Jiangxi Copper Technology Research Institute Co., Ltd. Author Delin Tang was employed by the company Yantai Wanlong Vacuum Metallurgy Co., Ltd. The remaining authors declare that the research was conducted in the absence of any commercial or financial relationships that could be construed as a potential conflict of interest.
References
- Chia, E.H.; Adams, R.D. The metallurgy of southwire’s continuous rod. JOM 1981, 33, 68–74. [Google Scholar] [CrossRef]
- Schwarze, M. CONTIROD equipment for copper wire rod production: The highest quality for minimal expenses. Tsvetnye Met. 2005, 4, 95–100. [Google Scholar]
- Kayali, E.S.; El-Sayed, M.; Funke, P. Deformation behaviour during drawing of copper rods produced using various processes. Mater. Sci. Technol. 1990, 6, 872–882. [Google Scholar] [CrossRef]
- Liu, Y.; Peng, Y.; Qu, X. Mechanism of and key technologies for copper bonding in the hot rolling of SCR continuous casting and rolling. Appl. Sci. 2021, 11, 11023. [Google Scholar] [CrossRef]
- Ba, L.; Yu, H.; Fu, R.; Wang, J.; Yang, R. Effect and mechanism of vacuum melting on impurity elements, pores and inclusions in pure copper. Vacuum 2025, 235, 114140. [Google Scholar] [CrossRef]
- Bhagavath, S.; Gong, Z.; Wigger, T.; Shah, S.; Ghaffari, B.; Li, M.; Marathe, S.; Karagadde, S.; Lee, P.D. Mechanisms of gas and shrinkage porosity formation in solidifying shear bands. J. Mater. Process. Technol. 2022, 299, 117338. [Google Scholar] [CrossRef]
- Drenchev, L.; Sobczak, J.; Sobczak, N.; Sha, W.; Malinov, S. A comprehensive model of ordered porosity formation. Acta Mater. 2007, 55, 6459–6471. [Google Scholar] [CrossRef]
- Xu, Y.C.; Li, G.Y.; Jiang, W.M.; Zhan, J.M.; Yu, Y.; Fan, Z.T. Investigation on characteristic and formation mechanism of porosity defects of Al-Li alloys prepared by sand casting. J. Mater. Res. Technol. 2022, 19, 4063–4075. [Google Scholar] [CrossRef]
- Finkelstein, A.; Schaefer, A.; Dubinin, N. Dehydrogenation of AlSi7Fe1 melt during in situ composite production by oxygen blowing. Metals 2021, 11, 551. [Google Scholar] [CrossRef]
- Nakajima, H.; Ide, T. Fabrication of porous copper with directional pores through thermal decomposition of compounds. Metall. Mater. Trans. A 2008, 39, 390–394. [Google Scholar] [CrossRef]
- Magnusson, H.; Karin, F. Diffusion, permeation and solubility of hydrogen in copper. J. Phase Equilibria Diffus. 2017, 38, 65–69. [Google Scholar] [CrossRef]
- Gao, K.; Peng, Y.; Abdelwahed, M.; Liu, C. Numerical simulation of solidification process in an SCR wheel and belt continuous caster. J. Mater. Eng. Perform. 2024, 34, 5950–5960. [Google Scholar] [CrossRef]
- Li, Q.H.; Qin, B.M.; Zhang, J.S.; Dong, H.B.; Li, M.; Tao, B.; Mao, X.P.; Liu, Q. Design Improvement of four-strand continuous-casting tundish using physical and numerical simulation. Materials 2023, 16, 849. [Google Scholar]
- Xu, M.G.; Zhu, M.Y. Numerical simulation of the fluid flow, heat transfer, and solidification during the twin-roll continuous casting of steel and aluminum. Metall. Mater. Trans. B 2016, 47, 740–748. [Google Scholar]
- Lee, T.W.; Hnizdil, M.; Chabicovsky, M.; Raudensky, M. Approximate solution to the spray heat transfer problem at high surface temperatures and liquid mass fluxes. Heat Transf. Eng. 2019, 40, 1649–1655. [Google Scholar]
- Zhang, Y.X.; Wang, J.J.; Yang, W.; Zhang, L.F. Effect of cooling rate on the evolution of nonmetallic inclusions in a pipeline steel. Acta Metall. Sin. 2023, 59, 1603–1612. [Google Scholar]
- Mehrotra, S.P.; Tandon, R. A mathematical-model of a single-roll continuous strip caster based on fluid-mechanics considerations. Steel Res. 1992, 63, 205–211. [Google Scholar]
- Ferreira, A.F.; Chrisóstimo, W.B.; Sales, R.C.; Garçao, W.J.L.; Sousa, N.D. Effect of pouring temperature on microstructure and microsegregation of as-cast aluminum alloy. Int. J. Adv. Manuf. Technol. 2019, 104, 957–965. [Google Scholar] [CrossRef]
- Talbot, D.E. Effects of hydrogen in Aluminium, Magnesium, Copper, and their alloys. Int. Metall. Rev. 1975, 20, 166–184. [Google Scholar]
- Campbell, J. Complete Casting Handbook: Metal Casting Processes, Metallurgy, Techniques and Design; Butterworth-Heinemann: Waltham, MA, USA, 2015. [Google Scholar]
- Lee, W.; Hyun, Y.T.; Won, J.W.; Lee, H.; Kang, S.H.; Yoon, J. Numerical simulation using a coupled lattice Boltzmann-cellular automata method to predict the microstructure of Ti-6Al-4V after electron beam cold hearth melting. J. Mater. Res. Technol. 2025, 36, 3796–3806. [Google Scholar]
- Chen, H.; Guo, N.; Liu, C.; Zhang, X.; Xu, C.S.; Wang, G.D. Insight into hydrostatic pressure effects on diffusible hydrogen content in wet welding joints using in-situ X-Ray imaging method. Int. J. Hydrogen Energy 2020, 45, 10219–10226. [Google Scholar] [CrossRef]
Disclaimer/Publisher’s Note: The statements, opinions and data contained in all publications are solely those of the individual author(s) and contributor(s) and not of MDPI and/or the editor(s). MDPI and/or the editor(s) disclaim responsibility for any injury to people or property resulting from any ideas, methods, instructions or products referred to in the content. |
© 2025 by the authors. Licensee MDPI, Basel, Switzerland. This article is an open access article distributed under the terms and conditions of the Creative Commons Attribution (CC BY) license.