Abstract
Accurate and precise population estimates form the basis of conservation action but are lacking for many arboreal species due to the high costs and difficulty in surveying these species. Recently, researchers have started to use drones to obtain data on animal distribution and density. In this study, we compared ground and drone counts for spider monkeys (Ateles geoffroyi) at their sleeping sites using a custom-built drone fitted with a thermal infrared (TIR) camera. We demonstrated that a drone with a TIR camera can be successfully employed to determine the presence and count the number of spider monkeys in a forested area. Using a concordance analysis, we found high agreement between ground and drone counts for small monkey subgroups (<10 individuals), indicating that the methods do not differ when surveying small subgroups. However, we found low agreement between methods for larger subgroups (>10 individuals), with drone counts being higher than the corresponding ground counts in 83% of surveys. We could identify additional individuals from TIR drone footage due to a greater area covered compared to ground surveys. We recommend using TIR drones for surveys of spider monkey sleeping sites and discuss current challenges to implementation.
1. Introduction
Forest loss due to land conversion for agriculture and pasture is one the principal threats facing biodiversity in the Neotropics [1,2,3]. As a result, animal populations across the region are threatened with extinction. Forest loss is accompanied by forest fragmentation and degradation, processes that may strongly affect arboreal species due to changes in canopy connectivity and loss of aerial pathways. To protect the remaining habitat, the species residing in them, and the ecosystem services they provide, conservation practitioners need accurate and precise information on the distribution and abundance of species [4]. Arboreal mammals can be difficult to survey, as many species are nocturnal, live in the canopy or flee before they have been detected by observers on the ground [4,5,6]. Due to these challenges, along with the cost of accessing large swaths of forest, there is a lack of population information for a wide range of arboreal species.
Spider monkeys (Ateles spp.) are large-bodied arboreal primates and widely distributed in the Neotropics [7]. Due to anthropogenic pressures (mainly hunting and deforestation), all species are categorised as Endangered or Critically Endangered on the International Union for the Conservation of Nature (IUCN) red list [8]. Conservation management therefore requires frequent, accurate, and precise information on presence as well as population density throughout the species’ range. As with many other arboreal mammal species, data on presence and/or population density have been collected during general biodiversity surveys or surveys focused on particular species [9,10,11], traditionally by counting individuals along line transects on foot [12,13]. Although methods exist to determine presence and abundance, there are large gaps in our knowledge of spider monkey distribution and density [14]. This is partially due to spider monkeys being notoriously difficult to survey due to their high degree of fission–fusion dynamics (i.e., group members split into subgroups whose size, membership, and spatial cohesion vary greatly over time [15]), fast arboreal movements, and large home ranges, and they may thus remain unsurveyed at sites where they occur [16]. Additionally, the wide distribution of the species and the costs of conducting ground surveys are further hindering factors [14]. The need for frequent surveys due to the rapid land-use changes that are occurring across their range only exacerbates this problem. There is thus an urgent need to test alternative methods to obtain data on presence and density at a pace that is comparable to the pace of land-use change.
Relatively recently, researchers have started to use drones to obtain data on animals and their habitats (reviewed in Reference [17]). In most studies, standard visual spectrum (RGB) cameras have been mounted on drones to obtain data on species presence due to the relatively large areas that drones can cover rapidly; in fewer studies, they were used to determine population density [17]. Although using the visual spectrum has been successful, there are several limitations [18]. First, the relatively limited bandwidth of the visual spectrum (0.39–0.7 µm) means that the reflectance of all objects is relatively close to each other, which can hamper differentiation. Second, using the visual spectrum does not allow for the detection of animals when there is low light, or it is dark. Thus, for species that are nocturnal or species where detection of animals at dawn and dusk is important, there is a need to explore detection opportunities with other sensors. Thermal infrared (TIR) cameras, which use a different part of the electromagnetic spectrum (8–13.5 µm), have recently been used to detect a variety of animals (e.g., deer, seals, koalas, kinkajous, monkeys, and rhinoceros [19,20,21,22,23]).
There have been only a few drone studies to detect primates, which mostly focused on nests built by apes (Pan troglodytes [24,25]; Pongo abelii [26]). Kays et al., 2019 [23] found that a TIR camera mounted to a drone can be used to survey arboreal mammals, including monkeys (Ateles geoffroyi and Alouatta palliata). They concluded that ground surveys are more effective in counting monkeys than drone surveys, as dense canopy vegetation may mask individuals that are found in lower layers of the vegetation strata. However, these results are based on only two surveys where drone and ground counts were compared, and although the same overall area was surveyed, the drone and human observers did not follow the exact same paths. Further studies using a larger number of surveys are therefore necessary to corroborate these results and determine whether using drones with TIR cameras is an alternative or complementary method to ground surveys for spider monkeys.
In this study, we assessed the effectiveness of using drones with a TIR camera for surveying Geoffroy’s spider monkeys (A. geoffroyi). First, we examined whether we can detect the presence of spider monkeys in their sleeping trees using a TIR camera mounted to a drone. Second, we compared simultaneous ground and aerial counts of spider monkeys at their sleeping sites to determine the agreement between the two methods. Third, we compared the number of spider monkeys counted during ground and drone surveys depending on flight type (grid and hover flights) and time of day (morning and evening). Primate ground surveys become less reliable when encountering larger groups, as individuals are more likely to be missed [27,28,29]. Drone surveys using a TIR camera might therefore produce more reliable counts than ground surveys when monkeys are found in large numbers due to a greater area covered and the ease of detecting individuals in the top of the canopy that might be missed from the ground.
2. Materials and Methods
2.1. Study Area and Subjects
This study was carried out in Los Arboles Tulum (20°17′50″ N, 87°30′59″ W), a residential development located about 14 km from the municipality of Tulum, Quintana Roo, Mexico, in which houses are only allowed to occupy 5% of each 2-hectare plot (Figure 1). At the moment, 98% of the 400-hectare area remains forested. The vegetation is classified as medium-evergreen forest, trees are not taller than 30 m above the ground, and the terrain is relatively flat.
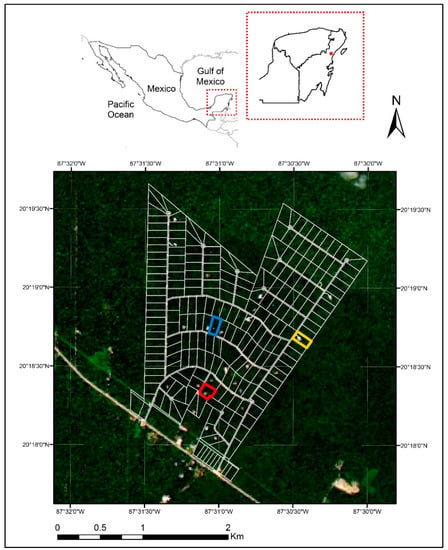
Figure 1.
Map of Los Arboles Tulum (its location in the Yucatan Peninsula, Mexico is indicated by a red dot in the red box in the upper map). Boundaries of individual lots and the boundaries of Los Arboles Tulum are marked in light grey. Lots containing the sleeping sites are marked in blue (A), orange (B), and red (C). Lots containing houses are those with white circles or squares.
The group of spider monkeys living in Los Arboles Tulum has been studied since November 2016 and is habituated to the presence of humans. Spider monkeys experience a high degree of fission–fusion dynamics, in which group members split into subgroups that change in size and membership throughout the day [15]. All group members very rarely regroup at night, resulting in various subgroups at various sleeping sites every night, enabling us to survey multiple subgroups at single sleeping sites or survey multiple sleeping sites within one morning or evening. Spider monkeys at Los Arboles Tulum usually sleep in specific trees at 8 known sleeping sites. We focused the drone flights at the three most used sleeping sites (A, B, and C; Figure 1), which differed in visibility of the tree canopy from the ground (Appendix A and Figure A1) and the number of monkey subgroups. The ground under the sleeping trees at sites A and C were clear of undergrowth, providing a clear view of the tree canopy. By contrast, the view of the canopy from the ground at one of the sleeping trees at site B was restricted by undergrowth and understory trees. Aerial predators are lacking in the area [30].
2.2. Mission Planning
We mounted a TeAx Fusion Zoom dual vision camera containing a FLIR Tau2 640 core TIR camera with 19 mm lens and a 1080p TAMRON RGB camera affixed side-by-side. The camera was mounted to a custom-built drone via a gimbal, which kept the camera steady during drone flights. The 640 × 512 pixel TIR camera has a field of view of 32 × 26 degrees (see Appendix B and Figure A2 for further details on the drone).
We carried out a preliminary ground survey with the TIR camera hand-held and unmounted from the drone at sleeping sites A and B to gather thermal footage of the spider monkeys. The TIR ground footage indicated how the monkeys would appear in the TIR drone footage [31] and provided an estimation of their surface temperature (30 °C; Figure 2). We generated a land surface temperature climatology [32] for Los Arboles Tulum for mid-June (Figure 3) and found that to distinguish a spider monkey with a skin temperature of 30 °C from its surroundings (Figure 3), we would need to perform drone flights around sunset and before sunrise, as soon as there was enough light to see the drone in flight.
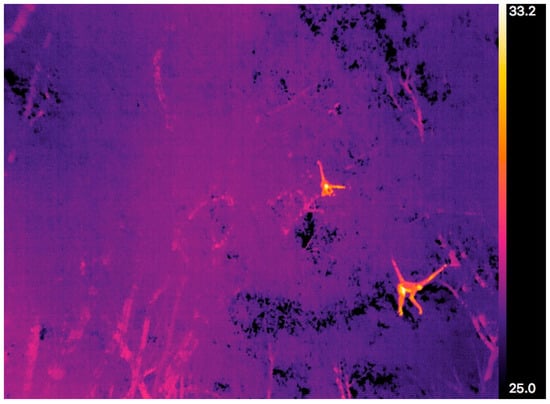
Figure 2.
Example of preliminary ground survey data taken with the thermal camera unmounted from the drone. Two spider monkeys are visible in this figure. Temperature scale for false colour thermal image is shown on the right-hand side. Using these data, we expected the surface temperature of spider monkeys to be around 30 °C.
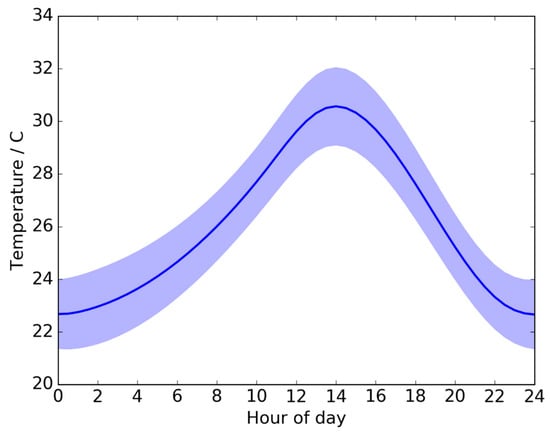
Figure 3.
The 24-h temperature range of the land surface for Los Arboles Tulum during June. Figure generated from satellite observations of the land surface over several years, following the method described in Burke et al., 2018 [32]. The line indicates the climatological mean temperature, and the shading indicates the 2-sigma (or 2 standard deviation) range for land surface temperatures.
To survey for monkeys from the air, we conducted preprogrammed grid flights over sleeping sites where monkeys were present. Grid flights were set up in the Mission Planner software (http://ardupilot.org/planner/) by first drawing an outline polygon on a satellite image, then utilising the Automatic Waypoint–Survey (Grid) feature. Grid flight duration ranged between 4 and 8 min depending on the area of the site surveyed, the flying height, and the percentage of overlap and sidelap selected for the footage. Sidelap was fixed for all grid flights at 60%. Increasing sidelap decreases overall flight time but may increase count accuracy of the smaller survey area. For all sites and days, we flew the drone between 60 and 70 m above ground level (AGL; see Appendix C for details), equivalent to approximately 35–50 m above canopy height at the study sites. See Appendix D for details on how flying height was calculated. The take-off location was between 50 m to 150 m away from spider monkey subgroups. Additionally, we flew 4 hover flights in which the drone flew to a single sleeping tree and hovered over it for a minimum of 5 min. We started these flights at 70 m AGL and after several minutes lowered the drone to 60 m AGL. We performed grid and hover flights to determine whether both methods could be used to detect and count spider monkeys.
2.3. Data Collection
We performed a total of 33 drone flights (29 grid flights and 4 hover flights) with the TIR camera at the three selected sleeping sites between the 10th and the 23rd of June 2018. We excluded five grid flights (15% of the total number of flights) that did not have corresponding ground data because the monkeys had moved away from the ground observers before they were able to count them. Of the 28 flights included in the analyses, we performed 8 flights at sleep site A (7 grid flights and 1 hover flight), 15 flights at sleep site B (12 grid flights and 3 hover flights), and 5 grid flights at sleep site C.
To compare counts of spider monkeys between ground surveys and drone surveys, we first determined whether spider monkeys were present at the A, B, and C sleeping sites between 17:30 and 19:00. If the monkeys were present at a sleeping site, we flew the drone over the sleeping site and performed ground counts at the same time. We then conducted both drone and ground surveys at the same sleeping site the following morning before sunrise to compare evening and morning counts from drone and ground surveys. Weather conditions (rain or strong wind) prevented us from revisiting the same sleeping site in the morning on several occasions.
Ground counts (i.e., the number of monkeys counted by ground observers) were carried out by a total of five experienced observers. Ground counts started 5 min before the drone flew over the sleeping site and continued until the drone survey had ended. For each survey, at least two observers positioned themselves on the ground below or in sight of known sleeping trees and counted all detected monkeys within sight. A monkey was considered to be part of the same subgroup if it was within 30 m of a subgroup member according to a chain rule [33] (see Reference [34] for the concept of the chain rule). The position of all monkeys was recorded on a hand-drawn map of the sleeping site to avoid double counting of individuals. Ground observers were equipped with binoculars to aid in counting each monkey and a GPS unit to mark the position of monkey subgroups. The maximum distance estimated between an observer and a detected monkey was 45 m.
2.4. Data Analysis
2.4.1. Presence of Spider Monkeys in TIR Drone Data
A subsample of the TIR footage from the drone flights was cut and edited into 20 videos of 30 s in length each. The videos were prepared by a single individual who was present at the time of the drone flights and was aware of the presence or absence of spider monkeys in each video based on where and when the footage was taken. There were 10 videos with monkeys and 10 without monkeys.
The 20 videos were independently coded for monkey presence or absence by three coders, who had experience in viewing videos produced by TIR cameras and knew how animals generally would appear in TIR footage, but information on which videos included monkeys was withheld from all coders. After the coding, we recorded the number of videos for which each coder correctly determined the presence or absence of spider monkeys.
2.4.2. Counting Spider Monkeys
To count the monkeys in the TIR footage, the data were examined by eye post-flight by a single individual who is very familiar with TIR imaging for observing homoeothermic animals. For each flight, only individuals that fell within the visual field of the ground observers were included in the direct comparisons between ground and drone surveys. Individuals counted in TIR footage outside of the visual field of the ground observers were separately counted as additional individuals (see Table A1).
To determine if time of day affects the ease of counting spider monkeys, we compared the number of individuals counted during ground and drone surveys performed in the evening and the following morning. When we performed multiple drone flights, we compared the number of individuals in a subgroup from the last evening flight to the first morning flight. If multiple subgroups were recorded during an evening flight, we only compared the number of individuals in the subgroups that were found in the same location the following morning. On the only occasion the last evening flight did not follow the same grid as the other same-day flights, we compared the number of monkeys counted during the first evening flight with those during the single morning flight.
To test the agreement between counts from drone and ground surveys, we performed a concordance analysis [35]. Typically, the results from a new method are compared to the results from an existing method to determine if the new method can replace the existing one [36]. We considered ground counts as the existing method because primates are traditionally counted via line transect or point surveys [37]. We matched counts from ground and drone surveys collected during the same drone flight, creating pairs of counts of individual monkeys in each subgroup that were within the same visual field of both the ground observers and the TIR drone camera.
We analysed counts of spider monkeys in subgroups of all sizes, and then separately in subgroups containing fewer than ten individuals as counted by both methods (i.e., small subgroups), and subgroups containing ten or more individuals as counted by at least one method (i.e., large subgroups). For each analysis, we created a Bland–Altman graph to verify that differences between drone and ground counts were minor and did not show systematic bias in relation to subgroup size. We then calculated Lin’s concordance coefficient between the methods, as it can be used to evaluate agreement for data with small sample sizes [38]. Agreement is measured from minus one to one where one is perfect agreement [39]. We calculated Lin’s concordance coefficient using the package agRee [40] in the R software platform version 3.5.0 [41].
3. Results
3.1. Presence of Spider Monkeys
In all grid and hover flights where the drone was flown over the monkeys that were observed by the ground team, we were able to identify monkeys from the TIR video footage. In addition, the three coders were successfully able to determine the presence of spider monkeys in TIR video footage by identifying them in the thermal images. Two coders correctly determined the presence and absence of monkeys in all 20 videos. The third coder misclassified only one video where monkeys were present but correctly determined the absence of monkeys in all 10 videos where monkeys were absent.
3.2. Counting Spider Monkeys
Spider monkeys counted within the same field of view were compared for 28 ground and drone surveys (24 grid flights and 4 hover flights; Figure 4). The mean number of spider monkeys counted during ground and drone surveys per monkey subgroup (n = 35 subgroups) and flight type are presented in Figure 5 and Table A1. The mean number of spider monkeys counted from the ground and the TIR drone footage during hover flights was higher than the mean for grid flights (Figure 5). However, only 5 subgroups were counted during hover flights compared to 30 subgroups during grid flights. Ground counts were higher than counts from TIR footage for 29% of spider monkey subgroups (Table A1). Examples of TIR images and TIR footage used to count monkeys are presented in Figure 6 and Supplementary Material 1, respectively. As the drone has a larger visual field than ground observers and is therefore able to cover a much larger area during surveys, TIR footage could capture monkeys that were outside of the visual field of the ground observers. In fact, we were able to count additional monkeys from TIR footage obtained during 15 of the 23 (65%) flights performed at sleep sites A and B (15 of the 19 grid flights and 0 of the 4 hover flights). No additional monkeys were counted from TIR footage obtained during flights at sleep site C (Table A1). The number of monkeys counted on the ground and from TIR footage in the evening and the following morning at the same sleeping site are presented in Figure 7 and Appendix E. Whereas the number of monkeys counted on the ground was lower in the morning compared to the previous evening, the number of monkeys counted in TIR footage was higher in the morning compared to the previous evening.
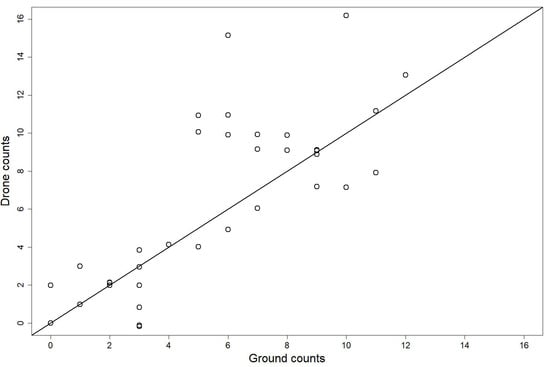
Figure 4.
The number of monkeys counted from the drone thermal infrared (TIR) footage and ground observations. Diagonal line represents no difference in counts between drone TIR footage and ground surveys.
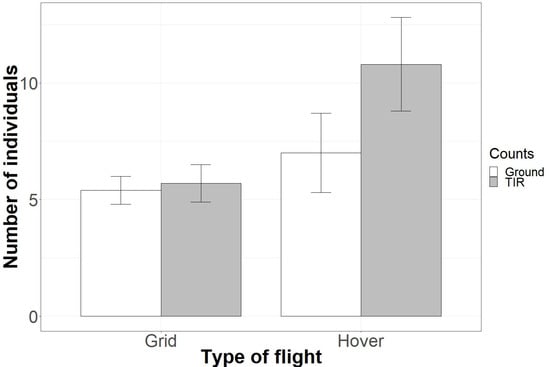
Figure 5.
Mean number of spider monkeys ± standard error counted for the same visual field from the ground and from TIR drone surveys for grid and hover flights.
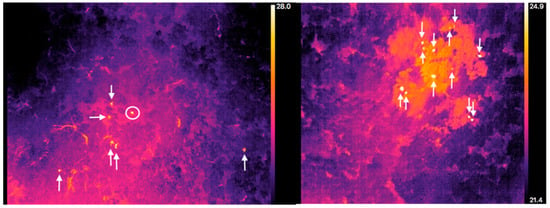
Figure 6.
Examples of TIR images obtained from the Fusion camera whilst mounted on the drone recorded during a flight at 19:30 on 20th June 2018 at sleeping site A (left) and 05:45 on 20th June 2018 at sleeping site B (right). Drone height for both flights was 70 m above ground level, approximately 40–45 m above the canopy. Temperature scale corresponding to false colour thermal image is indicated on the right-hand side. Locations of spider monkeys are indicated with arrows. The circle indicates a human observer counting monkeys on the ground. Some sources of possible confusion when examining thermal infrared data are also visible in these images, particularly in the evening survey (left). Several branches have been heated by the sun during the day and appear as bright thermal sources.
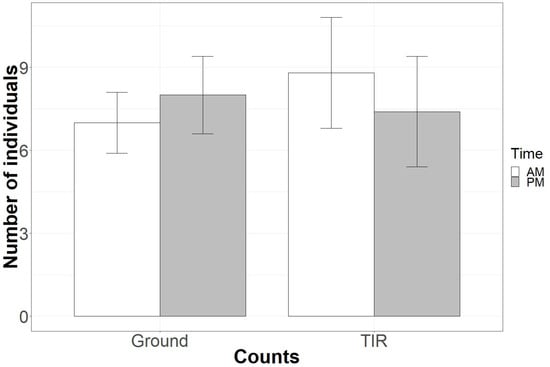
Figure 7.
Mean number of spider monkeys ± standard error counted on the ground and on drone TIR footage for the same visual field at sleeping sites visited in the evening (PM) and the following morning (AM).
For 51% of all subgroups (n = 35), the difference in individual counts between ground and drone surveys was zero (11 cases) or one (7 cases). Lin’s coefficient for all subgroups was rc = 0.73 with a 95% confidence interval between 0.51–0.86. For 70% of all small subgroups (n = 23), counts from drone and ground surveys did not differ (10 cases) or differed by only 1 individual (6 cases; Figure 8a). Lin’s coefficient for the small subgroups was rc = 0.90; with a 95% confidence interval between 0.79–0.95, indicating agreement between the methods. For 83% of all large subgroups (n = 12), the drone counts were higher than the ground counts (Figure 8b). Lin’s coefficient was rc = 0.08; with a 95% confidence interval between −0.38 and 0.40, indicating that there was no agreement between the methods.
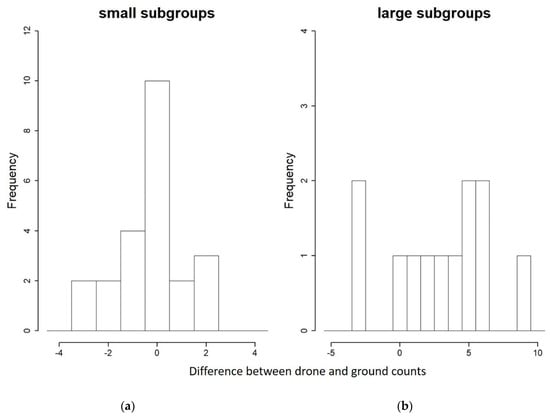
Figure 8.
Frequency histogram of the differences in the number of monkeys counted between the drone TIR footage and ground surveys for (a) small and (b) large subgroups.
3.3. Observations on the Reactions of Spider Monkeys to the Drone
The most common reaction to the drone was for the monkeys to change position or move down a few meters. Once the drone survey finished (usually after 6–10 min from the start), many individual monkeys returned to their original positions. More than once, a monkey let out a scream in response to the drone flying overhead. Still, several individual monkeys showed no change in their behaviour in response to the drone. For instance, juveniles that played before the drone started continued playing for the entire duration of the flight. When we performed multiple flights at a sleeping site in rapid succession, the monkeys seemed to become more vigilant and moved around more during subsequent flights.
The behavioural reaction of the spider monkeys to the hover flights, during which the drone remained above the monkeys for at least 5 min, was more pronounced than to the grid flights during which the drone only briefly flew directly above the monkeys. During two hover flights, more than one monkey screamed and moved down or away from the original subgroup.
4. Discussion
Accurate and precise counts of animal populations form the basis of conservation decisions and actions; however, they are lacking for the majority of arboreal species due to difficulties and costs of performing ground surveys. To overcome these difficulties, recent studies have fitted drones with TIR cameras to monitor primate populations (howler monkeys and spider monkeys [23]; orangutans [42]). Here, we demonstrated that a TIR camera fitted to a drone can be successfully employed to determine the presence and count the number of spider monkeys in a closed-canopy forest. Spider monkeys were easy to detect in the TIR footage due to their relatively high temperature compared to their surroundings. Since they spend a large amount of time at the top of the forest canopy [43] and tend to sleep on terminal branches, an aerial viewpoint offers distinct advantages over ground-based observations. Spider monkey movement in the canopy aided the differentiation between monkeys and other objects with a similar heat image, especially in the afternoon when the heat stored from the sun during the day still illuminated the branches in the TIR footage. In addition to spider monkeys, the Yucatan Peninsula is home to black howler monkeys (Alouatta pigra), but they are very rare in Los Arboles Tulum. Other animals of similar size to spider monkeys (e.g., coatis, small cats) occupy lower vegetation layers and will therefore be more difficult to detect in TIR drone footage [23]. None of these species were observed near the monkeys during our ground observations. It is therefore unlikely that we misidentified spider monkeys during our ground and drone surveys. During the dry season, many tree species in the Yucatan Peninsula lose their leaves, which may aid visibility and facilitate detection of arboreal mammals. Our study was performed at the start of the rainy season, when tree foliage is extensive, suggesting that drones fitted with TIR cameras can be used to survey spider monkeys in sites where foliage cover is high year-round.
The drone surveys produced counts similar to those produced using traditional ground surveys for subgroups containing <10 monkeys, and the two counts were shown to be statistically consistent with each other. For larger subgroups (>10 monkeys), the number of individuals counted was higher for drone than ground surveys in 92% of the cases. Drone surveys may offer an advantage over ground surveys when observing large subgroups, as they provide greater visibility because vegetation does not obscure some of the monkeys, and the footage can be replayed multiple times to aid visual identification. In addition, in TIR footage, the monkeys appear as bright objects (during cooler times of the day), whereas they are the same brightness as their surroundings when viewed with the naked eye. In our study, visibility made counting monkeys from the ground difficult in some cases. For example, 75% of large subgroups where ground observers missed individuals occurred at sleeping site B, where monkeys tend to sleep in an emergent tree whose canopy is largely obscured from view from the ground by other vegetation.
Conversely to our findings, Kays et al., 2019 [23] found that ground counts were higher than drone counts. However, they compared counts from only two flights, whereas we compared counts from 28 flights. Kays et al., 2019 [23] also used a lower resolution TIR camera than ours, and TIR camera resolution has been shown to strongly affect the detectability of animals from a drone [32]. As our study was performed at sleeping sites, most monkeys were relatively stationary and therefore potentially easier to detect on TIR footage as mobile individuals may go in and out of view while moving through the canopy. Ground surveys are often carried out when primates are most active (i.e., in the early morning and late afternoon), as their movement through the canopy can aid detection [44,45]. Ground surveys may therefore be more accurate than TIR drone surveys during hours of the day when primates are active, but their surroundings have started to heat up, minimising thermal contrast. Kays et al., 2019 [23] performed surveys when spider monkeys were more active and thus more difficult to detect on TIR footage, potentially explaining differences in results between the studies.
Kays et al., 2019 [23] reported heating of the canopy to be a major issue in using TIR to detect and identify animals in their study. Time of day is an important consideration when flying drones with TIR cameras. To maximise thermal contrast, drone flights should be performed at the time of day that the difference in temperature between the animal of interest and its surroundings is greatest [23,32]. Therefore, flying a drone with a TIR camera over a forested area during most of the day would make detecting large-bodied arboreal primates such as spider monkeys extremely difficult as tree leaves and branches have become heated by the sun [23]. Likewise, distinguishing different species of similar size becomes nearly impossible at this time of day. To minimise this effect, we performed our surveys at times of the day when the heat from the surroundings would differ the most in relation to the heat of the monkeys (Figure 3; [32]). The results of our study and that of Kays et al., 2019 [23] highlight the importance of understanding the environment and planning observations accordingly when using thermal drones to survey wildlife. As many countries have regulatory frameworks in place that restrict flying drones at night or before sunrise [46], surveyors will also have to adjust their study design to align with local regulations.
The purpose of the four hover flights was to examine whether TIR images from these flights led to a pattern regarding the comparison with ground counts similar to that of grid flights. Therefore, the fact that more monkeys were counted from TIR footage obtained from hover flights than from grid flights was simply due to the bias in the relative locations where the two types of flights were performed. We performed hover flights above sleeping trees where we knew that many monkeys slept together, thereby biasing towards higher monkey counts. In fact, 80% of the subgroups counted from the ground during the four hover flights were large, whereas only 26% of the subgroups counted from the ground during 24 grid flights were large.
The number of additional monkeys detected in TIR drone footage outside of the visual field of ground observers ranged from zero to 12 (Table A1), a mean increase of 49% in the number of monkeys detected compared to ground counts, suggesting that ground counts may underestimate the number of individuals in an area. In this study, we were unable to confirm whether either ground or drone counts provide the true number of monkeys in an area. However, given that drone surveys can cover a larger area and allow counts to be performed at a more leisurely pace post-flight while replaying the footage to identify monkeys in different areas, we suggest that drone surveys provide counts that are closer to the true number of animals inhabiting the area.
Appropriate survey design and analysis may allow researchers to scale up and extrapolate the results from surveys performed in small areas to an overall area of interest. However, population counts may be biased if factors affecting population size such as vegetation or climate are heterogenous across the overall area and are not controlled for. If the use of drones and TIR cameras can be validated to provide accurate and precise population counts, large areas can be surveyed and bypass the need for extrapolation. Whereas a more thorough understanding on the completeness of drone-based counts is necessary, our findings provide a base for validating the accuracy and precision of this technology for surveys of spider monkeys and indicate that this technology can offer important information to conservation practitioners.
As discussed above, one source of potential confusion when using TIR cameras is heat given off by objects in the general environment [47]. Tree branches, hard earth, concrete surfaces, and bodies of water can retain heat for many hours after they stop receiving solar heating. Even when performing flights during the cooler times of day, we found that heat from the surroundings did occasionally lead to missing individual monkeys that were counted by ground observers. We found more spider monkeys were counted at the same sleeping site in the morning than the previous evening from TIR footage, likely because they appeared brighter and easier to identify in early-morning TIR footage given that the surroundings cooled off during the night.
The behaviour of the monkeys may explain why more individuals were detected from the ground than from TIR footage for 29% (10 out of 35) of monkey subgroups. For instance, spider monkey females tend to huddle together with juveniles in sleeping trees and could have been mistakenly counted as a single individual from TIR footage. From the ground, observers have more time and can change position to assess whether there are huddling individuals, whereas in most of our flights, the drone flies over the monkeys in a preprogrammed grid without hovering over the sleeping trees to allow better identification. Interestingly, for all hover flights, drone counts were higher than ground counts.
The behavioural reaction of the spider monkeys to the drone flying overhead was of short duration for grid flights but more pronounced for hover flights. This is in line with a recent review of animal responses to drone flights [48]. The behaviours shown by the monkeys during our drone flights were similar to the behaviours of unhabituated spider monkeys encountered during line-transect surveys performed on the ground: Monkeys move away, alarm call or display by throwing branches at the human observers (Denise Spaan, personal observation). The similarity in behaviours leads us to suggest that performing drone surveys is not more invasive or stressful than performing line-transect surveys on the ground. Drone surveys on unhabituated populations of spider monkeys are needed to corroborate our assertion, as we surveyed monkeys habituated to humans.
Although the lightweight multirotor drone we used to perform this study is not ideal to cover large areas due to its short flight-time, our results support the use of drones fitted with TIR cameras as a successful method to detect and count spider monkeys at their sleeping sites. Fitting a TIR camera to a fixed-wing drone or a vertical take-off and landing (VTOL) drone would remove the need for large open take-off and landing space, thus enabling surveyors to cover larger areas within relatively little time. Flying at night when the temperature difference between the monkeys and their surroundings is greatest would enable researchers to detect and count spider monkeys in their sleeping sites in areas where they are not known to occur. As fixed-wing drones can be flown at high altitudes, the combination with a high resolution TIR camera would ensure minimal noise disturbance to the spider monkeys. As such, the use of drones with TIR cameras can potentially offer a huge advance in population monitoring of spider monkeys in forested environments. Automating the detection of species in TIR footage or images obtained from drone flights would further aid its usefulness by reducing the time taken to analyse footage post-flight. Full implementation of the use of drones for population monitoring is technologically feasible, but at present, the regulatory framework in most countries does not allow for beyond visual line of sight (BVLOS) flights [46] nor flying at night and thus poses a challenge for surveys of large remote areas. A risk-based approach to the distance from the pilot at which drones would be allowed to fly could facilitate such BVLOS flights and allow for more opportunities for surveys in low-risk areas [49].
5. Conclusions
The use of drone technology is rapidly changing the way mammal populations are monitored [17], and the addition of a TIR camera has been successful for monitoring small species in open environments (e.g., rabbits [32]) and ungulates in temperate forests [50], but only a few studies have tested its use for surveying arboreal species living in forested environments (e.g., koalas [21]; howler monkeys, spider monkeys, and kinkajous [23]; orangutans [42]). By comparing a substantial dataset obtained by flying the drone while simultaneously counting monkeys from the ground, we were able to demonstrate that the use of a TIR camera is a feasible and valid method of obtaining data on the presence and number of spider monkeys at their sleeping sites in a closed-canopy forest. Although we intentionally flew over areas known to contain monkeys, this technology could be applied to determine the distribution and population size of spider monkeys in areas where other species of similar size that spend large amounts of time in the forest canopy can be accurately distinguished from spider monkeys in the TIR images. For species such as spider monkeys, whose habitat is disappearing and/or changing rapidly [51], an equally rapid survey method is required to understand how such changes are affecting populations. As drones can cover large areas in relatively short time, they can provide a wealth of data at a pace that is comparable to the rate at which habitats are lost or threatened. Additionally, data from TIR footage obtained by drones can be used to improve species distribution models and calculate population density. The use of TIR imaging can therefore help in the urgent quest to fill the gaps in our knowledge on the distribution and abundance of spider monkeys across their range.
Supplementary Materials
The following are available online at https://www.mdpi.com/2504-446X/3/2/34/s1, Video S1: Spider monkeys moving in the canopy in drone TIR footage.
Author Contributions
Conceptualisation, D.S., C.B., F.A., C.E.R.-R., and S.A.W.; Methodology, D.S., C.B., O.M., F.A., C.E.R.-R., A.H., and S.A.W.; Investigation, D.S., C.B., O.M., C.E.R.-R., A.H., S.N.L., P.R.M., and S.A.W.; Blind Coding: P.R.M., S.N.L., and S.A.W.; Formal Analysis, D.S., C.B., and A.H.; Writing—Original Draft Preparation, D.S., C.B., O.M., F.A., and S.A.W.; Writing—Review and Editing, D.S., C.B., O.M., F.A., C.E.R.-R., A.H., S.N.L., P.R.M., and S.A.W.; Funding Acquisition, D.S., C.B., F.A., S.N.L., and S.A.W.
Funding
This research was funded by the National Geographic Society (WW-198EC-17), the UK Science and Technology Facilities Council Global Challenges Research Fund (ST/R002673/1), and Los Arboles Tulum.
Acknowledgments
We would like to thank Cecilia Cahum Cahum for assistance with data collection. We would also like to thank Los Arboles Tulum for logistical support. Permission to perform surveys was granted by Los Arboles Tulum and research adhered to the regulations set by the Dirección General de Aeronáutica Civil (Circular obligatoria que establece los requerimientos para operar un sistema de Aeronave Pilotada a Distancia RPAS, 2015) and Proyecto de Norma Oficial Mexicana PROY-NOM-107-SCT3-2016 (DOF: 20/09/2017).
Conflicts of Interest
The authors declare no conflict of interest.
Appendix A
Details on Sleep Sites
At sleeping site A, the spider monkeys sleep in one single subgroup in emergent trees <25 m in height that can be easily observed from the ground (Figure A1). At sleeping site B, the spider monkeys sleep in distinct subgroups spread out over several trees <30 m in height. At sleeping site C, the spider monkeys sleep in a single subgroup in trees <20 m in height surrounding a house and can be observed relatively easily from the ground.
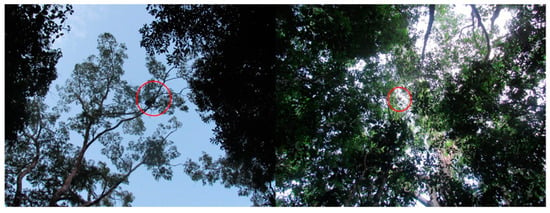
Figure A1.
View of spider monkeys in sleeping trees at the sleep sites A (left) and B (right).
Appendix B
Information on the Drone
The drone consisted of a 550 mm quadcopter frame constructed from extruded aluminium arms and glass fiber plates to provide optimal strength to weight performance (Figure A2). The drone was powered by a 14.8V Lithium Polymer (LiPo) battery which provided a flight time of approximately 10 min when the drone was fitted with the TIR camera. A Pixhawk 2.1 autopilot was used to run the open-source ArduCopter firmware, providing a high degree of flexibility in configuring and operating the system. The autopilot was configured to allow either manually piloted or automatic (preprogramed) flight. Automatic flights were configured by the open source Mission Planner software (v1.3.52.0; http://ardupilot.org/planner/) installed on a laptop and connected to the drone via a wireless telemetry system.
A 2-axis stabilisation gimbal based on brushless direct current (BLDC) motors was developed to isolate the camera from the motion of the drone and improve image quality. This gimbal utilised the BaseCam SimpleBGC 32-bit tiny control board, which provides seamless integration with the autopilot system. The pitch angle of the gimbal is adjustable between 0 and 90 degrees (straight forward to straight down) either by pilot input or preprogramed command. The camera was facing straight down at an angle of 90 degrees during all flights of the present study.
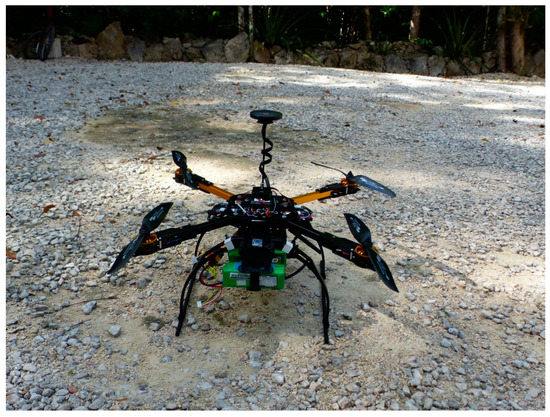
Figure A2.
The custom-built drone.
Appendix C

Table A1.
The number of spider monkeys counted from ground and drone surveys for the same visual field for sleeping sites A, B, and C and additional individuals counted from TIR footage outside of the visual field of ground observers.
Table A1.
The number of spider monkeys counted from ground and drone surveys for the same visual field for sleeping sites A, B, and C and additional individuals counted from TIR footage outside of the visual field of ground observers.
| Sleeping Site | Date Flight | Start Flight | Time of Day | Type of Flight | Height of Drone AGL | Monkey Subgroup Type * | Individuals Counted on the Ground | Individuals Counted from TIR Footage | Additional Individuals Counted from TIR Footage |
|---|---|---|---|---|---|---|---|---|---|
| A | 10/6/2018 | 19:00 | PM | Grid | 70 | S | 9 | 9 | 7 |
| 11/6/2018 | 5:45 | AM | Grid | 70 | S | 9 | 9 | 12 | |
| 11/6/2018 | 6:00 | AM | Grid | 50 | S | 7 | 6 | 8 | |
| 18/6/2018 | 19:30 | PM | Grid | 70 | S | 9 | 9 | 0 | |
| 20/6/2018 | 19:15 | PM | Grid | 80 | L | 11 | 8 | 4 | |
| 20/6/2018 | 19:30 | PM | Hover | 70-60 | L | 12 | 13 | 0 | |
| 22/6/2018 | 19:30 | PM | Grid | 70 | L | 11 | 11 | 0 | |
| 23/6/2018 | 5:45 | AM | Grid | 70 | S | 9 | 7 | 5 | |
| B | 11/6/2018 | 18:45 | PM | Grid | 70 | S1 | 1 | 3 | 9 |
| S2 | 3 | 0 | |||||||
| 11/6/2018 | 19:15 | PM | Grid | 70 | S1 | 4 | 4 | 1 | |
| L2 | 6 | 10 | |||||||
| 12/6/2018 | 5:45 | AM | Grid | 70 | S | 3 | 3 | 10 | |
| 18/6/2018 | 5:45 | AM | Grid | 70 | S | 3 | 2 | 2 | |
| 18/6/2018 | 6:00 | AM | Grid | 70 | S | 0 | 2 | 0 | |
| 18/6/2018 | 18:45 | PM | Grid | 70 | S | 8 | 9 | 7 | |
| 18/6/2018 | 19:00 | PM | Grid | 70 | L | 10 | 7 | 6 | |
| 19/6/2018 | 5:45 | AM | Grid | 70 | S1 | 1 | 1 | 6 | |
| L2 | 8 | 10 | |||||||
| 19/6/2018 | 18:45 | PM | Hover | 70-60 | L | 10 | 16 | 0 | |
| 19/6/2018 | 19:00 | PM | Grid | 70 | L | 6 | 11 | 2 | |
| 19/6/2018 | 19:30 | PM | Grid | 70 | L | 7 | 10 | 6 | |
| 20/6/2018 | 5:45 | AM | Grid | 70 | L1 | 6 | 15 | 3 | |
| S2 | 3 | 1 | |||||||
| S3 | 3 | 0 | |||||||
| 20/6/2018 | 18:45 | PM | Hover | 70-60 | L | 5 | 10 | 0 | |
| 22/6/2018 | 18:45 | PM | Grid | 70 | S1 | 7 | 9 | 0 | |
| S2 | 2 | 2 | |||||||
| 22/6/2018 | 19:00 | PM | Hover | 70-60 | L1 | 5 | 11 | 0 | |
| S2 | 3 | 4 | |||||||
| C | 14/6/2018 | 5:45 | AM | Grid | 70 | S | 2 | 2 | 0 |
| 14/6/2018 | 6:00 | AM | Grid | 60 | S | 2 | 2 | 0 | |
| 21/6/2018 | 5:45 | AM | Grid | 70 | S | 6 | 5 | 0 | |
| 22/6/2018 | 5:45 | AM | Grid | 70 | S | 5 | 4 | 0 | |
| 22/6/2018 | 6:00 | AM | Grid | 70 | S | 0 | 0 | 0 |
* S = small subgroup; L = large subgroup; superscript numbers refer to multiple subgroups on the same survey.
Appendix D
Calculating Flying Height
In order to accurately detect and identify spider monkeys in TIR footage, the monkeys must appear above 10 pixels in the footage [32]. At lower apparent sizes, the temperature recorded within individual pixels is contaminated by the thermal emission from the surrounding environment, making it difficult to distinguish the monkeys from their surroundings. As the size of the monkeys in the footage increases, more features become visible, facilitating species identification. In order to resolve a spider monkey of about 0.5 m in length (from the top of the head to the base of the pelvis, without considering the tail) at 10 pixels when viewed from above, the drone would need to be a maximum of 57.3 m from the animal (see Reference [32] for full details on this calculation; http://www.astro.ljmu.ac.uk/~aricburk/uav_calc/). Since monkeys spend almost all of their time in tree canopies [42], we therefore had to fly the drone 57.3 m above the canopy.
Appendix E

Table A2.
Number of spider monkeys counted on the ground and on drone TIR footage for the same visual field at sleeping sites visited in the evening (PM) and the following morning (AM), and their difference.
Table A2.
Number of spider monkeys counted on the ground and on drone TIR footage for the same visual field at sleeping sites visited in the evening (PM) and the following morning (AM), and their difference.
| Sleeping Site | Individuals Counted on the Ground | Individuals Counted on Drone TIR Footage | ||||
|---|---|---|---|---|---|---|
| PM | AM | Difference | PM | AM | Difference | |
| A | 9 | 9 | 0 | 9 | 9 | 0 |
| A | 11 | 9 | 2 | 11 | 7 | 4 |
| B | 3 | 3 | 0 | 0 | 3 | −3 |
| B | 10 | 8 | 2 | 7 | 10 | −3 |
| B | 7 | 6 | 1 | 10 | 15 | −5 |
References
- Gibbs, H.K.; Ruesch, A.S.; Achard, F.; Clayton, M.K.; Holmgren, P.; Ramankutty, N.; Foley, J.A. Tropical forests were the primary sources of new agricultural land in the 1980s and 1990s. Proc. Natl. Acad. Sci. 2010, 107, 16732–16737. [Google Scholar] [CrossRef] [PubMed]
- Hansen, M.C.; Potapov, P.V.; Moore, R.; Hancher, M.; Turubanova, S.A.; Tyukavina, A.; Thau, D.; Stehman, S.V.; Goetz, S.J.; Loveland, T.R.; et al. High-resolution global maps of 21st-century forest cover change. Science 2013, 342, 850–853. [Google Scholar] [CrossRef] [PubMed]
- Graesser, J.; Aide, T.M.; Grau, H.R.; Ramankutty, N. Cropland/pastureland dynamics and the slowdown of deforestation in Latin America. Environ. Res. Lett. 2015, 10, 034017. [Google Scholar] [CrossRef]
- Campbell, G.; Head, J.; Junker, J.; Nekaris, K.A.I. Primate abundance and distribution: Background concepts and methods. In An Introduction to Primate Conservation; Wich, S.A., Marshall, A.J., Eds.; Oxford University Press: Oxford, UK, 2016; pp. 79–104. [Google Scholar]
- Munari, D.P.; Keller, C.; Venticinque, E.M. An evaluation of field techniques for monitoring terrestrial mammal populations in Amazonia. Mamm. Biol. 2011, 76, 401–408. [Google Scholar] [CrossRef]
- Neilson, E.; Nijman, V.; Nekaris, K.A.I. Conservation assessments of arboreal mammals in difficult terrain: Occupancy modeling of Pileated Gibbons (Hylobates pileatus). Int. J. Primatol. 2013, 34, 823–835. [Google Scholar] [CrossRef]
- Di Fiore, A.; Link, A.; Campbell, C.J. The atelines: Behavioural and socioecological diversity in a New World monkey radiation. In Primates in Perspective; Campbell, C.J., Fuentes, A., MacKinnon, K.C., Bearder, S.K., Stumpf, R.M., Eds.; Oxford University Press: New York, NY, USA, 2011; pp. 155–188. [Google Scholar]
- Cuarón, A.D.; Morales, A.; Shedden, A.; Rodriguez-Luna, E.; de Grammont, P.C.; Cortés-Ortiz, L. Ateles geoffroyi. In The IUCN Rest List of Threatened Species; IUCN: Cambridge, UK, 2008. [Google Scholar]
- Michalski, F.; Peres, C.A. Anthropogenic determinants of primate and carnivore local extinctions in a fragmented forest landscape of southern Amazonia. Biol. Conserv. 2005, 124, 383–396. [Google Scholar] [CrossRef]
- Weghorst, J.A. High population density of black-handed spider monkeys (Ateles geoffroyi) in Costa Rican lowland wet forest. Primates 2007, 48, 108–116. [Google Scholar] [CrossRef]
- Aquino, R.; Cornejo, F.M.; Pezo, E.; Heymann, E.W. Distribution and abundance of white-fronted spider monkeys, Ateles belzebuth (Atelidae), and threats to their survival in Peruvian Amazonia. Folia Primatol. 2012, 84, 1–10. [Google Scholar] [CrossRef]
- Marshall, A.R.; Lovett, J.O.N.C.; White, P.C.L. Selection of line-transect methods for estimating the density of group-living animals: Lessons from the primates. Am. J. Primatol. 2008, 462, 452–462. [Google Scholar] [CrossRef] [PubMed]
- Buckland, S.T.; Plumptre, A.J.; Thomas, L.; Rexstad, E.A. Design and analysis of line transect surveys for primates. Int. J. Primatol. 2010, 31, 833–847. [Google Scholar] [CrossRef]
- Ramos-Fernández, G.; Wallace, R.B. Spider monkey conservation in the twenty-first century: Recognizing risks and opportunities. In Spider Monkeys Behaviour, Ecology and Evolution of The Genus Ateles; Campbell, C.J., Ed.; Cambridge University Press: Cambridge, UK, 2008; pp. 351–376. [Google Scholar]
- Aureli, F.; Schaffner, C.M.; Boesch, C.; Simon, K.; Call, J.; Chapman, C.A.; Connor, R.; Di, A.; Dunbar, R.I.M.; Henzi, S.P.; et al. Fission-fusion dynamics new research frameworks. Curr. Anthropol. 2008, 49, 627–654. [Google Scholar] [CrossRef]
- Fedigan, L.M.; Jack, K. Neotropical primates in a regenerating Costa Rican dry forest: A comparison of howler and capuchin population Patterns. Int. J. Primatol. 2001, 22, 689–713. [Google Scholar] [CrossRef]
- Wich, S.A.; Koh, L.P. Conservation Drones. Mapping and Monitoring Biodiversity; Oxford University Press: Oxford, UK, 2018. [Google Scholar]
- Longmore, S.N.; Collins, R.P.; Pfeifer, S.; Fox, S.E.; Mulero-Pázmány, M.; Bezombes, F.; Goodwin, A.; De Juan Ovelar, M.; Knapen, J.H.; Wich, S.A. Adapting astronomical source detection software to help detect animals in thermal images obtained by unmanned aerial systems. Int. J. Remote Sens. 2017, 38, 2623–2638. [Google Scholar] [CrossRef]
- Mulero-Pázmány, M.; Stolper, R.; van Essen, L.D.; Negro, J.J.; Sassen, T. Remotely piloted aircraft systems as a rhinoceros anti-poaching tool in Africa. PLoS One 2014, 9, e83873. [Google Scholar] [CrossRef] [PubMed]
- Chrétien, L.-P.; Théau, J.; Ménard, P. Visible and thermal infrared remote sensing for the detection of white-tailed deer using an unmanned aerial system. Wildl. Soc. Bull. 2016, 40, 181–191. [Google Scholar] [CrossRef]
- Gonzalez, L.; Montes, G.; Puig, E.; Johnson, S.; Mengersen, K.; Gaston, K.; Gonzalez, L.F.; Montes, G.A.; Puig, E.; Johnson, S.; et al. Unmanned Aerial Vehicles (UAVs) and artificial intelligence revolutionizing wildlife monitoring and conservation. Sensors 2016, 16, 97. [Google Scholar] [CrossRef] [PubMed]
- Seymour, A.C.; Dale, J.; Hammill, M.; Halpin, P.N.; Johnston, D.W. Automated detection and enumeration of marine wildlife using unmanned aircraft systems (UAS) and thermal imagery. Sci. Rep. 2017, 7, 45127. [Google Scholar] [CrossRef] [PubMed]
- Kays, R.; Sheppard, J.; Mclean, K.; Welch, C.; Paunescu, C.; Wang, V.; Kravit, G.; Crofoot, M. Hot monkey, cold reality: Surveying rainforest canopy mammals using drone-mounted thermal infrared sensors. Int. J. Remote Sens. 2019, 40, 407–419. [Google Scholar] [CrossRef]
- Van Andel, A.C.; Wich, S.A.; Boesch, C.; Koh, L.P.; Robbins, M.M.; Kelly, J.; Kuehl, H.S. Locating chimpanzee nests and identifying fruiting trees with an unmanned aerial vehicle. Am. J. Primatol. 2015, 77, 1122–1134. [Google Scholar] [CrossRef]
- Bonnin, N.; Van Andel, A.; Kerby, J.; Piel, A.; Pintea, L.; Wich, S.; Bonnin, N.; Van Andel, A.C.; Kerby, J.T.; Piel, A.K.; et al. Assessment of chimpanzee nest detectability in drone-acquired images. Drones 2018, 2, 17. [Google Scholar] [CrossRef]
- Wich, S.; Dellatore, D.; Houghton, M.; Ardi, R.; Koh, L.P. A preliminary assessment of using conservation drones for Sumatran orang-utan (Pongo abelii) distribution and density. J. Unmanned Veh. Syst. 2016, 4, 45–52. [Google Scholar] [CrossRef]
- Defler, T.R.; Pintor, D. Censusing primates by transect in a forest of known primate density. Int. J. Primatol. 1985, 6, 243–259. [Google Scholar] [CrossRef]
- Pruetz, J.D.; Leasor, H.C. Survey of three primate species in forest fragments at La Suerte Biological Field Station, Costa Rica. Neotrop. Primates 2002, 10, 4–9. [Google Scholar]
- Chapman, C.A.; Schoof, V.A.M.; Bonnell, T.R.; Gogarten, J.F.; Calme, S. Competing pressures on populations: Long-term dynamics of food availability, food quality, disease, stress and animal abundance. Philos. Trans. R. Soc. B Biol. Sci. 2015, 370, 20140112. [Google Scholar] [CrossRef]
- Busia, L.; Smith-Aguilar, S.E.; Aureli, F.; Schaffner, C.M.; Ramos-Fernández, G. Predation attacks on wild spider monkeys (Ateles geoffroyi). Folia Primatol. 2018, 89, 341–346. [Google Scholar] [CrossRef]
- Cilulko, J.; Janiszewski, P.; Bogdaszewski, M.; Szczygielska, E. Infrared thermal imaging in studies of wild animals. Eur. J. Wildl. Res. 2013, 59, 17–23. [Google Scholar] [CrossRef]
- Burke, C.; Rashman, M.; Wich, S.; Symons, A.; Theron, C.; Longmore, S. Optimising observing strategies for monitoring animals using drone-mounted thermal infrared cameras. Int. J. Remote Sens. 2019, 40, 439–467. [Google Scholar] [CrossRef]
- Ramos-Fernández, G. Vocal communication in a fission-fusion society: Do spider monkeys stay in touch with close associates? Int. J. Primatol. 2005, 26, 1077–1092. [Google Scholar] [CrossRef]
- Croft, D.P.; James, R.; Krause, J. Exploring Animal Social Networks; Princeton University Press: Princeton, NJ, USA, 2008; ISBN 9781400837762. [Google Scholar]
- Watson, P.F.; Petrie, A. Method agreement analysis: A review of correct methodology. Theriogenology 2010, 73, 1167–1179. [Google Scholar] [CrossRef]
- Altman, D.G.; Bland, J.M. Measurement in medicine: The analysis of method comparison studies. Stat. 1983, 32, 307. [Google Scholar] [CrossRef]
- Chapman, C.A.; Struhsaker, T.T.; Skorupa, J.P.; Snaith, T.V.; Rothman, J.M. Understanding long-term primate community dynamics: Implications of forest change. Ecol. Appl. 2010, 20, 179–191. [Google Scholar] [CrossRef] [PubMed]
- Lin, L.I.-K. A concordance correlation coefficient to evaluate reproducibility. Biometrics 1989, 45, 255–268. [Google Scholar] [CrossRef] [PubMed]
- McBride, G.B. A Proposal for Strength-of-Agreement Criteria for Lin’s Concordance Correlation Coefficient; National Institute of Water and Atmospheric Research: Hamilton, New Zealand, 2005. [Google Scholar]
- Feng, D. agRee: Various Methods for Measuring Agreement, R Package Version 0.5-2; 2018. Available online: https://C RAN.R-project.org/package=agRee (accessed on 11 March 2019).
- R Core Team. R: A Language and Environment for Statistical Computing; R Core Team: Vienna, Austria, 2018. [Google Scholar]
- Burke, C.; Rashman, M.F.; Longmore, S.N.; McAree, O.; Glover-Kapfer, P.; Ancrenaz, M.; Wich, S.A. Successful observation of orangutans in the wild with thermal-equipped drones. J. Unmanned Veh. Syst. 2019, in press. [Google Scholar]
- Campbell, C.J.; Aureli, F.; Chapman, C.A.; Ramos-Fernández, G.; Matthews, K.; Russo, S.E.; Suarez, S.; Vick, L. Terrestrial behavior of Ateles spp. Int. J. Primatol. 2005, 26, 1039–1051. [Google Scholar] [CrossRef]
- Chapman, C.A.; Fedigan, L.M.; Fedigan, L. A comparison of transect methods of estimating population densities of Costa Rican primates. Brenesia 1988, 30, 67–80. [Google Scholar]
- Peres, C.A. General guidelines for standardizing line-transect surveys of tropical forest primates. Neotrop. Primates 1999, 7, 11–16. [Google Scholar]
- Stöcker, C.; Bennett, R.; Nex, F.; Gerke, M.; Zevenbergen, J.; Stöcker, C.; Bennett, R.; Nex, F.; Gerke, M.; Zevenbergen, J. Review of the current state of UAV regulations. Remote Sens. 2017, 9, 459. [Google Scholar] [CrossRef]
- Burke, C.; Rashman, M.F.; McAree, O.; Hambrecht, L.; Longmore, S.N.; Piel, A.K.; Wich, S.A. Addressing environmental and atmospheric challenges for capturing high-precision thermal infrared data in the field of astro-ecology. Proc. SPIE 2018. [Google Scholar] [CrossRef]
- Mulero-Pázmány, M.; Jenni-Eiermann, S.; Strebel, N.; Sattler, T.; Negro, J.J.; Tablado, Z. Unmanned aircraft systems as a new source of disturbance for wildlife: A systematic review. PLoS One 2017, 12, e0178448. [Google Scholar] [CrossRef]
- McAree, O.; Aitken, J.M.; Veres, S.M. Quantifying situation awareness for small unmanned aircraft. Aeronaut. J. 2018, 122, 733–746. [Google Scholar] [CrossRef]
- Witczuk, J.; Pagacz, S.; Zmarz, A.; Cypel, M. Exploring the feasibility of unmanned aerial vehicles and thermal imaging for ungulate surveys in forests—Preliminary results. Int. J. Remote Sens. 2018, 39, 5504–5521. [Google Scholar] [CrossRef]
- Ellis, E.A.; Romero Montero, J.A.; Hernández Gómez, I.U. Deforestation processes in the state of Quintana Roo, Mexico. Trop. Conserv. Sci. 2017, 10, 194008291769725. [Google Scholar] [CrossRef]
© 2019 by the authors. Licensee MDPI, Basel, Switzerland. This article is an open access article distributed under the terms and conditions of the Creative Commons Attribution (CC BY) license (http://creativecommons.org/licenses/by/4.0/).