Identification of Ramularia Leaf Blight Cotton Disease Infection Levels by Multispectral, Multiscale UAV Imagery

 , ,
, ,
Abstract
:1. Introduction
2. Materials and Methods
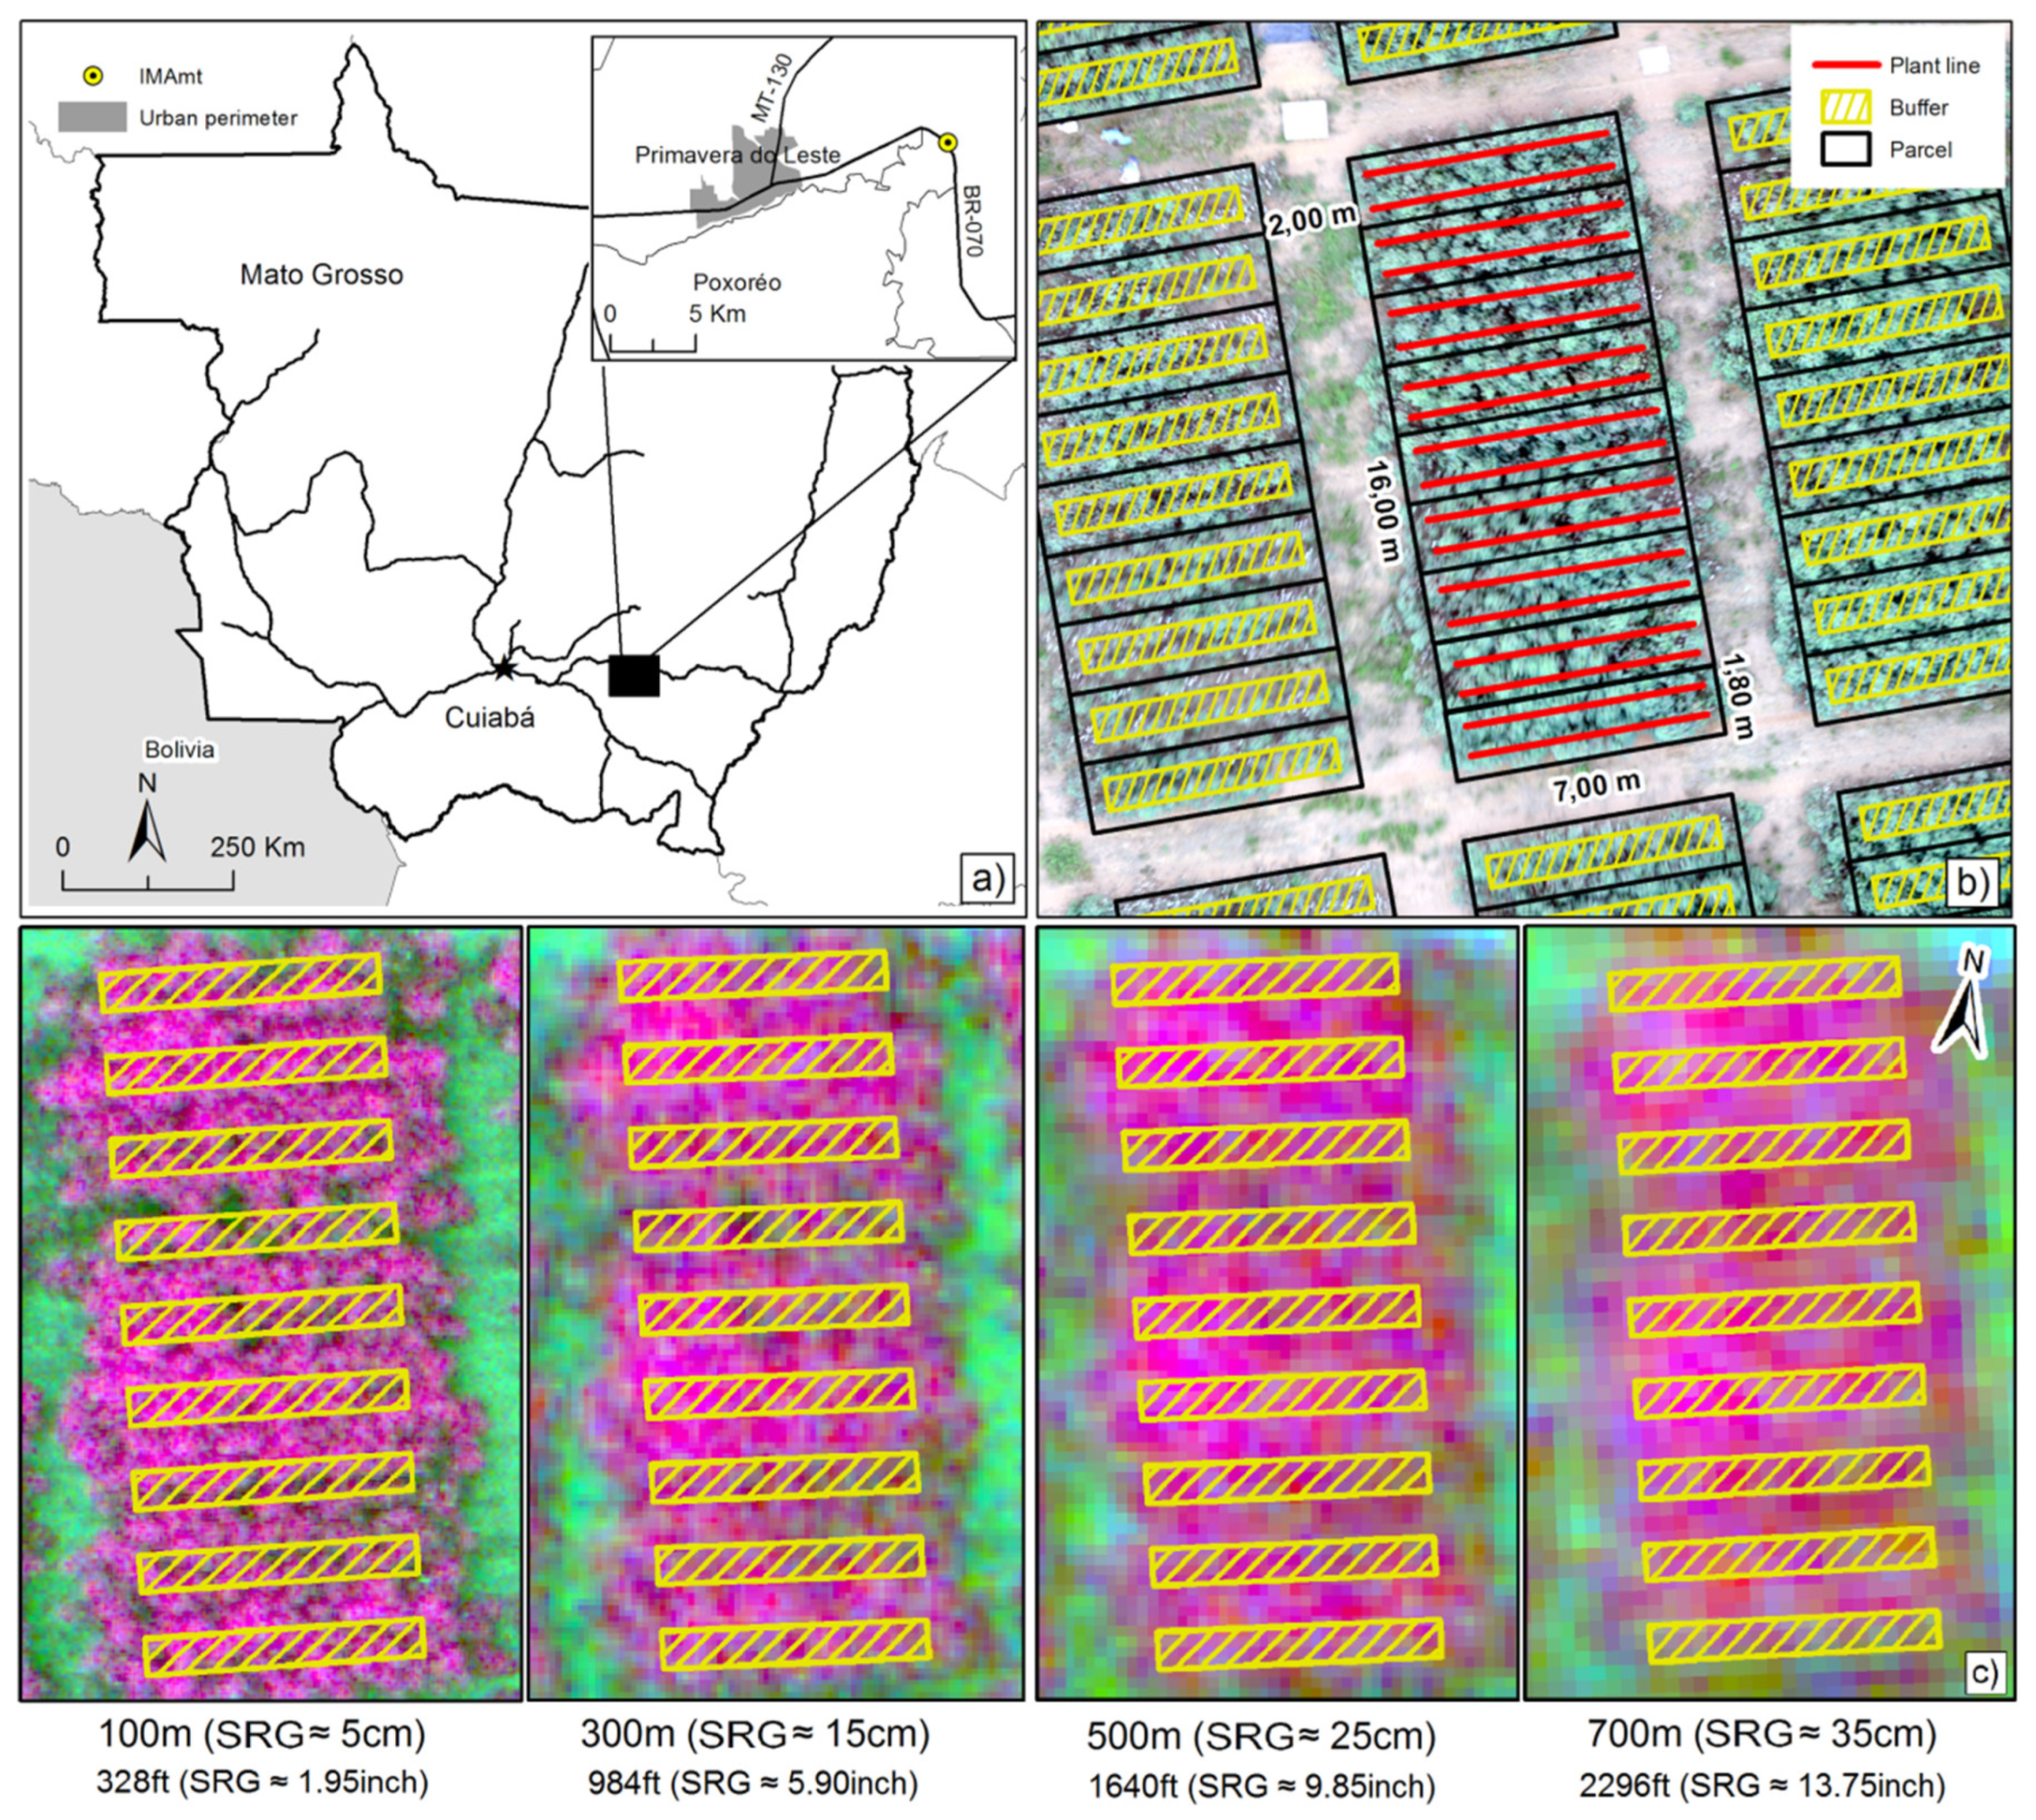
2.1. Study Area
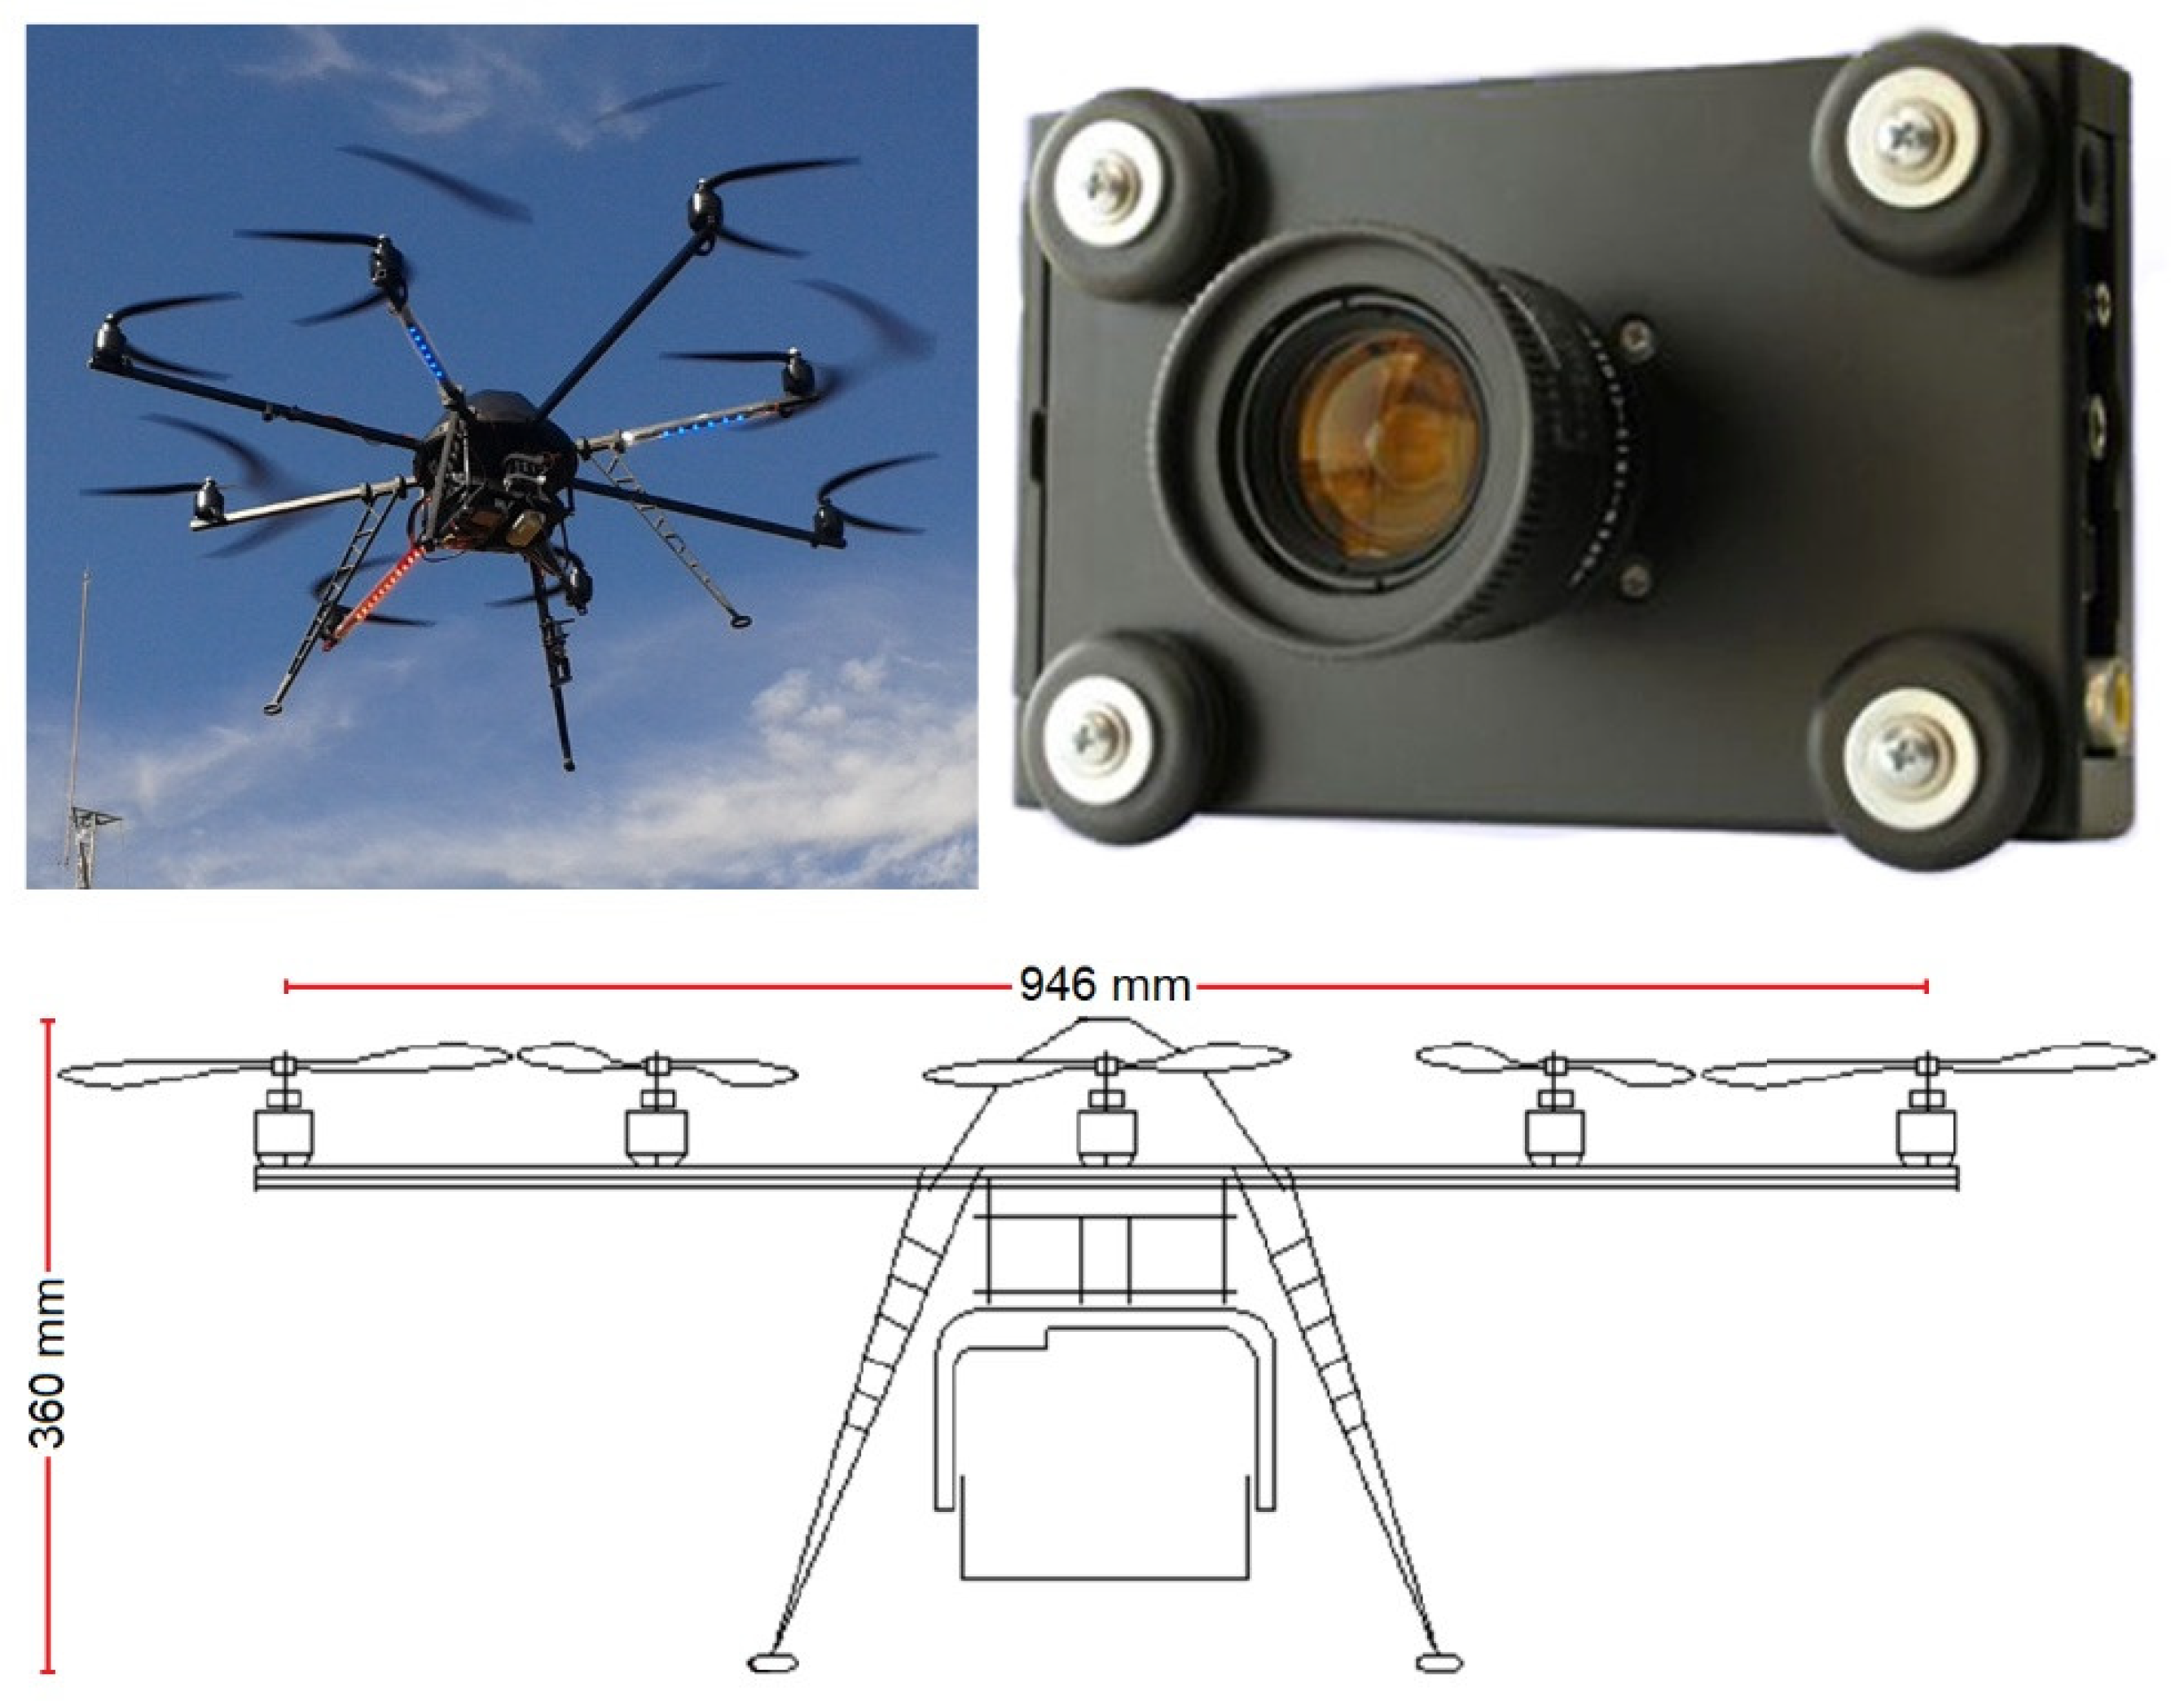
2.2. UAV System, Image Acquisition, and Data Preprocessing
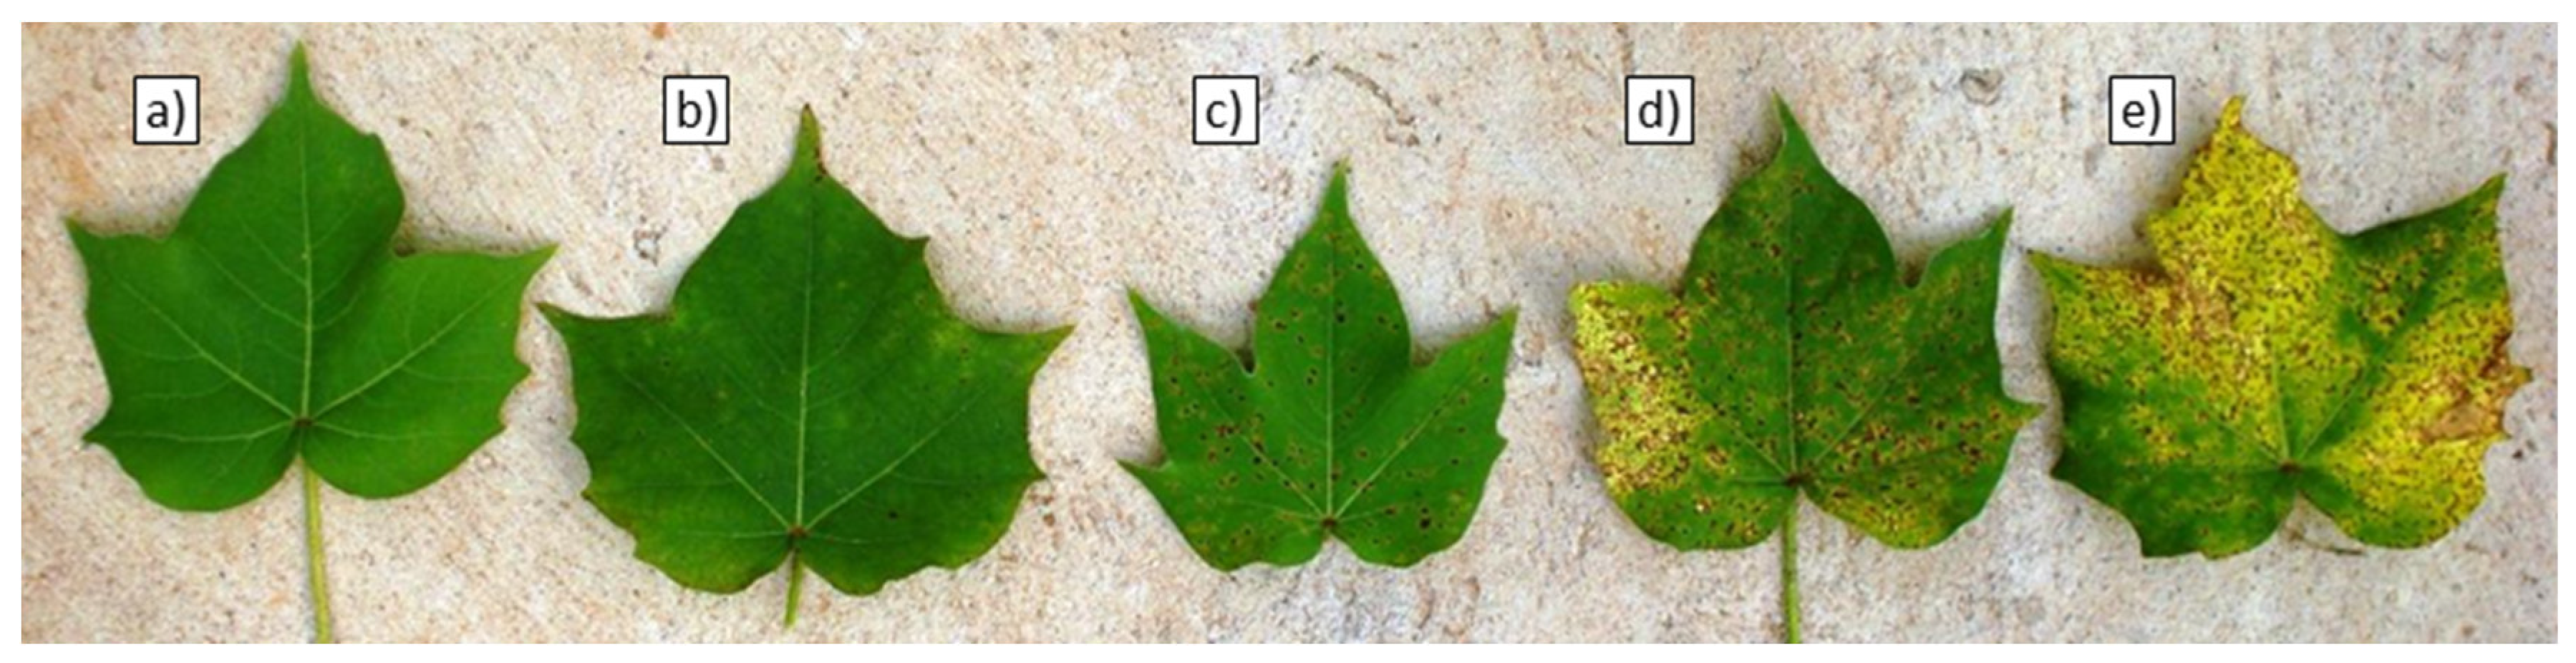
2.3. Spatial Arrangement of Field Experiment and Assessment of Ramularia Blight Infection Levels
2.4. Data Analysis
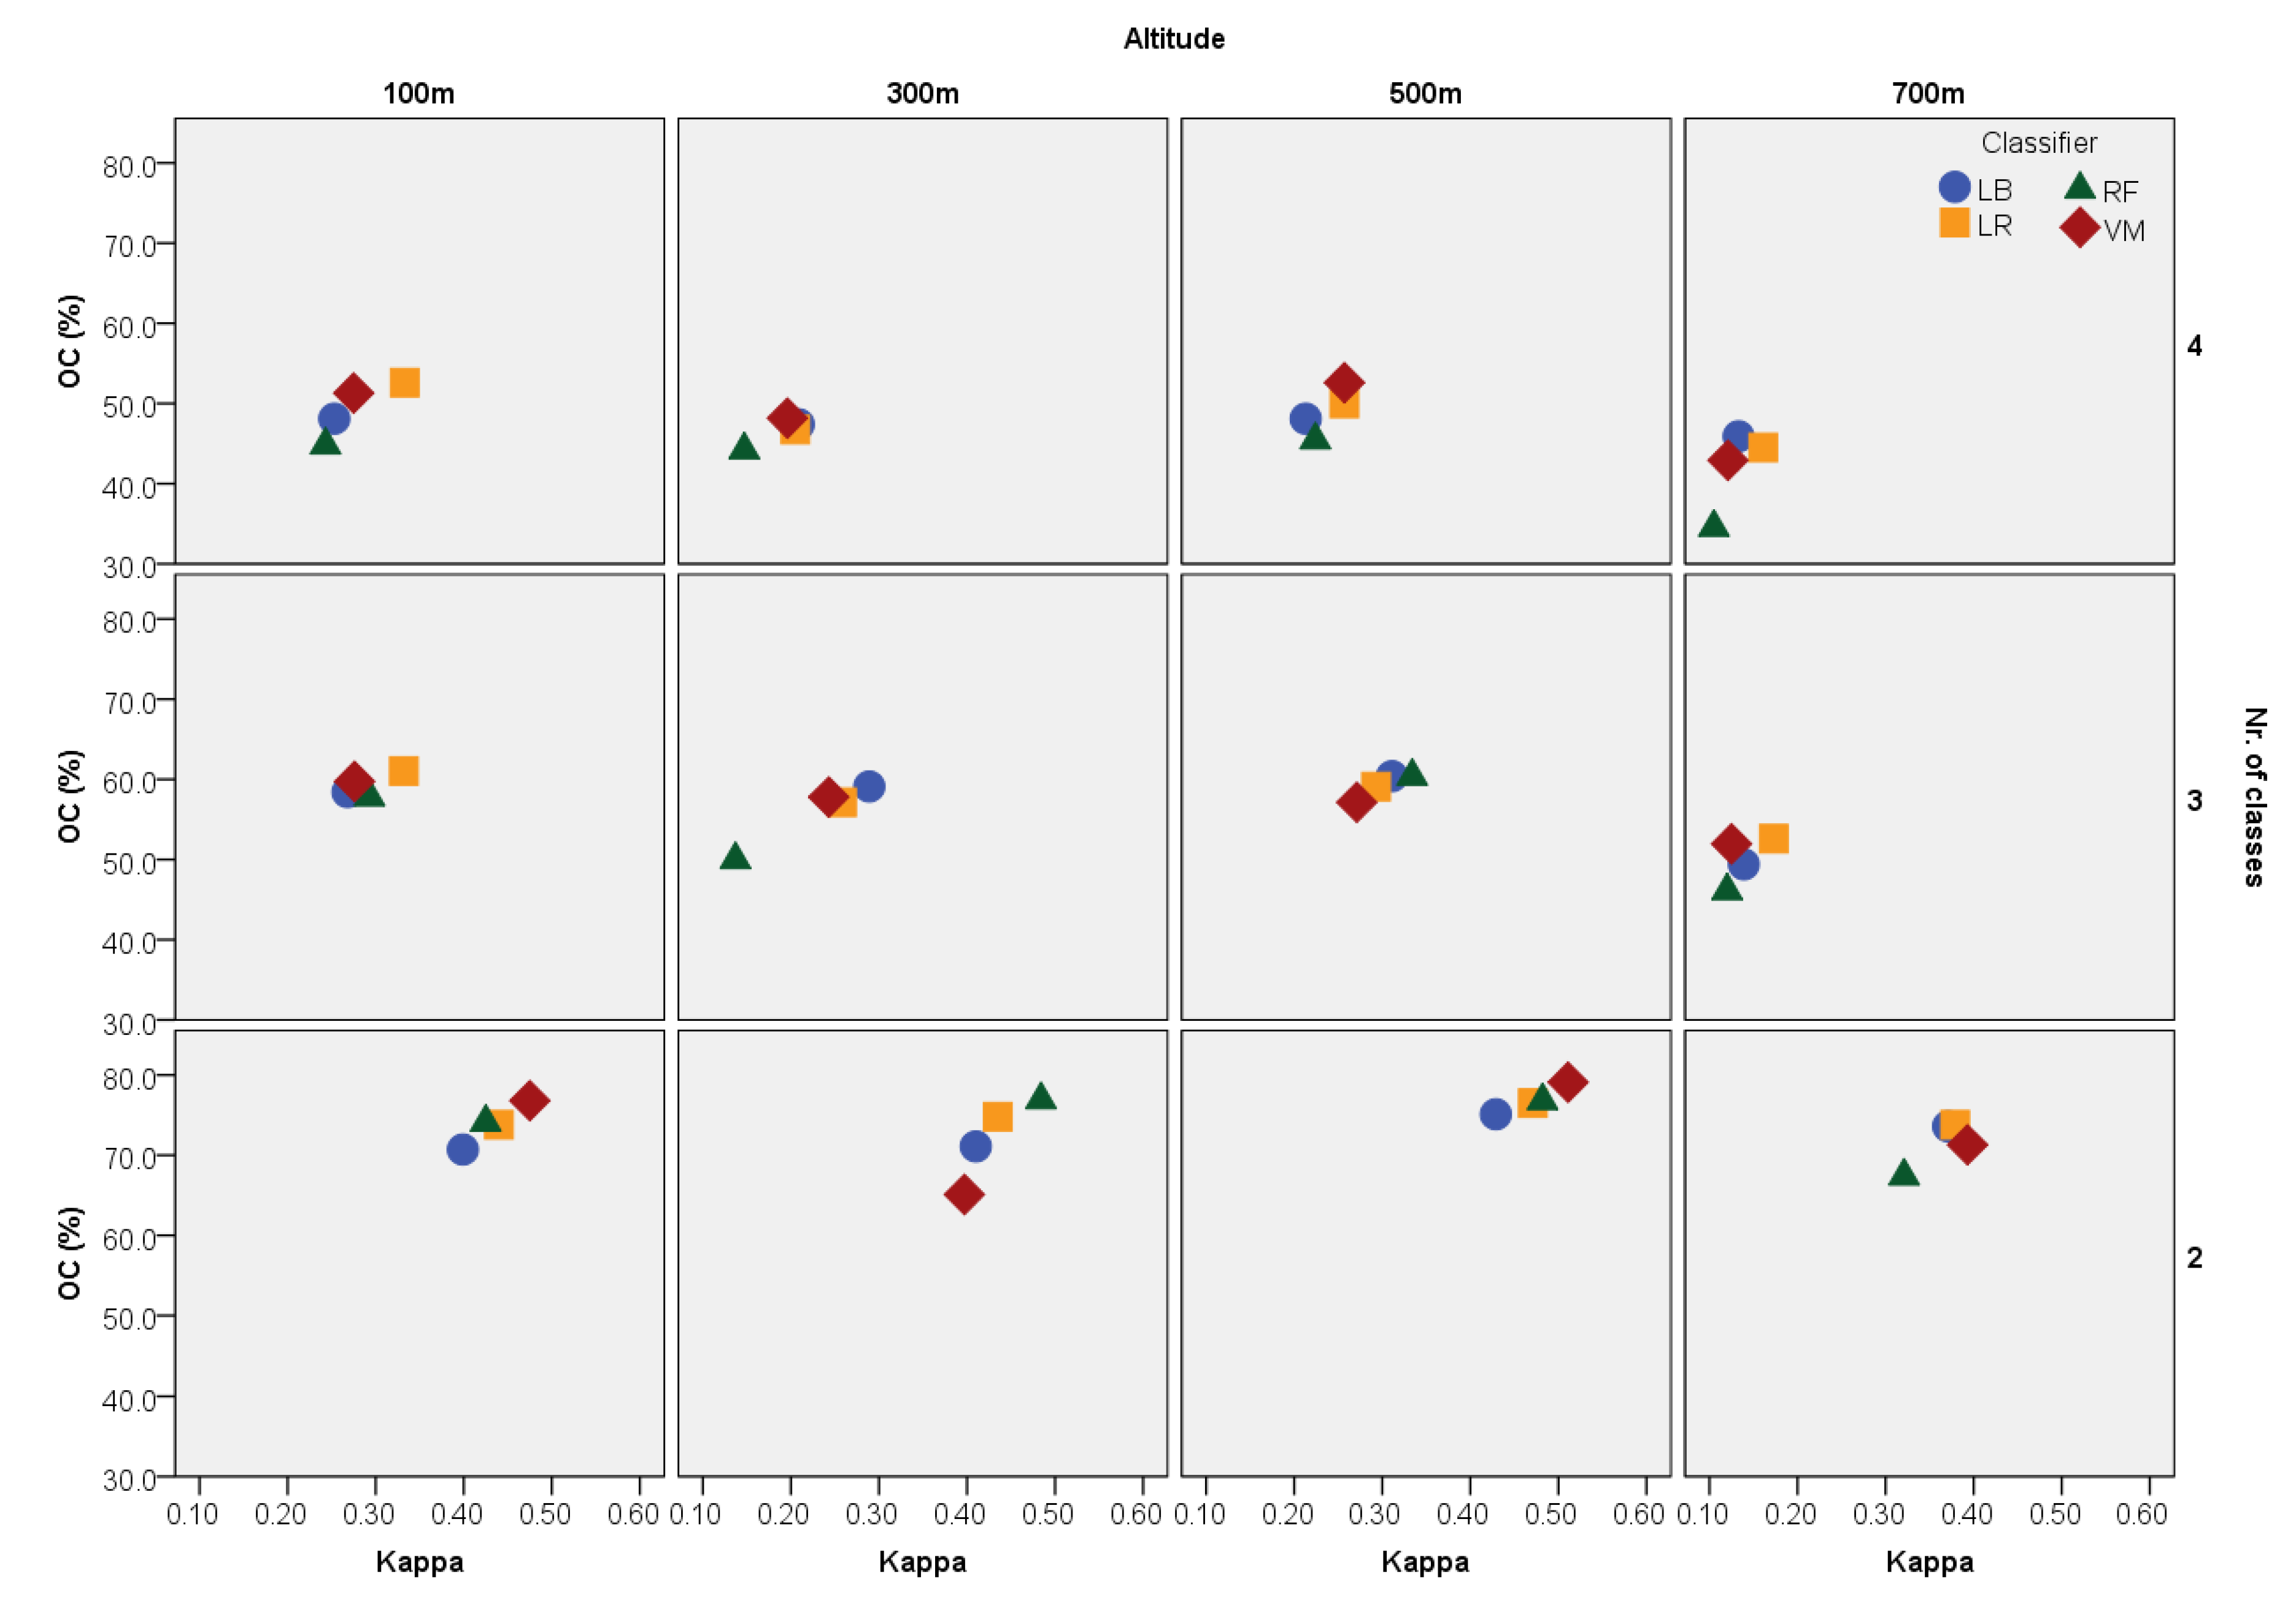
3. Results
4. Discussion
5. Conclusions
Author Contributions
Funding
Acknowledgments
Conflicts of Interest
References
- Domenikiotis, C.; Spiliotopoulos, M.; Tsiros, E.; Dalezios, N.R. Early cotton yield assessment by the use of the NOAA/AVHRR derived Vegetation Condition Index (VCI) in Greece. Int. J. Remote Sens. 2004, 25, 2807–2819. [Google Scholar] [CrossRef]
- Zarco-Tejada, P.J.; Ustin, S.L.; Whiting, M.L. Temporal and Spatial Relationships between Within-Field Yield Variability in Cotton and High-Spatial Hyperspectral Remote Sensing Imagery. Agron. J. 2005, 97, 641–653. [Google Scholar] [CrossRef]
- Read, J.J.; Tarpley, L.; McKinion, J.M.; Reddy, K.R. Narrow-Waveband Reflectance Ratios for Remote Estimation of Nitrogen Status in Cotton. J. Environ. Qual. 2002, 31, 1442–1452. [Google Scholar] [CrossRef] [PubMed]
- Zhao, D.; Reddy, K.R.; Kakani, V.G.; Read, J.J.; Koti, S. Selection of optimum reflectance ratios for estimating leaf nitrogen and chlorophyll concentrations of field-grown cotton. Agron. J. 2005, 97, 89–98. [Google Scholar] [CrossRef]
- Bowman, W.D. The relationship between leaf water status, gas exchange, and spectral reflectance in cotton leaves. Remote Sens. Environ. 1989, 30, 249–255. [Google Scholar] [CrossRef]
- Torrion, J.A.; Maas, S.J.; Guo, W.; Bordovsky, J.P.; Cranmer, A.M. A three-dimensional index for characterizing crop water stress. Remote Sens. 2014, 6, 4025–4042. [Google Scholar] [CrossRef]
- Chen, B.; Wang, K.; Li, S.; Wang, J.; Bai, J.; Xiao, C.; Lai, J. Spectrum Characteristics of Cotton Canopy Infected with Verticillium Wilt and Inversion of Severity Level. In Computer and Computing Technologies in Agriculture, Volume II, Proceedings of the First IFIP TC 12 International Conference on Computer and Computing Technologies in Agriculture (CCTA 2007), Wuyishan, China, 18–20 August 2007; Li, D., Ed.; Springer: Boston, MA, USA, 2008; pp. 1169–1180. [Google Scholar]
- Prabhakar, M.; Prasad, Y.G.; Thirupathi, M.; Sreedevi, G.; Dharajothi, B.; Venkateswarlu, B. Use of ground based hyperspectral remote sensing for detection of stress in cotton caused by leafhopper (Hemiptera: Cicadellidae). Comput. Electron. Agric. 2011, 79, 189–198. [Google Scholar] [CrossRef]
- Oosterhuis, D.M.; Coomer, T.; Raper, T.B.; Espinoza, L. Use of Remote Sensing in Cotton to Accurately Predict the Onset of Nutrient Stress for Foliar Alleviation for Optimizing Yield and Quality; Fluid Fertilizer Foundation: Fayetteville, NC, USA, 2015. [Google Scholar]
- Ranjitha, G.; Srinivasan, M.R. Hyperspectral radiometry for the detection and discrimination of damage caused by sucking pests of cotton. Curr. Biot. 2014, 8, 5–12. [Google Scholar]
- Wang, Q.; Chen, B.; Wang, J.; Wang, F.Y.; Han, H.Y.; Li, S.K.; Wang, K.R.; Xiao, C.H.; Dai, J.G. Four supervised classification methods for monitoring cotton field of verticillium wilt using TM image. J. Anim. Plant Sci. 2015, 25, 5–12. [Google Scholar]
- Kostrzewski, M.; Waller, P.; Guertin, P.; Haberland, J.; Colaizzi, P.; Barnes, E.; Thompson, T.; Clarke, T.; Riley, E.; Choi, C.; et al. Ground-based remote sensing of water and nitrogen stress. Trans. ASAE 2003, 46, 29–38. [Google Scholar] [CrossRef]
- Hunsaker, D.J.; Pinter, P.J.; Barnes, E.M.; Kimball, B.A. Estimating cotton evapotranspiration crop coefficients with a multispectral vegetation index. Irrig. Sci. 2003, 22, 95–104. [Google Scholar] [CrossRef]
- Raper, T.B.; Varco, J.J. Canopy-scale wavelength and vegetative index sensitivities to cotton growth parameters and nitrogen status. Precis. Agric. 2014, 16, 62–76. [Google Scholar] [CrossRef]
- Delegido, J.; Verrelst, J.; Meza, C.M.; Rivera, J.P.; Alonso, L.; Moreno, J. A red-edge spectral index for remote sensing estimation of green LAI over agroecosystems. Eur. J. Agron. 2013, 46, 42–52. [Google Scholar] [CrossRef]
- Sui, R.; Wilkerson, J.B.; Hart, W.E.; Wilhelm, L.R.; Howard, D.D. Multi-spectral sensor for detection of nitrogen status in cotton. Appl. Eng. Agric. 2005, 21, 167. [Google Scholar] [CrossRef]
- Yang, C.; Everitt, J.H.; Fernandez, C.J. Comparison of airborne multispectral and hyperspectral imagery for mapping cotton root rot. Biosyst. Eng. 2010, 107, 131–139. [Google Scholar] [CrossRef]
- Maas, S.J. Linear mixture modeling approach for estimating cotton canopy ground cover using satellite multispectral imagery. Remote Sens. Environ. 2000, 72, 304–308. [Google Scholar] [CrossRef]
- French, A.N.; Hunsaker, D.J.; Thorp, K.R. Remote sensing of evapotranspiration over cotton using the TSEB and METRIC energy balance models. Remote Sens. Environ. 2015, 158, 281–294. [Google Scholar] [CrossRef]
- Liu, H.; Meng, L.; Zhang, X.; Ustin, S.; Ning, D.; Sun, S. Estimation model of cotton yield with time series Landsat images. Trans. Chin. Soc. Agric. Eng. 2015, 31, 223–228. [Google Scholar]
- Zheng, B.; Myint, S.W.; Thenkabail, P.S.; Aggarwal, R.M. A support vector machine to identify irrigated crop types using time-series Landsat NDVI data. Int. J. Appl. Earth Obs. Geoinf. 2015, 34, 103–112. [Google Scholar] [CrossRef]
- Marshall, M.; Thenkabail, P.; Biggs, T.; Post, K. Hyperspectral narrowband and multispectral broadband indices for remote sensing of crop evapotranspiration and its components (transpiration and soil evaporation). Agric. For. Meteorol. 2016, 218–219, 122–134. [Google Scholar] [CrossRef]
- Yang, C.; Odvody, G.N.; Fernandez, C.J.; Landivar, J.A.; Minzenmayer, R.R.; Nichols, R.L. Evaluating unsupervised and supervised image classification methods for mapping cotton root rot. Precis. Agric. 2015, 16, 201–215. [Google Scholar] [CrossRef]
- Camargo, A.; Smith, J.S. An image-processing based algorithm to automatically identify plant disease visual symptoms. Biosyst. Eng. 2009, 102, 9–21. [Google Scholar] [CrossRef]
- Galbieri, R.; Cia, E.; Morello, C.D.L.; Fanan, S.; Andrade Junior, E.R.; Kobayasti, L. Ramularia areola sporulation potential in Brazilian cotton. Summa Phytopathol. 2015, 41, 233–235. [Google Scholar] [CrossRef]
- Salamí, E.; Barrado, C.; Pastor, E. UAV flight experiments applied to the remote sensing of vegetated areas. Remote Sens. 2014, 6, 11051–11081. [Google Scholar] [CrossRef]
- Swain, K.C.; Thomson, S.J.; Jayasuriya, H.P. Adoption of an Unmanned Helicopter for Low-Altitude Remote Sensing To Estimate Yield and Total Biomass of a Rice Crop. Am. Soc. Agric. Biol. Eng. 2010, 53, 21–27. [Google Scholar] [CrossRef]
- Zaks, D.P.M.; Kucharik, C.J. Data and monitoring needs for a more ecological agriculture. Environ. Res. Lett. 2011, 6, 014017. [Google Scholar] [CrossRef]
- Xiang, H.; Tian, L. Development of a low-cost agricultural remote sensing system based on an autonomous unmanned aerial vehicle (UAV). Biosyst. Eng. 2011, 108, 174–190. [Google Scholar] [CrossRef]
- Huang, Y.; Thomson, S.J.; Hoffmann, W.C.; Lan, Y.; Fritz, B.K. Development and prospect of unmanned aerial vehicle technologies for agricultural production management. Int. J. Agric. Biol. Eng. 2013, 6, 1–10. [Google Scholar]
- Gómez-Candón, D.; De Castro, A.I.; López-Granados, F. Assessing the accuracy of mosaics from unmanned aerial vehicle (UAV) imagery for precision agriculture purposes in wheat. Precis. Agric. 2014, 15, 44–56. [Google Scholar] [CrossRef]
- Laliberte, A.S.; Rango, A. Image Processing and Classification Procedures for Analysis of Sub-decimeter Imagery Acquired with an Unmanned Aircraft over Arid Rangelands. GISci. Remote Sens. 2011, 48, 4–23. [Google Scholar] [CrossRef]
- Colomina, I.; Molina, P. Unmanned aerial systems for photogrammetry and remote sensing: A review. ISPRS J. Photogramm. Remote Sens. 2014, 92, 79–97. [Google Scholar] [CrossRef]
- Marcaccio, J.V.; Markle, C.E.; Chow-fraser, P. Use of fixed-wing and multi-rotor unmanned aerial vehicles to map dynamic changes in a freshwater. J. Unmanned Veh. Syst. 2016, 4, 193–202. [Google Scholar] [CrossRef]
- Martinelli, F.; Scalenghe, R.; Davino, S.; Panno, S.; Scuderi, G.; Ruisi, P.; Villa, P.; Stroppiana, D.; Boschetti, M.; Goulart, L.R.; et al. Advanced methods of plant disease detection. A review. Agron. Sustain. Dev. 2015, 35, 1–25. [Google Scholar] [CrossRef]
- Bernardes, A.A.; Rogeri, J.G.; Oliveira, R.B.; Marranghello, N.; Pereira, A.S.; Araujo, A.F.; Tavares, J.M.R.S. Identification of foliar diseases in cotton crop. In Lecture Notes in Computational Vision and Biomechanics; Tavares, J.M.R.S., Jorge, R.N., Eds.; Springer Publishing: Dordrecht, The Netherlands, 2013; Volume 8, pp. 67–85. [Google Scholar]
- Mahlein, A.K.; Rumpf, T.; Welke, P.; Dehne, H.W.; Plümer, L.; Steiner, U.; Oerke, E.C. Development of spectral indices for detecting and identifying plant diseases. Remote Sens. Environ. 2012, 128, 21–30. [Google Scholar] [CrossRef]
- Berdugo, C.A.; Zito, R.; Paulus, S.; Mahlein, A.K. Fusion of sensor data for the detection and differentiation of plant diseases in cucumber. Plant Pathol. 2014, 63, 1344–1356. [Google Scholar] [CrossRef]
- Oberti, R.; Marchi, M.; Tirelli, P.; Calcante, A.; Iriti, M.; Borghese, A.N. Automatic detection of powdery mildew on grapevine leaves by image analysis: Optimal view-angle range to increase the sensitivity. Comput. Electron. Agric. 2014, 104, 1–8. [Google Scholar] [CrossRef]
- Lopes, L.O.; Lacerda, J.J.; Mielezrski, F.; Ratke, R.F.; Lira, D.N.; Pacheco, L.P. Efeito de fungicidas para o controle da Ramularia areola na cultura do algodoeiro. Summa Phytopathol. 2017, 43, 229–235. [Google Scholar] [CrossRef]
- Wulder, M.; Boots, B. Local spatial autocorrelation characteristics of remotely sensed imagery assessed with the Getis statistic. Int. J. Remote Sens. 1998, 19, 2223–2231. [Google Scholar] [CrossRef]
- Witten, I.; Frank, E.; Hall, M.; Pal, C. Data Mining: Practical Machine Learning Tools and Techniques, 4th ed.; Morgan Kaufmann: Burlington, MA, USA, 2016. [Google Scholar]
- Le Cessie, S.; Van Houwelingen, J.C. Ridge Estimators in Logistic Regression. J. R. Stat. Soc. Ser. C Appl. Stat. Appl Stat. 1992, 41, 191–201. [Google Scholar] [CrossRef]
- Landwehr, N. Logistic Model Trees. Mach. Learn. 2005, 59, 161–205. [Google Scholar] [CrossRef]
- Platt, J.C. Advances in kernel methods. In Advances in Kernel Methods: Support Vector Learning; Schölkopf, B., Burges, C.J.C., Smola, A.J., Eds.; MIT Press: Cambridge, MA, USA, 1999; pp. 185–208. [Google Scholar]
- Mountrakis, G.; Im, J.; Ogole, C. Support vector machines in remote sensing: A review. ISPRS J. Photogramm. Remote Sens. 2011, 66, 247–259. [Google Scholar] [CrossRef]
- Belgiu, M.; Drăgu, L. Random forest in remote sensing: A review of applications and future directions. ISPRS J. Photogramm. Remote Sens. 2016, 114, 24–31. [Google Scholar] [CrossRef]
- Long, J.A.; Lawrence, R.L. Mapping percent tree mortality due to mountain pine beetle damage. For. Sci. 2016, 62, 392–402. [Google Scholar] [CrossRef]
- Hosmer, D.W., Jr.; Lemeshow, S.; Sturdivant, R.X. Applied Logistic Regression, 3rd ed.; Wiley: Hoboken, NJ, USA, 2013. [Google Scholar]
- Abe, S. Support Vector Machines for Pattern Classification; Advances in Pattern Recognition; Springer London: London, UK, 2010; Volume 26. [Google Scholar]
- Long, P.M.; Servedio, R.A. Random classification noise defeats all convex potential boosters. Mach. Learn. 2010, 78, 287–304. [Google Scholar] [CrossRef]
- Bekkar, M.; Alitouche, D.; Akrouf, T.; Akrouf Alitouche, T. Imbalanced Data Learning Approaches Review. Int. J. Data Min. Knowl. Manag. Process 2013, 3, 15–33. [Google Scholar] [CrossRef]
- Horler, D.N.H.; Dockray, M.; Barber, J. The red edge of plant leaf reflectance. Int. J. Remote Sens. 1983, 4, 273–288. [Google Scholar] [CrossRef]
- Chitarra, L.G.; Galbieri, R. Controle de doenças no algodeiro em Mato Grosso. In Manual de Boas Práticas de Manejo do Algodeiro em Mato Grosso; Belot, J.L., Ed.; IMAmt: Cuiabá, Brazil, 2015; pp. 166–177. [Google Scholar]
- Candiago, S.; Remondino, F.; De Giglio, M.; Dubbini, M.; Gattelli, M. Evaluating multispectral images and vegetation indices for precision farming applications from UAV images. Remote Sens. 2015, 7, 4026–4047. [Google Scholar] [CrossRef]
- Chen, B.; Li, S.; Wang, K.; Zhou, G.; Bai, J. Evaluating the severity level of cotton Verticillium using spectral signature analysis. Int. J. Remote Sens. 2012, 33, 2706–2724. [Google Scholar] [CrossRef]
- Mahlein, A.-K. Plant Disease Detection by Imaging Sensors—Parallels and Specific Demands for Precision Agriculture and Plant Phenotyping. Plant Diseas. 2016, 100, 241–251. [Google Scholar] [CrossRef]
- Mahlein, A.K.; Steiner, U.; Dehne, H.W.; Oerke, E.C. Spectral signatures of sugar beet leaves for the detection and differentiation of diseases. Precis. Agric. 2010, 11, 413–431. [Google Scholar] [CrossRef]
- Calderón, R.; Navas-Cortés, J.A.; Lucena, C.; Zarco-Tejada, P.J. High-resolution airborne hyperspectral and thermal imagery for early detection of Verticillium wilt of olive using fluorescence, temperature and narrow-band spectral indices. Remote Sens. Environ. 2013, 139, 231–245. [Google Scholar] [CrossRef]
- Bravo, C.; Moshou, D.; West, J.; McCartney, A.; Ramon, H. Early Disease Detection in Wheat Fields using Spectral Reflectance. Biosyst. Eng. 2003, 84, 137–145. [Google Scholar] [CrossRef]
- Navrozidis, I.; Alexandridis, T.K.; Dimitrakos, A.; Lagopodi, A.L.; Moshou, D.; Zalidis, G. Identification of purple spot disease on asparagus crops across spatial and spectral scales. Comput. Electron. Agric. 2018, 148, 322–329. [Google Scholar] [CrossRef]
- Yuan, L.; Pu, R.; Zhang, J. Using high spatial resolution satellite imagery for mapping powdery mildew at a regional scale. Precis. Agric. 2016, 17, 332–348. [Google Scholar] [CrossRef]
- Peña, J.; Torres-Sánchez, J.; Serrano-Pérez, A.; de Castro, A.; López-Granados, F. Quantifying Efficacy and Limits of Unmanned Aerial Vehicle (UAV) Technology for Weed Seedling Detection as Affected by Sensor Resolution. Sensors 2015, 15, 5609–5626. [Google Scholar] [CrossRef] [PubMed]
- Raj, S. Grading System for Cotton Diseases; Technical Bulletin; Central Institute for Cotton Research (CICR): Nagpur, India, 1988; pp. 1–7. [Google Scholar]


| Band | Height (m) | SRG (cm) | N | Mean | Median | SD | Amplitude | Min | Max | |
|---|---|---|---|---|---|---|---|---|---|---|
| GRE | 100 | ~5 | 1.000 | 332,345 | 43.16 | 43.02 | 8.40 | 62.79 | 13.95 | 76.74 |
| 300 | ~15 | 1.011 | 36,647 | 43.57 | 43.82 | 6.54 | 49.16 | 22.44 | 71.60 | |
| 500 | ~25 | 1.027 | 12,949 | 43.84 | 43.79 | 5.88 | 38.81 | 24.88 | 63.70 | |
| 700 | ~35 | 1.085 | 6102 | 45.64 | 45.20 | 5.74 | 38.90 | 27.33 | 66.23 | |
| RED | 100 | ~5 | 1.000 | 332,345 | 8.23 | 8.14 | 6.30 | 75.58 | 0.00 | 75.58 |
| 300 | ~15 | 1,066 | 36,647 | 9.29 | 9.01 | 6.19 | 46.18 | 0.00 | 46.18 | |
| 500 | ~25 | 1.150 | 12,949 | 9.67 | 8.92 | 5.89 | 33.44 | 0.00 | 33.44 | |
| 700 | ~35 | 1.334 | 6102 | 12.65 | 12.93 | 7.07 | 49.12 | 0.00 | 49.12 | |
| NIR | 100 | ~5 | 1.000 | 332,345 | 122.96 | 124.42 | 23.97 | 160.47 | 41.86 | 202.33 |
| 300 | ~15 | 0.994 | 36,647 | 121.47 | 122.92 | 18.28 | 119.77 | 57.78 | 177.56 | |
| 500 | ~25 | 0.969 | 12,949 | 116.08 | 117.41 | 15.67 | 101.44 | 68.56 | 170.00 | |
| 700 | ~35 | 0.963 | 6102 | 110.58 | 111.95 | 14.53 | 83.03 | 69.97 | 153.00 |
| 0 | 1 | 2 | 3 | 4 | |||||||||
|---|---|---|---|---|---|---|---|---|---|---|---|---|---|
| GRE | RED | NIR | GRE | RED | NIR | GRE | RED | NIR | GRE | RED | NIR | ||
| 0 | 100 m | 0.564 | 0.974 | 0.519 | 0.094 | 0.011 | 0.103 | 0.000 | 0.000 | 0.000 | 0.000 | 0.000 | 0.000 |
| 300 m | 0.393 | 0.205 | 0.208 | 0.058 | 0.304 | 0.017 | 0.000 | 0.000 | 0.000 | 0.000 | 0.000 | 0.000 | |
| 500 m | 0.167 | 0.390 | 0.411 | 0.015 | 0.255 | 0.063 | 0.000 | 0.004 | 0.000 | 0.000 | 0.000 | 0.000 | |
| 700 m | 0.255 | 0.339 | 0.623 | 0.248 | 0.380 | 0.759 | 0.000 | 0.006 | 0.000 | 0.000 | 0.000 | 0.000 | |
| 1 | 100 m | 0.152 | 0.013 | 0.142 | 0.000 | 0.000 | 0.000 | 0.000 | 0.000 | 0.000 | |||
| 300 m | 0.501 | 0.817 | 0.598 | 0.001 | 0.016 | 0.001 | 0.000 | 0.000 | 0.000 | ||||
| 500 m | 0.522 | 0.855 | 0.724 | 0.000 | 0.043 | 0.004 | 0.000 | 0.000 | 0.000 | ||||
| 700 m | 0.844 | 0.688 | 0.881 | 0.016 | 0.205 | 0.016 | 0.000 | 0.000 | 0.000 | ||||
| 2 | 100 m | 0.000 | 0.014 | 0.000 | 0.000 | 0.000 | 0.000 | ||||||
| 300 m | 0.000 | 0.001 | 0.000 | 0.000 | 0.000 | 0.000 | |||||||
| 500 m | 0.000 | 0.029 | 0.000 | 0.000 | 0.000 | 0.000 | |||||||
| 700 m | 0.000 | 0.025 | 0.000 | 0.000 | 0.000 | 0.000 | |||||||
| 3 | 100 m | 0.009 | 0.001 | 0.016 | |||||||||
| 300 m | 0.009 | 0.000 | 0.006 | ||||||||||
| 500 m | 0.003 | 0.003 | 0.003 | ||||||||||
| 700 m | 0.006 | 0.000 | 0.002 | ||||||||||
| 4 | |||||||||||||
© 2019 by the authors. Licensee MDPI, Basel, Switzerland. This article is an open access article distributed under the terms and conditions of the Creative Commons Attribution (CC BY) license (http://creativecommons.org/licenses/by/4.0/).
Share and Cite
Xavier, T.W.F.; Souto, R.N.V.; Statella, T.; Galbieri, R.; Santos, E.S.; S. Suli, G.; Zeilhofer, P. Identification of Ramularia Leaf Blight Cotton Disease Infection Levels by Multispectral, Multiscale UAV Imagery. Drones 2019, 3, 33. https://doi.org/10.3390/drones3020033
Xavier TWF, Souto RNV, Statella T, Galbieri R, Santos ES, S. Suli G, Zeilhofer P. Identification of Ramularia Leaf Blight Cotton Disease Infection Levels by Multispectral, Multiscale UAV Imagery. Drones. 2019; 3(2):33. https://doi.org/10.3390/drones3020033
Chicago/Turabian StyleXavier, Thomaz W. F., Roberto N. V. Souto, Thiago Statella, Rafael Galbieri, Emerson S. Santos, George S. Suli, and Peter Zeilhofer. 2019. "Identification of Ramularia Leaf Blight Cotton Disease Infection Levels by Multispectral, Multiscale UAV Imagery" Drones 3, no. 2: 33. https://doi.org/10.3390/drones3020033
APA StyleXavier, T. W. F., Souto, R. N. V., Statella, T., Galbieri, R., Santos, E. S., S. Suli, G., & Zeilhofer, P. (2019). Identification of Ramularia Leaf Blight Cotton Disease Infection Levels by Multispectral, Multiscale UAV Imagery. Drones, 3(2), 33. https://doi.org/10.3390/drones3020033