Abstract
Climate model projections can be used to assess the expected behaviour of extreme precipitations in the future due to climate change. The European part of the Coordinated Regional Climate Downscalling Experiment (EURO-CORDEX) provides precipitation projections for the future under various representative concentration pathways (RCPs) through regionalised Global Climate Model (GCM) outputs by a set of Regional Climate Models (RCMs). In this work, 12 combinations of GCM and RCM under two scenarios (RCP 4.5 and RCP 8.5) supplied by the EURO-CORDEX are analysed for the Iberian Peninsula. Precipitation quantiles for a set of probabilities of non-exceedance are estimated by using the Generalized Extreme Value (GEV) distribution and L-moments. Precipitation quantiles expected in the future are compared with the precipitation quantiles in the control period for each climate model. An approach based on Monte Carlo simulations is developed in order to assess the uncertainty from the climate model projections. Expected changes in the future are compared with the sampling uncertainty in the control period. Thus, statistically significant changes are identified. The higher the significance threshold, the fewer cells with significant changes are identified. Consequently, a set of maps are obtained in order to assist the decision-making process in subsequent climate change studies.
PACS:
J0101
1. Introduction
Currently, there is a general concern about how climate will change in the future. Society and the ecosystems around it are vulnerable to any changes in the frequency and intensity of extreme events, such as heat waves, heavy precipitation, droughts, or wind storms, among others, as seen in recent years [1]. Possible changes in the climate will manifest locally via changes in regional weather patterns, amplifying the frequency or the magnitude of extreme events.
How the climate will behave in the future can be assessed through the use of Global Climate Model (GCM) outputs. GCMs are simplified representations of the Earth’s climate system that allow us to know the possible evolution of climate in the future, as well as to study the effect of changes in a set of forcing variables, such as greenhouse emissions. To overcome the gross spatial resolution of GCM, Regional Climate Models (RCMs), which focus on some regions of the world, are used to simulate the climate behaviour at a higher spatial resolution.
Since the idea of dynamical downscaling was introduced, several RCMs have been developed, improved, and applied throughout the world to produce high-resolution climate information under potential future scenarios for a range of impacts studies [2]. The most recent RCMs have a spatial resolution of 0.11°, which has been proved to be sufficient to both represent the orography and capture the interaction of atmosphere flow and the surface, making it ideal for regions with substantial orographic features [3,4].
Given its high potential impact, further studies have been devoted to assessing the future behaviour of extreme precipitations [1,5,6,7]. However, most of them were conducted at a European scale or focused on specific areas of interest. With regards to the Iberian Penisula, few studies can be found [8,9]. A general agreement about a decrease in average rainfalls [10] together with an increase in extreme events is found from previous studies. However, the results do not agree either on the extent of the change or the spatial distributions of such changes.
This paper offers a new approach to study the effect of climate change on extreme precipitations in the Iberian Peninsula in the future. In addition, it seeks to add conclusive, statistically based results about the expected change in maximum daily precipitation. Future climate scenarios are based on the Fifth IPCC Assessment Report (AR5) on climate change that considers four Representative Concentration Pathways (RCPs), depending on the total radiative forcing at 2100: 2.6, 4.5, 6.0, and 8.5. The findings of this study can be very useful for subsequent climate change studies, with results relevant to decision-makers.
2. Base Data
The data used in this study were supplied by the Coordinated Regional Climate Downscalling Experiment (CORDEX), from the regionalisation of GCMs, through a set of RCMs in some regions of interest throughout the world. Model realisations follow the guidelines of the AR5. The region of interest in this study is Europe (EURO-CORDEX; [11]), as it is the region that includes the entire Iberian Peninsula.
Precipitation time series under climate change scenarios are available freely at any of the European datanodes. The outputs of the RCMs were supplied by cells with different spatial resolutions and different RCPs. In this study, the finest spatial resolution (0.11°~12.5 km) and daily time resolution were selected, both for the control (1951–2005 or 1971–2005, depending on the model) and future (2006–2100) periods. RCP 4.5 and RCP 8.5 emission scenarios were considered. Twelve models from the EURO-CORDEX project were selected.
The study area is the Iberian Peninsula and the Balearic Islands, in the South of Europe. Thus, the European mesh was clipped to a 10 km radius from the coast (or in the case of northern Spain, from the border) of the studied area. This new area includes 4293 cells of the total mesh of Europe.
3. Methodology
3.1. Annual Maximum Series
Climate models supply daily precipitation series. The annual maximum series (AMS) of daily precipitations were extracted in both the control and future periods. Three time intervals in the future period were considered: 2011–2040, 2041–2070, and 2071–2095. Thus, two AMS of 30 years and one of 25 years from the future period, as well as one of 54 or 34 years (depending on the model) from the control period, were obtained.
Precipitation quantiles for a set of probabilities of non-exceedance (termed as return periods in years) can be estimated by fitting a frequency distribution to the AMS. Seven return periods (2, 5, 10, 50, 100, 500, and 1000 years) were selected as representative probabilities for civil engineering design purposes as sewage systems, culverts, or dams. Then, the precipitation depth for a given return period was determined by the Generalized Extreme Value (GEV) distribution function fitted to the series through the L-moments method. The use of the three-parameter GEV function ensures that we capture the behaviour of the right tail of the distribution adequately.
From both sets of precipitation quantiles, in the control and future periods, the relative differences (∆) between them were obtained—calculated for each model, cell, emission scenario, and return period—following Equation (1). Consequently, possible systematic biases of the climate models can be overcome.
In Equation (1), Qcon (T) and Qfut (T) are the precipitation quantiles for the T-year return period in the control and future periods, respectively.
After the process, a set of 12 relative differences, or deltas, for each climate model were obtained for each period and emission scenario. The 50th (median), 68th, and 90th percentiles were selected to show the general change trend in maximum precipitations over the Iberian Peninsula. In order to present the results visually, a smoothing procedure was adopted, consisting of linearly interpolating the deltas from the initial grid to a new, finer grid of 5 km.
3.2. Uncertainty Analysis
Quantile estimates from a distribution function for a given probability entail a range of variability, or uncertainty, around the calculated value. Uncertainty analyses try to quantify such a range, which is useful to establish thresholds for which a possible change in the future can be included inside “natural” variability or not.
To obtain this range, a set of 1000 random series with values between 0 and 1, adjusted to probabilities, of three different lengths (two of 30 and one of 25 values) were generated for each cell and model. The lengths of the periods in the future were considered as the uncertainty in the precipitation in the future was quantified. The probabilities were transformed into precipitation values by using the GEV function fitted to the control period. Consequently, a new set of 1000 GEV distribution functions was obtained for each cell and model. The range of variability for each return period was quantified.
If the precipitation quantile in the future was outside the two-sided threshold, the change was considered significant. Therefore, such a change can be considered as being due to climate change. In order to identify the significance of the change, a threshold needs to be selected. In addition, the number of models that confirm a significant change in the future needs to be determined. Thus, different combinations of both thresholds were considered to see how the change in precipitation varies over the study area.
With the thresholds selected, the median of the changes defined by Equation (1) for all models shows the possible change in the future in those cells where the change is significant and the number of models is appropriate. The reason for choosing all the models is their equiprobability. Despite the fact that just some of them show a significant change, none of them can be removed because of their equal probability of occurrence.
4. Results
4.1. Future Projections
Raw projections of annual maximum daily precipitations give a general view of what is the general trend expected in the future. The median (50th percentile) offers an average change over the models that explains the change that is expected to occur. Meanwhile, higher percentiles, especially the 90th percentile, show the areas where there may occur larger changes. As an example, in Figure 1, the change in the middle future period (2041–2070) for the 100-year return period precipitation is presented in terms of the 50th, 68th, and 90th percentiles.
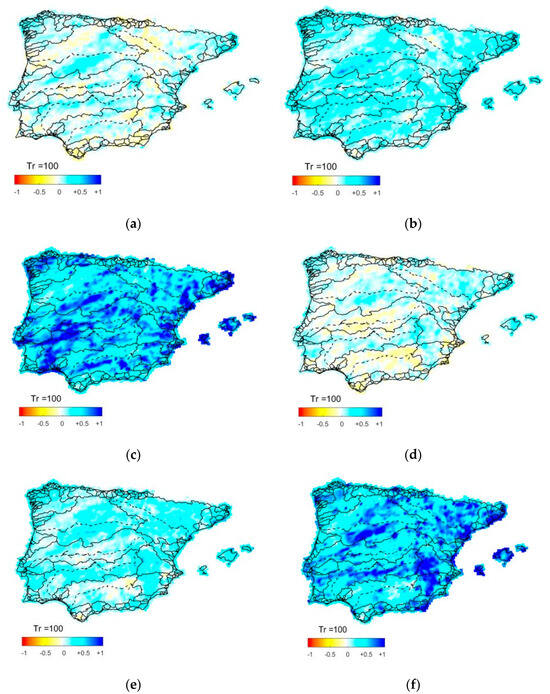
Figure 1.
Relative changes in the 100-year return period maximum daily precipitation for the 50th (a–d), 68th (b–e), and 90th (c–f) percentiles for the future time interval 2041–2070, with RCP 4.5 in the first row and RCP 8.5 in the second row. The bar in the lower left corner indicates the relative difference between control and future intervals.
4.2. Assessment of the Uncertainty Thresholds
Searching for the appropriate significance thresholds, both the two-sided significance threshold and the minimum number of models with change were analysed; Figure 2 shows the average percentage of cells per model versus the significance threshold (drawn in the figure as a one-sided limit). The 100-year return period precipitation in the future period 2041–2070 was selected. The results for other return periods and periods are also available. Both emission scenarios, RCP 4.5 in Figure 2a and RCP 8.5 in Figure 2b, were considered. For each graph, several distributions that represent the minimum number of models (N) with change can be seen.
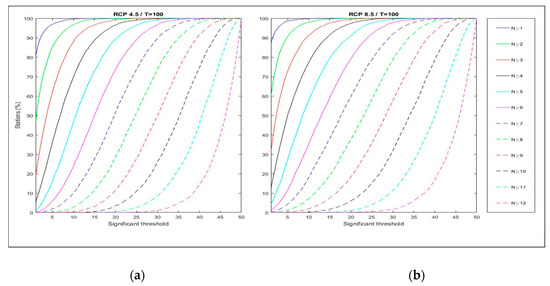
Figure 2.
Distribution of the average percentage of cells per model vs. threshold of significance for the 100-year return period precipitation in the future time interval 2041–2070 for RCP 4.5 (a) and RCP 8.5 (b). Each curve represents a minimum number of models with significant change (from N ≥ 1 to N ≥ 12). The significance threshold shown on the x-axis represents the one-sided threshold. However, the output corresponds to the significance considering both sides.
4.3. Spatial Distribution of Significant Changes
The spatial distributions of cells with significant change for various thresholds are outlined in Figure 3 in order to further explore the selection of the significant thresholds. A minimum number of models with change equal to 6 (at least the half of the models) was selected, as showing all the thresholds is impractical. Following the previous analyses, the 100-year return period precipitation in the future period 2041–2070 was selected. Three thresholds of interest were used (5, 10, and 20% two-sided significant thresholds). In order to present the results, the same smoothing procedure used in Section 4.1 was adopted.
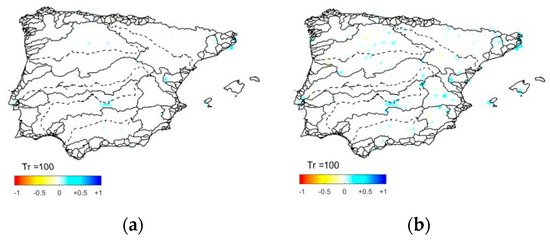
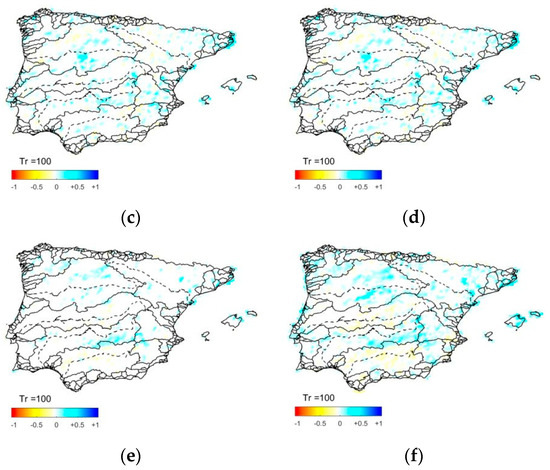
Figure 3.
Spatial distribution of significant changes in the 100-year precipitation quantile with two-sided significance thresholds of 5% (a,d), 10% (b,e), and 20% (c,f), with a minimum number of six models with significant change in the future period 2041–2070 and with RCP 4.5 in the first row and RCP 8.5 in the second row.
As expected, the higher the threshold, the greater the number of cells which are significant. Furthermore, following the results of Figure 2, RCP 8.5 has several more significant cells than RCP 4.5 for all thresholds. In general, despite some zones, both scenarios present similar areas of change, reaching changes of about 50% in both directions. However, RCP 8.5 shows more areas with negative changes than RCP 4.5, especially in the middle areas of the Tagus and Guadalquivir river basins. Finally, it is interesting to see that significant decreases do not arise until the 20% threshold is selected in both emission scenarios.
5. Discussion and Conclusions
5.1. Uncertainty Thresholds
The results show the difficulty in selecting a threshold, both for significance values and the minimum number of models. Both scenarios behave in a similar way, and the equidistance between the distributions of the minimum number of models make the selection hard.
Regarding the minimum number of models (N), a general option may be to select at least half of the total number of models (in this case, N ≥ 6). This was the decision made in this study. A higher threshold, especially more than eight models, leads to a high significance threshold to obtain change values.
The choice of the significance threshold depends on the scientific rigor required. A threshold of 1% means there are no cells with change, so higher thresholds must be chosen. As Figure 3 shows, some areas can be identified with a threshold of 5%. However, most of the changes come from a single cell with change. This result shows a common problem of this type of studies—the “island effect”. Individual cells without any other cell with change around them make it difficult to trust that there is a change in that local area, since changes should occur across a larger region, and not locally. Consequently, caution should be exercised when drawing conclusions about such cells.
5.2. Significant Changes in Model Projections
A general assessment over all return periods could be confusing, as they show differing areas with change. Therefore, the 100-year precipitation quantile in the future period 2041–2070 was considered in the discussion. From Figure 3, some conclusions can be obtained. Areas with positive change in both scenarios are the upper part of Guadiana river basin, the central part of Duoro river basin, and some specific areas of the Mediterranean coast. On the other hand, negative changes can be found in RCP 8.5 in the Tagus river basin and southeast Spain. This latter trend agrees with the findings of reference [8]. Nevertheless, the results of this paper show many more areas with positive change in that region.
References
- Beniston, M.; Stephenson, D.B.; Christensen, O.B.; Christopher, A.T.F.; Christoph, F.; Stéphane, G.; Kirsten, H.; Tom, H.; Jylhä, B.; Koffi, J.; et al. Future extreme events in European climate: An Exploration of regional climate model projections. Clim. Chang. 2007, 81, 71–95. [Google Scholar] [CrossRef]
- Mascaro, G.; Viola, F.; Deidda, R. Evaluation of precipitation from EURO-CORDEX regional climate simulations in a small-scale Mediterranean site. J. Geophys. Res. Atmos. 2018, 123, 1604–1625. [Google Scholar] [CrossRef]
- Prein, A.F.; Gobiet, A.; Truhetz, H.; Keuler, K.; Goergen, C.; Teichmann, C.; Luigi Vidale Fox Maule, E.; van Meijgaard, M.; Déqué, G.; Nikulin, R.; et al. Precipitation in the EURO-CORDEX 0.11° and 0.44° simulations: High resolution, high benefits? Clim. Dyn. 2016, 46, 383–412. [Google Scholar] [CrossRef]
- Casanueva, A.; Kotlarski, S.; Herrera, S.; Fernández, J.; Gutiérrez, J.M.; Boberg, F.; Colette, A.; Christensen, O.B.; Goergen, K.; Jacob, D.; et al. Daily precipitation statistics in a EURO-CORDEX RCM ensemble: Added value of raw and bias-corrected high-resolution simulations. Clim. Dyn. 2016, 47, 719–737. [Google Scholar] [CrossRef]
- Frei, C.; Schöll, R.; Fukutome, S.; Schmidli, J.; Luigi Vidale, P. Future change of precipitation extremes in Europe: Intercomparison of scenarios from regional climate models. J. Geophys. Res. 2006, 111, D06105. [Google Scholar] [CrossRef]
- Fowler, H.J.; Ekström, M.; Blenkinsop, S.; Smith, A.P. Estimating change in extreme European precipitation using a multimodel ensemble. J. Geophys. Res. 2007, 112, D18104. [Google Scholar] [CrossRef]
- Rajczak, J.; Pall, P.; Schär, C. Projections of extreme precipitation events in regional climate simulations for Europe and the Alpine Region. J. Geophys. Res. 2010, 118, 3610–3626. [Google Scholar] [CrossRef]
- Monjo, R.; Gaitán, E.; Pórtoles, J.; Ribalaygua, J.; Torres, L. Changes in extreme precipitation over Spain using statistical downscaling of CMIP5 projections. Int. J. Climatol. 2016, 36, 757–769. [Google Scholar] [CrossRef]
- Herrera, S.; Fita, L.; Fernández, J.; Gutiérrez, J.M. Evaluation of the mean and extreme precipitation regimes from the ENSEMBLES regional climate multimodel simulations over Spain. J. Geophys. Res. 2010, 115, D21117. [Google Scholar] [CrossRef]
- Giorgi, F.; Lionello, P. Climate change projections for the mediterranena region. Glob. Planet. Chang. 2008, 63, 90–104. [Google Scholar] [CrossRef]
- Jacob, D.; Petersen, J.; Eggert, B.; Alias, A.; Bøssing Christensen, O.; Bouwer, L.M.; Braun, A.; Colette, A.; Déqué, M.; Georgievski, G.; et al. EURO-CORDEX: New high-resolution climate change projections for European impact research. Reg. Environ. Chang. 2014, 14, 563–578. [Google Scholar] [CrossRef]
© 2018 by the authors. Licensee MDPI, Basel, Switzerland. This article is an open access article distributed under the terms and conditions of the Creative Commons Attribution (CC BY) license (https://creativecommons.org/licenses/by/4.0/).