Development and Application of an LC-MS/MS Method for Identification of Polyphenols in Propolis Extract †


 and
and
Abstract
:1. Introduction
2. Materials and Methods
3. Results and Discussion
4. Conclusions
Funding
Conflicts of Interest
References
- Hokkanen, J. Liquid chromatography mass spectrometry of bioactive secondary metabolites- in vivo and in vitro studies. Acta Universitatis Ouluensis a Scientiae Rerum Naturalium 606 University of Oulu Repository, Finland. 2013. Available online: http://jultika.oulu.fi/files/isbn9789526200897.pdf (accessed on 1 September 2020).
- Nichitoi, M.M.; Josceanu, A.M.; Isopescu, R.D.; Isopencu, G.; Lavric, V. Romanian propolis extracts: Characterization and statistical analysis and modelling. UPB. Sci. Bull. Series B 2019, 81, 149–162. [Google Scholar]
- Josceanu, A.M.; Postelnicescu, P.; Dumitrescu, A.M. Validation of an Ion Chromatographic Method for Lead and Cooper Quantification. In Proceedings of the 36th International Conference of Slovak Society of Chemical Engineering, Tatranske Matliare, Slovakia, 24–28 May 2010; p. 471, ISBN 978-80-227-3290-1. [Google Scholar]
- International Council for Harmonisation of Technical Requirements for Pharmaceuticals for Human Use (ICH), Q2 (R1)—Validation of analytical procedures text and methodology. Available online: https://www.ich.org/ (accessed on 8 July 2020).


| Compound | Parent Ion, Da | Precursor Ion, Da | DPa, V | EPb, V | CEc, eV | CXPd, V |
|---|---|---|---|---|---|---|
| Caffeic acid | 178.9 | 134.9 | −70 | −10 | −22 | −13 |
| p-Coumaric acid | 162.9 | 118.9 | −60 | −10 | −22 | −9 |
| Gallic acid | 168.8 | 124.9 | −65 | −10 | −20 | −11 |
| t-Ferulic acid | 192.9 | 133.8 | −70 | −10 | −22 | −11 |
| Kaempferol | 284.9 | 92.9 | −130 | −10 | −54 | −7 |
| Quercetin | 300.9 | 135.8 | −120 | −10 | −28 | −11 |
| Chrysin | 253 | 208.9 | −145 | −10 | −20 | −17 |
| Pinocembrin | 255 | 212.8 | −120 | −10 | −28 | −28 |
| Vanillin | 150.9 | 135.8 | −60 | −10 | −18 | −9 |
| CAPE | 283 | 135 | −120 | −10 | −72 | −17 |
| Gallangin | 268.9 | 168.8 | −105 | −10 | −36 | −11 |
| Analyte Name | Retention Time, min | Relative Standard Deviation, % |
|---|---|---|
| Gallic Acid | 0.262 | 0.020 |
| Caffeic Acid | 1.88 | 0.080 |
| Vanillin | 2.04 | 0.045 |
| p-Coumaric Acid | 2.32 | 0.024 |
| t-Ferulic Acid | 2.66 | 0.090 |
| Quercetin | 4.13 | 0.210 |
| Kaempferol | 4.64 | 0.070 |
| Pinocembrin | 4.86 | 0.120 |
| CAPE | 5.19 | 0.080 |
| Chrysin | 5.25 | 0.010 |
| Galangin | 5.26 | 0.050 |
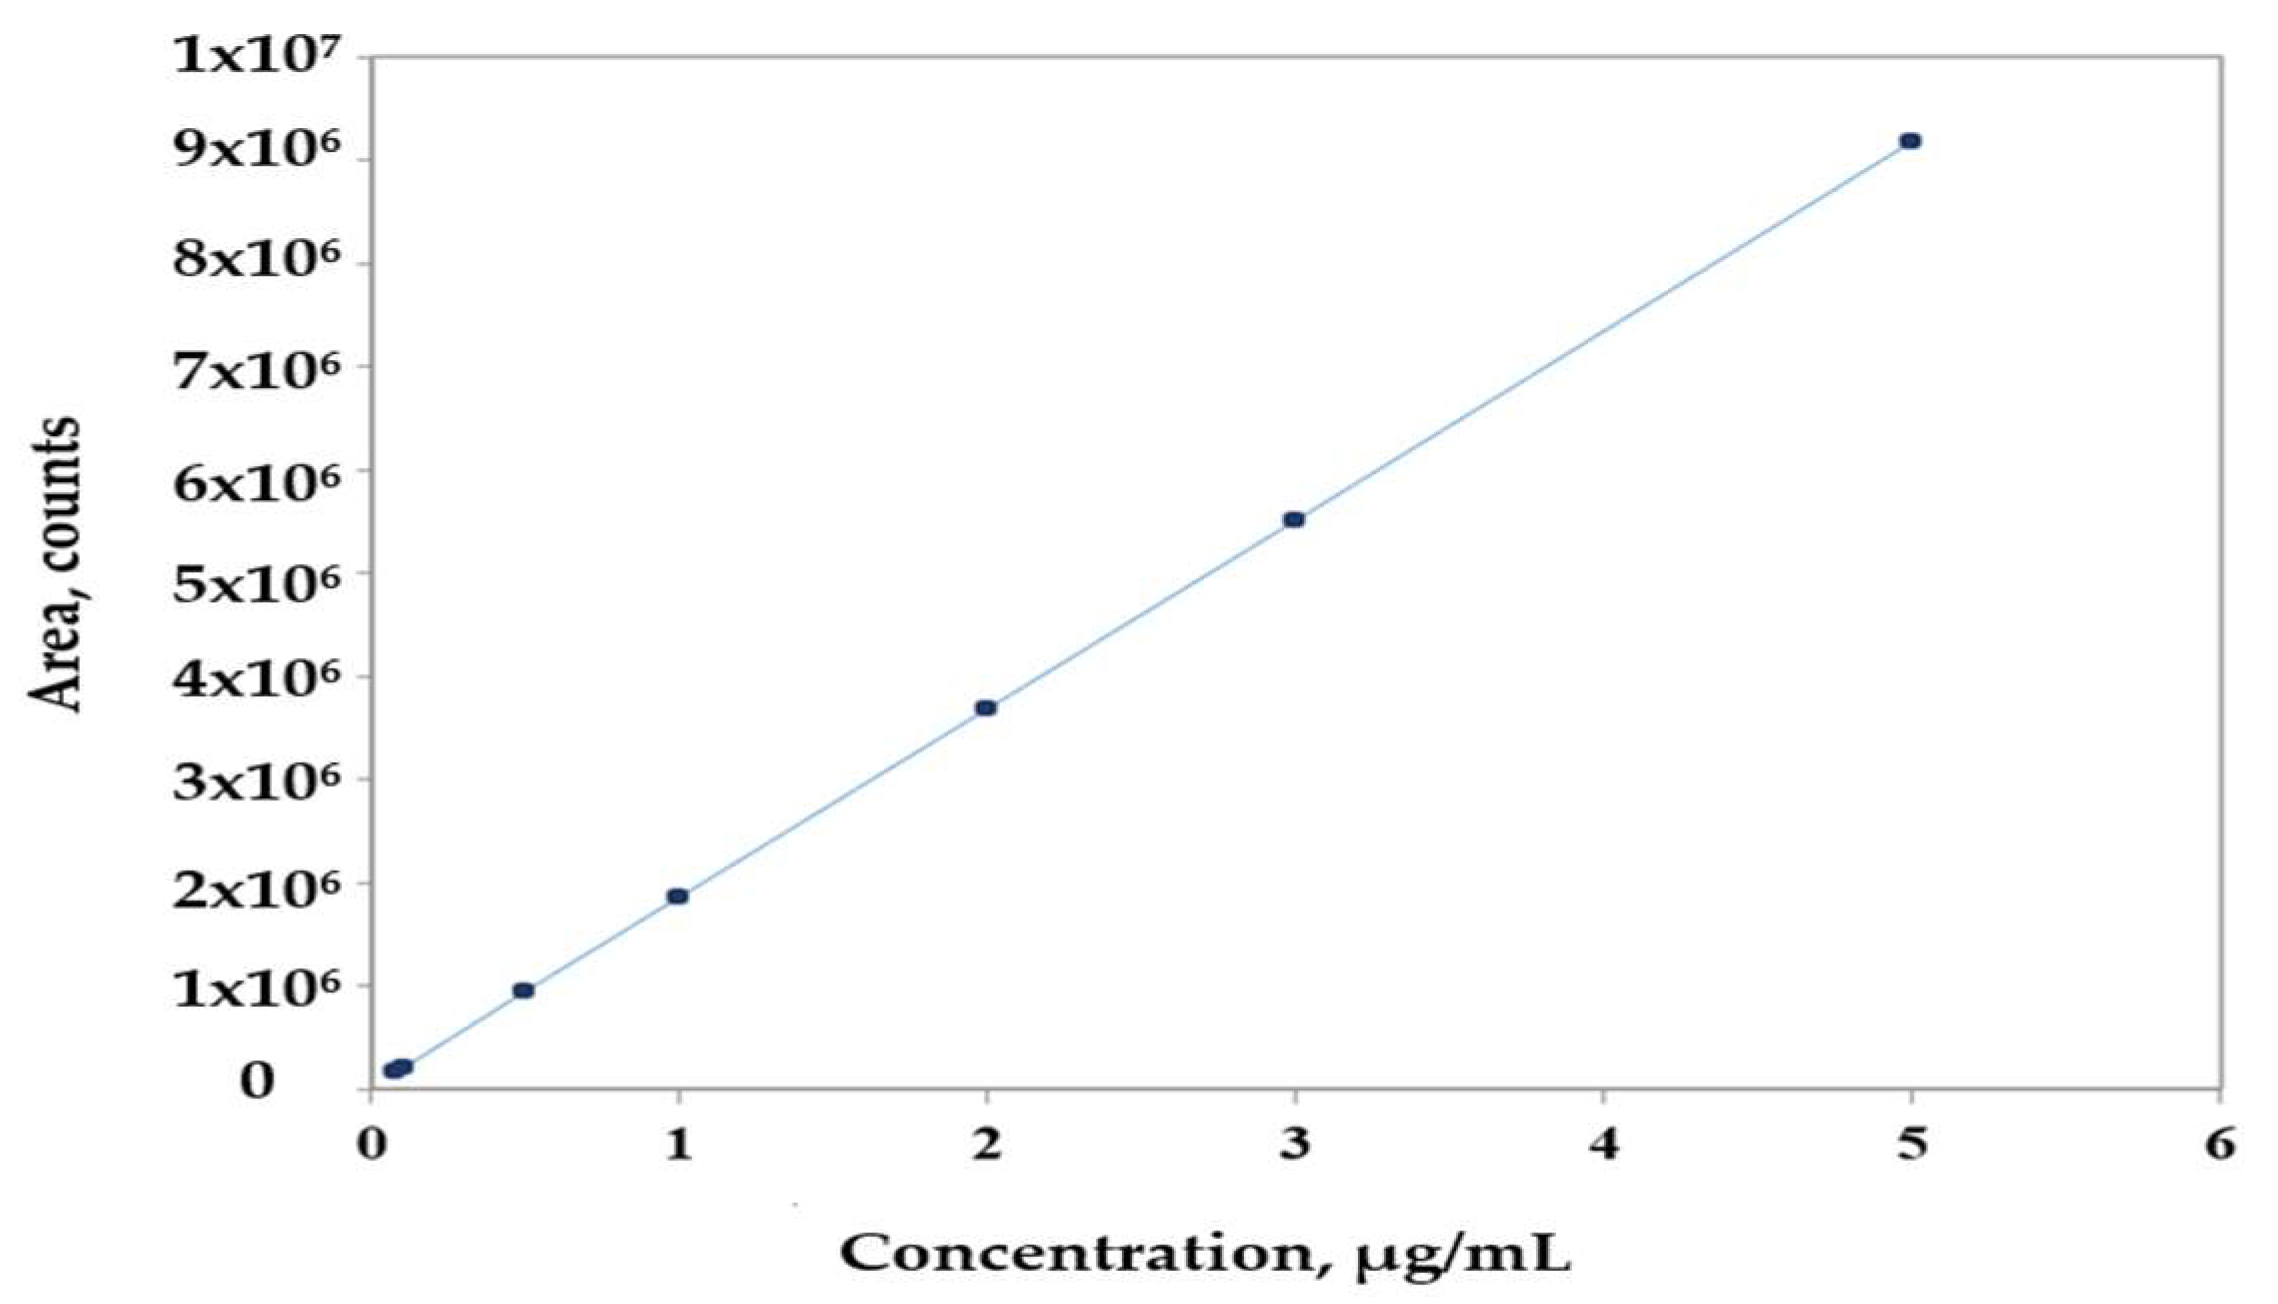
| Analyte | Intercept | Slope | R2 |
|---|---|---|---|
| Quercetin | 1.35 × 10⁴ | 1.84 × 10⁶ | 0.9998 |
| Chrysin | 7.09 × 10³ | 4.09 × 10⁴ | 0.9822 |
| Vanillin | 2.83 × 10⁴ | 1.07 × 10⁶ | 0.9994 |
| Pinocembrin | 4.63 × 10⁴ | 1.29 × 10⁶ | 0.9990 |
| Kaempferol | 2.16 × 10³ | 1.60 × 10⁵ | 0.9995 |
| CAPE | 1.51 × 10⁴ | 1.29 × 10⁵ | 0.9988 |
| t-Ferulic Acid | 2.26 × 10⁴ | 1.26 × 10⁶ | 1 |
| p-Coumaric Acid | 2.83 × 10⁵ | 1.17 × 10⁷ | 0.9992 |
| Gallic Acid | 7.90 × 10⁴ | 5.99 × 10⁶ | 0.9991 |
| Caffeic Acid | 1.51 × 10⁵ | 9.99 × 10⁶ | 0.9995 |
| Galangin | 9.84 × 10³ | 6.25 × 10⁵ | 0.9988 |
| Analyte | LOD, µg/mL | LOQ, µg/mL |
|---|---|---|
| Quercetin | 0.07 | 0.17 |
| Chrysin | 0.23 | 0.69 |
| Vanillin | 0.09 | 0.26 |
| Pinocembrin | 0.12 | 0.37 |
| Kaempferol | 0.08 | 0.24 |
| CAPE | 0.17 | 0.51 |
| t-Ferulic Acid | 0.01 | 0.03 |
| p-Coumaric Acid | 0.16 | 0.49 |
| Gallic Acid | 0.17 | 0.52 |
| Caffeic Acid | 0.12 | 0.30 |
| Galangin | 0.18 | 0.54 |
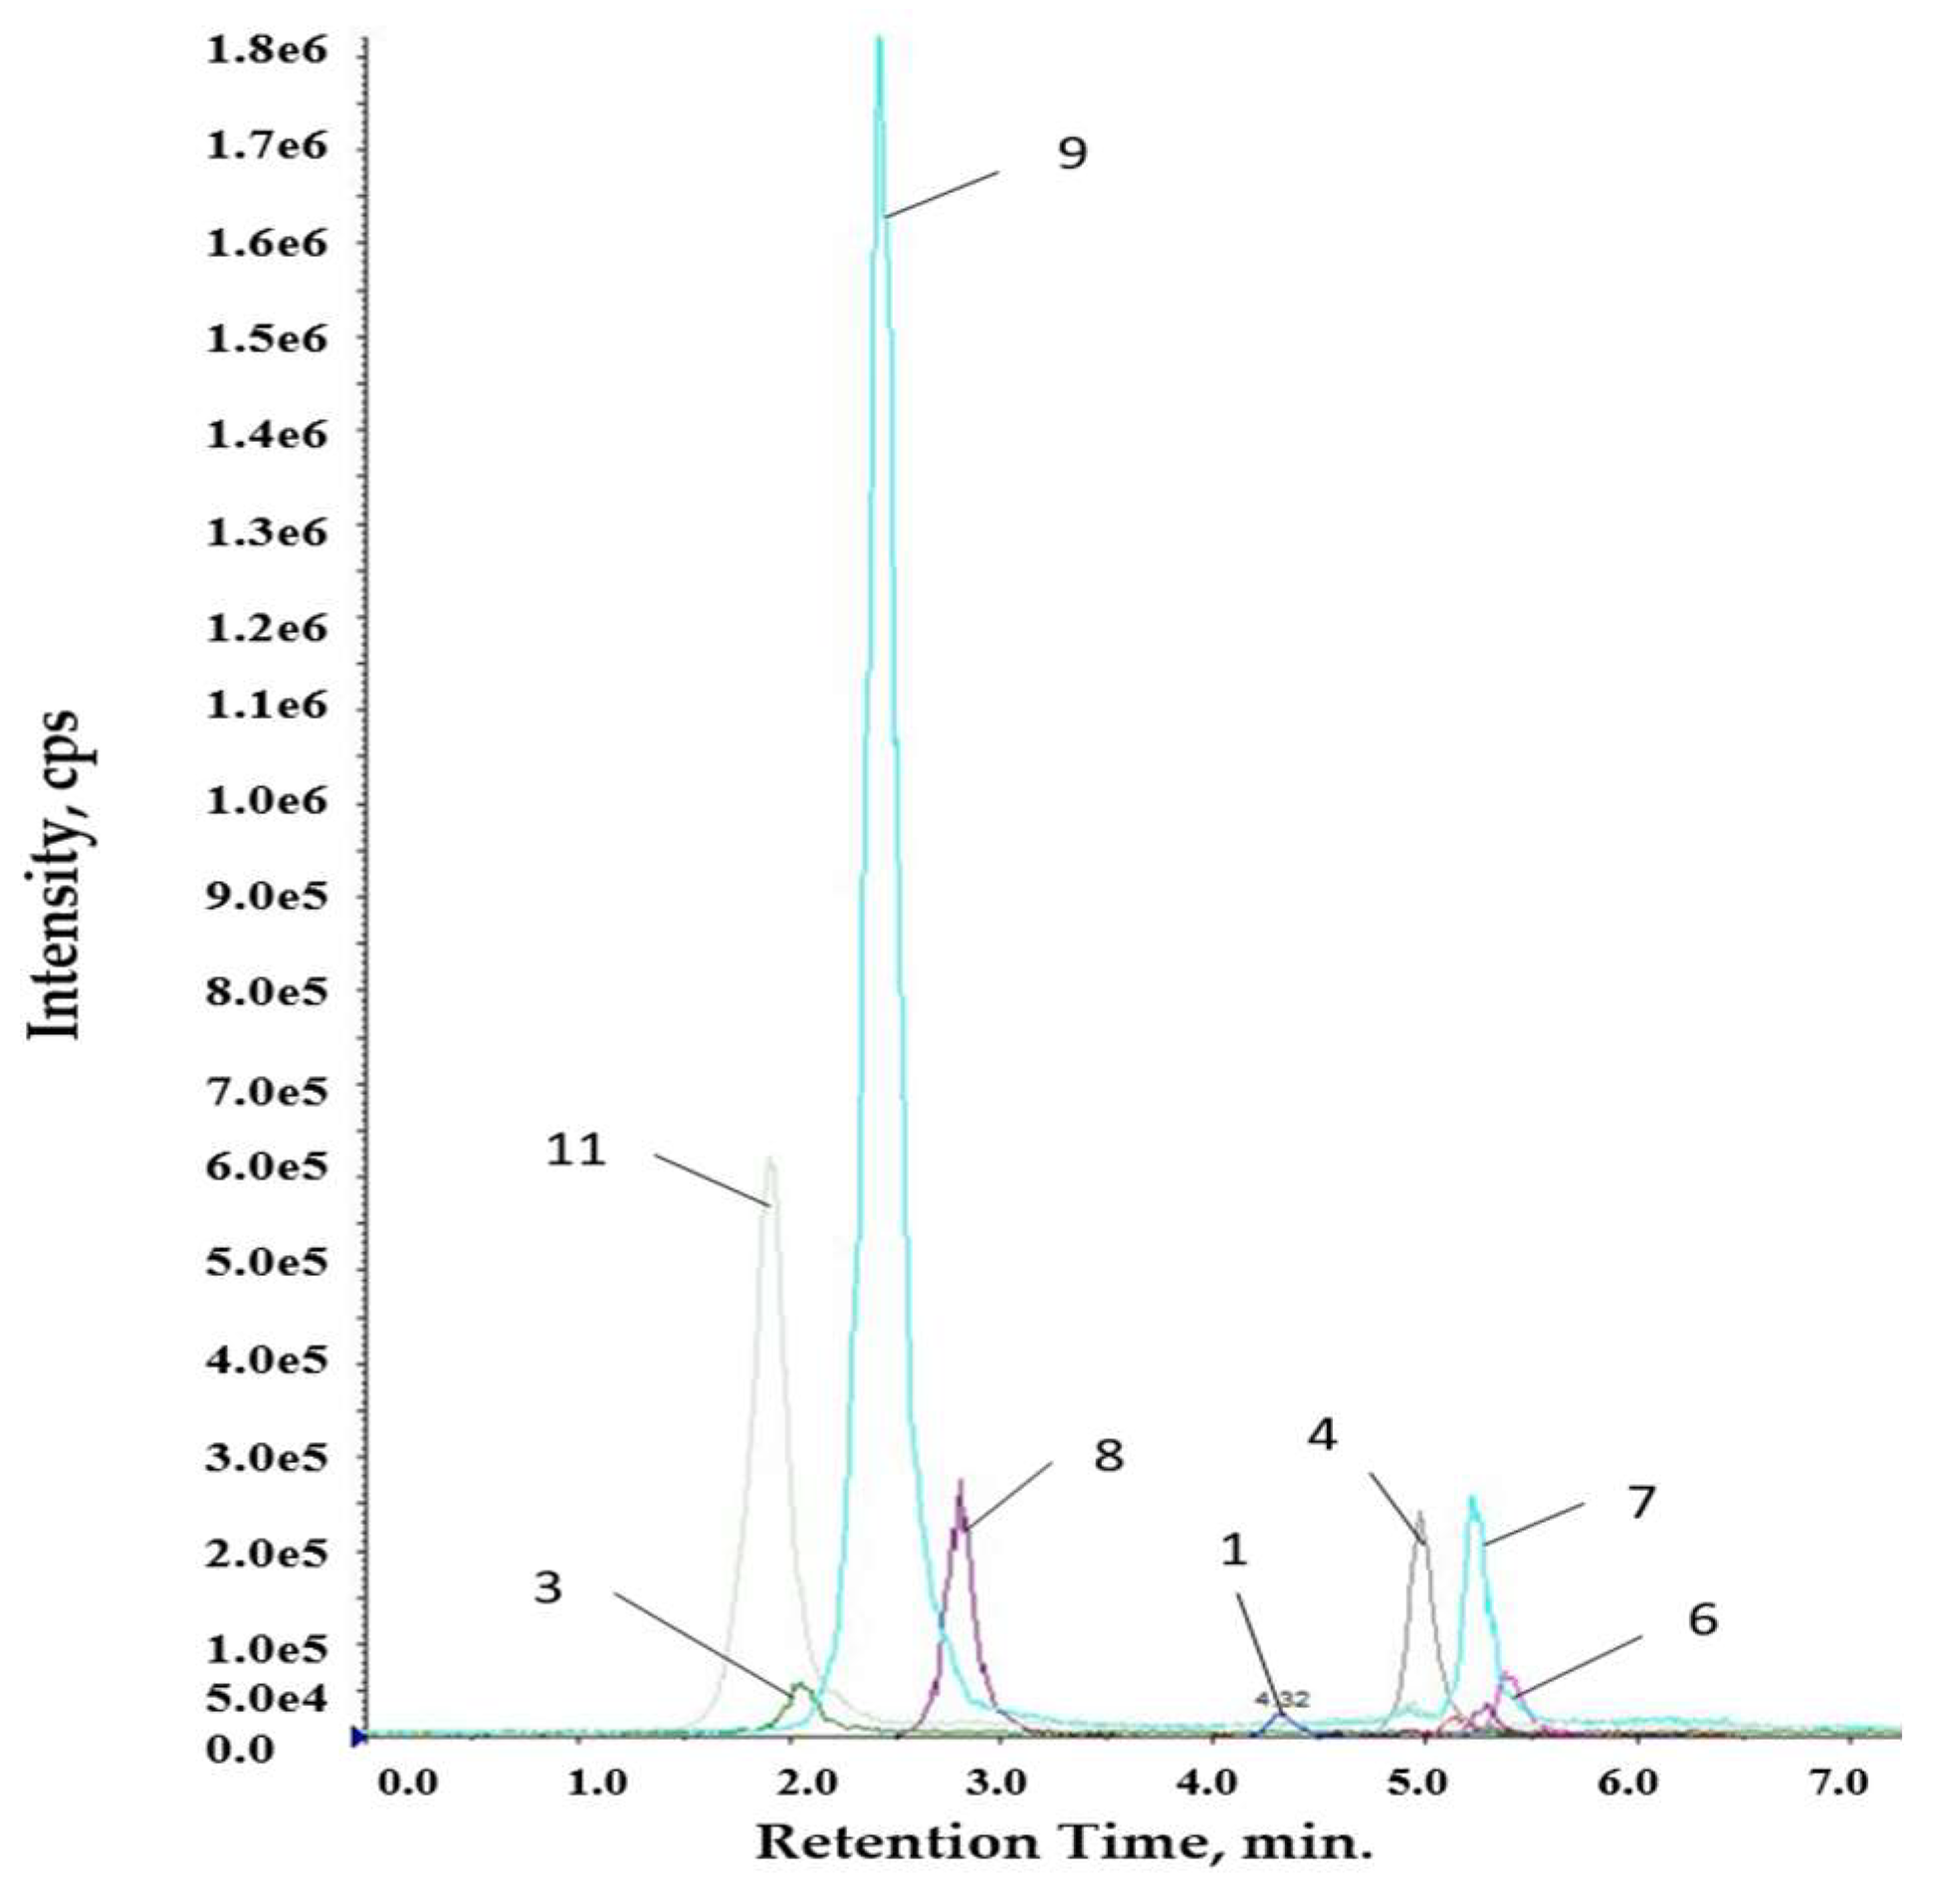
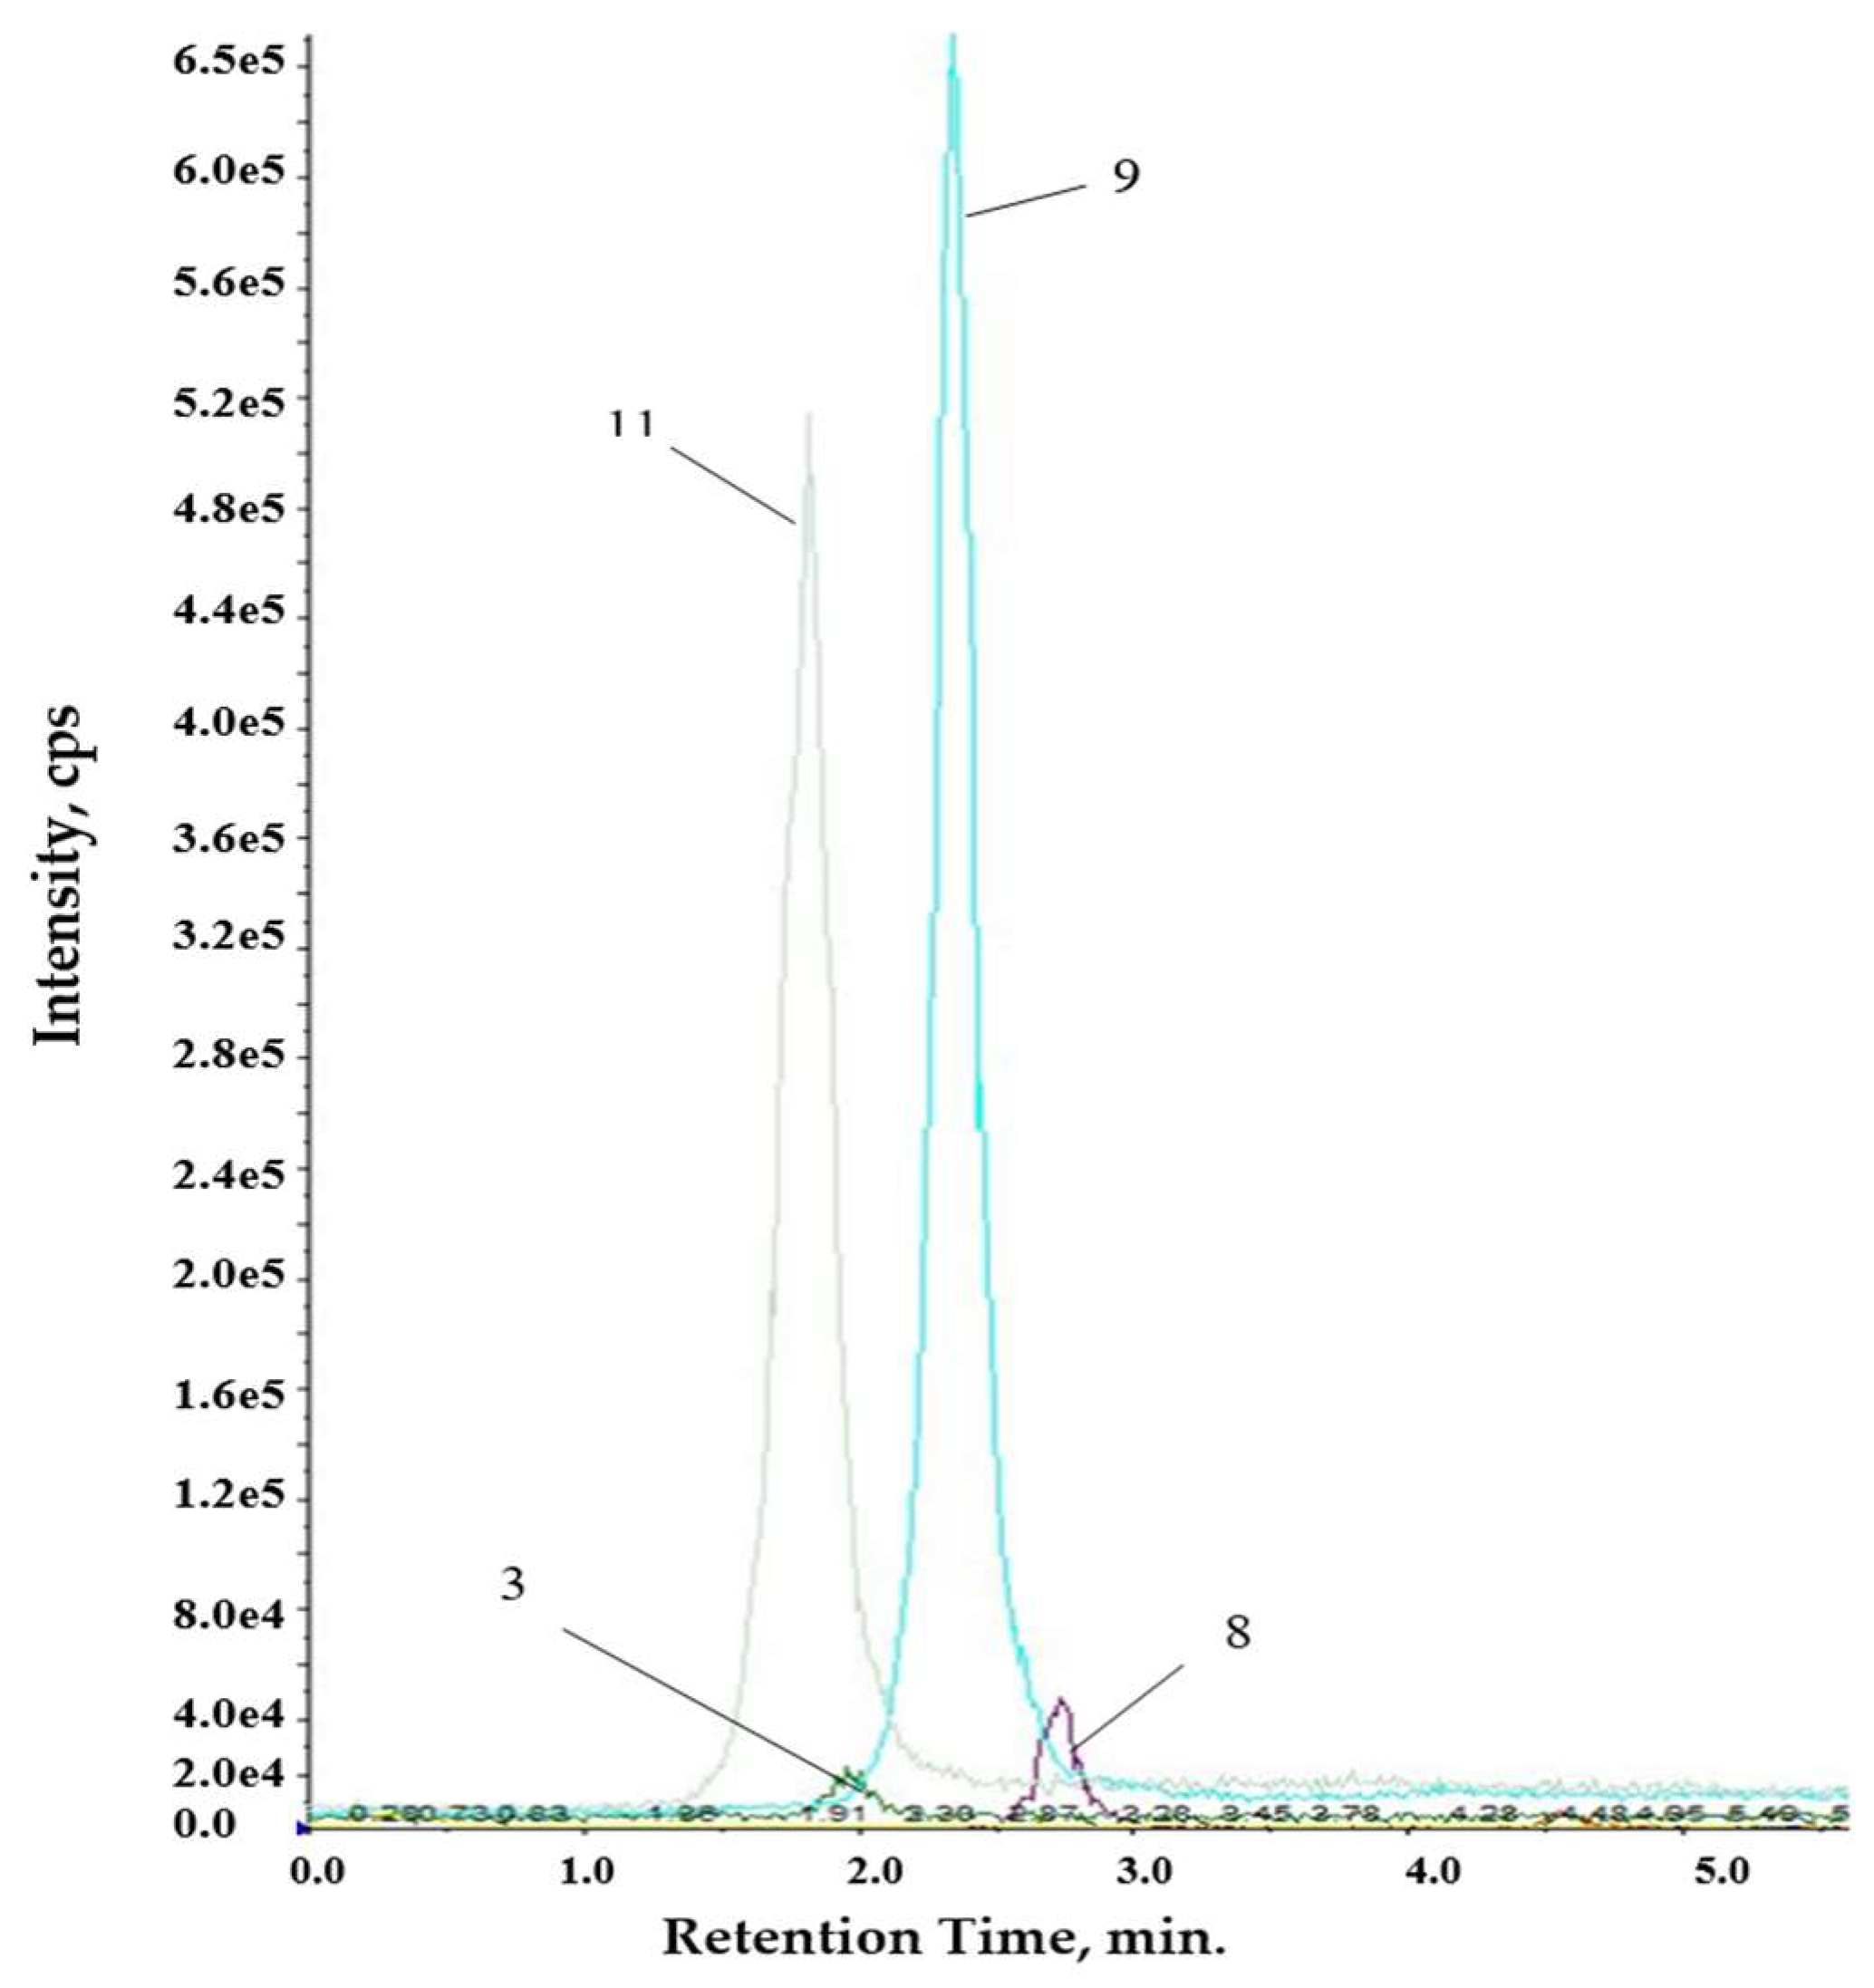
| Compound | Ethanolic Extract | Aqueous Extract | |||
|---|---|---|---|---|---|
| Code | Name | Retention | Concentration, | Retention | Concentration, |
| Time, min | µg/mL | Time, min | µg/mL | ||
| 1 | Quercetin | 4.311 | 0.834 | - | - |
| 2 | Chrysin | - | - | - | - |
| 3 | Vanillin | 2.040 | 3.589 | 1.964 | 0.292 |
| 4 | Pinocembrin | 4.978 | 10.50 | - | - |
| 5 | Kaempferol | 4.699 | 0.990 | - | - |
| 6 | Galangin | 5.389 | 6.781 | - | - |
| 7 | CAPE | 5.276 | 4.579 | - | - |
| 8 | t-Ferulic Acid | 2.808 | 13.26 | 2.744 | 0.794 |
| 9 | p-Coumaric Acid | 2.427 | 10.80 | 2.340 | 1.261 |
| 10 | Gallic Acid | - | - | - | - |
| 11 | Caffeic Acid | 1.910 | 4.873 | 1.821 | 1.330 |
Publisher’s Note: MDPI stays neutral with regard to jurisdictional claims in published maps and institutional affiliations. |
© 2020 by the authors. Licensee MDPI, Basel, Switzerland. This article is an open access article distributed under the terms and conditions of the Creative Commons Attribution (CC BY) license (https://creativecommons.org/licenses/by/4.0/).
Share and Cite
Nichitoi, M.M.; Costache, T.; Josceanu, A.M.; Isopescu, R.; Isopencu, G.; Lavric, V. Development and Application of an LC-MS/MS Method for Identification of Polyphenols in Propolis Extract. Proceedings 2020, 55, 10. https://doi.org/10.3390/proceedings2020055010
Nichitoi MM, Costache T, Josceanu AM, Isopescu R, Isopencu G, Lavric V. Development and Application of an LC-MS/MS Method for Identification of Polyphenols in Propolis Extract. Proceedings. 2020; 55(1):10. https://doi.org/10.3390/proceedings2020055010
Chicago/Turabian StyleNichitoi, Madalina Maria, Teodor Costache, Ana Maria Josceanu, Raluca Isopescu, Gabriela Isopencu, and Vasile Lavric. 2020. "Development and Application of an LC-MS/MS Method for Identification of Polyphenols in Propolis Extract" Proceedings 55, no. 1: 10. https://doi.org/10.3390/proceedings2020055010
APA StyleNichitoi, M. M., Costache, T., Josceanu, A. M., Isopescu, R., Isopencu, G., & Lavric, V. (2020). Development and Application of an LC-MS/MS Method for Identification of Polyphenols in Propolis Extract. Proceedings, 55(1), 10. https://doi.org/10.3390/proceedings2020055010