Abstract
The Anak Krakatau Island and volcano caldera are located at the Sunda Strait between the Java and Sumatra Islands of Indonesia. The volcano started erupting on 22 December 2018, and collapse of the volcano resulted in Tsunami. The large tidal waves caused mass destruction and loss of life in the Java and Sumatra islands. The objective of this study was the interferometric SAR coherence and backscatter images based analysis of Anak Krakatau Island using Sentinel-1 SAR data. Seven datasets of ESA’s Sentinel-1 C-band satellite acquired from 25 November 2018 to 24 January 2019 were used in this study. The InSAR RGB composite images were generated by stacking together the interferometric coherence magnitude images and the sigma nought backscatter images. Sentinel-2 true color composite (TCC) images before and after the volcanic eruption were used to verify the results obtained through InSAR coherence analysis. The sigma nought backscatter image of 22 December 2018 clearly indicates the volcano eruption center and the ocean waves moving away from Anak Krakatau due to the seismic shock waves caused by the volcano eruption. The combined interpretation of the results revealed that the severe volcanic eruption on 22 December 2018 caused a large portion of the volcano to collapse, and all the rock debris which submerged to the ocean displaced the ocean water and resulted in the Tsunami at the Indonesian islands.
1. Introduction
Synthetic Aperture Radar (SAR) interferometric coherence and backscatter images are very good candidates for understanding the surface deformations [1,2]. Since microwave radiation can penetrate the thick volcanic ash and clouds, SAR can be used to get near-real-time information about the volcanic activities with the help of the available spaceborne SAR platforms.
The Anak Krakatau volcano island, “known as the child of the Krakatau”, formed over several years after the explosive eruption of the Krakatau Volcano in 1883 [3]. This volcano island is situated in the Sunda Strait between the Java and Sumatra Islands of Indonesia [4]. Anak Krakatau is at the edge of the Indian-Australian and Eurasian tectonic plates, which is normally a zone of high seismic and volcanic activity [5]. The volcano has been active since 1927 and has continued to grow to an elevation of about 300 meters [6]. Anak Krakatau erupted on 22 December 2018, and a resulting tsunami occurred in the Java and Sumatra Islands which killed hundreds of people [7].
The datasets acquired by ESA’s C-band Sentinel-1 SAR platform and Sentinel-2 optical platform were used in this study to analyze the temporal surface changes to Anak Krakatau Island due to the volcanic episode of December 2018.
2. Datasets and Method
2.1. Datasets
Six Sentinel-1 datasets acquired from 25 November 2018 to 24 January 2019 were used for this study. The details of the datasets are shown in Table 1. The datasets were acquired in the interferometric wide (IW) mode, where the entire dataset is acquired as three different sub-swaths in TOPSAR mode and each sub-swath is divided into a number of bursts to ensure uniform signal-to-noise ratio (SNR) [8].

Table 1.
Metadata of the Sentinel-1A datasets used.
The Sentinel-2 optical datasets from 16 November 2018 to 02 February 2019 were used to verify the results obtained from the Sentinel-1 data analysis, and the details of the datasets are presented in Table 2.

Table 2.
Metadata of the Sentinel-2 datasets used.
The red band (band 4), green band (band 3), and blue band (band 2) of the Sentinel-2 datasets were used in this study to generate the true color composite (TCC) images.
2.2. Methodology
The InSAR coherence and backscatter images were generated using the methodology shown in Figure 1 [1,9]. For generating the interferometric coherence magnitude image, the Sentinel-1 dataset acquired on 25 November 2018 was selected as the master image and five interferometric coherence magnitude images were generated with respect to the other five slave images. Radiometrically calibrated sigma nought images of all six datasets were generated. RGB composite images were generated using the interferometric coherence magnitude images, and the two corresponding sigma nought images which were used to generate the coherence image. InSAR RGB composites can provide better visualization for analyzing and interpreting the results.The sigma nought images and the interferometric coherence magnitude images were in a linear scale of 0 to 1, so they could be combined together to form an RGB stack. The sigma nought images were radiometrically calibrated images free of system-induced radiometric errors, so they could be used for quantitative analysis. For generating the RGB composite images, the interferometric coherence magnitude image was used as the red band, the later date sigma nought image was used as the green band, and the earlier date sigma nought image was used as the blue band.
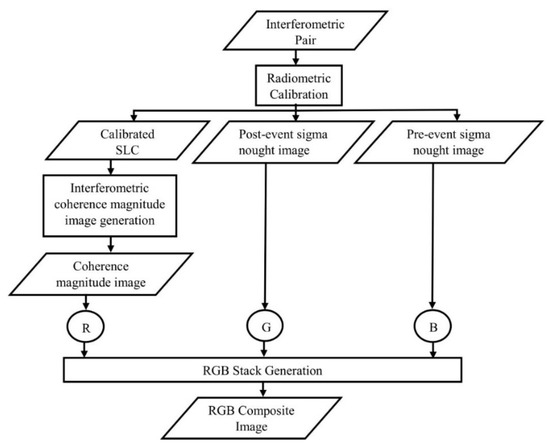
Figure 1.
Methodology flowchart.
3. Results
The InSAR RGB composite images and backscatter images were generated per the methodology described in the previous section, and the results are discussed in this section.
Figure 2a shows that smoke was coming out from the volcano caldera, clearly indicating that the volcano was highly active and there was a chance for a volcanic eruption. Figure 2b,c shows the sigma nought backscatter images of 25 November 2018 and 7 December 2018, by comparing both images with the Sentinel-2 TCC image in Figure 2a it can be understood that all three images match each other in the shape and appearance of the volcano island, so there was no considerable volcanic activity during this time period.
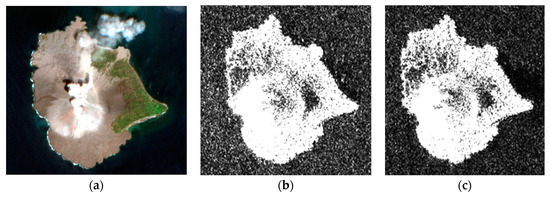
Figure 2.
Comparison of Sentinel-2 and Sentinel-1 images: (a) Sentinel-2A TCC of 16 November 2018; (b) Sigma nought image of 25 November 2018; (c) Sigma nought image of 7 November 2018.
Figure 3a shows the sigma nought backscatter image for 19 December 2018. By comparing the image with the sigma nought images of 7 December 2018 (Figure 2c) and 25 November 2018 (Figure 2b) it can be seen that there was no visible change, which indicates the absence of any considerable volcanic activity. Figure 3b shows the InSAR RGB composite generated with the datasets of 19 November 2018 and 25 December 2018. The image was generated by stacking the coherence magnitude image as the red band, the sigma nought image of 19 December 2018 as the green band, and the sigma nought image of 25 November 2018 as the blue band. By comparing Figure 3b with Figure 2a it can be seen that the vegetation present at the right side of the island appeared cyan in color. This is because the presence of vegetation caused a loss of coherence between the interferometric pairs; low values close to zero in the red band and similar values in the sigma nought images in the green and blue bands due to the absence of change in the area caused the vegetation to appear in cyan color. The red regions are the barren lands without any vegetation and were free from any surface changes, having good coherence between the interferometric pairs. The area surrounding the caldera of the volcano also appeared in cyan, which may be due to the continuous volcanic activity happening at the caldera. Since only red and cyan colors are present in the InSAR RGB composite image, it can be understood that no surface deformations occurred on the island during this time period.
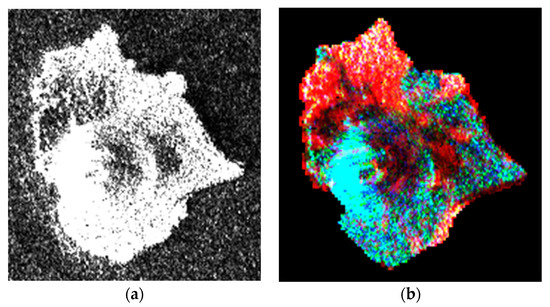
Figure 3.
(a) Sigma nought image of 7 December 2018; (b) InSAR RGB composite with coherence image of 7 December 2018 with respect to 25 November 2018 in the red band, sigma nought image of 7 December 2018 in the green band, and sigma nought image of 25 November 2018 in the blue band.
Figure 4a shows the InSAR RGB composite image generated with the datasets of 31 December 2018 and 25 December 2018. The image was generated by stacking the coherence magnitude image as the red band, the sigma nought image of 31 December 2018 as the green band, and the sigma nought image of 25 November 2018 as the blue band. Figure 4b shows the Sentinel-2 true color composite image acquired on 29 December 2018. By comparing Figure 4a with Figure 3b it can be clearly understood that after the volcano eruption on 22 December 2018 there was significant deformation of the volcano surface, indicated by the loss of cyan and red color in Figure 4a. The green-colored regions in Figure 4a indicate the new surface which is present in the image of 31 December 2018 and absent in the 25 November 2018 image. Similarly, the blue-colored regions indicate the areas which were present on 25 November 2018 and disappeared on 31 December 2018. By comparing Figure 2a, Figure 4a, and Figure 4b, it can be seen that the south-west portion of the volcano had collapsed due to the volcano eruption and the portion was filled with water from the ocean. From Figure 4a,b, it can be understood that the magenta- and blue-colored regions in Figure 4a indicate the areas lost after the volcano eruption.
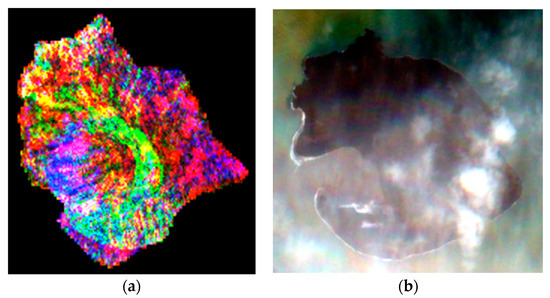
Figure 4.
(a) InSAR RGB composite with coherence image of 31 December 2018 with respect to 25 November 2018 in the red band, the sigma nought image of 31 December 2018 in the green band, and the sigma nought image of 25 November 2018 in the blue band; (b) Sentinel-2 true color composite (TCC) of 29 December 2018.
Figure 5a shows the RGB composite generated using the datasets acquired on 12 January 2019 and 25 November 2018. As in the previous RGB composites, the red band represents the coherence image generated between the datasets, the green band represents the sigma nought image of 12 January 2019, and the blue band represents the sigma nought image of 25 November 2018. By comparing Figure 5a with Figure 4a it can be found that there is no considerable change between the images, indicating that volcanic activity had ceased. Figure 5b shows the Sentinel-2 TCC image acquired on 13 January 2019. By comparing Figure 5b with Figure 4b it is clear that that land mass had formed at the water-inundated area at the south-west side of the volcano island, isolating the volcano summit from the ocean water.
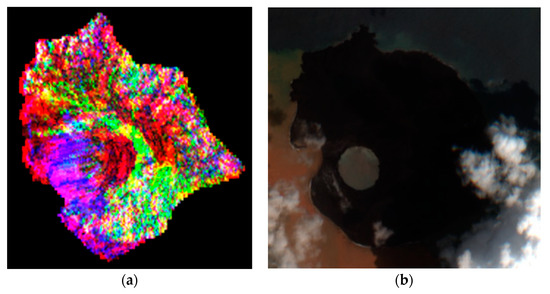
Figure 5.
(a) InSAR RGB composite with coherence image of 12 January 2019 with respect to 25 November 2018 in the red band, the sigma nought image of 12 January 2019 in the green band, and the sigma nought image of 25 November 2018 in the blue band; (b) Sentinel-2 TCC of 13 January 2019.
Figure 6a shows the InSAR RGB composite generated using the datasets acquired on 24 January 2019 and 25 November 2018. By comparing it with Figure 5a, it can be observed that there is no change between the images, indicating the complete ceasing of volcanic activity. The Sentinel-2 TCC image acquired on 2 February 2019 is shown in Figure 6b, and it is exactly similar to Figure 5b, which validates the ceasing of the volcanic activity indicated by the InSAR RGB composite images.
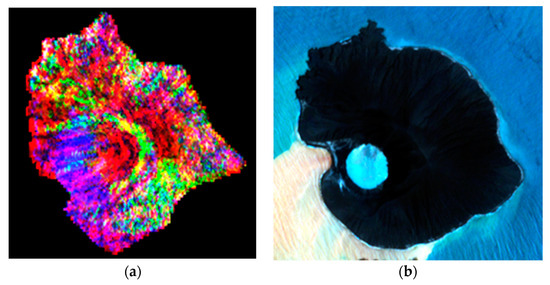
Figure 6.
(a) InSAR RGB composite with coherence image of 24th January 2019 with respect to 25th November 2018 in Red band, Sigma nought image of 24th January 2019 in the Green band and Sigma nought image of 25th November 2018 in the Blue band, (b) Sentinel-2 TCC of 2nd February 2019.
Figure 7 shows the Sentinel-1 backscatter image acquired on 22 December 2018, which is the same day on which the volcano erupted. By analyzing the image it can be observed that in the ocean water, ripples were moving away from the volcano island, indicating the spread of the seismic shock of the volcano eruption moving away from the island. This also indicates the movement of the ocean water towards Java and Sumatra islands away from the volcano island caused by the collapse of the volcano wall.
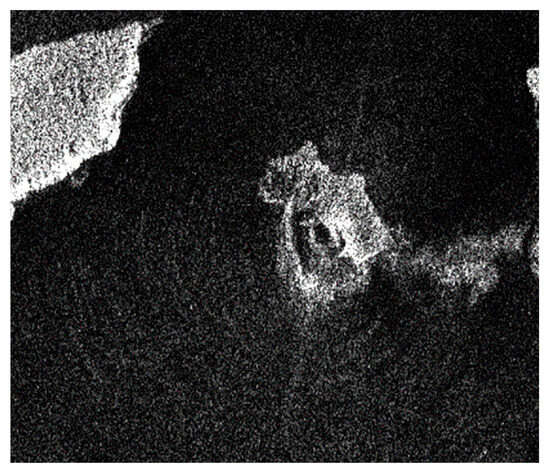
Figure 7.
Sentinel-1 backscatter image acquired on 22 December 2018 showing water ripples moving away from the volcano.
Figure 8 shows the Sentinel-2 TCC image acquired on 2 February 2019 with the outline of the shape of the volcano before the eruption overlaid on top of it. By observing the outline and the Sentinel-2 image, it can be seen that there was a considerable change to the shape and size of the volcano island after the eruption. Before the eruption, the volcano had an area of 2.81 km2, and after the eruption, the volcano area increased to 3.25 km2 due to lava deposition.
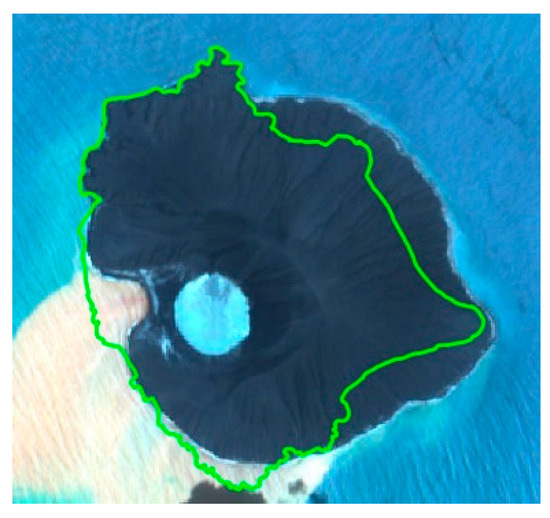
Figure 8.
Outline of the old shape of the volcano before 22 December 2018 overlaid on top of the Sentinel-2 TCC of 2 February 2019.
4. Conclusions
From this study, it is understood that InSAR coherence and SAR backscatter images along with high-resolution optical images are capable of monitoring the surface deformations caused due to volcano eruption. It was found that the eruption on 22 December 2018 caused the south-west portion of Anak Krakatau Island to collapse into the ocean water, which caused tsunami on the Java and Sumatra islands of Indonesia. Even though there was a collapse of the volcano wall, the island’s area increased by 0.44 km2. The temporal SAR and optical images of January and February indicate that volcanic activity had ceased.
Conflicts of Interest
The authors declare no conflict of interest.
References
- Babu, A.; Kumar, S. SBAS interferometric analysis for volcanic eruption of Hawaii island. J. Volcanol. Geotherm. Res. 2019, 370, 31–50. [Google Scholar] [CrossRef]
- Catherine, B.; Andre, O. The use of sar interferometric coherence images to study sandy desertification in southeast niger: Preliminary results. Envisat Symp. 2007 2007, 2007, 1–5. [Google Scholar]
- Giachetti, T.; Paris, R.; Kelfoun, K.; Ontowirjo, B. Tsunami hazard related to a flank collapse of Anak Krakatau Volcano, Sunda Strait, Indonesia. Geol. Soc. Lond. Spec. Publ. 2012, 361, 79–90. [Google Scholar] [CrossRef]
- Volcano Discovery. Krakatoa Volcano. Available online: https://www.volcanodiscovery.com/krakatau.html (accessed on 19 May 2019).
- Abdurrachman, M.; Widiyantoro, S.; Priadi, B.; Ismail, T. Geochemistry and Structure of Krakatoa Volcano in the Sunda Strait, Indonesia. Geosciences 2018, 8, 111. [Google Scholar] [CrossRef]
- Deanna Conners. Nak Krakatau Volcano Eruption from Space|Earth|EarthSky. Available online: https://earthsky.org/earth/view-from-space-anak-krakatau-volcano-eruption (accessed on 19 May 2019).
- Suyin Haynes. Tsunami Caused by Volcanic Eruption Kills 429 in Indonesia|Time. Available online: http://time.com/5487825/indonesia-krakatoa-volcano-tsunami-sunda-strait/ (accessed on 19 May 2019).
- Yague-martinez, N.; Prats-iraola, P.; Member, S.; Gonzalez, F.R.; Brcic, R.; Shau, R.; Member, S.; Geudtner, D.; Eineder, M.; Member, S.; Bamler, R. Interferometric Processing of Sentinel-1 TOPS Data. IEEE Trans. Geosci. Remote Sens. 2016, 54, 2220–2234. [Google Scholar] [CrossRef]
- S, D.D.A.; Kumar, S.; Babu, A.; Thakur, P.K. Coherence and Polarimetric Parameters based Characterization of Flooded Area—Case Study of a Natural World Heritage Site Kaziranga National Park. ISPRS Ann. 2018, 5, 265–272. [Google Scholar]
Publisher’s Note: MDPI stays neutral with regard to jurisdictional claims in published maps and institutional affiliations. |
© 2019 by the authors. Licensee MDPI, Basel, Switzerland. This article is an open access article distributed under the terms and conditions of the Creative Commons Attribution (CC BY) license (https://creativecommons.org/licenses/by/4.0/).