Natural Time Analysis: Results Related to Two Earthquakes in Greece during 2019 †


Abstract
:1. Introduction
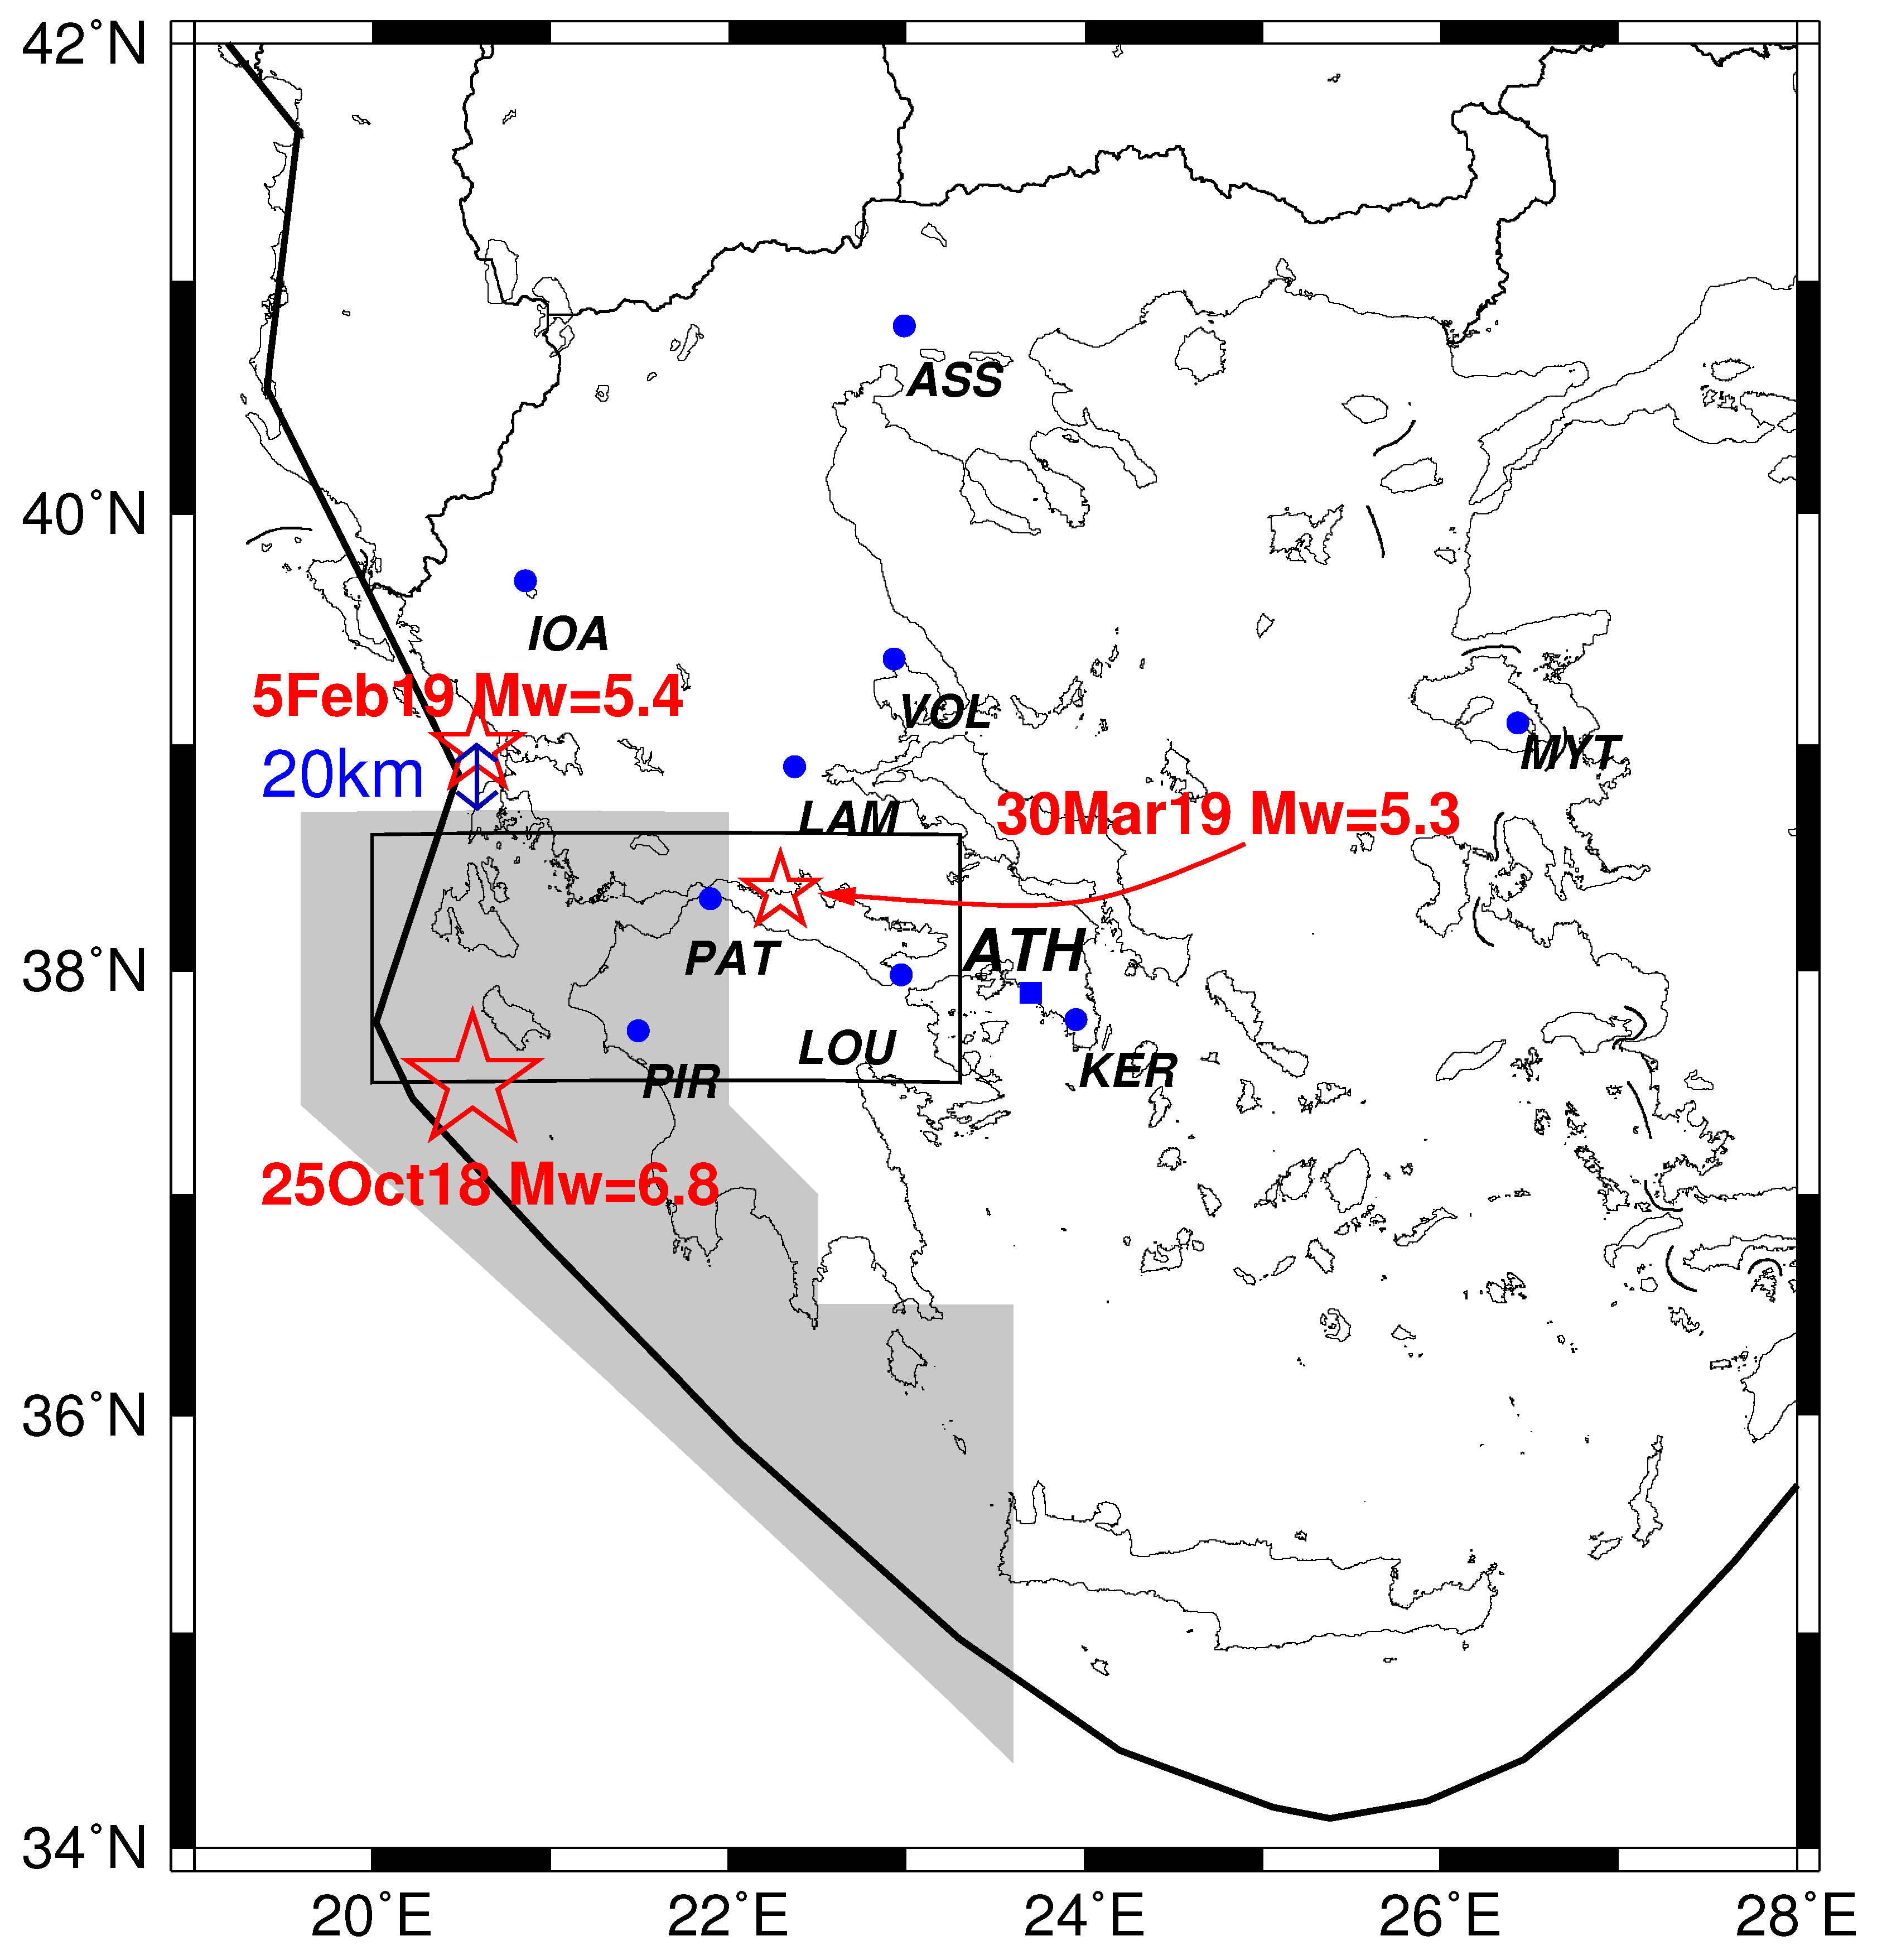
2. Results
3. Discussion
4. Materials and Methods
4.1. Natural Time Analysis (NTA)
5. Conclusions
Author Contributions
Funding
Acknowledgments
Conflicts of Interest
Abbreviations
| ATH | Athens |
| EQ | Earthquake |
| ML(ATH) | Local EQ magnitude reported by the Institute of Geodynamics of the National Observatory of Athens |
| Mw | Moment magnitude |
| NTA | Natural time analysis |
| PAT | Patras SES measuring station |
| PIR | Pirgos SES measuring station |
| SES | Seismic Electric Signals |
| VAN | Varotsos Alexopoulos Nomikos |
References
- United States Geological Survey, Earthquake Hazards Program.M6.8-33km SW of Mouzaki, Greece. Available online: https://earthquake.usgs.gov/earthquakes/eventpage/us1000hhb1/technical (accessed on 10 May 2019).
- Sarlis, N.V.; Skordas, E.S. Study in Natural Time of Geoelectric Field and Seismicity Changes Preceding the Mw6.8 Earthquake on 25 October 2018 in Greece. Entropy 2018, 20, 882. [Google Scholar] [CrossRef] [PubMed]
- Varotsos, P. The Physics of Seismic Electric Signals; TERRAPUB: Tokyo, Japan, 2005. [Google Scholar]
- Varotsos, P.A.; Sarlis, N.V.; Skordas, E.S. Natural Time Analysis: The New View of Time. Precursory Seismic Electric Signals, Earthquakes and Other Complex Time-Series; Springer: Berlin Heidelberg, Germany, 2011. [Google Scholar] [CrossRef]
- Sarlis, N.V. Entropy in Natural Time and the Associated Complexity Measures. Entropy 2017, 19. [Google Scholar] [CrossRef]
- Varotsos, P.; Lazaridou, M. Latest aspects of earthquake prediction in Greece based on Seismic Electric Signals. Tectonophysics 1991, 188, 321–347. [Google Scholar] [CrossRef]
- Varotsos, P.; Alexopoulos, K.; Lazaridou, M. Latest aspects of earthquake prediction in Greece based on Seismic Electric Signals, II. Tectonophysics 1993, 224, 1–37. [Google Scholar] [CrossRef]
- Sarlis, N.V. Statistical Significance of Earth’s Electric and Magnetic Field Variations Preceding Earthquakes in Greece and Japan Revisited. Entropy 2018, 20, 561. [Google Scholar] [CrossRef]
- Rundle, J.B.; Turcotte, D.L.; Donnellan, A.; Grant Ludwig, L.; Luginbuhl, M.; Gong, G. Nowcasting earthquakes. Earth Space Sci. 2016, 3, 480–486. [Google Scholar] [CrossRef]
- Rundle, J.B.; Luginbuhl, M.; Giguere, A.; Turcotte, D.L. Natural Time, Nowcasting and the Physics of Earthquakes: Estimation of Seismic Risk to Global Megacities. Pure Appl. Geophys. 2018, 175, 647–660. [Google Scholar] [CrossRef]
- Luginbuhl, M.; Rundle, J.B.; Hawkins, A.; Turcotte, D.L. Nowcasting Earthquakes: A Comparison of Induced Earthquakes in Oklahoma and at the Geysers, California. Pure Appl. Geophys. 2018, 175, 49–65. [Google Scholar] [CrossRef]
- Luginbuhl, M.; Rundle, J.B.; Turcotte, D.L. Natural Time and Nowcasting Earthquakes: Are Large Global Earthquakes Temporally Clustered? Pure Appl. Geophys. 2018, 175, 661–670. [Google Scholar] [CrossRef]
- Rundle, J.B.; Giguere, A.; Turcotte, D.L.; Crutchfield, J.P.; Donnellan, A. Global Seismic Nowcasting With Shannon Information Entropy. Earth Space Sci. 2019, 6, 191–197. [Google Scholar] [CrossRef]
- Sarlis, N.V.; Skordas, E.S.; Varotsos, P.A.; Geoelectric Field and Seismicity Changes Preceding the 2018 Mw6.8 Earthquake and the Subsequent Activity in Greece, 20 January 2019. arXiv:1901.06658v1 [physics.geo-ph]. Available online: https://arxiv.org/abs/1901.06658v1 (accessed on 20 January 2019).
- European Mediterranean Seismological Center. M5.4-GREECE- 2019-02-05 02:26:09 UTC. Available online: https://www.emsc-csem.org/Earthquake/earthquake.php?id=742939 (accessed on 10 May 2019).
- European Mediterranean Seismological Center. M5.3-GREECE-2019-03-30 10:46:18 UTC. Available online: https://www.emsc-csem.org/Earthquake/earthquake.php?id=754693 (accessed on 10 May 2019).
- Uyeda, S.; Al-Damegh, E.; Dologlou, E.; Nagao, T. Some relationship between VAN seismic electric signals (SES) and earthquake parameters. Tectonophysics 1999, 304, 41–55. [Google Scholar] [CrossRef]
- Sarlis, N.V.; Skordas, E.S.; Lazaridou, M.S.; Varotsos, P.A. Investigation of seismicity after the initiation of a Seismic Electric Signal activity until the main shock. Proc. Jpn. Acad. Ser. B Phys. Biol. Sci. 2008, 84, 331–343. [Google Scholar] [CrossRef]
- Varotsos, P.; Alexopoulos, K. Physical Properties of the variations of the electric field of the Earth preceding earthquakes, I. Tectonophysics 1984, 110, 73–98. [Google Scholar] [CrossRef]
- Varotsos, P.; Alexopoulos, K. Physical Properties of the variations of the electric field of the Earth preceding earthquakes, II. Tectonophysics 1984, 110, 99–125. [Google Scholar] [CrossRef]
- Lazaridou-Varotsos, M.S. Earthquake Prediction by Seismic Electric Signals. The success of the VAN Method over thirty years; Springer: Berlin Heidelberg, 2013. [Google Scholar]
- Varotsos, P.; Alexopoulos, K. Thermodynamics of Point Defects and Their Relation with Bulk Properties; North Holland: Amsterdam, The Netherlands, 1986. [Google Scholar]
- Varotsos, P. Point defect parameters in β-PbF2 revisited. Solid State Ionics 2008, 179, 438–441. [Google Scholar] [CrossRef]
- Varotsos, P.A.; Sarlis, N.V.; Skordas, E.S. Phenomena preceding major earthquakes interconnected through a physical model. Ann. Geophys. 2019, 37, 315–324. [Google Scholar] [CrossRef]
- Sarlis, N.; Lazaridou, M.; Kapiris, P.; Varotsos, P. Numerical Model of the Selectivity Effect and ΔV/L criterion. Geophys. Res. Lett. 1999, 26, 3245–3248. [Google Scholar] [CrossRef]
- Huang, Q.; Ikeya, M. Seismic electromagnetic signals (SEMS) explained by a simulation experiment using electromagnetic waves. Phys. Earth Planet. Inter. 1998, 109, 107–114. [Google Scholar] [CrossRef]
- Varotsos, P.; Sarlis, N.; Lazaridou, M.; Kapiris, P. Transmission of stress induced electric signals in dielectric media. J. Appl. Phys. 1998, 83, 60–70. [Google Scholar] [CrossRef]
- Varotsos, P.; Sarlis, N.; Lazaridou, M. Transmission of stress induced electric signals in dielectric media. Part II. Acta Geophys. Pol. 2000, 48, 141–177. [Google Scholar]
- Varotsos, P.; Sarlis, N.; Skordas, E. Transmission of stress induced electric signals in dielectric media. Part III. Acta Geophys. Pol. 2000, 48, 263–297. [Google Scholar]
- Huang, Q. Controlled analogue experiments on propagation of seismic electromagnetic signals. Chin. Sci. Bull. 2005, 50, 1956–1961. [Google Scholar] [CrossRef]
- Huang, Q.; Lin, Y. Selectivity of seismic electric signal (SES) of the 2000 Izu earthquake swarm: a 3D FEM numerical simulation model. Proc. Jpn Acad. Ser. B Phys. Biol. Sci. 2010, 86, 257–264. [Google Scholar] [CrossRef] [PubMed]
- Varotsos, P.; Alexopoulos, K.; Nomicos, K. Seismic Electric Currents. Pract. Athens Acad. 1981, 56, 277–286. [Google Scholar]
- Varotsos, P.; Alexopoulos, K.; Nomicos, K. Seven-hour precursors to earthqaukes determined from telluric currents. Pract. Athens Acad. 1981, 56, 417–433. [Google Scholar]
- Varotsos, P.A.; Sarlis, N.V.; Skordas, E.S. Detrended fluctuation analysis of the magnetic and electric field variations that precede rupture. Chaos 2009, 19, 023114. [Google Scholar] [CrossRef]
- Sarlis, N.V.; Skordas, E.S.; Varotsos, P.A. GEOELECTRIC Field and Seismicity Changes Preceding the 2018 Mw6.8 Earthquake and the Subsequent Activity in Greece, 17 April 2019. arXiv:1901.06658v2 [physics.geo-ph]. Available online: https://arxiv.org/abs/1901.06658v2 (accessed on 17 April 2019).
- Varotsos, P.A.; Sarlis, N.V.; Skordas, E.S.; Uyeda, S.; Kamogawa, M. Natural time analysis of critical phenomena. The case of Seismicity. EPL 2010, 92, 29002. [Google Scholar] [CrossRef]
- Uyeda, S.; Kamogawa, M.; Tanaka, H. Analysis of electrical activity and seismicity in the natural time domain for the volcanic-seismic swarm activity in 2000 in the Izu Island region, Japan. J. Geophys. Res. 2009, 114. [Google Scholar] [CrossRef]
- Varotsos, P.A.; Sarlis, N.V.; Skordas, E.S.; Christopoulos, S.R.G.; Lazaridou-Varotsos, M.S. Identifying the occurrence time of an impending mainshock: A very recent case. Earthq. Sci. 2015, 28, 215–222. [Google Scholar] [CrossRef]
- Varotsos, P.A.; Sarlis, N.V.; Skordas, E.S. Identifying the occurrence time of an impending major earthquake: a review. Earthq. Sci. 2017, 30, 209–218. [Google Scholar] [CrossRef]
- Varotsos, P.A.; Sarlis, N.V.; Skordas, E.S. Spatio-Temporal complexity aspects on the interrelation between Seismic Electric Signals and Seismicity. Pract. Athens Acad. 2001, 76, 294–321. [Google Scholar]
- Varotsos, P.A.; Sarlis, N.V.; Skordas, E.S. Long-range correlations in the electric signals that precede rupture. Phys. Rev. E 2002, 66, 011902. [Google Scholar] [CrossRef]
- Varotsos, P.A.; Sarlis, N.V.; Skordas, E.S. Seismic Electric Signals and Seismicity: On a tentative interrelation between their spectral content. Acta Geophys. Pol. 2002, 50, 337–354. [Google Scholar]
- Tanaka, H.K.; Varotsos, P.A.; Sarlis, N.V.; Skordas, E.S. A plausible universal behaviour of earthquakes in the natural time-domain. Proc. Jpn. Acad. Ser. B Phys. Biol. Sci. 2004, 80, 283–289. [Google Scholar] [CrossRef]
- Varotsos, P.; Sarlis, N.; Skordas, E. On the Motivation and Foundation of Natural Time Analysis: Useful Remarks. Acta Geophys. 2016, 64, 841–852. [Google Scholar] [CrossRef]
- Varotsos, P.A.; Sarlis, N.V.; Skordas, E.S. Long-range correlations in the electric signals the precede rupture: Further investigations. Phys. Rev. E 2003, 67, 021109. [Google Scholar] [CrossRef]
- Varotsos, P.A.; Sarlis, N.V.; Skordas, E.S. Attempt to distinguish electric signals of a dichotomous nature. Phys. Rev. E 2003, 68, 031106. [Google Scholar] [CrossRef]
- Varotsos, P.; Sarlis, N.V.; Skordas, E.S.; Uyeda, S.; Kamogawa, M. Natural time analysis of critical phenomena. Proc. Natl. Acad. Sci. USA 2011, 108, 11361–11364. [Google Scholar] [CrossRef]
- Varotsos, P.A.; Sarlis, N.V.; Skordas, E.S.; Lazaridou, M.S. Entropy in Natural Time Domain. Phys. Rev. E 2004, 70, 011106. [Google Scholar] [CrossRef]
- Varotsos, P.A.; Sarlis, N.V.; Tanaka, H.K.; Skordas, E.S. Some properties of the entropy in the natural time. Phys. Rev. E 2005, 71, 032102. [Google Scholar] [CrossRef]
- Lesche, B. Instabilities of Renyi entropies. J. Stat. Phys. 1982, 27, 419. [Google Scholar] [CrossRef]
- Lesche, B. Renyi entropies and observables. Phys. Rev. E 2004, 70, 017102. [Google Scholar] [CrossRef] [PubMed]
Publisher’s Note: MDPI stays neutral with regard to jurisdictional claims in published maps and institutional affiliations. |
© 2019 by the authors. Licensee MDPI, Basel, Switzerland. This article is an open access article distributed under the terms and conditions of the Creative Commons Attribution (CC BY) license (https://creativecommons.org/licenses/by/4.0/).
Share and Cite
Sarlis, N.V.; Skordas, E.S.; Varotsos, P.A. Natural Time Analysis: Results Related to Two Earthquakes in Greece during 2019. Proceedings 2019, 24, 20. https://doi.org/10.3390/IECG2019-06194
Sarlis NV, Skordas ES, Varotsos PA. Natural Time Analysis: Results Related to Two Earthquakes in Greece during 2019. Proceedings. 2019; 24(1):20. https://doi.org/10.3390/IECG2019-06194
Chicago/Turabian StyleSarlis, Nicholas V., Efthimios S. Skordas, and Panayiotis A. Varotsos. 2019. "Natural Time Analysis: Results Related to Two Earthquakes in Greece during 2019" Proceedings 24, no. 1: 20. https://doi.org/10.3390/IECG2019-06194
APA StyleSarlis, N. V., Skordas, E. S., & Varotsos, P. A. (2019). Natural Time Analysis: Results Related to Two Earthquakes in Greece during 2019. Proceedings, 24(1), 20. https://doi.org/10.3390/IECG2019-06194