Abstract
The natural gas is broadly envisaged as a transition fuel in the energy decarbonisation. However, demand scenarios to 2050 differs largely depending on the share captured in the power generation and transport sectors. In such an uncertain context, an intertemporal spatial equilibrium model is implemented, to optimize the deployment of the future EU infrastructures over the period 2015–2050. The Iberian sub region is emphasized, so that the role of its regasification capacity and the interconnection with the rest of the EU is stated. As a result, additional investments on regasification plants are not required, provided that the EU-Iberian interconnection is properly expanded, in line with the planned project MIDCAT.
1. Introduction
In order to limit the long-run rise in the average global temperature to 2 °C above pre-industrial levels, and assuming the additional effort from the developing countries, the EU is set to cut the greenhouse gas (GHG) emissions by 80% by 2050. Gross domestic production (GDP), primary energy demand (PED) and GHG emissions, in 1990 and 2011 and projections to 2050 are shown in the Figure 1, based on the IEA ETP 2014 [1]. The main facts are the energy intensity reduction and the renewable energy sources (RES) substitution for fossil fuels. Such a transition will require promoting RES technologies, to ensure producers a cost-based payment above market prices, such as the feed-in-tariff in the power sector [2]. Meanwhile, the natural gas, as the cleanest fossil fuel with abundant and widely dispersed resources, is broadly envisaged as a transition fuel to renewable sources [3].
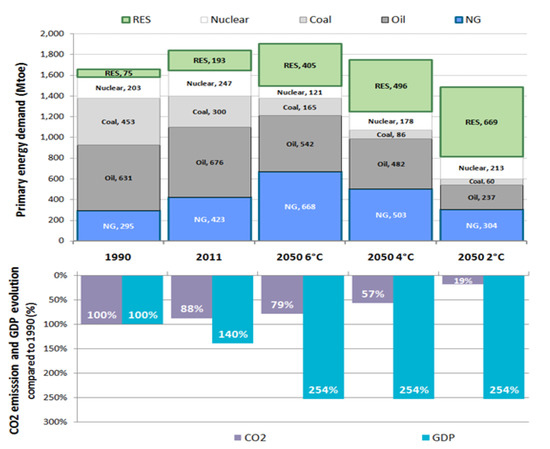
Figure 1.
EU energy related indicators (1990 2011 and ETP2014 scenarios to 2050).
The EU gas consumption has stagnated at 450–500 billion cubic meter annum (bcma) over the last decade, as a result of the economic downturn and the higher natural gas prices compared with coal in the power sector. The ETP2014 projections to 2050 ranges from 300 to 670 bcma, with the highly competitive power sector and the transport being the main drivers.
As a result of the political turmoil in the traditional pipeline partners and the depleting North Sea reserves, the EU security of supply will depend on an emerging global gas market and the effective use of the capital-intensive transport infrastructures. Thus, existing liquefied natural gas (LNG) receiving plants, 80% of their send-out capacity is currently located in the Iberian sub region, could play a key role. Transparency and non-discriminatory access to the gas transmission network is moving the EU from the oil indexed to a gas on gas competition hub-based pricing.
In such an uncertain environment, efficient investments in new facilities (entry connections and interconnections) must be targeted, while completing the internal gas market.
2. Materials and Methods
Three different approaches are distinguished, when modeling natural gas markets [4,5]: transport linear, spatial equilibrium nonlinear, and strategic behavior mixed complimentary models. A dynamic intertemporal spatial equilibrium model is used in this work, to optimize the deployment of the future transport infrastructures in a perfectly competitive market, where prices and volumes are obtained from linear supply and demand curves.
The system is approached as a network, where the nodes represent the natural gas supply chain (supply and demand regions, and transit nodes), while the arcs represent the transportation (pipelines, shipping, liquefaction and regasification). The capacity in some arcs is considered limited, and can be increased over the planning horizon 2015–2050 on a 5-yearly basis.
All major regions and the main EU pipeline and LNG entries are represented in the model, as shown in the Figure 2, with the Iberian sub region being emphasized, in order to state the role of its interconnection. LNG end-use demand is also differentiated. Furthermore, the natural gas transport chain is represented in the model: liquefaction, LNG shipping, LNG receiving plants (grouped by Iberia, Atlantic and Mediterranean), EU pipeline gateways, the Iberian interconnection, and both natural gas and LNG delivery to market.
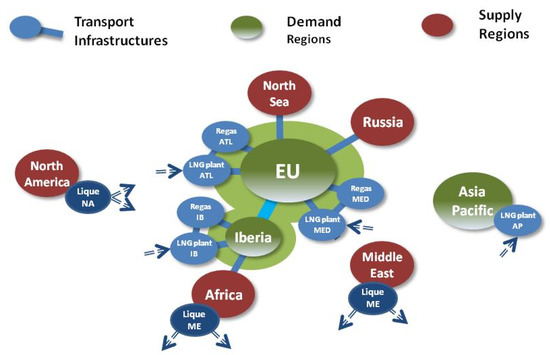
Figure 2.
Model nodes and arcs.
Linear supply and demand curves are characterized by a reference point and their corresponding price elasticities. According to the 80% cutting emission objective by the year 2050, two demand scenarios are considered (at current levels and at 300 bcma). The Iberian demand share is assumed as 9% [6], while operating (OPEX) and capital expenses (CAPEX) are based on [7,8].
In addition to the network logic and some supply restrictions, an objective function is declared in terms of net present economic welfare that maximizes the sum of consumer and producer surplus, once the transport costs are subtracted. Finally, the model is implemented into the high level modeling program GAMS [9] and solved by the nonlinear programming solver CONOPT.
3. Results
In the base case, EU LNG entries would gradually be growing to 24.9% over the period 2015–2050, mainly from Africa through the Med, and from North America through the Atlantic. Additional regasification plants are not required in the EU, as long as the Iberian interconnection is properly expanded. Higher Iberian interconnection CAPEX compared with the regasification one are offset by the corresponding lower shipping costs from the Middle East and Africa to the Iberian receiving plants, according to their geostrategic location. The northbound Iberian interconnection capacity should be expanded from the initial 5.0 bcma to 13.2 bcma in 2025.
Tables turn entirely in the low case, where the North Sea recover the prominent role at the expense of the LNG supplies. The Iberian market would be supplied by pipeline, either Northbound from Africa or Southbound through the interconnection, which should be expanded from initial 5 bcma to 9.8 bcma. The evolution every ten years of the EU gateway flows and the total LNG interregional flows over the period 2015–2050 are shown in the Table 1.

Table 1.
EU gateway flows 2015–2050—low case (in bcma).
As a result, actually planned investments are highlighted, including the expansion of the Spanish-French cross-border by 2015 from 5 to 7 bcma, and the under discussion MIDCAT project, which would increase capacity by 2020 in 8 bcma Northbound and 2.5 bcma Southbound [10].
The model accuracy is tested by comparing the model results with available real data. Firstly, interregional flows in 2015 obtained by the model are compared with the natural gas trade in 2014 (BP, 2015). Minor deviations were stated in the Middle East supplies, since some 20 bcma were actually land bridged in Spain to the higher-priced Asia Pacific market. Such an imperfect situation is caused by the fixed destination clauses. Secondly, two simulations over the period 2000–2030 are considered, assuming (1) the projections as of the year 2000 and (2) the real data 2000–2015. As a result, two investment planning are obtained, which are compared with the real investments by 2015.
- Plan 2015 (1): the reduced regasification capacity in the EU by 2000 and the lower shipping costs from Middle East and Africa resulted in expanding Iberian and Mediterranean capacity.
- Plan 2015 (2): real market conditions caused interregional trade redistribution, and moderate expansions in Atlantic (7 bcma) and Iberia (12.2 bcma) receiving plants would be expected.
- Real 2015: a regasification overcapacity has occurred, in Iberia (+66.8 bcma) and the Atlantic (+81.3 bcma).
- The following situations have been identified when comparing the three investment paths:
- Adjusted (real capacity within the planning interval), such as the Russian gateway.
- Oversized (real capacity above the planning intervals), such as the Iberian and Atlantic regasification plants.
- Undersized (real capacity below the planning interval), such as the Northbound Iberian interconnection.
Assumptions have been made, in order to reduce the complexity of the problem formulation and optimization, in terms of market framework, uncertain parameters and scalability. The model could be further improved, enhancing the scalability to a country and regasification plant level, and the time granularity, introducing the seasonal dimension and intermediate storages.
4. Conclusions
Based on a basic spatial equilibrium model, additional investments on regasification plants are not recommended in the EU, provided that the corresponding gateways are properly interconnected. Capacity expansions are proposed in the Iberian interconnection accordingly, 8.2 bcma Northbound by 2025 in a base case and 4.8 bcma Southbound by 2020 in a low case. These results are in line with real and planned investments, highlighting the expansion of 2 bcma (both ways) by 2015, and recommending an investment decision for the project MIDCAT to increase the Northbound (8 bcma) and Southbound (2.5 bcma) capacities.
- Deviations in the model results are generated throughout the modeling process:
- Framework: derived from market imperfections. However, with an increasing demand in the non-OECD countries, the market is expected to get more global and competitive.
- Parameterization: derived from uncertainty in the projections.
Formulation (political factors beyond an economic optimization): In the targeted gas single market, decision makers on infrastructure investments will be moving to a common interest approach.
Low prices and a supportive policy are the perfect context for LNG to be developed as a transport fuel, remarkably potential in the heavy duty road and maritime segments. With the entry infrastructure being covered by the existing receiving plants, the LNG distribution would require the development of a small scale supply chain (bulk break, satellite plants, bunkering, etc.). The current EU storage capacity, equivalent to 35 days, should be increased to maintain a minimum holding stock similar to the oil products (90 days).
References
- International Energy Agency. Energy Technology Perspectives; International Energy Agency: Paris, France, 2014. [Google Scholar]
- Fernandez, P.; Villacaña, E.; Xiberta, J. The deployment of electricity generation from renewable energies in Germany and Spain: A comparative analysis based on a simple model. Energy Policy 2013, 57, 552–562. [Google Scholar] [CrossRef]
- Aguilera, R.F.; Ripple, R.D.; Aguilera, R. Link between endowments, economics and environment in conventional and unconventional gas reservoirs. Fuel 2014, 126, 224–238. [Google Scholar] [CrossRef]
- Lochner, S. The Economics of Natural Gas Infrastructure Investments: Theory and Model-based Analysis for Europe. Ph.D. Thesis, Universität zu Köln, Köln, Germany, 2012. [Google Scholar]
- Holz, F. Modeling the European Natural Gas Market-Static and Dynamic Perspectives of an Oligopolistic Market. Ph.D. Thesis, Universität Berlin, Berlin, Germany, 2009. [Google Scholar]
- Supply Transformation and Consumption of Gas—Annual Data (nrg_103a); Eurostat: Luxembourg, 2010.
- Corbeau, A.; Braaksma, A.; Hussin, F.; Yagoto, Y.; Yamamoto, T. The Asian quest for LNG in a Globalising Market; International Energy Agency: Paris, France, 2014. [Google Scholar]
- International Gas Union. World LNG Report; International Gas Union: Barcelona, Spain, 2014. [Google Scholar]
- GAMS—Generic Algebraic Modelling System. User Guide. Version 24.1. Available online: http://www.gams.com (accessed on 29 June 2018).
- Madrid Declaration. Energy Interconnections Links Summit Spain-France-Portugal-European Commission-EIB; Madrid Declaration: Madrid, Spain, 4 March 2015. [Google Scholar]
Publisher’s Note: MDPI stays neutral with regard to jurisdictional claims in published maps and institutional affiliations. |
© 2018 by the authors. Licensee MDPI, Basel, Switzerland. This article is an open access article distributed under the terms and conditions of the Creative Commons Attribution (CC BY) license (https://creativecommons.org/licenses/by/4.0/).