Abstract
In this work, a procedure for the optimal design of Pumps As Turbines in Water Distribution Networks was applied, aimed at both maximizing the hydropower generation and exploiting the excess pressure. The design of the main characteristic PAT parameters, namely the flow rate and the head drop at Best Efficiency Point, the rotational speed and the impeller’s diameter was assessed, under the hypothesis of applying the Electrical Regulation. The procedure allowed to estimate both the produced power and the exploited head at any simulated time-step, as well as the overall daily energy, in compliance with the hydraulic and technical constraints of the system. The model was tested on a simplified Water Distribution Network and a preliminary Cost-Benefit analysis was performed, showing interesting reliefs against short Payback Period.
1. Introduction
The use of Pumps As Turbines (PATs) in Water Distribution Networks (WDNs) is a viable approach to both generate small-scale hydropower energy and exploit the excess pressure. They represent an alternative to micro-turbines, providing interesting efficiencies and significant working conditions, at the expense of lower investment and maintenance costs. In the literature, due to the limited information about the PAT performances provided by manufactures, several theoretical [1], experimental [2,3,4] and numerical [5,6] models were proposed to assess the PAT characteristic curves at different operations.
Nevertheless, PAT application in WDNs still results a cogent issue, because of both the variable operations of the network and the hydraulic and technical constraints from their application. Several optimization and numerical approaches were implemented, aimed at extending both the PAT operative ranges and their benefits in the system [7,8]. Nevertheless, many models require either huge computational efforts or trial-and-error or iterative procedures, sometimes reliable only if detailed information about the PAT geometry are available.
In this work the selection procedure proposed by Pugliese et al. [9] was applied to a simplified WDN, aimed at both assessing its effectiveness at varying the available head in the network and implementing a Cost-Benefit analysis to compare the energy production with the corresponding Payback Period (PP).
2. Materials and Methods
The selection procedure of centrifugal PATs in WDNs proposed by Pugliese et al. [9] allows to design the flow rate and the head drop at Best Efficiency Point (BEP) in turbine mode Qtb and Htb (the subscripts t and b refer to the turbine mode and the BEP, respectively), the impeller’ diameter D and the rotational speed N, under the hypothesis of arranging the Electrical Regulation (ER) so as to vary the PAT rotational speed N at any operation in the range [Nmin; Nmax], in compliance with the technical and hydraulic constraints of the system.
By combining the polynomial functions available in the literature to estimate the dimensionless characteristic curves of head and power [2,9], following ratio was derived, able to maximize the produced power Pt,max when the maximum discharge Qt,max flows in the network:
From a sensitivity analysis, also proved by results from literature [7], it was observed that the overall daily energy maximization was achievable by increasing the ratio in Equation (1), at increasing the ratio between the maximum flow rate in the network and the average one. Qt,max/Qtb = 1.450 was specifically set for simulations.
As a function of Qt,max/Qtb setting, from the dimensionless head characteristic curve, the head drop at BEP Htb was assessed, under the hypothesis of exploiting the whole available head Ht,av_max at Qt,max. Moreover, the PAT rotational speed N and the impeller’ diameter D were derived, setting the specific speed Nst and the specific diameter Dst equal to 29.39 and 2.52, respectively. The power maximization for flow rates different from Qt,max was also employed, by varying N accordingly.
For greater details, please refer to Pugliese et al. [9].
In this work a preliminary Cost-Benefit analysis was developed. The purchase PAT price by Novara et al. [10] was applied with reference to PATs connected to induction generators with 1 pair of magnetic poles:
The rest of project costs was set equal to 300% of the PAT and generator cost CPAT+Gen; the revenue from energy sales to the national grid was set of 210 €/MWh and the yearly maintenance costs were equal to 5% of CPAT+Gen, in agreement with Novara et al. [10].
3. Results and Discussions
The selection procedure was tested on a WDN serving 20,000 inhabitants, with average flow rate Qtm = 69.44 L/s and maximum flow rate Qt,max = 100.00 L/s. The daily demand pattern by Fontana et al. [11] was simulated, reaching the maximum flow rate Qt,max at 08:00. Two Scenarios were developed, at varying the available head Ht,av_max at Qt,max from 27.60 m in Scenario 1 to 77.60 m in Scenario 2, respectively. In both Scenarios, Qt,max/Qtb was set equal to both 0.951 and 1.450, in order to assess the power maximization at Qt,max and the daily producible energy Ed, respectively. In Table 1 the design parameters are summarized for both simulated Scenarios.

Table 1.
PAT design parameters as a function of Qt,max/Qtb ratio—Scenario 1 and Scenario 2.
In Figure 1a,c comparison between both applied approaches is plotted. In both Scenarios the Qt,max/Qtb = 0.951 setting maximized the produced power at Qt,max, whereas the overall daily energy resulted lower of about 8% than that estimated at Qt,max/Qtb = 1.450. In Figure 1b,d comparison between the available head Ht,av iand the exploited one Ht,exp iis plotted at any simulated time-step, showing the procedure ability of not exploiting greater head than the available one. For Qt values close to Qt,max the exploitation of the whole available head was also assured with significant benefits for pressure regulation and, thus, for water savings deriving from leakage reduction in the network. The Qt,max/Qtb = 1.450 setting provided better pressure regulation at any time-step, being more remarkable at lower flow rates Qt i.
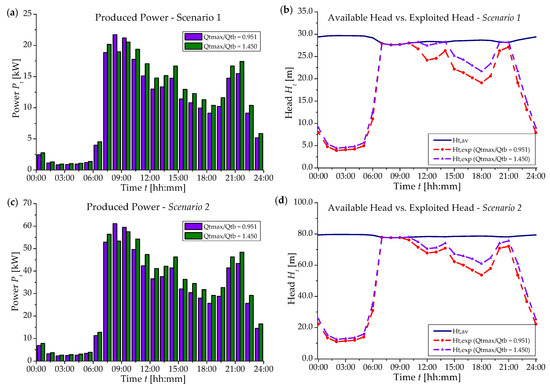
Figure 1.
Produced power Pt for (a) Scenario 1 and (c) Scenario 2 and comparison between available head Ht,av and exploit head Ht,exp for (b) Scenario 1 and (d) Scenario 2.
The Cost-Benefit analysis was employed, comparing with results of 200 centrifugal PAT models from 9 manufactures, having widely variable impeller’s diameter D (0.135 ÷ 0.550 m), flow rate at BEP in pump mode Qpb (26.5 ÷ 136.7 L/s) and head at BEP in pump mode Hpb (15.0 ÷ 142.7 m). Models from Yang et al. [12] and Novara et al. [10] were applied to both assess the flow rate and head drop ratios between turbine and pump operations and estimate the PP, respectively. Revenue from water savings deriving from the pressure regulation was neglected in this application.
In Figure 2 comparison between commercial models and designed ones is plotted. In Scenario 1 48 PAT models were rejected, being oversized with respect to the available head. Both approaches provided greater daily energy production than that from commercial PATs in both Scenarios, showing interesting PP in the order of 9.5 and 7.7 in Scenario 1 and 1.3 and 1.0 year in Scenario 2, at Qt,max/Qtb equal to 0.951 and 1.450, respectively. They were comparable with the PP of the most effective commercial PATs in Scenario 2, resulting slightly longer in Scenario 1, instead.
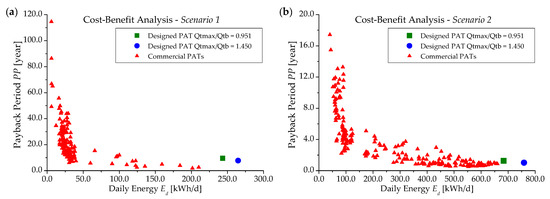
Figure 2.
Cost-Benefit analysis for (a) Scenario 1 and (b) Scenario 2.
4. Conclusions
In this work the selection procedure implemented by Pugliese et al. [9] for the optimal design of PATs in WDNs was applied to a simplified WDN, at varying the available head in the network. A preliminary Cost-Benefit analysis was employed, showing the effectiveness of the proposed approach to both perform the small-scale hydropower generation and reduce the excess pressure, against the operations of many PAT models available in the market. Interesting PP was assessed, however further reducible by assessing the revenue from water savings, neglected in this work.
References
- Stepanoff, A.J. Centrifugal and Axial Flow Pumps: Theory, Design and Application; John Wiley & Sons: New York, NY, USA, 1948. [Google Scholar]
- Derakhshan, S.; Nourbakhsh, A. Experimental study of characteristic curves of centrifugal pumps working as turbines in different specific speeds. Exp. Therm. Fluid Sci. 2008, 32, 800–807. [Google Scholar] [CrossRef]
- Pugliese, F.; De Paola, F.; Fontana, N.; Giugni, M.; Marini, G. Experimental characterization of two Pumps As Turbines for hydropower generation. Renew. Energy 2016, 99, 180–187. [Google Scholar] [CrossRef]
- Pugliese, F.; De Paola, F.; Fontana, N.; Giugni, M.; Marini, G. Performance of vertical axis Pumps As Turbines. J. Hydraul. Res. 2018, 56, 393–482. [Google Scholar] [CrossRef]
- Fernàndez, J.; Barrio, R.; Parrondo, J.; Marcos, A. Numerical investigation of a centrifugal pump running in reverse mode. Proc. Inst. Mech. Eng. 2012, 224, 373–381. [Google Scholar] [CrossRef]
- Pugliese, F.; De Paola, F.; Fontana, N.; Giugni, M.; Marini, G.; Fernàndez, J. Experimental and numerical investigation of centrifugal Pumps As Turbines. In Proceedings of the 10th International Conference Energy Efficiency Motor Driven Systems, Rome, Italy, 6–8 September 2018; pp. 790–805. [Google Scholar] [CrossRef]
- Fontana, N.; Giugni, M.; Glielmo, L.; Marini, G.; Zollo, R. Hydraulic and electric regulation of a prototype for real time control of pressure and hydropower generation in a water distribution network. J. Water Resour. Plan. Manag. 2018, 144, 04018072. [Google Scholar] [CrossRef]
- Fecarotta, O.; McNabola, A. Optimal location of Pump as Turbines (PATs) in Water Distribution Networks to recover energy and reduce leakage. Water Resour. Manag. 2017, 31, 5043–5059. [Google Scholar] [CrossRef]
- Pugliese, F.; De Paola, F.; Fontana, N.; Marini, G.; Giugni, M. Optimal selection of Pumps As Turbines in Water Distribution Networks. In Proceedings of the 3rd EWaS International Conference on “Insights on the Water-Energy-Food Nexus”, Lefkada Island, Greece, 27–30 June 2018. [Google Scholar]
- Novara, D.; McNabola, A. The development of a decision support software for the design of Micro-Hydropower schemes utilizing a Pump As Turbine. In Proceedings of the 3rd EWaS International Conference on “Insights on the Water-Energy-Food Nexus”, Lefkada Island, Greece, 27–30 June 2018. [Google Scholar]
- Fontana, N.; Giugni, M.; Portolano, D. Losses reduction and energy production in Water Distribution Networks. J. Water Resour. Plan. Manag. 2012, 138, 237–244. [Google Scholar] [CrossRef]
- Yang, S.S.; Derakhshan, S.; Kong, F.Y. Theoretical, numerical and experimental prediction of pump as turbine performance. Renew. Energy 2012, 48, 52–61. [Google Scholar] [CrossRef]
Publisher’s Note: MDPI stays neutral with regard to jurisdictional claims in published maps and institutional affiliations. |
© 2018 by the authors. Licensee MDPI, Basel, Switzerland. This article is an open access article distributed under the terms and conditions of the Creative Commons Attribution (CC BY) license (https://creativecommons.org/licenses/by/4.0/).