Modelling and Simulation of a Building Energy Hub †

Abstract
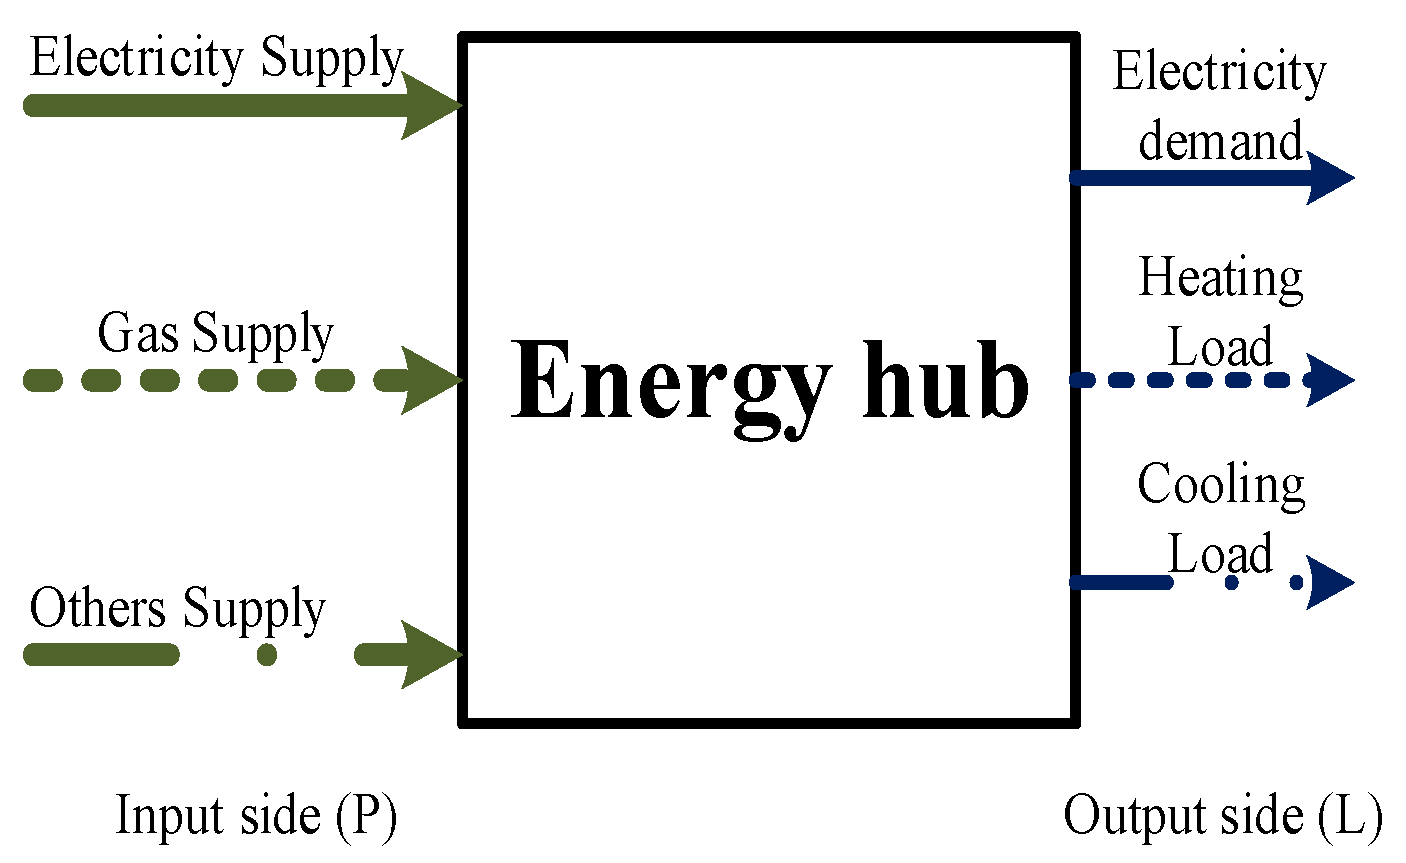
:1. Introduction
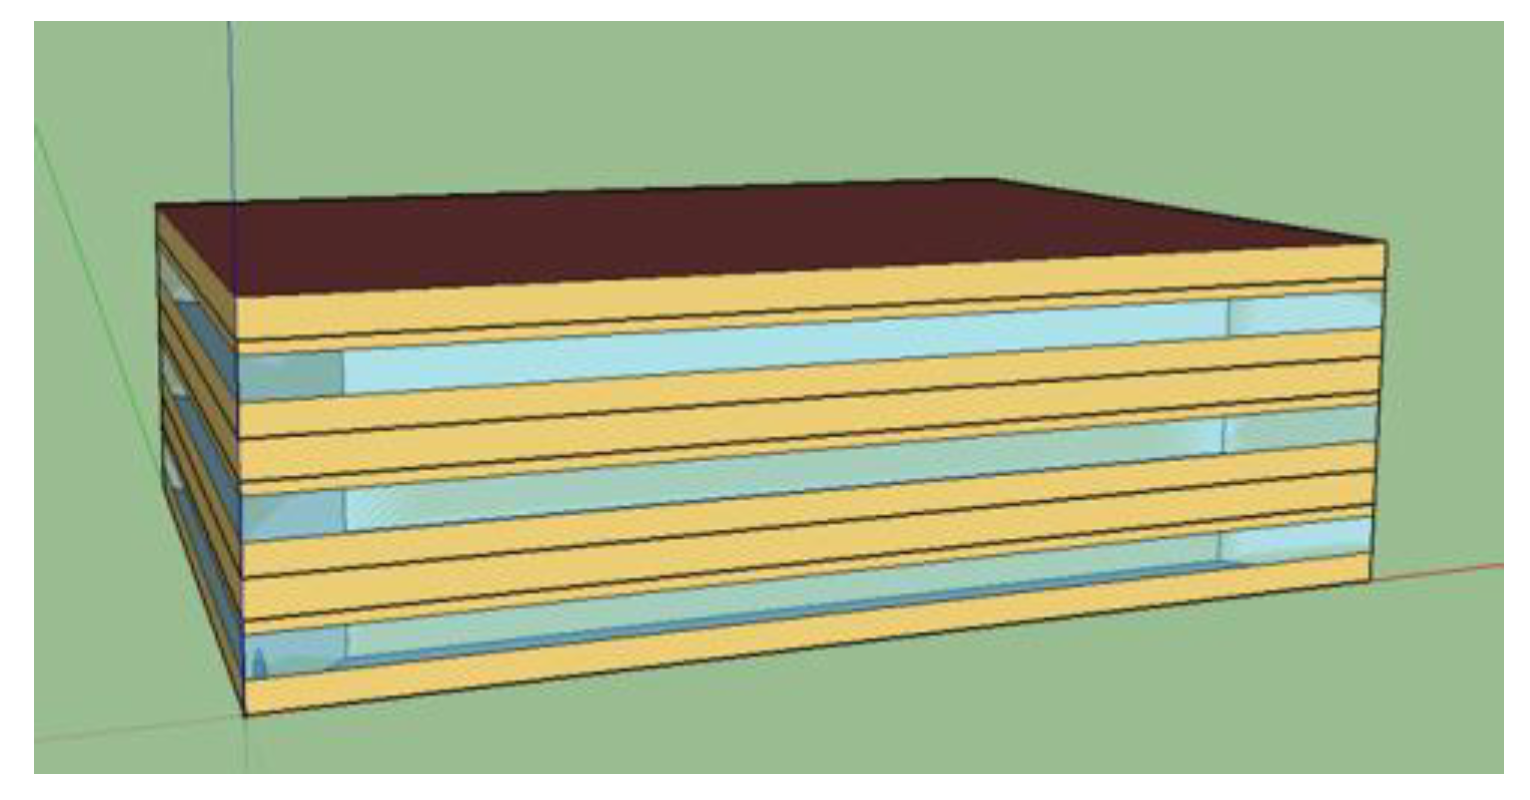
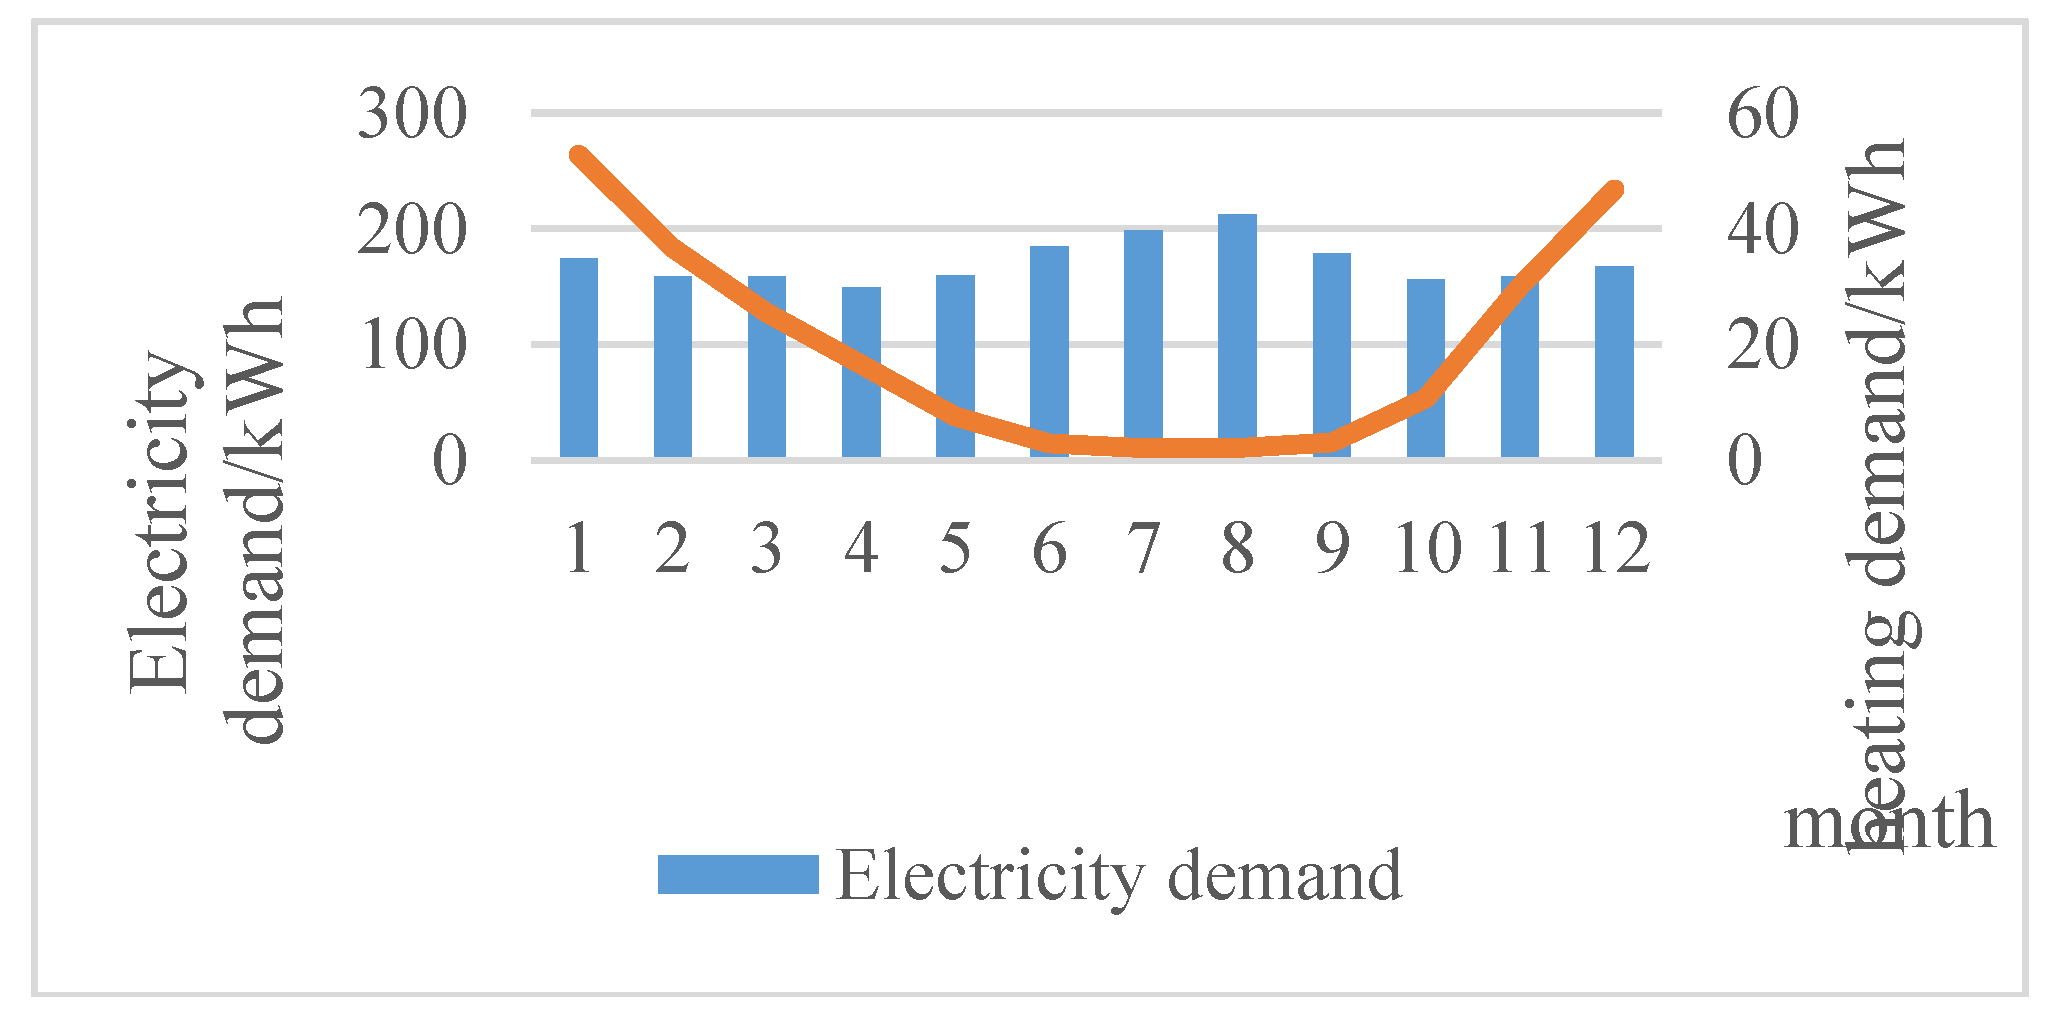
2. Case Study
3. Conclusions
References
- Favre-Perrod, P. A vision of future energy networks. In Proceeding of the Power Engineering Society Inaugural Conference and Exposition in Africa. Durban, South Africa, 11–15 July 2006; pp. 13–17. [Google Scholar]
- Setlhaolo, D.; Sichilalu, S.; Zhang, J. Residential load management in an energy hub with heat pump water heater. Appl. Energy 2017, 208, 551–560. [Google Scholar] [CrossRef]
- Sharif, A.; Almansoori, A.; Fowler, M.; Elkamel, A.; Alrafea, K. Design of an energy hub based on natural gas and renewable energy sources. Int. J. Energy Res. 2014, 38, 363–373. [Google Scholar] [CrossRef]
- Maniyali, Y.; Almansoori, A.; Fowler, M.; Elkamel, A. Energy Hub Based on Nuclear Energy and Hydrogen Energy Storage. Ind. Eng. Chem. Res. 2013, 52, 7470–7481. [Google Scholar] [CrossRef]
- Pazouki, S.; Haghifam, M.R. Optimal planning and scheduling of energy hub in presence of wind, storage and demand response under uncertainty. Int. J. Electr. Power Energy Syst. 2016, 80, 219–239. [Google Scholar] [CrossRef]
- Thanhtung, H.A.; Zhang, Y.; Thang, V.V.; Huang, J. Energy hub modeling to minimize residential energy costs considering solar energy and BESS. J. Mod. Power Syst Clean Energy 2017, 5, 389–399. [Google Scholar]
- Zhang, X.; Shahidehpour, M.; Alabdulwahab, A.; Abusorrah, A. Optimal Expansion Planning of Energy Hub with Multiple Energy Infrastructures. IEEE Trans. Smart Grid 2017, 6, 2302–2311. [Google Scholar] [CrossRef]
- Vahid-Pakdel, M.J.; Nojavan, S.; Mohammadi-Ivatloo, B.; Zare, K. Stochastic optimization of energy hub operation with consideration of thermal energy market and demand response. Energy Convers. Manag. 2017, 145, 117–128. [Google Scholar] [CrossRef]
- Ma, T.; Wu, J.; Hao, L. Energy flow modeling and optimal operation analysis of the micro energy grid based on energy hub. Energy Convers. Manag. 2017, 133, 292–306. [Google Scholar] [CrossRef]
- Sheikhi, A.; Ranjbar, A.M.; Safe, F. A novel method to determine the best size of CHP for an energy hub system. In Proceedings of the 2011 2nd International Conference on Electric Power and Energy Conversion Systems (EPECS), Sharjah, United Arab Emirates, 15–17 November 2011; pp. 1–7. [Google Scholar]
- Wang, Y.; Hou, K.; Jia, H.; Mu, Y.; Zhu, L.; Li, H.; Rao, Q. Decoupled Optimization of Integrated Energy System Considering CHP Plant Based on Energy Hub Model. Energy Procedia 2017, 142, 2683–2688. [Google Scholar] [CrossRef]
- Wang, H.; Zhang, H.; Gu, C.; Li, F. Optimal design and operation of CHPs and energy hub with multi objectives for a local energy system. Energy Procedia 2017, 142, 1615–1621. [Google Scholar] [CrossRef]


| Cost (Euro/Year) | CO2 Emission (kg/Year) | Gas Consumption (kWh/Year) | Electricity Consumption (kWh/Year) |
|---|---|---|---|
| 1.1713 × 10⁴ | 2.1711 × 10⁴ | 2.0518 × 10⁴ | 6.2589 × 10⁴ |
| Component | Efficiency | Capìtal Cost | Lifetime |
|---|---|---|---|
| Gas Boiler | 70% | 800 Euro/kW | 20 |
| Heat Pump | 3.2 (average COP) | 1000 Euro/kW | 20 |
| PV | 17%, PR = 0.8 | 1500 Euro/kW | 30 |
| PVT | variable | 700 Euro/m2 | 30 |
| Name | Value with Unit |
|---|---|
| CO2 emission from grid electricity | 0.280 kg/kWh |
| CO2 emission from natural gas | 0.204 kg/kWh |
| HP Capacity (kW) | ||||||||
|---|---|---|---|---|---|---|---|---|
| PV Capacity (m2) | 0.5 | 1 | 5 | 10 | 20 | 25 | 30 | |
| 5 | 1.1514 | 1.1378 | 1.1220 | 1.0984 | 1.0953 | 1.1005 | 1.1090 | |
| 10 | 1.1468 | 1.1333 | 1.1175 | 1.0939 | 1.0908 | 1.0960 | 1.1045 | |
| 20 | 1.1402 | 1.1266 | 1.1108 | 1.0872 | 1.0841 | 1.0893 | 1.0978 | |
| 30 | 1.1363 | 1.1226 | 1.1068 | 1.0832 | 1.0801 | 1.0853 | 1.0938 | |
| 50 | 1.1309 | 1.1173 | 1.1014 | 1.0778 | 1.0747 | 1.0799 | 1.0884 | |
| 60 | 1.1295 | 1.1158 | 1.0998 | 1.0762 | 1.0731 | 1.0783 | 1.0868 | |
| 65 | 1.1295 | 1.1157 | 1.0996 | 1.0758 | 1.0727 | 1.0778 | 1.0864 | |
| 70 | 1.1315 | 1.1175 | 1.1012 | 1.0772 | 1.0740 | 1.0792 | 1.0877 | |
| HP Capacity (kW) | ||||||||
|---|---|---|---|---|---|---|---|---|
| PV Capacity (m2) | 0.5 | 1 | 5 | 10 | 20 | 25 | 30 | |
| 5 | 2.088 | 2.054 | 2.009 | 1.923 | 1.891 | 1.865 | 1.852 | |
| 10 | 2.041 | 2.008 | 1.963 | 1.876 | 1.845 | 1.818 | 1.806 | |
| 20 | 1.952 | 1.919 | 1.874 | 1.787 | 1.756 | 1.730 | 1.717 | |
| 30 | 1.869 | 1.836 | 1.791 | 1.704 | 1.673 | 1.647 | 1.634 | |
| 50 | 1.708 | 1.674 | 1.629 | 1.542 | 1.511 | 1.485 | 1.472 | |
| 60 | 1.630 | 1.596 | 1.551 | 1.464 | 1.432 | 1.406 | 1.393 | |
| 65 | 1.554 | 1.520 | 1.475 | 1.387 | 1.356 | 1.330 | 1.317 | |
| 70 | 1.482 | 1.448 | 1.402 | 1.315 | 1.283 | 1.257 | 1.244 | |
| PV Capacity (m2) | PV/T Capacity (m2) | Global PV Area (m2) | Cost (×104 Euro/Year) | Electricity Consumption (×104 kWh/year) | CO2 Emissions (×104 kg/Year) | PVT Generation (kWh/Year) | HP Electricity Consumption (×103 kWh/Year) |
|---|---|---|---|---|---|---|---|
| 28 | 20 | 48 | 1.0573 | 5.40 | 1.60 | 118.9 | 3.45 |
| 24 | 52 | 1.0532 | 4.80 | 1.43 | 142.7 | 3.43 | |
| 30 | 58 | 1.0473 | 4.60 | 1.37 | 178.3 | 3.39 | |
| 30 | 20 | 50 | 1.0567 | 4.85 | 1.44 | 118.9 | 3.45 |
| 24 | 54 | 1.0528 | 4.72 | 1.41 | 142.7 | 3.43 | |
| 30 | 60 | 1.0471 | 4.52 | 1.35 | 178.3 | 3.39 | |
| 36 | 20 | 56 | 1.056 | 4.71 | 1.40 | 118.9 | 3.45 |
| 24 | 60 | 1.0523 | 4.58 | 1.37 | 142.7 | 3.43 | |
| 30 | 66 | 1.047 | 4.38 | 1.31 | 178.3 | 3.39 | |
| 40 | 20 | 60 | 1.0556 | 4.54 | 1.36 | 118.9 | 3.45 |
| 24 | 64 | 1.0521 | 4.41 | 1.32 | 142.7 | 3.43 | |
| 30 | 70 | 1.0475 | 4.22 | 1.27 | 178.3 | 3.39 | |
| 42 | 20 | 62 | 1.0555 | 4.49 | 1.34 | 118.9 | 3.45 |
| 24 | 66 | 1.0522 | 4.36 | 1.31 | 142.7 | 3.43 | |
| 30 | 72 | 1.0478 | 4.17 | 1.25 | 178.3 | 3.39 | |
| 48 | 20 | 68 | 1.0556 | 4.38 | 1.31 | 118.9 | 3.45 |
| 24 | 72 | 1.0526 | 4.26 | 1.28 | 142.7 | 3.43 | |
| 30 | 78 | 1.0488 | 4.07 | 1.23 | 178.3 | 3.39 |
Publisher’s Note: MDPI stays neutral with regard to jurisdictional claims in published maps and institutional affiliations. |
© 2018 by the authors. Licensee MDPI, Basel, Switzerland. This article is an open access article distributed under the terms and conditions of the Creative Commons Attribution (CC BY) license (https://creativecommons.org/licenses/by/4.0/).
Share and Cite
Bayod-Rújula, A.A.; Yuan, Y.; Martínez-Gracia, A.; Wang, J.; Uche, J.; Chen, H. Modelling and Simulation of a Building Energy Hub. Proceedings 2018, 2, 1431. https://doi.org/10.3390/proceedings2231431
Bayod-Rújula AA, Yuan Y, Martínez-Gracia A, Wang J, Uche J, Chen H. Modelling and Simulation of a Building Energy Hub. Proceedings. 2018; 2(23):1431. https://doi.org/10.3390/proceedings2231431
Chicago/Turabian StyleBayod-Rújula, Angel A., Yue Yuan, Amaya Martínez-Gracia, Jiangyu Wang, Javier Uche, and Huanxin Chen. 2018. "Modelling and Simulation of a Building Energy Hub" Proceedings 2, no. 23: 1431. https://doi.org/10.3390/proceedings2231431
APA StyleBayod-Rújula, A. A., Yuan, Y., Martínez-Gracia, A., Wang, J., Uche, J., & Chen, H. (2018). Modelling and Simulation of a Building Energy Hub. Proceedings, 2(23), 1431. https://doi.org/10.3390/proceedings2231431