
Fractional Uncertain Forecasting of the Impact of Groundwater Over-Exploitation on Temperature in the Largest Groundwater Depression Cone


Abstract
1. Introduction
2. Materials and Methodology
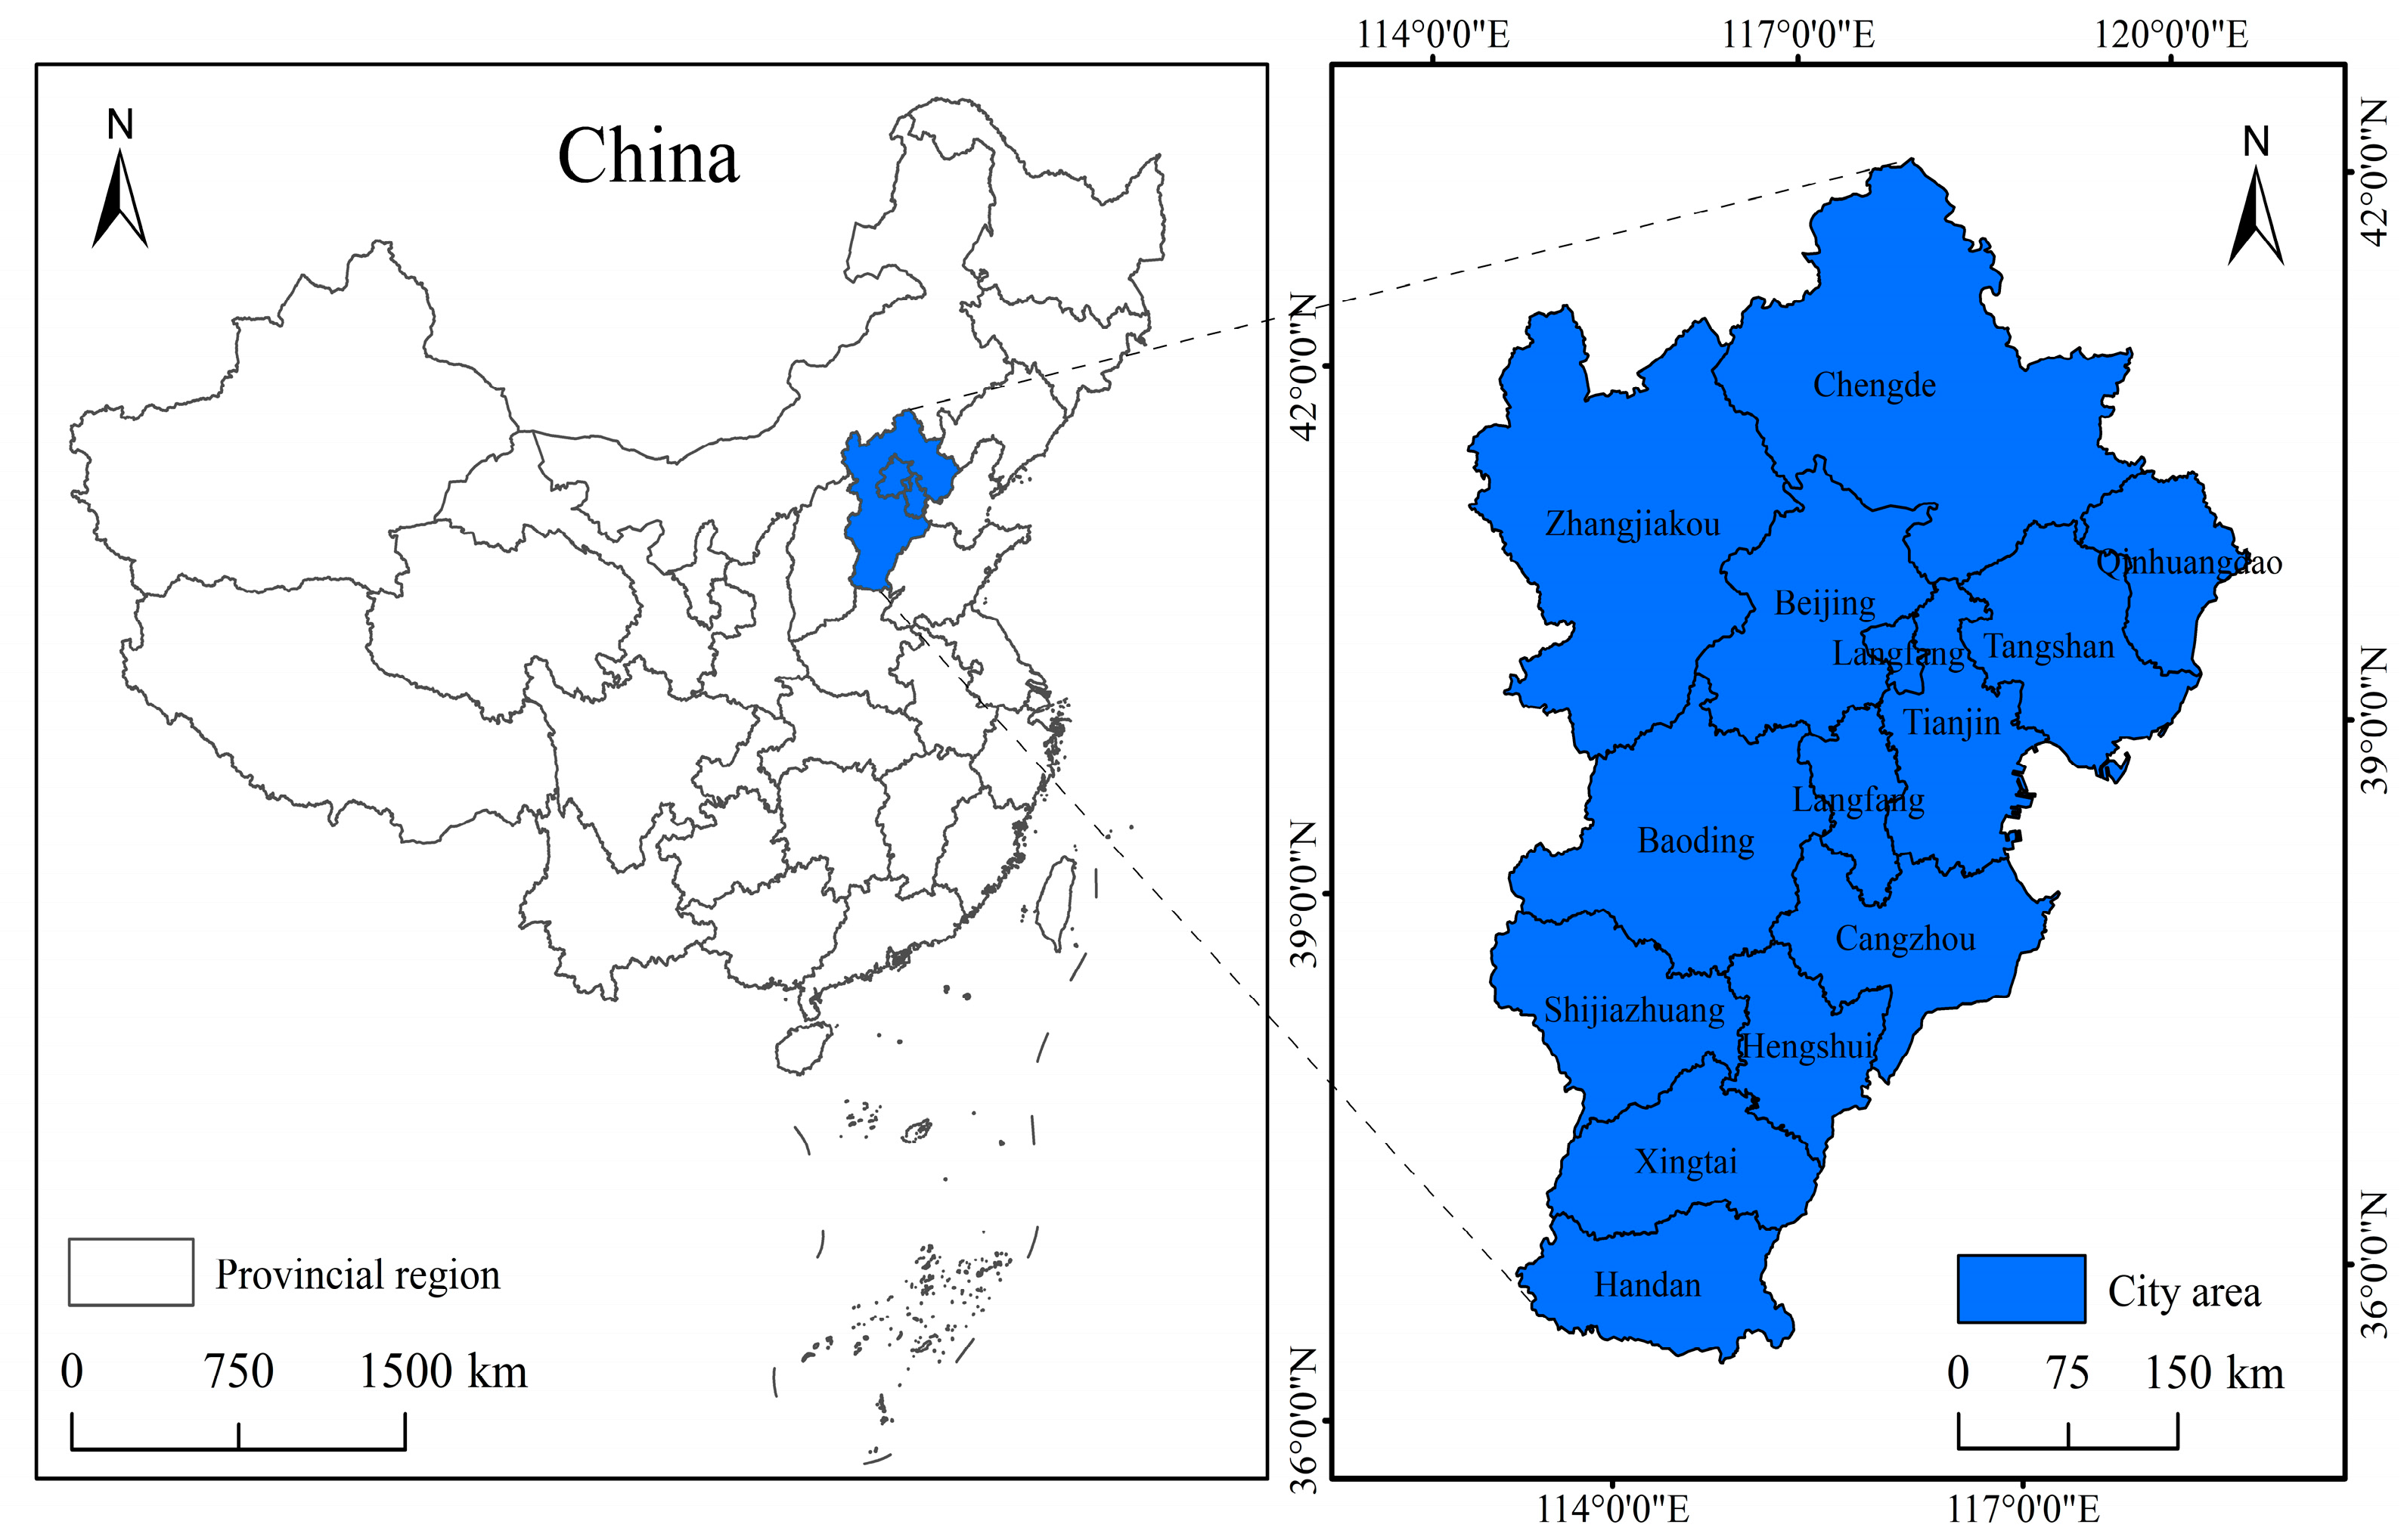
2.1. Research Zone and Data
2.2. SGMC(1,N) Modeling Process
3. Results and Discussion
3.1. Results of Fitting Average Groundwater Over-Exploitation to AEHT
3.2. Comparison of Fitting Accuracy Between Different Models of GOE and EHT
3.3. Prediction and Discussion of AEHT
4. Conclusions and Future Perspectives
Author Contributions
Funding
Informed Consent Statement
Data Availability Statement
Conflicts of Interest
References
- Vautard, R.; van Aalst, M.; Boucher, O.; Drouin, A.; Haustein, K.; Kreienkamp, F.; van Oldenborgh, G.J.; Otto, F.E.L.; Ribes, A.; Robin, Y.; et al. Human contribution to the record-breaking June and July 2019 heatwaves in Western Europe. Environ. Res. Lett. 2020, 15, 094077. [Google Scholar] [CrossRef]
- Deng, X. Ubran response to global extreme climate. Ecol. Econ. 2023, 39, 1–4. [Google Scholar]
- Beillouin, D.; Schauberger, B.; Bastos, A.; Ciais, P.; Makowski, D. Impact of extreme weather conditions on European crop production in 2018. Philos. Trans. R. Soc. B 2020, 375, 20190510. [Google Scholar] [CrossRef] [PubMed]
- Manning, C.; Widmann, M.; Bevacqua, E.; Van Loon, A.F.; Maraun, D.; Vrac, M. Increased probability of compound long-duration dry and hot events in Europe during summer (1950–2013). Environ. Res. Lett. 2019, 14, 094006. [Google Scholar] [CrossRef]
- Hassan, W.H.; Nile, B.K. Climate change and predicting future temperature in Iraq using CanESM2 and HadCM3 modeling. Model. Earth Syst. Environ. 2020, 7, 737–748. [Google Scholar] [CrossRef]
- Li, X.; Hu, Z.; Liu, Y.; Liang, P.; Jha, B. Causes and Predictions of 2022 Extremely Hot Summer in East Asia. J. Geophys. Res. Atmos. 2023, 128, e2022JD038442. [Google Scholar] [CrossRef]
- Loria, R.F.A. The silent impact of underground climate change on civil infrastructure. Commun. Eng. 2023, 2, 44. [Google Scholar] [CrossRef]
- Bhattarai, N.; Lobell, D.B.; Balwinder, S.; Fishman, R.; Kustas, W.P.; Pokhrel, Y.; Jain, M. Warming temperatures exacerbate groundwater depletion rates in India. Sci. Adv. 2023, 9, eadi1401. [Google Scholar] [CrossRef]
- Liang, Z.; Liu, Y.; Hu, H.; Li, H.; Ma, Y.; Khan, M.Y.A. Combined wavelet transform with long short-term memory neural network for water table depth prediction in Baoding City, North China Plain. Front. Environ. Sci. 2021, 9, 780434. [Google Scholar] [CrossRef]
- Baniasadi, M.; Zare’ Mehrjordi, M.R.; Mehrabi Boshrabadi, H.; Mirzaei Khalilabad, H.R.; Rezaei Estakhrooye, A. Evaluation of Negative Economic-Environmental Externalities of Overextraction of Groundwater. Groundwater 2019, 58, 560–570. [Google Scholar] [CrossRef]
- Li, H.; Du, X.; Lu, X.; Fang, M. Analysis of Groundwater Overexploitation Based on Groundwater Regime Information. Groundwater 2022, 61, 692–705. [Google Scholar] [CrossRef]
- Chen, X.-Y.; Zhang, K.; Chao, L.-J.; Liu, Z.-Y.; Du, Y.-H.; Xu, Q. Quantifying natural recharge characteristics of shallow aquifers in groundwater overexploitation zone of North China. Water Sci. Eng. 2021, 14, 184–192. [Google Scholar] [CrossRef]
- Golian, M.; Saffarzadeh, A.; Katibeh, H.; Mahdad, M.; Saadat, H.; Khazaei, M.; Sametzadeh, E.; Ahmadi, A.; Sharifi Teshnizi, E.; Samadi Darafshani, M.; et al. Consequences of groundwater overexploitation on land subsidence in Fars Province of Iran and its mitigation management programme. Water Environ. J. 2021, 35, 975–985. [Google Scholar] [CrossRef]
- Xie, N.-m.; Liu, S.-f. Discrete grey forecasting model and its optimization. Appl. Math. Model. 2009, 33, 1173–1186. [Google Scholar] [CrossRef]
- Deng, J.-L. Control problems of grey systems. Syst. Control Lett. 1982, 1, 288–294. [Google Scholar] [CrossRef]
- Duman, G.M.; Kongar, E.; Gupta, S.M. Estimation of electronic waste using optimized multivariate grey models. Waste Manag. 2019, 95, 241–249. [Google Scholar] [CrossRef]
- Zhang, Z.; Wu, L.; Chen, Y. Forecasting PM2.5 and PM10 concentrations using GMCN(1,N) model with the similar meteorological condition: Case of Shijiazhuang in China. Ecol. Indic. 2020, 119, 106871. [Google Scholar] [CrossRef]
- Wu, L.; Gao, X.; Xiao, Y.; Yang, Y.; Chen, X. Using a novel multi-variable grey model to forecast the electricity consumption of Shandong Province in China. Energy 2018, 157, 327–335. [Google Scholar] [CrossRef]
- Rehman, E.; Ikram, M.; Rehman, S.; Feng, M.T. Growing green? Sectoral-based prediction of GHG emission in Pakistan: A novel NDGM and doubling time model approach. Environ. Dev. Sustain. 2021, 23, 12169–12191. [Google Scholar] [CrossRef]
- Xie, W.; Wu, W.-Z.; Liu, C.; Zhao, J. Forecasting annual electricity consumption in China by employing a conformable fractional grey model in opposite direction. Energy 2020, 202, 117682. [Google Scholar] [CrossRef]
- Cai, K.; Wu, L. Using grey Gompertz model to explore the carbon emission and its peak in 16 provinces of China. Energy Build. 2022, 277, 112545. [Google Scholar] [CrossRef]
- Pan, X. New Grey Convolution Model and Its Application in Carbon Dioxide Emission Prediction. Master’s Thesis, Hebei University of Engineering, Handan, China, 2023. [Google Scholar]
- Wu, L.; Liu, S.; Yao, L.; Yan, S.; Liu, D. Grey system model with the fractional order accumulation. Commun. Nonlinear Sci. Numer. Simul. 2013, 18, 1775–1785. [Google Scholar] [CrossRef]
- Cheng, G.; Zhu, X. Analysis of the excess water from the South to North water diversion project on the recharge of deep groundwater funnel areas in North China. Sci. Technol. Innov. 2024, 169–171+174. [Google Scholar] [CrossRef]
- Wang, S.; Li, H. Using Technology to “Diagnose and Treat” the Groundwater Funnel in North China. China Nat. Resour. News 2022, 007. [Google Scholar] [CrossRef] [PubMed]
- Li, W.; Wang, L.; Yang, H.; Zheng, Y.; Cao, W.; Liu, K. The groundwater overexploitation status and countermeasure suggestions of the North China Plain. China Water Resour. 2020, 26–30. [Google Scholar] [CrossRef]
- Fei, Y.; Miao, J.; Zhang, Z.; Chen, Z.; Song, H.; Yang, M. Analysis on evolution of groundwater depression cones and its leading factors in North China Plain. Resour. Sci. 2009, 31, 394–399. [Google Scholar] [CrossRef]
- Gong, X. Analysis of the current situation of groundwater drop funnel in Shijiazhuang area. China Constr. 2014, 88–89. [Google Scholar]
- Chen, X.; Wang, P.; Muhammad, T.; Xu, Z.; Li, Y. Subsystem-level groundwater footprint assessment in North China Plain–The world’s largest groundwater depression cone. Ecol. Indic. 2020, 117, 106662. [Google Scholar] [CrossRef]
- Feng, W.; Zhong, M.; Lemoine, J.M.; Biancale, R.; Hsu, H.T.; Xia, J. Evaluation of groundwater depletion in North China using the Gravity Recovery and Climate Experiment (GRACE) data and ground-based measurements. Water Resour. Res. 2013, 49, 2110–2118. [Google Scholar] [CrossRef]
- Zhao, Y.; Wang, Q.; Wang, H.; He, F.; Li, H.; Zhai, J.; Liu, R.; Hu, P.; Wang, j. Water Security in Beijing-Tianjin-Hebei Region: Challenges and Strategies. Eng. Sci. 2022, 24, 8–18. [Google Scholar] [CrossRef]
- Cao, Q.; Chen, Z.; Liang, J.; Zhou, Y.; Yan, J.; Gao, Z.; Cui, Z.; Yang, L.; Xi, F. Analysis of the Current Situation of Underground Diving Funnel in the Beijing Tianjin Hebei Plain Area. Yellow River 2022, 44, 66–68. [Google Scholar] [CrossRef]
- Yuan, R.; Song, X.; Han, D.; Zhang, L.; Wang, S. Upward recharge through groundwater depression cone in piedmont plain of North China Plain. J. Hydrol. 2013, 500, 1–11. [Google Scholar] [CrossRef]
- Li, Y.; Zhang, F.; Han, Z.; Wang, P.; Chen, H.; Zhang, Z. Evolution characteristics and influence factors of deep groundwater depression cone in North China Plain, China—A case study in Cangzhou region. J. Earth Sci. 2014, 25, 1051–1058. [Google Scholar] [CrossRef]
- Wang, Y.; Ren, Y.; Song, L.; Xiang, Y. Responses of extreme high temperatures to urbanization in the Beijing–Tianjin–Hebei urban agglomeration in the context of a changing climate. Meteorol. Appl. 2021, 28, e2024. [Google Scholar] [CrossRef]
- Wang, Y.; Xiang, Y.; Han, Z.; Song, L. Future extreme high-temperature risk in the Beijing-Tianjin-Hebei urban agglomeration of China based on a regional climate model coupled with urban parameterization scheme. Theor. Appl. Climatol. 2023, 153, 621–634. [Google Scholar] [CrossRef]
- Bureau, T.W.A. Available online: https://swj.tj.gov.cn/xwzx_17135/swyw/202108/t20210826_5558822.html (accessed on 26 August 2021).
- People’s Political Consultative Conference Network. Available online: https://www.rmzxw.com.cn/c/2016-08-08/962852.shtml (accessed on 8 August 2016).
- Yanzhao Water Conservancy. Available online: https://mp.weixin.qq.com/s?__biz=MzIzODE0MjAxOA==&mid=2650739189&idx=2&sn=2dfa6e7131cc7355bfa7320afcaad807&ch (accessed on 4 February 2024).
- Hebei Statistical Yearbook. Available online: http://tjj.hebei.gov.cn/hbstjj/tjnj/2024/zk/indexch.htm (accessed on 11 April 2025).
- Beijing Statistical Yearbook. Available online: https://nj.tjj.beijing.gov.cn/nj/main/2024-tjnj/zk/indexch.htm (accessed on 24 December 2024).
- Tianjin Statistical Yearbook. Available online: https://stats.tj.gov.cn/nianjian/2024nj/zk/indexch.htm (accessed on 31 December 2024).
- Fu, G.; Charles, S.P.; Yu, J.; Liu, C. Decadal climatic variability, trends, and future scenarios for the North China Plain. J. Clim. 2009, 22, 2111–2123. [Google Scholar] [CrossRef]


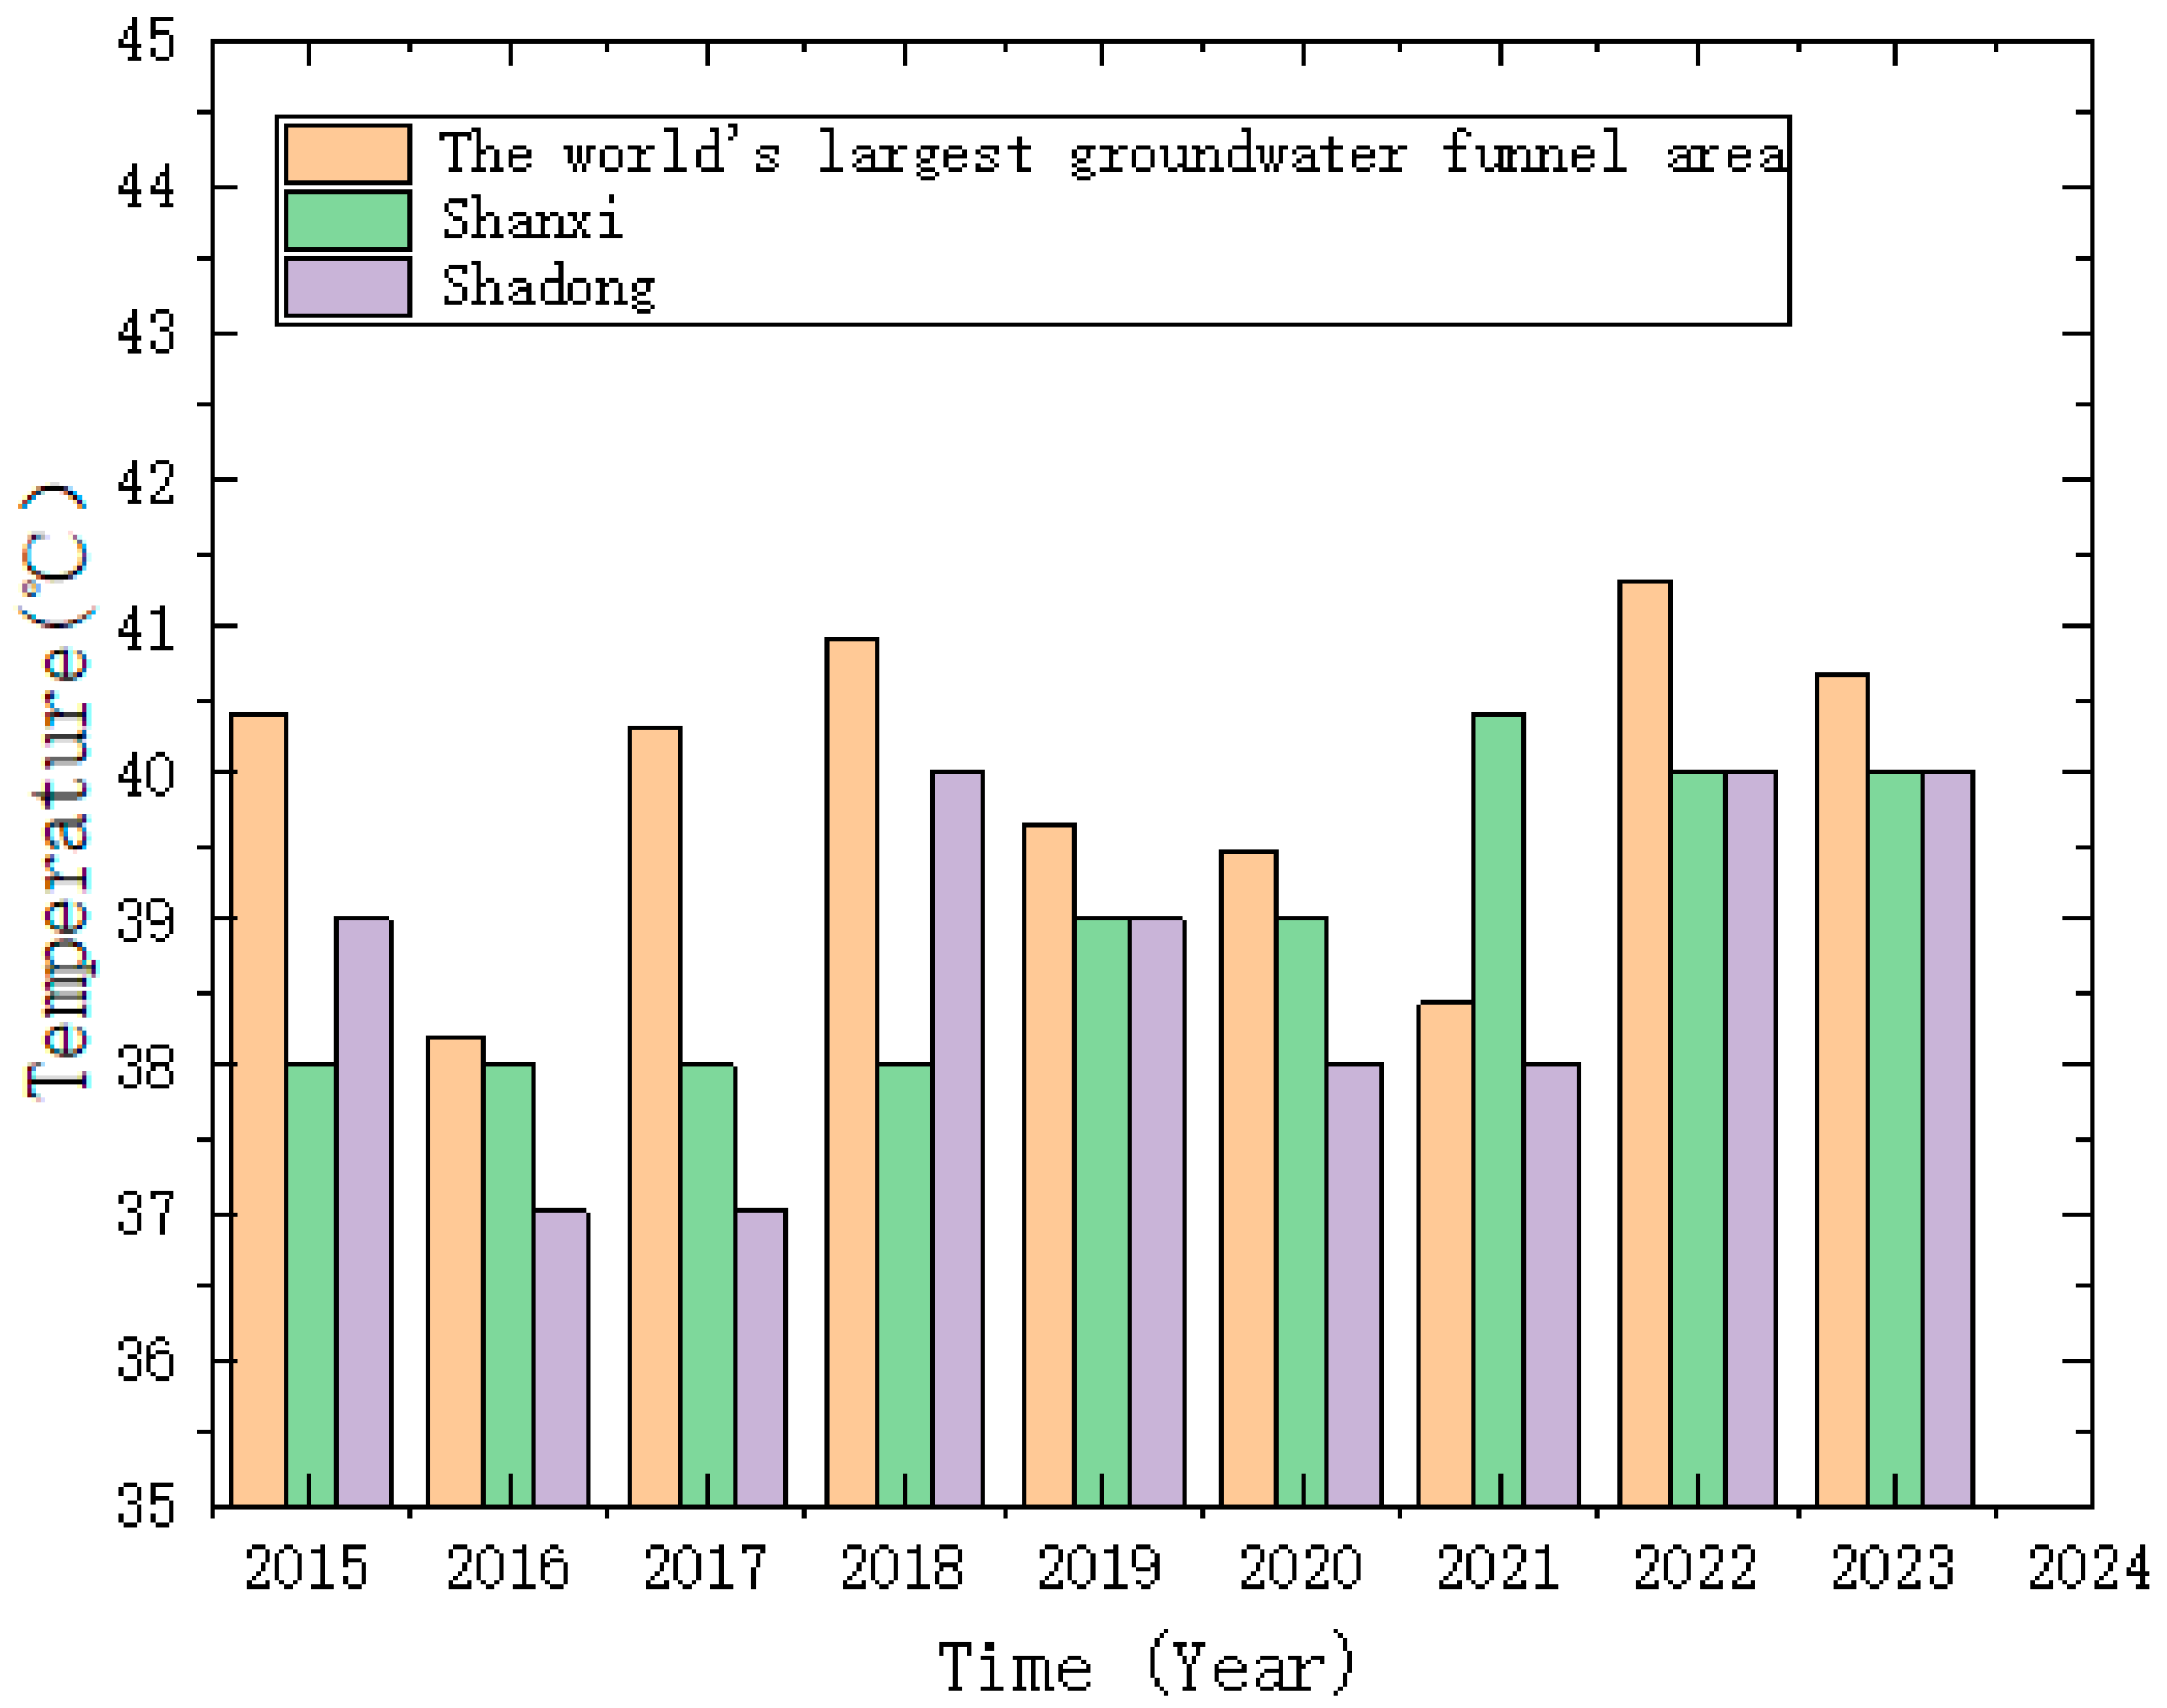
| Year | Shanxi | Shandong | The World’s Largest Groundwater Depression Cone |
|---|---|---|---|
| 2015 | 38 | 39 | 40.4 |
| 2016 | 38 | 37 | 38.2 |
| 2017 | 38 | 37 | 40.3 |
| 2018 | 38 | 40 | 40.9 |
| 2019 | 39 | 39 | 39.63 |
| 2020 | 39 | 38 | 39.47 |
| 2021 | 40.4 | 38 | 38.23 |
| 2022 | 40 | 40 | 41.3 |
| 2023 | 40 | 40 | 41.6 |
| Year | 2019 | 2020 | 2021 | 2022 | 2023 |
|---|---|---|---|---|---|
| AGOE (100 million cubic meters) | 5.45 | 4.1 | 4.6 | 4.1 | 2.23 |
| AEHT (°C) | 39.63 | 39.47 | 38.43 | 41.30 | 40.67 |
| Year | Actual Value | SGMC(1,2) | GMCN(1,2) | GM(0,2) | GM(1,2) |
|---|---|---|---|---|---|
| 2019 | 39.63 | 39.63 | 39.63 | 36.28 | 39.63 |
| 2020 | 39.47 | 42.49 | 37.37 | 41.70 | 47.28 |
| 2021 | 38.43 | 38.43 | 38.34 | 46.78 | 56.88 |
| 2022 | 41.30 | 40.71 | 38.7 | 41.70 | 47.24 |
| 2023 | 40.67 | 40.99 | 38.96 | 22.68 | 24.91 |
| MAPE (%) | 1.97 | 3.21 | 16.2 | 24 |
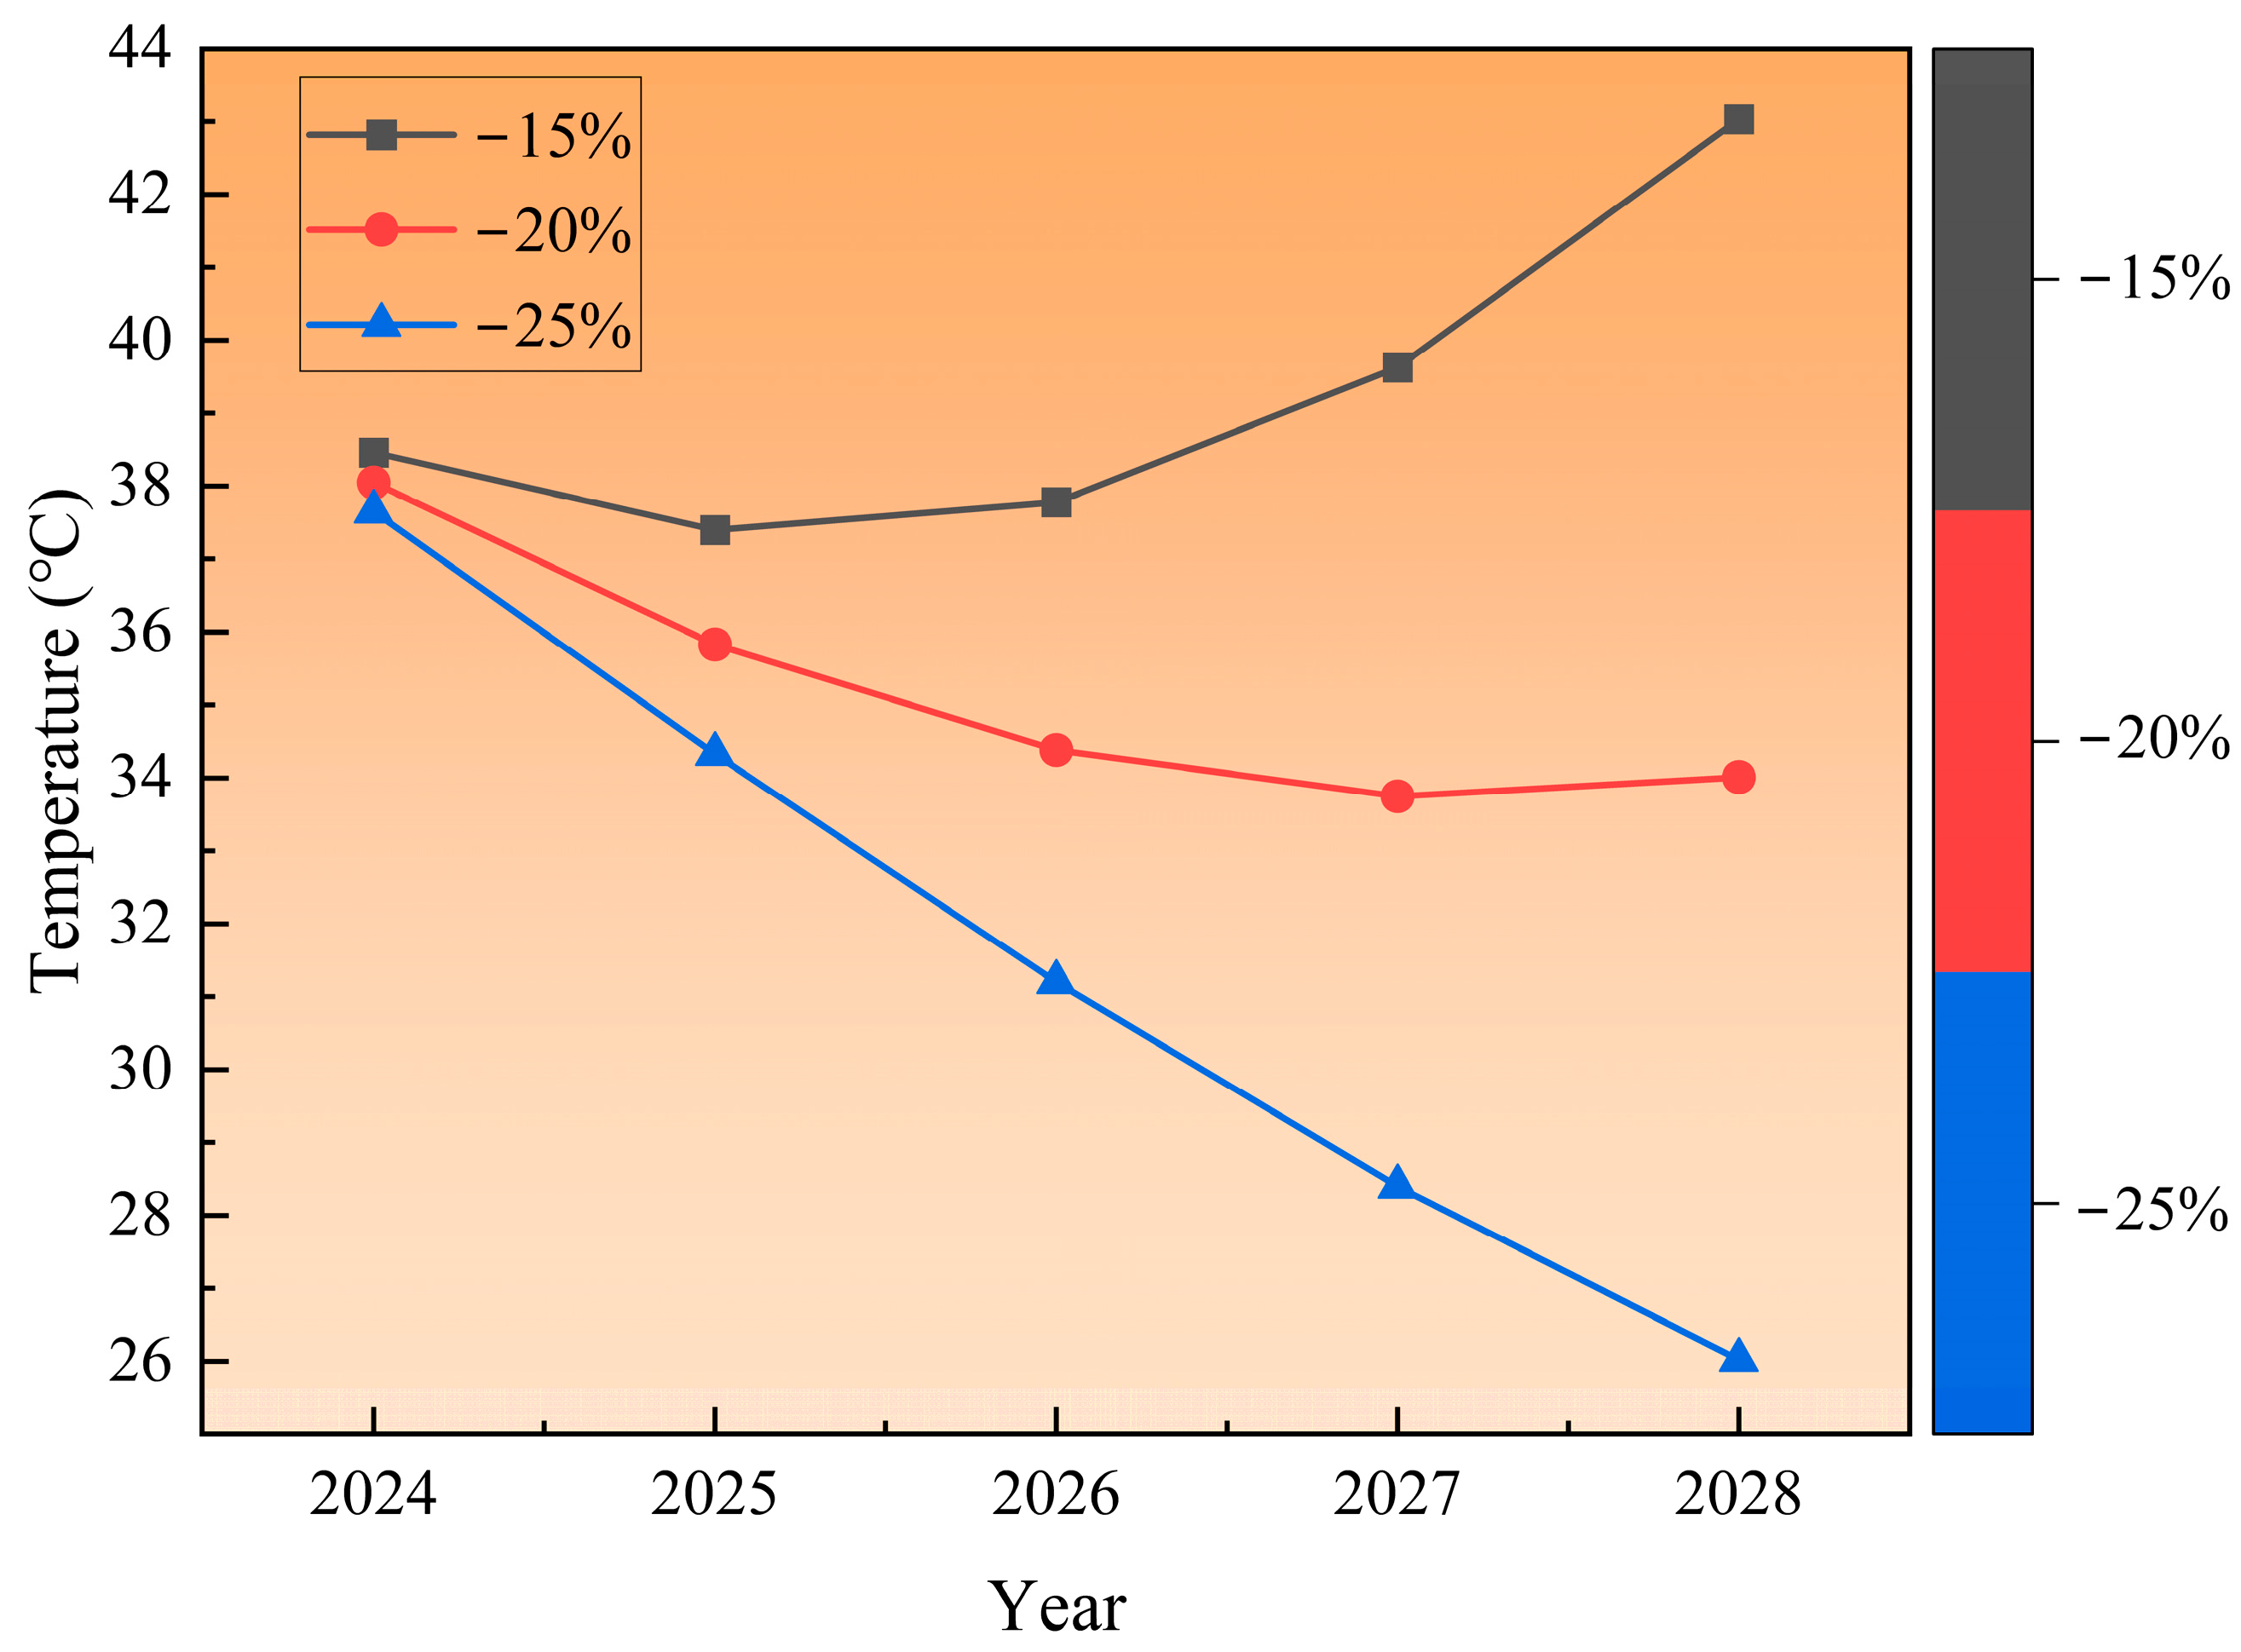
| Influencing Factor | Growth Rate | 2024 | 2025 | 2026 | 2027 | 2028 |
|---|---|---|---|---|---|---|
| GOE | −15% | 38.46 | 37.40 | 37.78 | 39.63 | 43.03 |
| −20% | 38.05 | 35.83 | 34.38 | 33.75 | 34.01 | |
| −25% | 37.65 | 34.33 | 31.20 | 28.40 | 26.02 |
Disclaimer/Publisher’s Note: The statements, opinions and data contained in all publications are solely those of the individual author(s) and contributor(s) and not of MDPI and/or the editor(s). MDPI and/or the editor(s) disclaim responsibility for any injury to people or property resulting from any ideas, methods, instructions or products referred to in the content. |
© 2025 by the authors. Licensee MDPI, Basel, Switzerland. This article is an open access article distributed under the terms and conditions of the Creative Commons Attribution (CC BY) license (https://creativecommons.org/licenses/by/4.0/).
Share and Cite
Ren, X.; Ren, L.; Wu, L. Fractional Uncertain Forecasting of the Impact of Groundwater Over-Exploitation on Temperature in the Largest Groundwater Depression Cone. Fractal Fract. 2025, 9, 299. https://doi.org/10.3390/fractalfract9050299
Ren X, Ren L, Wu L. Fractional Uncertain Forecasting of the Impact of Groundwater Over-Exploitation on Temperature in the Largest Groundwater Depression Cone. Fractal and Fractional. 2025; 9(5):299. https://doi.org/10.3390/fractalfract9050299
Chicago/Turabian StyleRen, Xiangyue, Liyuan Ren, and Lifeng Wu. 2025. "Fractional Uncertain Forecasting of the Impact of Groundwater Over-Exploitation on Temperature in the Largest Groundwater Depression Cone" Fractal and Fractional 9, no. 5: 299. https://doi.org/10.3390/fractalfract9050299
APA StyleRen, X., Ren, L., & Wu, L. (2025). Fractional Uncertain Forecasting of the Impact of Groundwater Over-Exploitation on Temperature in the Largest Groundwater Depression Cone. Fractal and Fractional, 9(5), 299. https://doi.org/10.3390/fractalfract9050299