Abstract
This paper examines how the fractional Fourier transform (FrFT) can be used to form and analyze acoustic holograms produced by a moving, linear, frequency-modulated (LFM) source in a shallow water waveguide. In these environments, the source sound field creates an interference pattern, referred to as a two-dimensional interferogram, which represents the distribution of acoustic intensity in the frequency–time domain. This interferogram consists of parallel interference fringes. Consequently, focal points are formed and aligned along a straight line in the source hologram, which is represented by the two-dimensional Fourier transform of the interferogram. We have developed a holographic method for constructing the interferogram of an LFM source signal and transforming it into a Fourier hologram based on FrFT in the presence of strong noise. A key finding of this study is that the FrFT-based holographic method enables localized focal regions to emerge from modal interference even under high-intensity noise conditions. The positions of these focal spots are directly related to the source parameters, enabling the estimation of key characteristics such as the distance and velocity of the LFM source. We analyzed the effectiveness of the FrFT-based holographic method through numerical experiments in the 100–150 Hz frequency band. The results demonstrate the method’s high noise immunity for source localization in realistic shallow water environments under strong noise.
1. Introduction
The mathematical theory of fractional Fourier transform (FrFT) was first proposed in 1980 [1] and laid the theoretical foundation for its application in signal processing. Currently, the FrFT is an effective mathematical framework for processing various types of complex signals, as demonstrated in various studies [2,3,4,5,6]. Unlike traditional methods, FrFT enables the development of a broader set of tools for signal analysis, including those that do not conform to the assumptions of the integer-order Fourier transform (FT) [7]. By introducing fractional parameters, FrFT-based methods extend the concept of the Fourier transform, providing a more generalized framework for the time–frequency analysis of signals. This deepens our understanding of the time–frequency structure of signals and creates new opportunities for designing more efficient signal processing algorithms in many areas of application. The FrFT has found applications in quantum mechanics [1,2], optics [8,9,10,11], acoustics [12,13], as well as in different signal processing tasks [14,15,16,17,18,19,20,21,22,23,24,25,26]. It can be interpreted as a rotation in the time–frequency plane [3]. In other words, the FrFT defines the structure of a signal in FrFT domain coordinates. In this context, the concept of frequency is extended to FrFT frequency. From this perspective, the FrFT can be regarded as the spectral representation of a signal in the FrFT domain. Next, the FrFT can be interpreted as the decomposition of a signal into sets of linear frequency modulation (LFM) signals [3]. In this case, the matched-order FrFT spectrum of the signal is more localized than its spectral distribution in the conventional Fourier transform (FT) domain.
Often, it is necessary to analyze the temporal structure of a signal in accordance with its FrFT frequencies. To accomplish this, the signal must be represented in the joint time–FrFT frequency domain. This representation is called the short-time fractional Fourier transform (STFrFT), an analog of the short-time Fourier transform (STFT) [27,28,29,30]. This topic has been studied in [31,32,33,34]. The most efficient STFrFT-based signal processing method was proposed in [35]. The STFrFT signal processing method proposed in this work differs from the approaches in [31,32,33,34] in that it enables an analysis of the two-dimensional (2D) signal structure in the time–frequency domain, i.e., the STFrFT domain. When the matched order of the STFrFT is selected, the chirp signal exhibits a compact localization region in the STFrFT domain. This indicates that the STFrFT plays an important role in two-dimensional signal processing. Furthermore, as demonstrated in [35], the STFrFT possesses rotational additivity, providing a horizontal orientation to the signal structure, which is advantageous for analyzing and processing chirp signals. The STFrFT method, as presented in [35], proves to be highly effective in suppressing noise in signals.
Advances in signal processing methods based on the Fourier transform (FrFT) have occurred simultaneously with the above-described developments. Significant progress has also been made in interferometric signal processing (ISP) for underwater acoustics. ISP is founded on analyzing stable interference structures in the time–frequency domain that arise during the propagation of broadband acoustic signals in shallow water waveguides [36,37]. This makes the ISP approach conceptually similar to signal processing methods based on the FT and FrFT. Several seminal studies [38,39,40] provided comprehensive accounts of the theoretical underpinnings and methodological aspects of ISP. A diverse body of research has demonstrated the applicability of ISP across multiple practical domains. For instance, refs. [41,42] used interferometric methods to estimate waveguide-invariant parameters. Another study illustrated the enhancement of weak signals when ISP is combined with array beamforming [43]. In [44], ISP techniques were used for seabed classification with ship-generated acoustic fields. Other contributions include developing a range-estimation algorithm for shallow water environments [45] and an invariant-based method independent of source distance [46]. Additionally, ref. [47] established a direct link between interference fringes and eigenray (or eigenbeam) arrival times.
The versatility of ISP has also been confirmed in deep-ocean scenarios, where it has been adapted for passive sonar applications [48,49]. One of the most advanced ISP-based methodologies in this context is holographic signal processing (HSP) [50,51,52]. The fundamental physical and mathematical principles governing hologram formation were first formulated in [51,52]. According to the HSP paradigm, the quasi-coherent integration of acoustic intensity in the frequency–time domain produces an interferogram [52]. To further interpret the accumulated intensity distribution, a two-dimensional Fourier transform is applied, yielding the so-called Fourier hologram: . This hologram representation concentrates the acoustic energy contained in into localized focal regions that arise as a consequence of mode interference. The hologram exhibits a high focusing capability surpassing the performance of traditional focusing techniques. Such techniques include wavefront reversal or time reversal of the wave to the position of the primary source [53]. Unlike these approaches, the proposed method automatically localizes the two-dimensional source intensity directly at the receiver point, without the need for extended antenna arrays.
The papers [51,52], analyzed HSP for the low-frequency band for a regular waveguide. In paper [54], HSP was analyzed for the high-frequency band. The HSP method was analyzed for an irregular waveguide in the presence of internal waves [55,56] and in the presence of irregular bathymetry [57]. A review of the results obtained to date within the framework of the HSP method is presented in [58]. However, the potential of the HSP method for processing LFM signals [12] in the presence of noise [59,60] has not yet been explored. LFM signals are widely used in large-scale ocean field experiments. They are an effective tool for studying the oceanic environment and are used in many large-scale field experiments [61,62,63,64,65]. This paper addresses this issue. The authors believe that applying the FrFT to the hologram formation of an LFM source yields stable results, even when the noise level significantly exceeds that of the signal.
This paper studies the application of the FrFT to the formation and analysis of acoustic holograms generated by a moving LFM signal source in a shallow water waveguide. In these environments, the source sound field creates an interference pattern, known as a two-dimensional interferogram, which represents the distribution of acoustic intensity in the frequency–time domain. This interferogram consists of parallel interference fringes. Consequently, focal points are formed and aligned along a straight line in the source hologram, which is represented by the two-dimensional Fourier transform of the interferogram. A holographic method has been developed for constructing the interferogram of an LFM signal source and transforming it into a Fourier hologram based on the FrFT in the presence of strong noise. A key finding of this study is that the FrFT-based holographic method can produce localized focal regions resulting from modal interference, even in the presence of high-intensity noise. The positions of these focal spots are directly related to the source parameters, enabling the estimation of such key characteristics, such as the distance and velocity of the LFM signal source. The effectiveness of the FrFT-based holographic method has been analyzed through numerical experiments in the 100–150 Hz frequency band. The presented results demonstrate the method’s high immunity to noise for source localization in realistic, shallow water environments with strong noise.
This paper is organized into five sections. Section 1 provides an introduction. Section 2 presents the theoretical foundations of holographic signal processing based on the FrFT, including the shallow water waveguide model, the formulation of the LFM source signal, the waveguide’s transfer function, and the mathematical framework for interferogram and hologram formation. The use of STFrFT for analyzing and filtering chirp signals in the time–FrFT-frequency domain is emphasized. Section 3 describes the setup and results of the numerical simulations. It provides the acoustic parameters of the shallow water environment and details the characteristics of the LFM signal used for the simulations. It also analyzes the structure of the received LFM signal for stationary and moving LFM sources under different noise conditions, including noise-free and with noise (SNR = −30 dB). The structures of the interferograms and holograms of the LFM source are also analyzed under various noise conditions. This section demonstrates that FrFT-based filtering enables the recovery of interferogram and hologram structures close to those obtained in the absence of noise, even under severe noise contamination. Estimates of key source parameters (range and velocity) are derived from the positions of the hologram’s focal spots for different noise conditions. A comparative analysis of these estimates demonstrates the effectiveness of FrFT-based holographic signal processing in shallow water. Section 4 concludes the study by summarizing the main findings and outlining potential directions. Section 5 describes the next phase of our research.
2. Holographic Signal Processing Based on Fractional Fourier Transform
This section presents an algorithm for constructing the hologram of a moving LFM signal source using the FrFT. Section 2 consists of seven parts. The first part, Section 2.1, describes the shallow water waveguide model used in this paper. The shallow water waveguide transfer function is constructed within the framework of the modal description of the acoustic field in Section 2.2. Section 2.3 is devoted to describing the LFM signal model emitted by the source. Section 2.4 presents a description of the LFM signal model as it propagates through the shallow water waveguide and is received by the receiver. Section 2.5 is devoted to applying the FrFT to process the LFM signal recorded by the receiver. Section 2.6 presents the interferogram of the signal obtained at the receiver. Section 2.7 provides a description of the signal hologram at the receiving point.
2.1. Shallow Water Waveguide Model
First, we describe the two-dimensional representation of the shallow water waveguide used in our work (see Figure 1). The waveguide is formulated in the Cartesian coordinate system and is characterized by the depth-dependent sound speed , refractive index , and density . The water layer is bounded at the top by the free surface at and at the bottom by the seabed located at .
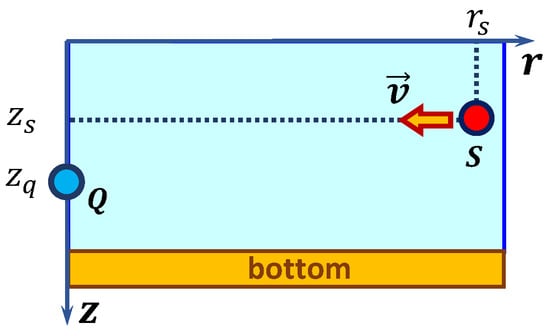
Figure 1.
Shallow water waveguide model.
The seabed is characterized by its density and by the refractive index [66,67,68], where is the attenuation parameter expressed as . Here, stands for the bottom loss coefficient, is the sound speed within the bottom medium, and f corresponds to the acoustic frequency.
2.2. Shallow Water Waveguide Transfer Function
Consider an underwater acoustic scenario in a shallow water waveguide (Figure 1). The receiver is positioned at point , and the stationary source is assumed to be placed at the origin of the coordinate system (). A moving sound source is located at point , with its velocity denoted by . Under the assumptions of vertical modes and the approximation of horizontal rays, the transfer function of the shallow water waveguide (see Section 2.1) can be written as follows, cf. [66,67,68]:
In this context, represents the distance between the source and the receiver, and corresponds to the vertical distribution (mode shape) of the m-th acoustic mode in the shallow water waveguide. The complex horizontal wavenumber of a given mode is expressed as , where and denote its real and imaginary components, respectively. The summation is carried out up to M, which is the total number of propagating modes in the shallow water environment. The angular frequency is defined as . The mode functions together with the complex wavenumbers are determined by solving the corresponding Sturm-Liouville eigenvalue problem subject to the boundary conditions imposed by the free surface at the top and the seabed at the bottom [66,67,68]:
Here,
In Equations (2)–(4), we assume that the seabed is a homogeneous, fluid, absorbing half-space. The mode functions satisfy the following orthonormality condition:
where denotes the Kronecker delta.
Hereafter, the transfer function of the waveguide will be denoted as .
2.3. Source LFM Signal
Consider the LFM source signal at the emission point. An LFM signal is a type of waveform whose instantaneous frequency changes linearly with time and is also commonly referred to as a chirp signal. LFM signals are widely used in large-scale ocean acoustic experiments in underwater acoustics. They are an efficient tool for investigating the marine environment and have been used in many field campaigns [61,62,63,64,65].
2.3.1. Time Domain
The time instantaneous frequency of an LFM signal sweeping from a starting frequency to an ending frequency over a time interval is given by
The time instantaneous phase of the signal can be obtained by integrating the instantaneous angular frequency :
The instantaneous LFM signal in the time domain is expressed as
2.3.2. Frequency Domain
The instantaneous LFM signal in the frequency domain derived by the FT of is
This integral corresponds to a Fresnel-type integral. Its approximate closed-form solution yields the complex spectrum as
The magnitude spectrum therefore has the form
The phase of the complex spectrum has the form:
2.3.3. Parameters of LFM Signal
- is the initial frequency at ,
- is the final frequency at ,
- is the central frequency,
- is the duration of the frequency sweep,
- is the frequency bandwidth,
- LFM is called an up-chirp if ,
- LFM is called a down-chirp if ,
- A is the signal amplitude.
Hereafter, the source signal will be denoted as in the time domain and as in the frequency domain.
2.4. Receiver LFM Signal
Now, let us examine the acoustic signal observed at the receiver location. Let be the spectrum of the received waveform. When the transmitted signal propagates through a shallow water waveguide, the medium can be modeled as a linear, time-invariant system characterized by its transfer function (Equation (1)). Under this assumption, the received spectrum is obtained as the product of the transmitted spectrum (Equation (10)) and the transfer function of the propagation channel, namely
This relation emphasizes that the spectral content of the received signal is shaped by the properties of the source waveform and the frequency-dependent response of the shallow water waveguide.
Assuming that the source signal is an LFM waveform, it sweeps continuously from the initial frequency to the final frequency within the duration of the emission interval . As a result, we obtain the following expression for the spectrum of the received signal
The magnitude spectrum therefore has the form
The phase of the complex spectrum has the form
The LFM signal’s wide bandwidth () allows its interaction with the shallow water waveguide to be described in terms of amplitude and phase distortions introduced by the channel. At the receiver, the chirp’s overall spectral extent remains essentially unchanged: the signal’s frequency content still occupies the interval , and no additional frequencies are generated outside this band. However, the propagation medium selectively modifies the relative amplitudes and phases of the individual harmonic components within this spectral range. Specifically, the amplitude response does not remove frequencies from the interval but rather introduces frequency-dependent attenuation that reshapes the spectral envelope. Consequently, while the useful chirp bandwidth is preserved in a nominal sense, the relative energy distribution across the band may no longer be uniform. This reduces the effective resolution attainable after matched filtering. Similarly, the phase response alters the phase relationships among the spectral components. This corresponds to frequency-dependent group delays, meaning that different portions of the chirp spectrum arrive at the receiver with varying temporal offsets. For an LFM signal, this effect manifests itself as a nonlinear distortion of the instantaneous frequency law , leading to temporal dispersion, pulse broadening, and a departure from the ideal linear chirp structure. These amplitude and phase effects preserve the nominal spectral support of the transmitted waveform while significantly modifying the detailed structure of the received spectrum inside the interval .
2.5. Fractional Fourier Transform
Next, let us review the background of the FrFT in holographic signal processing.
2.5.1. Fractional Fourier Transform
The is the FrFT of the signal and can be expressed in the following way [31,32,33,34,35]
where is the kernel function of the FrFT, is the order of the FrFT, and is the rotation angle of the u-axis in the FrFT domain.
The FrFT kernel function is expressed as follows:
where denotes the Dirac delta function. The inverse FrFT provides a way to reconstruct the original signal from its known transformed representation :
2.5.2. Short-Time Fractional Fourier Transform
Consider the short-time extension of the fractional Fourier transform (STFrFT) [35]. Unlike conventional approaches, the STFrFT represents both temporal and FrFT frequency information simultaneously on the joint time–FrFT frequency plane. This provides the signal with a two-dimensional support region. When performed with the appropriate fractional order, the transform yields a compact support region for chirp signals in this domain, demonstrating the STFrFT’s effectiveness in holographic signal processing. Furthermore, the STFrFT preserves the additivity property of rotation and yields a horizontally oriented support region for LFM signals, significantly facilitating their analysis and processing. For example, the STFrFT is an effective tool for suppressing noise and enhancing the clarity of LFM signals in holographic signal processing.
The STFrFT is obtained by multiplying the signal by a window function before applying the FrFT:
where is the window function. The efficiency of an STFrFT at a given order depends on both the form and duration of the window. In [34], the optimal window function was analyzed. Two main conditions are typically applied when selecting an appropriate window function: (1) achieving high 2D resolution and (2) ensuring a compact STFrFD support region of the signal. Therefore, the optimal window function provides the STFrFT with maximum 2D resolution while keeping the support region as small as possible. A Gaussian window function leads to the maximum 2D resolution. For convenience, consider a unit-energy Gaussian window:
where is the width of the window function.
The inverse short-time fractional Fourier transform enables us to reconstruct the original signal from its transformed form :
Here, is the kernel function of the inverse FrFT:
In summary, the STFrFT provides a powerful framework for holographic signal processing. It enables the denoising and reconstruction of LFM signals with enhanced time–frequency resolution and robustness against noise.
- The FrFT is equivalent to a rotation in the time–frequency plane. For an LFM signal, this rotation transforms an oblique spectral line into a vertical concentration, thereby maximizing energy compaction.
- The STFrFT inherits the localization properties of the short-time transform, enabling joint analysis and effective denoising.
2.6. Interferogram of LFM Signal
In this section, we analyze the interferogram produced by a moving acoustic source. The distance between the source and the receiver varies over time and can be expressed as follows:
where is the initial position of the source at , t is the current observation time, and v denotes the constant velocity of the moving source.
The two-dimensional interferogram describes the distribution of the received acoustic intensity in the joint frequency–time domain and is initially expressed as
According to Equation (13), this representation can be further written in terms of the power spectrum of the transmitted waveform and the channel response:
In turn, the transfer function of the shallow water waveguide is expressed, following Equation (1), in terms of the normal modes of the environment:
where the individual mode contribution is defined as
Here, are the mode eigenfunctions, and represent the real and imaginary parts of the modal horizontal wavenumber, respectively, and is the density at the source depth.
As a result, the interferogram of the moving source in the frequency–time domain can be expressed as the coherent superposition of cross-terms between different modes:
where is the difference in the real parts of the modal horizontal wavenumbers. The term represents a partial interferogram that results from the interference between the m-th and n-th modes. The superscript * denotes complex conjugation. The restriction indicates that the mean (auto-term) contribution has been excluded. Thus, reflects only the modal interference structure.
2.7. Hologram of LFM Signal
This section focuses on the holographic representation of a moving source of LFM signals in a shallow water waveguide. To extract the holographic features from the measured acoustic field, we apply a two-dimensional Fourier transform (2D-FT) to the interferogram , which was introduced in Equation (14). This transformation maps the signal from the frequency–time domain into the hologram domain , producing the function , which can be written as
where is the time-lag variable, and is the angular frequency in the hologram plane. Each term corresponds to the interference contribution between the m-th and n-th acoustic modes. The integration over extends across the signal band, from to , where is the bandwidth of the transmitted waveform, is the central frequency, and is the total observation time.
Assuming that the modal amplitudes and the spectral distribution of the field only vary slowly with frequency compared to the rapid oscillatory dependence of the phase term , the partial hologram can be approximated by the simplified analytical form
with the phase of the partial hologram given by
Equations (31) and (32) directly follow from applying the Whittaker–Shannon–Kotel’nikov theorem to the band-limited function in Equation (30). A detailed derivation of these relationships has been presented in our previous papers [50,51,52].
The location of the focal spot closest to the origin in the hologram plane yields direct estimates of the kinematic parameters of the moving source, namely, its radial velocity and initial position. Following [50,51,52], these estimates are obtained from
where the proportionality coefficients are defined as
Here, the overdot notation indicates that the values are not the exact source parameters, but rather their estimates obtained by means of holographic processing.
The holographic signal processing algorithm operates as follows. The spatial–spectral structure of the hologram is markedly different from that of the original interferogram , and the relationship between them is strictly bijective. In other words, the hologram provides a complete and unique representation of the interferogram. Consequently, applying the inverse 2D Fourier transform to fully reconstructs the original interferogram , thus ensuring that no information about the propagation channel or modal interference pattern is lost.
3. Numerical Simulation Results
Section 3 presents the configuration and outcomes of the numerical simulations. The acoustic parameters of the shallow water environment are presented, and stationary and moving low-frequency modulation (LFM) sources are examined in the presence of noise. The analysis focuses on the structure of interferograms and holograms of an LFM signal in the presence of noise. It illustrates how the STFrFT can suppress noise and how the positions of focal spots can accurately estimate key source parameters, such as range and velocity, even in noisy environments. Particular emphasis is placed on applying the STFrFT to analyze and filter chirp signals in the time–FrFT frequency domain.
Section 3 consists of five parts. Section 3.1 provides a detailed description of the parameters of the transmitted LFM source signal, including the carrier frequency, bandwidth, duration, and modulation characteristics. These parameters form the basis for the simulation scenarios. Section 3.2 introduces the acoustic parameters of the shallow water waveguide and the waveguide transfer function. Section 3.3 defines the simulation framework for the received LFM signal in the presence of noise. The received signal spectrum is modeled as the product of the LFM source spectrum and the waveguide transfer function, plus a realization of the noise spectrum. Section 3.4 presents and analyzes the interferogram and hologram for a stationary LFM source. The focus is on using the SFrFT for noise suppression and forming focal spots, which enable the accurate estimation of stationary-source parameters in noisy environments. The feasibility of estimating these parameters under noisy conditions is demonstrated. Section 3.5 examines interferograms and holograms generated by a moving LFM source. The emphasis is on applying the SFrFT to suppress noise and on focal spot formation to accurately estimate the parameters of a moving source in a noisy environment. The motion-induced displacement of focal spots is analyzed, and the feasibility of estimating the parameters of a moving LFM source in a noisy environment is demonstrated.
3.1. Source LFM Signal Parameters
At the source, we consider an LFM (up-chirp) waveform. Its instantaneous frequency sweeps linearly over time (see Equations (6)–(8)). These signals are widely used in large-scale ocean acoustic experiments because they efficiently probe the marine environment. They have been used in numerous field campaigns [61,62,63,64,65].
Table 1 summarizes the parameters of the LFM source signal used in the numerical simulation.

Table 1.
LFM source signal parameters.
Figure 2 illustrates the LFM signal used in this study. Figure 2a shows the time domain waveform . The signal has a unit amplitude and a finite duration of s; outside this interval, the signal is (approximately) zero. To reduce spectral smearing, smooth rise and fall segments are applied at the beginning and end. The instantaneous frequency linearly increases from Hz at to Hz at s, i.e., an up-chirp with slope Hz/s. Figure 2b presents the normalized magnitude spectrum . The energy is concentrated within the passband of 100–150 Hz (bandwidth of Hz; center frequency of Hz), producing a nearly flat-top profile within the band and a rapid roll-off outside it.
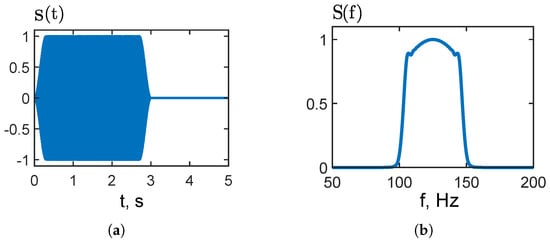
Figure 2.
Source LFM signal: (a) signal time dependence ; (b) signal spectrum .
Figure 3 visualizes the STFrFT of the LFM source signal. Figure 3a corresponds to order (i.e., the conventional STFT). The energy forms an oblique ridge that tracks the linear sweep from 100 to 150 Hz over 0–3 s, with Hz/s. Figure 3b uses an order matched to the chirp rate, ; the representation is effectively de-chirped, and the energy collapses into a nearly horizontal ridge, indicating the transformed signal’s near time-invariance. In both panels, the vertical axis is frequency (Hz), the horizontal axis is time (s), and the color scale shows the normalized magnitude (from 0 to 1). In the STFrFT, the order p sets the rotation angle in the time–frequency plane. Optimal de-chirping occurs when the rotation compensates for the chirp slope in the plane, which is represented by the equation , . With Hz, Hz, and s, we obtain Hz/s, rad, and . For a down-chirp (), the optimal angle flips signs (), so the optimal order becomes . In practice, the horizontal orientation of the STFrFT in Figure 3b yields a higher energy concentration and substantially increases the signal-to-noise ratio (SNR) of the received signal.
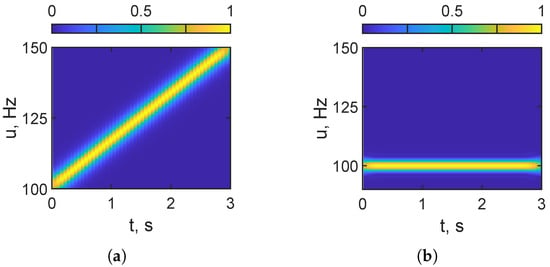
Figure 3.
STFrFT of source LFM signal: (a) – STFrFT of , ; (b) – STFrFT of , .
3.2. Shallow Water Waveguide and Transfer Function
Consider the canonical shallow water waveguide. The waveguide consists of a shallow, horizontally homogeneous water layer of constant depth over a flat seabed. This model is widely used in underwater acoustics because it provides a simplified yet rigorous context for isolating the influence of individual environmental parameters.
The parameters used in the numerical simulation of the shallow water waveguide are listed in Table 2.

Table 2.
Shallow water waveguide parameters.
Calculations were performed for the frequency band of –150 Hz. The waveguide has a depth of and a water sound speed of m s−1. The seabed is modeled with a complex refractive index of and a density of g cm−3. The receiver is placed at a range of and a depth of m, while the source is located at km and a depth of m.
The sound field is represented by normal modes. The values of the propagation constants and group velocities , , for the considered shallow water waveguide with a depth of m are given in Table 3. As can be seen, m−1 and (m/s)−1.

Table 3.
Sound field mode parameters ( Hz).
Figure 4 shows the complex transfer function of the shallow water waveguide across the 100–150 Hz band. Figure 4a shows the real part, . Figure 4b illustrates the imaginary part, . Both components exhibit pronounced quasi-periodic oscillations with frequent zero crossings, which are characteristic of mode interference in shallow water. The real and imaginary parts of have comparable magnitudes (normalized to unity), indicating a strongly frequency-dependent phase response over the considered frequency band.
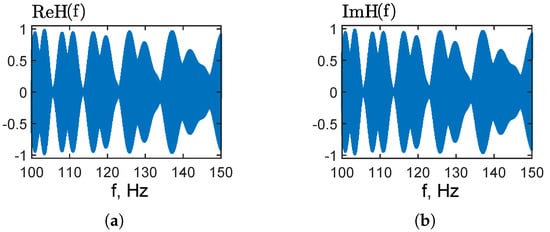
Figure 4.
Shallow water waveguide transfer function : (a) real part: ; (b) imaginary part: .
Figure 5 presents the magnitude of the shallow water waveguide transfer function, , over the 100–150 Hz band. The normalized curve (0–1) shows pronounced variability with alternating peaks and deep notches, reflecting constructive and destructive modal interference in the waveguide. Unlike the LFM signal at the source, the shallow water waveguide transfer function exhibits substantial frequency dependence within the 100–150 Hz band, as seen in the figure. This, in turn, modifies the spectral (frequency) structure of the LFM source signal at the receiver after propagation through the shallow water waveguide. We will examine this structure in the next section.
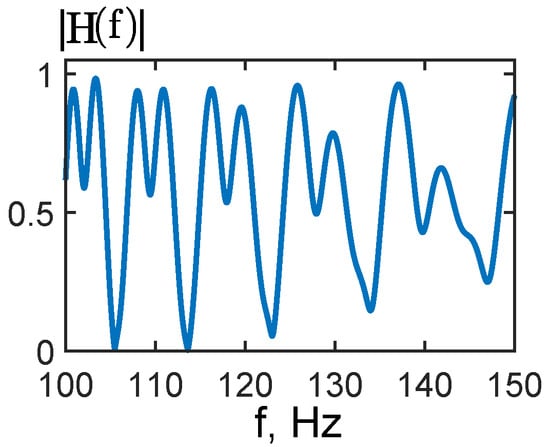
Figure 5.
Shallow water waveguide transfer function absolute value .
3.3. Receiver LFM Signal
This simulation considers the received LFM signal in the presence of noise. The received signal spectrum is modeled as the product of the LFM source spectrum and the shallow water waveguide transfer function , plus a realization of the noise spectrum realization in the frequency domain :
Equation (35) shows that the observed spectrum is the source spectrum modulated by the frequency-dependent characteristics of the shallow water waveguide .
Figure 6 presents the received LFM signal with the parameters given in Table 1 in a shallow water waveguide with the parameters in Table 2 and Table 3. Figure 6a shows the time domain of the receiver LFM signal : a finite-duration, amplitude-tapered chirp that occupies approximately the first 3 s of the record and is followed by silence. The instantaneous frequency increases with time, consistent with an up-chirp. Figure 6b displays the magnitude spectrum computed from . The signal energy is concentrated in the 100–150 Hz band, which corresponds to the band-limiting of the LFM source signal. Unlike the source signal, the spectrum of the received LFM signal is characterized by pronounced variability with alternating peaks and deep notches, resulting from constructive and destructive modal interference in the shallow water waveguide.
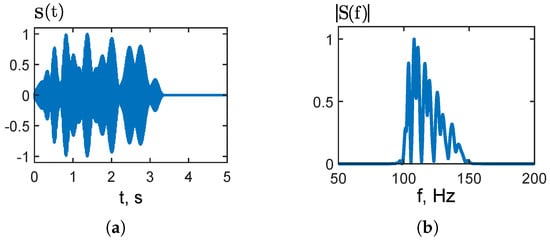
Figure 6.
Receiver LFM signal: (a) signal time dependence ; (b) signal spectrum . Noise is absent.
Figure 7 illustrates the STFrFT of the received LFM waveform for two fractional orders in the noise-free case. Figure 7a, with (i.e., the conventional STFT), shows the characteristic up-chirp as a bright ridge rising from about 100 to 150 Hz over 0–3 s. In contrast, Figure 7b with ( rad) effectively rotates the time–frequency representation: the chirp is nearly flattened and its energy is concentrated in a narrow, almost horizontal band near 100 Hz. Though the received LFM signal is characterized by pronounced variability with alternating peaks and deep notches due to constructive and destructive modal interference, Figure 7 demonstrates the usefulness of the STFrFT for de-chirping the received LFM signal in a shallow water waveguide.
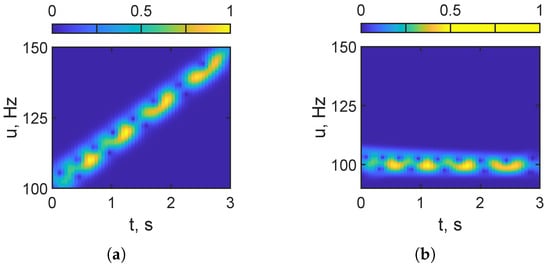
Figure 7.
STFrFT of receiver LFM signal: (a) – STFrFT of , ; (b) – STFrFT of , . Noise is absent.
Figure 8 shows the short-time fractional Fourier transform (STFrFT) of the noisy received LFM waveform at dB. Figure 8a, with (the conventional STFT), is dominated by diffuse noise and the up-chirp is not discernible. Figure 8b, with , effectively de-chirps the waveform and concentrates its energy into a narrow, nearly horizontal band near 100 Hz by selecting a fractional order close to the LFM signal’s chirp rate. This makes it possible to effectively filter the received LFM signal from the noise. The result of this filtering is presented in the next figure.
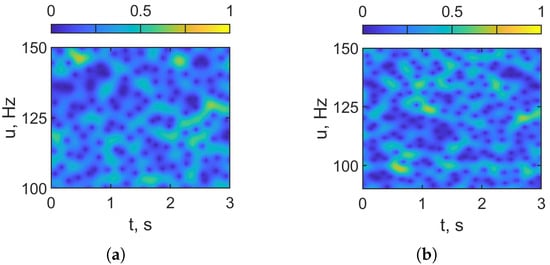
Figure 8.
STFrFT of receiver LFM noisy signal before denoising: (a) – STFrFT of , ; (b) – STFrFT of , . dB.
Figure 9 shows the result of noise filtering in the STFrFT domain for the noisy received LFM signal with an input of dB. The received LFM signal is filtered in the STFrFT domain, as shown in Figure 9a, with an order matched to the chirp parameter (). In this case, the signal representation is effectively de-chirped, that is, the energy collapses into a narrow, nearly horizontal band near 100 Hz. This ensures high filtering effectiveness. After filtering the LFM signal, the inverse STFrFT () is applied. Then, the forward STFrFT () is applied to the denoised signal. Figure 9b shows that, using the conventional STFT (), the energy of the denoised received LFM signal aligns with the expected LFM trajectory. This forms an ascending ridge from approximately 100 to 150 Hz over 0–3 s. Consequently, we obtain the spectral distribution (STFT) of the noise-suppressed LFM signal, which can be used to construct the source interferogram and hologram.
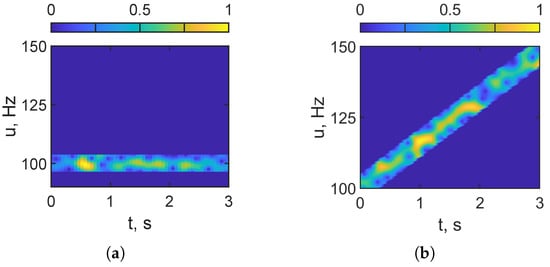
Figure 9.
STFrFT of receiver LFM noisy signal after denoising: (a) – STFrFT of , ; (b) – STFrFT of , . dB.
Compared to the noisy case, denoising significantly reduces the spectral noise floor and reveals the signal structure. This improves chirp parameter estimation accuracy and enables more effective Fourier transform (FT)-based holographic processing of low-signal-to-noise ratio (SNR) LFM signals. The following sections examine the effectiveness of this FrFT-based holographic processing for LFM signals at a low SNR.
3.4. Interferogram and Hologram of Non-Moving LFM Source ( m/s)
This section reports on the results of holographic processing obtained from numerical simulations for a stationary LFM source, m/s, in a shallow water waveguide. The LFM waveform parameters used in the simulations are listed in Table 1, and the shallow water waveguide parameters are compiled in Table 2.
Simulation geometry. The source was placed at km, 15 m), and the receiver was located at m). Thus, the horizontal separation remained fixed at km. The numerical simulation model is shown in Figure 10.
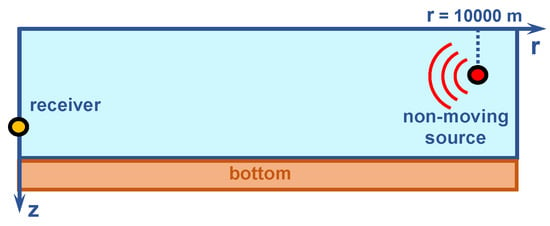
Figure 10.
Numerical simulation model. Non-moving LFM source: ( m/s).
Holographic Signal Processing Settings. The analysis was confined to the frequency band –120 Hz. The total observation interval was s; individual realizations had a duration of with a hop of s between consecutive segments. A modal representation with modes was employed. The corresponding propagation constants and group velocities are reported in Table 3.
Figure 11 presents the results of the holographic signal processing for a stationary LFM signal source in a shallow water waveguide. No noise is present. Figure 11a shows the interferogram , where the spectral content in the 100–120 Hz band remains stable throughout the observation interval, reflecting the absence in variations due to source motion. Figure 11b displays the hologram . As can be seen, the focal spots in the hologram domain for a stationary source are located along the -axis.
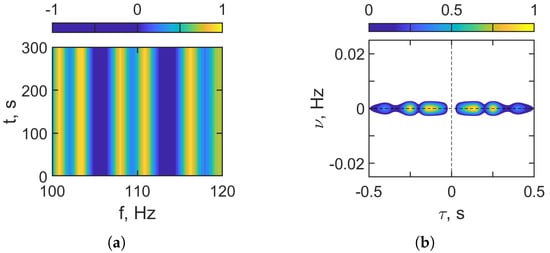
Figure 11.
Receiver LFM signal. HSP based on FT. (a) Distribution in interferogram domain. (b) Distribution in hologram domain. Frequency band: –120 Hz. Non-moving source: m/s. Noise is absent.
Table 4 compiles the holographic signal processing results for the frequency band –120 Hz. As Figure 11 shows, the interferogram exhibits essentially no frequency drift, s−2. In the hologram domain, the dominant focal spot is located at s and Hz, consistent with a stationary source. Inverting the holographic parameters yields the following source estimates m/s and km. The corresponding errors are for the velocity and for the range.

Table 4.
Source of LFM signal parameters estimation. Non-moving source. Noise is absent.
Figure 12 presents the conventional HSP outputs for the noisy received LFM signal in the band –120 Hz for a stationary source () at dB. Figure 12a shows the interferogram . Without FrFT-based filtering of the receiver LFM signal, Figure 12a is dominated by broadband noise. The quasi-periodic vertical interference fringes observed in the noise-free case are no longer discernible. No persistent time–frequency structure can be reliably identified. Figure 12b shows the hologram . For a stationary source, the focal spots should lie along the abscissa (). However, the high noise level in Figure 12b largely masks the focal spots, distributed across the hologram domain. Clearly, the noisy hologram in panel (b) does not allow for reliable estimation of the coordinates of the LFM source’s focal spots or reconstruction of its parameters. These results underscore the need for FrFT domain denoising prior to holographic signal processing under low-SNR conditions ( dB).
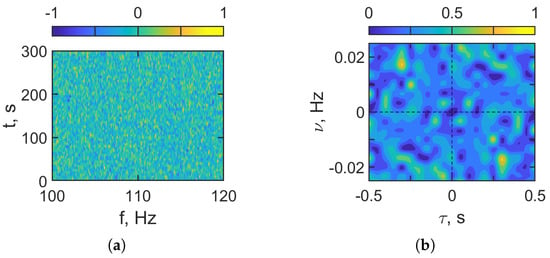
Figure 12.
Receiver LFM noisy signal. HSP based on FT. (a) Distribution of in interferogram domain. (b) Distribution of in hologram domain. Frequency band: –120 Hz. Non-moving source: m/s. Noise is present. dB.
Figure 13 presents the results of holographic signal processing for the noisy received LFM signal after FrFT-based denoising (–, , ). Using the FrFT filter significantly improves the outcome of the holographic processing. In the interferogram domain (Figure 13a), the time–frequency structure is clearer, with pronounced vertical, quasi-periodic interference fringes now visible. In the hologram domain (Figure 13b), the focal spots associated with a stationary source are sharply localized along the axis. This enhancement enables the reliable determination of the focal-spot coordinates and, consequently, the accurate estimation of the source parameters.
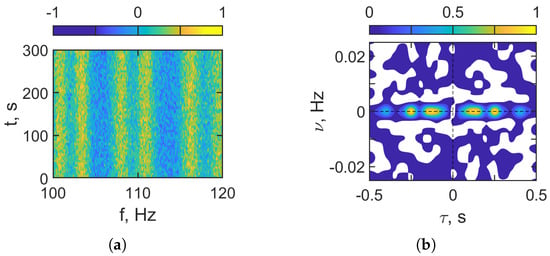
Figure 13.
LFM noisy signal after denoising. HSP based on FrFT. (a) Distribution in interferogram domain. (b) Distribution in hologram domain. Frequency band: –120 Hz. Non-moving source: m/s. Noise is present. dB.
Table 5 compiles the holographic signal processing results for a stationary source in the presence of noise across the band –120 Hz. The interferogram shows essentially no frequency drift in the noisy case (see Figure 13), with a value of approximately . In the hologram domain, the dominant focal spot is located at s and Hz, consistent with a non-moving source. Inverting these holographic parameters yields the source estimates of m/s and km. These values are consistent with a stationary source. The range estimate remains close to the nominal value. The error in the reconstructed source values amounts to 0% for the velocity and 6.1% for the range. The presented results demonstrate the high effectiveness of FrFT-based denoising in holographic signal processing of an LFM signal from a stationary source in a shallow water waveguide under low-SNR conditions ( dB).

Table 5.
Source of LFM signal parameters estimation. Non-moving source. Noise is present.
3.5. Interferogram and Hologram of Moving LFM Source ( m/s)
This section presents the results of holographic processing obtained from numerical simulations for a moving LFM signal source with a velocity of in a shallow water waveguide. The LFM signal parameters used in the simulations are listed in Table 1, and the shallow water parameters are compiled in Table 2.
Simulation Geometry. The source was placed at , and the receiver was located at , so the horizontal separation remained fixed at . The numerical simulation model is shown in Figure 14.
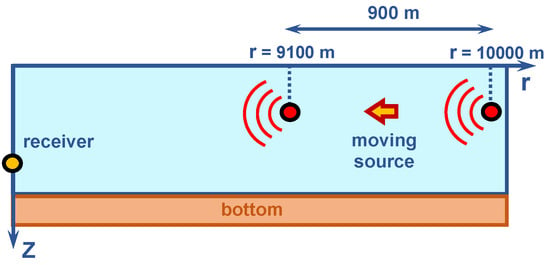
Figure 14.
Numerical simulation model. Moving LFM source ( m/s).
Holographic Signal Processing Settings. The analysis was confined to the band . The total observation interval was ; individual realizations had a duration of with a hop of between consecutive segments. A modal representation with modes was employed. The corresponding propagation constants and group velocities are reported in Table 3.
Figure 15 shows the results of holographic signal processing for a moving LFM source in a shallow water waveguide with a velocity of . There is no noise. Figure 15a shows the interferogram : pronounced oblique, quasi-periodic fringes with a non-zero slope , s−2 traverse the 100–120 Hz band over the observation interval, reflecting the induced frequency variation due to the source motion. Figure 15b displays the hologram . The focal spots are clearly resolved, displaced from the -axis and centered at , and appear approximately symmetric about along an oblique locus in the plane. The locations of these spots provide reliable coordinates of focal spots for estimating the source parameters (range and velocity), consistent with a moving source.
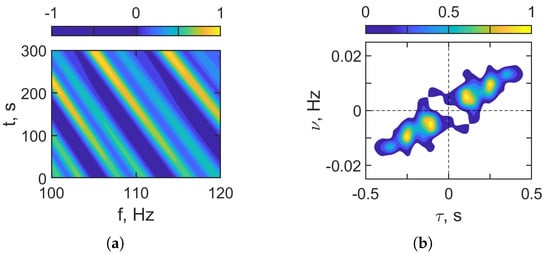
Figure 15.
Receiver LFM signal. HSP based on FT. (a) Distribution of in interferogram domain. (b) Distribution of in hologram domain. Frequency band: –120 Hz. Moving source: m/s. Noise is absent.
Table 6 summarizes the holographic signal processing results for a moving source in the band –120 Hz (noise-free case). The interferogram indicates a non-zero frequency drift, . In the hologram domain, the dominant focal spot is found at and , which is consistent with a frequency shift due to source motion. Inverting these holographic parameters yields the source estimates and . These values are consistent with a moving source and are close to the nominal settings. The corresponding errors are for the velocity and for the range.

Table 6.
Source of LFM signal parameters estimation. Moving source. Noise is absent.
Figure 16 presents holographic signal processing results for the noisy received LFM signal without FrFT-based denoising (–, , ). Omitting the FrFT filter markedly degrades the outcome of the holographic processing. In the interferogram domain (Figure 16a), the time–frequency structure is overwhelmed by broadband noise and the slanted, quasi-periodic interference fringes expected for a moving source are not visible. In the hologram domain (Figure 16b), the energy is diffuse and low-contrast. The focal spots cannot be localized. They are heavily masked by noise. The absence of a well-defined structure prevents determination of the focal-spot coordinates and, consequently, makes source parameters estimation impossible. These results underscore the need for FrFT domain denoising prior to holographic signal processing under low-SNR conditions ( dB).
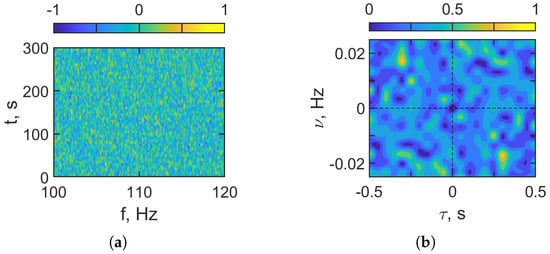
Figure 16.
Receiver LFM signal. HSP based on FT. (a) Distribution of in interferogram domain. (b) Distribution of in hologram domain. Frequency band: –120 Hz. Moving source: m/s. Noise is present. dB.
Figure 17 presents the results of holographic signal processing for the noisy received LFM signal after FrFT-based denoising (–, , ). Applying the FrFT filter significantly improves the outcome of the holographic processing. In the interferogram domain (Figure 17a), the time–frequency structure is clear: slanted, quasi-periodic interference fringes with a non-zero slope are visible across the band, which is consistent with Doppler variation from the moving source. In the hologram domain (Figure 17b), energy collapses into compact focal spots displaced from the axis. This enhancement enables the reliable determination of the focal-spot coordinates and, consequently, accurate estimation of the source parameters (velocity and range) under low-SNR shallow water conditions.
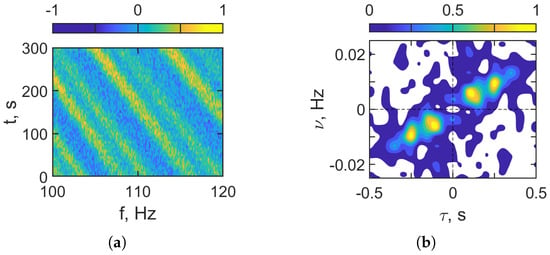
Figure 17.
Receiver LFM signal. HSP based on FrFT. (a) Distribution of in interferogram domain. (b) Distribution of in hologram domain. Frequency band: –120 Hz. Moving source: m/s. Noise is present. dB.
Table 7 summarizes the holographic signal processing results for a moving source in the band with noise present. The interferogram shows a non-zero frequency drift, . In the hologram domain, the dominant focal spot is located at and , which is consistent with a non-zero Doppler shift. Inverting these holographic parameters yields the following source estimates and . These values are consistent with a moving source. Compared with the nominal settings (, ), the errors are about in velocity and in range.

Table 7.
Source of LFM signal parameters estimation. Moving source. Noise is present.
These results demonstrate that incorporating FrFT-based denoising as a preprocessing step in holographic signal processing is highly effective for LFM signals from a stationary source in a shallow water waveguide under very low SNR. At , the method markedly lowers the spectral noise floor, restores the interferometric structure, and produces well-localized focal spots in the hologram. This improves detectability, as well as the accuracy and stability of subsequent parameter estimates (e.g., range) compared to conventional processing.
4. Conclusions
The paper proposes an FrFT-based holographic signal processing method for an LFM signal of a moving source in a shallow water waveguide. This study demonstrates that applying the short-time fractional Fourier transform for the formation and analysis of holograms of a moving LFM source provides reliable estimations of the source parameters even under high noise levels. Under strong noise conditions, the following occurs: (i) rotating the FrFT representation in the time–frequency domain concentrates the energy of the LFM chirp in the frequency domain, (ii) denoising the compacted energy, and (iii) then quasi-coherent interferometric accumulation is performed by means of a two-dimensional Fourier transform to form a noise-free source hologram. The resulting source hologram’s structure is similar to that of a source hologram in the absence of noise. The focal spots of the source hologram align along a straight line passing through the origin. The coordinates of the hologram’s focal spot are determined by the source parameters (range and radial velocity). Thus, the proposed FrFT-based holographic processing method can estimate the parameters of an LFM source even under strong noise conditions: dB.
Key findings of the paper.
- Noise robustness and denoising. Holographic signal processing based on the short-time fractional Fourier transform for the LFM signal of a stationary or moving source concentrates the energy into a nearly horizontal ridge. This enables effective denoising at input SNRs down to and restores a clear holographic structure where conventional short-time Fourier transform processing fails.
- Accuracy of parameter estimation (stationary source). Quantitative analysis shows that the range of a stationary source can be recovered with an error of at most . In the noise-free case, the velocity and range errors are and ; at , the errors are and , respectively.
- Accuracy of parameters estimation (moving source). A quantitative analysis indicates that the range of a moving source can be recovered with an error of up to , whereas its velocity may incur errors of up to . In the noise-free case, the velocity and range errors are and , respectively; at , these errors increase to and .
- Effectiveness of the FrFT-based HSP method. Comparing stationary and moving source types reveals that high noise levels cause only a minor increase in estimation errors relative to the noise-free case. These results confirm the robustness of the FrFT-based holographic signal processing method and its ability to deliver reliable results in realistic shallow water conditions with high-noise levels.
FrFT-based holographic signal processing preserves the interpretability of holographic features while substantially improving the detectability of low-SNR LFM signal sources. Practical applications include estimating the range and velocity of a source in shallow water with a single receiver and easily integrating with existing holographic signal processing.
These findings expand the application of holographic techniques in underwater acoustics, demonstrating their effectiveness in noisy real-world settings. In particular, FrFT-based holographic processing of LFM signals yields stable, near-truth estimates of source parameters. This underscores the value of FrFT-based holographic processing for fundamental studies and operational ocean monitoring and surveillance in high-noise environments.
5. Future Work
The next phase of our research will focus on empirically validating the proposed FrFT-based holographic signal processing framework using legacy, well-instrumented, shallow water experiments spanning diverse environments and source–receiver geometries— SWARM’95, Shallow Water 2006 (SW06), and ASIAEX 2001 ([61,62,63,64,65]). These campaigns encompass intense internal-wave fields, continental-shelf propagation, variable bathymetry and bottom types, and high noise levels—making them an ideal testing ground for noise-robust, single-receiver ranging and velocity estimation under complex conditions.
One promising direction for future research is extending the proposed holographic signal processing framework from the conventional FT to the FrFT [69]. The FrFT provides an additional degree of freedom through its fractional order, enabling a more flexible representation of signals in intermediate domains between time and frequency. This could potentially improve the resolution and adaptability of holographic analysis, especially for nonstationary or partially coherent signals.
Author Contributions
Supervision and project administration, M.E. and S.P.; conceptualization and methodology, V.K. and S.P.; software, S.T., A.P. and N.L.; validation, M.E. and V.K.; formal analysis, M.E. and S.P.; writing – original draft preparation, M.E. and S.P.; writing – review and editing, M.E. and S.P.; All authors have read and agreed to the published version of the manuscript.
Funding
This work was supported by grant from the Russian Science Foundation No. 23-61-10024, https://rscf.ru/project/23-61-10024/, (accessed on 20 October 2025).
Data Availability Statement
The original data used in the study are openly available. The waveguide model used in the simulation is based on parameters from the SWARM’95, SHALLOW WATER 2006, ASIEX 2001 experiments: [61,62,63,64,65].
Conflicts of Interest
The authors declare no conflicts of interest.
Abbreviations
The following abbreviations are used in this manuscript:
| ISP | interferometric signal processing; |
| HSP | holographic signal processing; |
| FT | Fourier transform; |
| STFT | short-time Fourier transform; |
| FrFT | fractional Fourier transform; |
| STFrFT | short-time fractional Fourier transform; |
| LFM | linear frequency modulation; |
| 2D | two-dimensional; |
| 1D-FT | one-dimensional Fourier transform; |
| 2D-FT | two-dimensional Fourier transform. |
References
- Namias, V. The fractional order Fourier transform and its application to quantum mechanics. IMA J. Appl. Math. 1980, 25, 241–265. [Google Scholar] [CrossRef]
- McBride, A.C.; Kerr, F.H. On Namias’ fractional Fourier transform. IMA J. Appl. Math. 1987, 39, 159–175. [Google Scholar] [CrossRef]
- Almeida, L.B. The fractional Fourier transform and time-frequency representations. IEEE Trans. Signal Process. 1994, 42, 3084–3091. [Google Scholar] [CrossRef]
- Sejdić, E.; Djurović, I.; Stanković, J. Fractional Fourier transform as a signal processing tool: An overview of recent developments. Signal Process. 2011, 91, 1351–1369. [Google Scholar] [CrossRef]
- Su, W.; Tao, R.; Deng, B. Discrete fractional Fourier transform: Algorithms and applications in signal processing. Signal Process. 2019, 156, 44–63. [Google Scholar]
- Lu, Y. An effective representation for multi-component nonstationary signals based on the fractional Fourier transform. Mech. Syst. Signal Process. 2022, 178, 109305. [Google Scholar]
- Duhamel, P.; Vetterli, M. Fast Fourier Transforms: A Tutorial Review and a State of the Art. Signal Process. 1990, 19, 17–34. [Google Scholar] [CrossRef]
- Ozaktas, H.M.; Mendlovic, D. Fourier transforms of fractional order and their optical interpretation. Opt. Commun. 1993, 101, 163–169. [Google Scholar] [CrossRef]
- Ozaktas, H.M.; Mendlovic, D. Fractional Fourier optics. J. Opt. Soc. Am. A 1995, 12, 743–751. [Google Scholar] [CrossRef]
- Tao, R.; Xin, Y.; Wang, Y. Double image encryption based on random phase encoding in the fractional Fourier domain. Opt. Express 2007, 15, 16067–16079. [Google Scholar] [CrossRef]
- Tao, R.; Lang, J.; Wang, Y. Optical image encryption based on the multiple-parameter fractional Fourier transform. Opt. Lett. 2008, 33, 581–583. [Google Scholar] [CrossRef]
- Capus, C.; Brown, K.E. Short-time fractional Fourier methods for the time-frequency representation of chirp signals. J. Acoust. Soc. Am. 2003, 113, 3253–3263. [Google Scholar] [CrossRef] [PubMed]
- Locke, J.; White, P.R. The performance of methods based on the fractional Fourier transform for detecting marine mammal vocalizations. J. Acoust. Soc. Am. 2011, 130, 1974–1984. [Google Scholar] [CrossRef] [PubMed]
- Ozaktas, H.M.; Aytur, O. Fractional Fourier domains. Signal Process. 1995, 46, 119–124. [Google Scholar] [CrossRef]
- Xia, X.G. On bandlimited signals with fractional Fourier transform. IEEE Signal Process. Lett. 1996, 3, 72–74. [Google Scholar] [CrossRef]
- Erseghe, T.; Kraniauskas, P.; Cariolaro, G. Unified fractional Fourier transform and sampling theorem. IEEE Trans. Signal Process. 1999, 47, 3419–3423. [Google Scholar] [CrossRef]
- Ozaktas, H.M.; Barshan, B.; Mendlovic, D.; Onural, L. Convolution, filtering, and multiplexing in fractional Fourier domains and their relation to chirp and wavelet transforms. J. Opt. Soc. Am. A 1994, 11, 547–559. [Google Scholar] [CrossRef]
- Kutay, M.A.; Ozaktas, H.M.; Arikan, O.; Onural, L. Optimal filtering in fractional Fourier domains. IEEE Trans. Signal Process. 1997, 45, 1129–1143. [Google Scholar] [CrossRef]
- Qi, L.; Tao, R.; Zhou, S.Y.; Wang, Y. Detection and parameter estimation of multicomponent LFM signal based on the fractional Fourier transform. Sci. China Ser. F Inf. Sci. 2004, 47, 184–198. [Google Scholar] [CrossRef]
- Santhanam, B.; McClellan, J.H. The discrete rotational Fourier transform. IEEE Trans. Signal Process. 1996, 44, 994–998. [Google Scholar] [CrossRef]
- Ozaktas, H.M.; Arikan, O.; Kutay, M.A.; Bozdagi, G. Digital computation of the fractional Fourier transform. IEEE Trans. Signal Process. 1996, 44, 2141–2150. [Google Scholar] [CrossRef]
- Pei, S.C.; Yeh, M.H.; Tseng, C.C. Discrete fractional Fourier transform based on orthogonal projections. IEEE Trans. Signal Process. 1999, 47, 1335–1348. [Google Scholar] [CrossRef]
- Pei, S.C.; Ding, J.J. Closed-form discrete fractional and affine Fourier transforms. IEEE Trans. Signal Process. 2000, 48, 1338–1353. [Google Scholar] [CrossRef] [PubMed]
- Durak, L.; Arikan, O. Short-time Fourier transform: Two fundamental properties and an optimal implementation. IEEE Trans. Signal Process. 2003, 51, 1231–1242. [Google Scholar] [CrossRef]
- Zayed, A.I. A convolution and product theorem for the fractional Fourier transform. IEEE Signal Process. Lett. 1998, 5, 101–103. [Google Scholar] [CrossRef]
- Kraniauskas, P.; Cariolaro, G.; Erseghe, T. Method for defining a class of fractional operations. IEEE Trans. Signal Process. 1998, 46, 2804–2807. [Google Scholar] [CrossRef]
- Czerwinski, R.N.; Jones, D.L. Adaptive Short-Time Fourier Analysis. IEEE Trans. Signal Process. 1997, 45, 617–627. [Google Scholar] [CrossRef]
- Zhang, E.; Antoni, J.; Pintelon, R.; Schoukens, J. Fast detection of system nonlinearity using nonstationary signals. Mech. Syst. Signal Process. 2010, 24, 2065–2075. [Google Scholar] [CrossRef]
- Rybak, J. Short-Time Fourier Transform Based on Metaprogramming. Sensors 2021, 21, 4123. [Google Scholar] [CrossRef]
- Sandoval, S.; De Leon, P.L. Recasting the (Synchrosqueezed) Short-Time Fourier Transform as Instantaneous Spectra. Entropy 2022, 24, 518. [Google Scholar] [CrossRef]
- Stankovic, L.; Alieva, T.; Bastiaans, M.J. Time-frequency signal analysis based on the windowed fractional Fourier transform. Signal Process. 2003, 83, 2459–2468. [Google Scholar] [CrossRef]
- Katkovnik, V. A new form of the Fourier transform for time-frequency estimation. Signal Process. 1995, 47, 187200. [Google Scholar] [CrossRef]
- Djukanovic, S.; Dakovic, M.; Stankovic, L. Local polynomial Fourier transform receiver for nonstationary interference excision in DSSS communications. IEEE Trans. Signal Process. 2008, 56, 1627–1636. [Google Scholar] [CrossRef]
- Djurovic, I. Robust adaptive local polynomial Fourier transform. IEEE Signal Process. Lett. 2004, 11, 201–204. [Google Scholar] [CrossRef]
- Tao, R.; Li, Y.-L.; Wang, Y. Short-time fractional Fourier transform and its applications. IEEE Trans. Signal Process. 2010, 58, 2568–2580. [Google Scholar] [CrossRef]
- Weston, D.; Stevens, K. Interference of wide-band sound in shallow water. J. Sound Vib. 1972, 21, 57–64. [Google Scholar] [CrossRef]
- Chuprov, S. Interference structure of a sound field in a layered ocean. Ocean. Acoust. Curr. State 1982, 71–91. [Google Scholar]
- Ianniello, J. Recent developments in sonar signal processing. IEEE Signal Process. Mag. 1998, 15, 27–40. [Google Scholar]
- Thode, A.M. Source ranging with minimal environmental information using a virtual receiver and waveguide invariant theory. J. Acoust. Soc. Am. 2000, 108, 1582–1594. [Google Scholar] [CrossRef]
- Kuperman, W.A.; D’Spain, G.L. Ocean Acoustic Interference Phenomena and Signal Processing. In Proceedings of the AIP Conference Proceedings, San Francisco, CA, USA, 1–3 May 2001; American Institute of Physics: College Park, MA, USA, 2002; Volume 621. [Google Scholar]
- Rouseff, D.; Spindel, R.C. Modeling the waveguide invariant as a distribution. In Proceedings of the AIP Conference Proceedings, San Francisco, CA, USA, 1–3 May 2001; American Institute of Physics: College Park, MA, USA, 2002; Volume 621, pp. 137–150. [Google Scholar]
- Baggeroer, A.B. Estimation of the distribution of the interference invariant with seismic streamers. In Proceedings of the AIP Conference Proceedings, San Francisco, CA, USA, 1–3 May 2001; American Institute of Physics: College Park, MA, USA, 2002; Volume 621, pp. 151–170. [Google Scholar]
- Yang, T. Beam intensity striations and applications. J. Acoust. Soc. Am. 2003, 113, 1342–1352. [Google Scholar] [CrossRef]
- Heaney, K.D. Rapid geoacoustic characterization using a surface ship of opportunity. IEEE J. Ocean. Eng. 2004, 29, 88–99. [Google Scholar] [CrossRef]
- Cockrell, K.L.; Schmidt, H. Robust passive range estimation using the waveguide invariant. J. Acoust. Soc. Am. 2010, 127, 2780–2789. [Google Scholar] [CrossRef] [PubMed]
- Rouseff, D.; Zurk, L.M. Striation-based beam forming for estimating the waveguide invariant with passive sonar. J. Acoust. Soc. Am. Express Lett. 2011, 130, 76–81. [Google Scholar] [CrossRef] [PubMed]
- Harrison, C.H. The relation between the waveguide invariant, multipath impulse response, and ray cycles. J. Acoust. Soc. Am. 2011, 129, 2863–2877. [Google Scholar] [CrossRef]
- Emmetiere, R.; Bonnel, J.; Gehant, M.; Cristol, X.; Chonavel, T. Understanding deep-water striation patterns and predicting the waveguide invariant as a distribution depending on range and depth. J. Acoust. Soc. Am. 2018, 143, 3444–3454. [Google Scholar] [CrossRef]
- Emmetiere, R.; Bonnel, J.; Cristol, X.; Gehant, M.; Chonavel, T. Passive source depth discrimination in deep-water. IEEE J. Sel. Top. Signal Process. 2019, 13, 185–197. [Google Scholar] [CrossRef]
- Kuznetsov, G.N.; Kuzkin, V.M.; Pereselkov, S.A. Spectrogram and localization of a sound source in a shallow sea. Acoust. Phys. 2017, 63, 449–461. [Google Scholar] [CrossRef]
- Pereselkov, S.A.; Kuz’kin, V.M. Interferometric processing of hydroacoustic signals for the purpose of source localization. J. Acoust. Soc. Am. 2022, 151, 666–676. [Google Scholar] [CrossRef]
- Ehrhardt, M.; Pereselkov, S.A.; Kuz’kin, V.M.; Kaznacheev, I.; Rybyanets, P. Experimental observation and theoretical analysis of the low-frequency source interferogram and hologram in shallow water. J. Sound Vib. 2023, 544, 117388. [Google Scholar] [CrossRef]
- Pereselkov, S.; Kuz’kin, V.; Ehrhardt, M.; Tkachenko, S.; Rybyanets, P.; Ladykin, N. Use of interference patterns to control sound field focusing in shallow water. J. Mar. Sci. Eng. 2023, 11, 559. [Google Scholar] [CrossRef]
- Pereselkov, S.; Kuz’kin, V.; Ehrhardt, M.; Matvienko, Y.; Tkachenko, S.; Rybyanets, P. The Formation of 2D Holograms of a Noise Source and Bearing Estimation by a Vector Scalar Receiver in the High-Frequency Band. J. Mar. Sci. Eng. 2024, 12, 704. [Google Scholar] [CrossRef]
- Pereselkov, S.; Kuz’kin, V.; Ehrhardt, M.; Tkachenko, S.; Rybyanets, P.; Ladykin, N. Three-Dimensional Modeling of Sound Field Holograms of a Moving Source in the Presence of Internal Waves Causing Horizontal Refraction. J. Mar. Sci. Eng. 2023, 11, 1922. [Google Scholar] [CrossRef]
- Pereselkov, S.; Kuz’kin, V.; Ehrhardt, M.; Tkachenko, S.; Pereselkov, A.; Ladykin, N. Influence of intense internal waves traveling along an acoustic path on source holographic reconstruction in shallow water. J. Mar. Sci. Eng. 2025, 13, 1409. [Google Scholar] [CrossRef]
- Pereselkov, S.; Kuz’kin, V.; Ehrhardt, M.; Tkachenko, S.; Pereselkov, A.; Ladykin, N. Effects of Irregular Bathymetry on Hologram Formation of a Moving Source in Shallow Water. J. Mar. Sci. Eng. 2025, 13, 1775. [Google Scholar] [CrossRef]
- Kuz’kin, V.M.; Pereselkov, S.A. Holographic methods of hydroacoustic signals processing (review). Acoust. J. 2025, 71, 96–117. [Google Scholar]
- Hildebr, J.A.; Frasier, K.E.; Baumann-Pickering, S.; Wiggins, S.M. An empirical model for wind-generated ocean noise. J. Acoust. Soc. Am. 2021, 149, 4516–4533. [Google Scholar] [CrossRef]
- Cho, S.; Kim, S.; Kang, D.; Park, J. Wind-dependent ambient noise level estimation in shallow water using wind speed data. Ocean Engrg. 2021, 223, 108653. [Google Scholar] [CrossRef]
- Apel, J.R.; Badiey, M.; Chiu, C.S.; Finette, S.; Headrick, R.; Kemp, J.; Lynch, J.F.; Newhall, A.; Orr, M.H.; Pasewark, B.H.; et al. An overview of the 1995 SWARM (Shallow-Water Acoustic Random Media) shallow-water internal-wave acoustic scattering experiment. IEEE J. Ocean. Eng. 1997, 22, 465–500. [Google Scholar] [CrossRef]
- Tang, D.; Moum, J.N.; Lynch, J.F.; Abbot, P.; Chapman, R.; Dahl, P.H.; Duda, T.F.; Gawarkiewicz, G.; Glenn, S.; Goff, J.A.; et al. Shallow Water ’06: A joint acoustic propagation/nonlinear internal wave physics experiment. Oceanography 2007, 20, 156–167. [Google Scholar] [CrossRef]
- Wei, R.-C.; Chen, C.-F.; Chan, H.-C. Initial study of ambient noise modeling for the 2001 ASIAEX South China Sea experiment. J. Acoust. Soc. Am. 2004, 115, 2508–2509. [Google Scholar]
- Lynch, J.F.; Ramp, S.R.; Dahl, P.H.; Chiu, C.-S. Overview of results from the Asian Seas International Acoustics Experiment (ASIAEX) in the South China Sea 2001. IEEE J. Ocean. Eng. 2004, 29, 1067–1074. [Google Scholar] [CrossRef]
- Headrick, R.H.; Lynch, J.F.; Kemp, J.N.; Newhall, A.E.; von der Heydt, K.; Apel, J.; Badiey, M.; Chiu, C.; Finette, S.; Orr, M.; et al. Acoustic normal-mode fluctuation statistics in the 1995 SWARM internal-wave scattering experiment. J. Acoust. Soc. Am. 2000, 107, 201–220. [Google Scholar] [CrossRef]
- Kohler, W.; Papanicolaou, G.C. Wave propagation in a randomly inhomogeneous ocean. In Wave Propagation and Underwater Acoustics; Keller, J.B., Papadakis, J.S., Eds.; Lecture Notes in Physics; Springer: Berlin/Heidelberg, Germany, 1977; Volume 70, pp. 153–223. [Google Scholar]
- Jensen, F.B.; Kuperman, W.A.; Porter, M.B.; Schmidt, H.; Tolstoy, A. Computational Ocean Acoustics; Springer: Berlin/Heidelberg, Germany, 2011. [Google Scholar]
- Brekhovskikh, L.M.; Lysanov, Y.P. Fundamentals of Ocean Acoustics; Springer: Berlin/Heidelberg, Germany, 2013. [Google Scholar]
- Zayed, A.I.; García, A.G. New sampling formulae for the fractional Fourier transform. Signal Process. 1999, 77, 111–114. [Google Scholar] [CrossRef]
Disclaimer/Publisher’s Note: The statements, opinions and data contained in all publications are solely those of the individual author(s) and contributor(s) and not of MDPI and/or the editor(s). MDPI and/or the editor(s) disclaim responsibility for any injury to people or property resulting from any ideas, methods, instructions or products referred to in the content. |
© 2025 by the authors. Licensee MDPI, Basel, Switzerland. This article is an open access article distributed under the terms and conditions of the Creative Commons Attribution (CC BY) license (https://creativecommons.org/licenses/by/4.0/).