Abstract
In the last decade, many factors, such as socio-political and econo-environmental ones, have led to a perturbation in the timeline of the worldwide development, and especially in countries and regions having political changes. This led us to introduce a new idea of risk estimation taking into account the non-uniform changes in markets by introducing a non-uniform wavelet analysis. We aim to explain the econo-political situation of Arab spring countries and the effect of the revolutions on the market beta. The main novelty is first the construction of a dynamic backward-forward model for missing data, and next the application of random non-uniform wavelets. The proposed procedure will be acted empirically on a sample corresponding to TUNINDEX stock as a representative index of the Tunisian market actively traded over the period from 14 January 2016 to 13 January 2021. The chosen 5-year period is important as it constitutes the first five years after the revolution and depends strongly on the socio-econo-political stability in the revolutionary countries. The results showed the efficiency of non-uniform wavelets in explaining the dynamics of the market well. They therefore may be good tools to explore important phenomena in the market such as the non-stationary aspect of financial series, non-constancy, and time-varying parameters. These facts in turn will have positive implications for investors as well as politicians in front of the evolution of the market. Besides, recommendations to extend the present method for other types of wavelets and markets will be of interest.
Keywords:
wavelets; non-uniform wavelets; CAPM; wavelets CAPM; systematic (market) risk; scaling; Arab spring revolutions JEL Classification:
G11; C02; C22
1. Introduction and Motivations
It is well known that economies are based to a large extent on the corresponding financial markets, local as well as external. Local markets explain or reflect the internal policies of governments and the internal laws that govern the movement of money locally such as local prices, internal laws of economics and finance, production, development, etc. The interaction with foreign markets explains and reflects first of all the effectiveness of foreign affairs policy, import–export movements, the quality of the export, etc.
To control the situation of the market, controllers such as governments usually apply qualitative and quantitative measurements such as purses and/or indices. This permits econo-financial agents such as financial markets to reconcile the antagonistic objectives of their clientele such as profitability, security, and liquidity.
To guarantee non-risky or at least less risky (secure) portfolios, with high level of profitability, investors must take into consideration may factors, such as time, securities, risk, profitability, policies, etc (see, e.g., in [1,2,3,4,5,6,7,8]).
Since these studies, the CAPM has became a basic model in financial studies, and is permitted in many cases for the description of the links of some factors raised above. The CAPM, indeed, is a widely applied model to describe risky markets and to deduce their systematic risk. Its estimation therefore remains an important task in econo-financial studies. Empirically, it focuses on the impact of return interval on the betas. Existing studies somehow turn around the same idea of measuring the value of the beta according to the uniform intervals of time during a fixed period. However, its empirical validity has been investigated in [9]. Next, in the 1990s, the empirical studies have been established, raising in some cases the problem of time intervals in the use of the CAPM. Indeed, Fama-French stated in [10] that the classical method to deduce annual time intervals may not induce good results, and thus raised the necessity of using adapted time intervals for the estimation of systematic risk beta, such as monthly and weekly data due to many causes such as the seasonal effect of returns, the non-synchronization of actions, etc. (see, e.g., in [1,2,11,12,13,14,15,16,17,18,19,20,21,22,23,24,25,26,27]). However, many studies already taking into account the time factor in the CAPM validation have concluded that the estimations may lead to biased beta even when using monthly, weekly, and more precisely short (uniform) periods (see, e.g., in [28,29,30,31,32,33,34]). Recall that short uniform periods may induce a great problem of frequency estimation and/or volatility/fluctuation control in the market. In this context, the authors of [35,36] stated that the lack of distinction between the time domain and the frequency may be, indeed, causes of the the limitations of conventional approaches, see also in [37].
Due to these studies, a great interest in the time factor has been applied by researchers on the validity of the CAPM and the relationship between the systematic risk and the return of securities. This issue is still relevant in financial studies.
One of the recent tools involved in the econo-financial studies to understand and include the time factor in the models is the so-called wavelet approach. Indeed, wavelets form a mathematical tool that transforms time domain data into different frequency horizons. They have the advantage of being localized in both the time and frequency domains. Wavelets, since their appearance and especially their involvement in financial time series and economic models, showed their efficiency to offer sophisticated algorithms. They constituted attractive mathematical tools in the modeling of several complicated situations such as in economics and finance. Financial indices are usually volatility and highly fluctuated, which imposes the need for advanced mathematical tools for their study, such as wavelets which have shown ability to detect and/or localize fluctuations and volatility in time series generally.
Time series, as their name indicates, are time-based collections and/or observations over time, allowing identifying presumed changes. Many aspects and/or behaviour may be related and/or detected for time series such as cyclical, seasonal, irregular, and time-varying events. In seasonality, for example, the observations change in a regular and predictable way. Cycles are known to span time periods which may be either short or long. However, these characteristics may not describe well the real behaviour of the time series in the case of nonstationarity. The theory and practice of time series analysis have developed rapidly since its appearance in 1970. Non-stationary time series modeling has attracted a great deal of attention and effort from researchers, see in [38].
Many ideas have been investigated for understanding nonstationary cases, such as the lagged differences. In the literature, there are many statistical tests to detect the stationary/nonstationary aspect of a time series, such as the unit root test and the augmented Dickey–Fuller test. Nonstationary time series have means, variances, and covariances changing according time, causing their prediction to be difficult to model. Such situations appear in many applications especially economic and business, where the time series usually show time-varying levels, means, and/or variances. Besides, the trend in these cases is usually slow and may be upward or downward, steep or not, and exponential or approximately linear leading to nonstationarity. Many adaptive neural network models have been adopted to extend linear regressive models, such as ARMA and ARIMA models. Filtering methods such as detrending are also applied to decompose the time series into smaller parts which are quietly stationary. However, these considerations may not be effective in all cases and may hide the dynamics of the series. Some methods therefore apply autonomy of the time series to distinguish between internal and external dynamics of the series, see, e.g., in [39].
Time-varying parameters are also basic concepts in the study of nonstationary time series. For instance, the correlation between shocks to prices and shocks to variance is recently emphasized to show important asymmetries in the way in which variance responds to price changes [40]. It is well known nowadays that factor loadings are likely to vary through time, and thus constitute an important problem in estimations of time-series factor models. In [41], for example, it is stated that loadings may not be constant over time. The author there stated that in the case of market return for example, the loadings for each security may be estimated by just regressing the time series of returns on the time series of factor values. However, such a method is essentially limited by the a priori complete knowledge of a factor, see also in [42].
Another concept related to time series, especially nonstationary ones, is the so-called nonconstancy. Such a phenomenon may be investigated by the change point analysis by detecting structural breaks in the series. Even in the simplest models based on regression, the assumption of constant coefficients over time may not always be adequate. In many situations, instead, these are varying over time, such as dynamical, stochastic cases. Time-varying parameters are indeed widely applied in time series analysis such as time-varying structural VAR models in monetary policy and equity return prediction. Time-varying parameters also appear in interrupted time series analysis as time-varying confounders due to seasonal trends or intervention concurrent events. Many methods have been applied to investigate time-varying parameters such as splines, kernel-smoothing, and fuzzy logic [43].
Among wavelets and the models discussed above, in the literature there are several attempts to model, directly or indirectly, the nonstationarities of financial data such as exponential models. In [44], for example, the author investigated the problems time heterogeneity in the data for linear models. More precisely, different types of polynomials have been discussed for modeling issues. Recall that, obviously, the simplest way to extend linear models, which may be seen as Taylor’s first approximators of functions, in a time series when considered as a smooth function may be estimated by its Taylor polynomial to some degree. Three main issues have been raised by the author concerning the polynomial models: the near-multicollinearity problem, the time heterogeneity, and the misleading statistical results, see also in [45].
Related to the risk in markets, Marfatia developed a wavelet approach in [35] for the impact of risks in international stock markets by involving wavelet techniques into time-varying conditional volatility. The wavelet modeling permitted concluding that co-movement of risks between the US market and European markets are more strong explained at lower frequencies, by contrast to regional markets versus the country, where the co-movement is much stronger at higher frequencies, see also in [36].
Related to the CAPM, wavelet variants have been developed leading to the so-called wavelet CAPM (WCAPM) by analyzing data at different time scales, making it possible to overcome the inadequacies of the classical analysis of the CAPM. For more backgrounds on wavelets and their applications the authors may refer to the works in [46,47,48,49,50,51,52,53].
Besides, there are also many alternative methods applied to the understanding of the situation of markets and the risk. One well-known alternative is the so-called arbitrage pricing theory (APT). The multi-factor models known as three-factor Fama–French model is also an interesting alternative. It is consistent with the multi-factor models that assess performance via multiple factors while providing the maximum amount of information to measure and predict performance and ensure the best valuation of assets. This type of model considers the residual risk specific to the company and the systematic risk which affects the various companies in the economy. Note that in practice, the residual risk does not only reflect the specificity of the company, it is also the echo of information of a systematic nature which should be reflected, normally, by the beta. An interesting future direction may be the investigation of these models by means of non-uniform wavelets and multifractal analysis. For instance, it is well known that in financial crises, the government interferes to support firms from failing by nationalizing them, and vice versa. This intervention may be explained by conditional betas relative to after/before privatization or nationalization of firms. These factors may be evolved in the alternative methods also such as the APT and multi-factor models in general.
The present study lies in the whole scope of the integration and/or the study and evaluation of risks in stock markets according to time changes. Focus is put on the involvement of wavelet theory in estimating the systematic risk beta relative to crisis and precisely sharp socio-political movements.
The main aim of our present paper is to understand the nature of the relationship linking systematic risk and the return on equities for the Tunisian stock markets as a representative of the so-called Arab spring revolutionary countries. Recall that, compared to other countries in such a set, Tunisia is the most stabilized country that could pass the revolutionary period without great instability that is present in some other countries where post-revolution wars have broken out between the regimes and opposite parts. Such situations have now influenced the World by inducing great movement of illegal immigration, refugees movements, appearance and spread of terrorist organizations, etc.
The irregular movements have induced a perturbation in the timeline of the worldwide development, economy, finance, and especially in countries and regions having the socio-political changes. We aim precisely in the present work to introduce a new idea of risk estimation taking into account the non-uniform changes in markets by introducing a non-uniform wavelet analysis. We aim to explain the econo-political situation of Arab spring countries, and the effect of the revolutions on the market beta. The main novelty is first the construction of a dynamic backward-forward model for missing data, and another is the application of random non-uniform wavelets. The proposed procedure will be acted empirically on a sample corresponding to TUNINDEX stock as a representative index of the Tunisian market actively traded over the period 14 January 2016 to 13 January 2021. The chosen 5-year period is important as it constitutes the first five years after the revolution and depends strongly on the socio-econo-political stability in the revolutionary countries. The period of study is also characterized by the appearance of the COVID-19 pandemic. The influence of such a pandemic on the economic situations on countries worldwide is well known, especially the Arab spring ones. The crisis such as the COVID-19 pandemic have also shown the weakness in worldwide countries relationships and supports to each other during severe moments. Until now, many countries classified as poor suffer from the severe situation of the pandemic without real and high support in view of vaccination availability. From an empirical point of view, the approach may also be a real foundation for effective financial decisions, which depend usually on the accuracy of the valuation of the securities, their evolution, and their risks.
We recall, in particular, that Tunisia has a strategic geographic position in the middle of the South Mediterranean Sea, which allows it to be a central point in the interchanging between the north and the south rivers, and thus plays a great role in the economic, social, and political movements in this region of the world. Relatively to the present work, and especially to the period chosen for study, Tunisia has established a long-standing cooperation with the European Council since 2011, just after the revolution, to develop many sectors such as human rights, democracy, combating violence, improving the functioning of justice, and the fight against corruption, which were immediately reflected in the partnership with Tunisia especially in the period 2015–2021. These priorities have surely had a great effect on the stability of the country, and thus permits the investment and the development to be pursued. As a consequence, the different post-revolution governments have established many social, political, economic, and financial projects that have a direct impact on the national market as well as interacted ones. This makes it of interest to study such a market and understand its complexities.
Now, from a practical point of view, in the present case of study, the data collected, based on Yahoo finance and the website investing.com, unfortunately has many missing values, in different time positions such as the beginning, the mid, and the end of the period of investigation. Consequently, our work becomes a twofold study. In the first step, we developed a wavelet-based method to reconstruct missing data. It consists of the backward-forward method, in which we applied for indices starting adequately a forward prediction of the missing values, and for indices with missing data at the beginning we have applied a backward prediction to reconstruct the first values of the data. The missing mid values are estimated as averages of the application of the two previous procedures. The method looks like the lifting from a multi-resolution horizon to the previous, and vice versa. We then leveled the complete set is by the next applied for CAPM and thus the comprehension of the market.
The rest of the present work is organized as follows. In Section 3, a literature review on forecasting systematic risk is developed. Section 4 is devoted to the development of our methodology. We especially re-develop the wavelet analysis of time series briefly to apply it for missing data reconstruction which in turn will be applied for completing the data basis used later. The mathematical formulation of the CAPM is provided by the next. Finally, this section develops the wavelet CAPM. Section 5 gives our empirical results and their discussions on the Tunisian TUNINDEX stock market. Section 6 is a conclusion. The findings in the present work may provide a good basis for understanding current and future situation, and may thus be a basis for investors’ decisions in such markets. We intend that our method will be adapted to non-uniform, multifractal, random, and stochastic aspects in the market, and to explain the market situation at the crisis.
2. The CAPM and the Time Factor Review
This section is concerned with the literature review of the original construction of the CAPM. This comes back to the early 1950s in the works of Markowitz [6] on portfolio selection. Markovitz thought that the CAPM is mainly applied for solving the problem of portfolio’s structure. This requires an estimation of the demand function of assets to incorporate the quantified treatment of risk, which in turn leads to the investigation of the market’s equilibrium. However, Markovitz’s framework did not take into account the time factor, which causes a strong limitation. Besides, Markovitz’s model [6] stated that the investor optimal choices are based on the expected return of investments and the risk of the portfolio. The model suggests to select stocks relative to statistical criteria such as the profitability.
The original version of the CAPM has been a governing measure or index to explain and interpret the behaviour of the market for a long period such as the estimation of the capital cost for companies, the evaluation of the performance of managed portfolios despite the problems confronted in its empirical evaluation, and which are related to many causes in the market such as the availability of data.
The CAPM in its original and/or modified versions is based on many assumptions that should be taken into consideration, but which may not be satisfied simultaneously in all situations. These may be resumed into several points:
- mono-periodicity,
- market perfection aspect without taxes nor transaction costs,
- homogeneity in anticipations,
- unlimited short selling,
- loans and borrowing at the risk-free and limitless rate,
- strictly increasing and strictly concave Von–Neumann–Morgenstern utility functions,
- mean-variance preferences based on restrictions relating to the return or the utility function,
- investor aversion to risk,
- competition and market efficiency.
Over the next decade, the mathematical formulation has been put out by Sharpe who continued to exploit such a formalism and its efficiency in explaining the market movement and extended the CAPM to overcome some cases of limitations due to the last assumptions by proposing the so-called CAPM with non-homogeneous anticipations [54,55,56].
In a parallel time or direction, Lintner investigated the risk assets and the selection of stock portfolios, and the CAPM with taxes in [3,4]. Other extensions have been also proposed in [33,57,58] such as the CAPM with transaction costs and the CAPM in continuous time. In [59], however, the authors criticized the profitability of a stock as a criterion to confirm the opportunity of the investment, and stated instead that it is not sufficient to do. The authors assert that a good measure of the total risk of a portfolio may be the variance of its profitability.
Mathematically speaking, the CAPM is a linear relationship between the expected return on the share or portfolio and the market premium where the linearity coefficient is often denoted and is known as systematic risk. It tests the mean-variance efficiency and involves the ranking of assets and portfolios against systematic risks by practitioners. It thus analyzes the return and risk of an investment. In [4,8], the main idea of the CAPM turns around the estimation of the prices of transferable securities allowing supply and demand to be balanced and allowing a general equilibrium of the market. Sharpe proved effectively that for each asset i, the coefficient is the quotient of the covariance between the rate of return of asset i and the rate of return of the portfolio by the square of market risk. Other factors may affect the CAPM such as diversification, which is indeed strongly related to the behaviour of the expectation-variance of the portfolio. The contribution of each security to the expected profitability of the portfolio is in fact proportional to its expected profitability.
In the literature, despite the governance of the original versions of the CAPM for a long period in financial studies, many criticisms related to the portfolio and/or the market have been addressed for such versions. In [9], for example, an empirical criticism has been pointed out relative to the representative portfolio of the market, see also in [60,61,62].
The main drawback of these versions is that the estimated betas are assumed to be stable relatively to the time scale and thus relative to the whole period of study. However, in the real aspect of the financial market, the time factor is always present although being hidden in the model. For example, the standard deviation of the market is always variable according the time.
For this reason, many researchers have focused on the inclusion of the time factor, at least in the empirical extensions of the CAPM relatively to the time variations of the beta or the risk premium, or sometimes both of them. Marfatia and collaborators, for example, showed in a series of works [35,36,63,64,65] that different estimators of the risk may be obtained according to the difference in the time interval of returns (see also in [28,32]). Handa et al. rejected in [29] the monthly periods for the estimation of the CAPM beta, and accepted instead the annual returns.
The concept of time thus becomes a crucial and indispensable factor for the validity of the CAPM, and still constitutes an essential and relevant issue. One of the challenging ideas that has been recently involved in the CAPM, and in the investigation of financial markets, is wavelet theory, which essentially permits showing the presence of the time-scale division to overcome the shortcomings of the classical CAPM analysis. Our aim in the present work is to continue exploiting the validity of the CAPM by means of wavelet theory. The focuses are made on the Tunisian TUNINDEX stock market in a critical period known as the post-revolution state. We aim first to analyze the systematic risk and to point out its limitations taking into account the time factor. The second aim is to identify the relationship between equity returns and their systematic risks using the wavelet approach taking already the time factor into account.
To the best of our knowledge, the application of wavelets for revolutions’ transition periods, before and after needs more developments. The wavelet method however, has been applied for stable markets such as SP500 (USA), CAC40 (France), ISE (Istanbul) and GCC markets. The authors of [66] applied wavelets for the stock markets of the US, UK, and Germany to estimate the best time scale for measuring systemic risk. The authors concluded that the relationship between risk and return is a multi-scale phenomenon. The authors of [67] analyzed the Santiago stock market in Chile using time-scaling methodology. The authors of [68,69] studied the French CAC40 index as market portfolio and the daily EURIBOR as the risk-free rate. The predictions of the CAPM are claimed to be more relevant in the short term than in the long term, which makes the French market different from those of the US, UK, and Germany. The authors of [70] applied the wavelet multi-scaling method for the Istanbul Stock Exchange during the period from January 2003 to October 2007. It is shown that a positive relationship between risk and returns is most significant at the medium levels, concluding that the effect of market returns on an asset is stronger in this time horizon. In [47], the author developed a wavelet study for the largest GCC market Saudi Tadawul in order to understand such market on a critic period which post follows many important movements infusing directly and strongly on the market. In the next section, we will address the details of our mathematical methodology in exploiting wavelet theory differently from existing works in the analysis of the CAPM.
For more details, background, and applications of wavelet theory in finance, economics, management, and actuarial sciences, the readers may refer to the works in [46,47,48,49,50,51,52,53,66,67,71,72,73,74,75,76,77,78,79,80,81,82,83,84].
3. Wavelets for Financial Series Processing
3.1. The Wavelet Processing Classical View
A wavelet may be defined simply as a short wave function oscillating as the cosine and sine waves, but with high frequency and small support. Such a behaviour is known as the localization in time-frequency, and/or time-space. As in Fourier analysis, to analyze signals such as financial time series, wavelet analysis also is based on a type of transform defined by means of a convolution of the analyzed signal with wavelets obtained from the same source function called the mother wavelet, a square-integrable function with enough vanishing moments (oscillating) with necessary zero mean. To analyze financial time series, the mother wavelet should satisfy the hypothesis
known as the admissibility condition (see in [85,86,87,88,89]). These wavelets are obtained by translation, and dilation of the mother wavelet by means of a dilation factor (known as the scale), and a translation factor (known as the position) as
Therefore, the continuous wavelet transform (CWT) of an analyzed function is
which depends as its form shows on the scale and the position parameters. This explains its nomination as the CWT of F at the scale a and the position b.
In the case of discrete signals such as the financial time series, this is of course evaluated by means of the discrete integrals or the discrete convolution. Indeed, it is proved in wavelet theory that a restrictive version of the CWT (called the discrete wavelet transform (DWT)) suffices to overcome many cases such as the financial series. It is obtained by restricting the scale and position factors to discrete grids. The most commonly known restriction is the dyadic grid , and , . The wavelet is therefore written as
The discrete wavelet transform (DWT) (called also the wavelet coefficient or detail coefficient at the level j, and the position k) is defined by
In wavelet theory, we know that the set constitutes an orthonormal basis of , and consequently any element F may be decomposed in a series
known as the wavelet series of F, and guarantees a reconstruction formula of the original analyzed function F.
In the case of a discrete function S, such as the financial time series, this formulation may be easily adapted, by means of a convolution product permitting to write the wavelet detail coefficients as a convolution product:
This decomposition of the series S into an orthogonal-wise components series may be explained also and equivalently by means of a multi-resolution framework by splitting it into two orthogonal parts,
relative to a fixed integer . If we denote for , (known as the detail spaces), and (known as the approximation spaces), we get in one hand an orthogonal decomposition . On the other hand, the part
(called the approximation of F at the level , which is also the projection of F on ) belongs to , and the part
(called the detail component of F at the level j, which is also the projection of F on ) belongs to the space . In other words, the series S is written as
It holds that the component describes the global behavior, the trend, or the shape of S, and a second part reflects the higher frequency oscillations or the fine scale deviations of the series near its trend.
To compute or evaluate these parts, we do not necessarily need to compute all the coefficients appearing in the decomposition. We instead serve of some filters and algorithms permitting to reduce the cost of the computation. Indeed, it holds in wavelet theory that there exists a special function (known as the scaling function or the father wavelet) for which , where the ’s are defined similarly to the . Such function is related to the mother wavelet by means of the so-called 2-scale relation
where
The approximation will be therefore expressed by means of the basis of as
where the coefficients (known as the approximation or scaling coefficients of S) are evaluated as the by replacing the function by . The relation (12) permits to compute the wavelet coefficients recursively as
and
This means that the wavelets permit to deduce the decomposition of the series S at different levels from each other by means of the filters (discrete wavelet low-pass filter) and (discrete wavelet high-pass filter).
In practice, obviously, a restriction a maximal level is needed. For this, we fix two integers and consider the approximation
The lower index is in fact more flexible, does not have an important effect on the total decomposition, and is usually chosen to be 0. The choice of J is always critical, and is related to the eventual error estimates relative to the error applied to get the closeness of to the origin S, see in [85,86,87,88,89] for more details.
3.2. The Non-Uniform Wavelet Processing
Non-uniform wavelets constitute an extension or improvement of wavelets by involving some modifications on the original way of use of wavelets. In the original wavelet analysis, we usually search for perfect representations of functions, time series, and generally analyzed objects by means of a set of uniformly spaced samples. However, in nature, and practice, it may exists many cases of objects with non-uniformly spaced samples such as structures sampled well below the Nyquist rate. Indeed, the authors investigated in [90] a new approach called non-uniform wavelet sampling based on combining wavelet preprocessing with non-uniform sampling in order to alleviate the main issues of existing converter solutions, such as signal noise. A specialized variant of nonuniform wavelet band-pass sampling has been proposed by combining traditional band-pass sampling with nonuniform wavelet sampling. The method has been shown to be performant and efficient relative to the classical approaches.
In [91], a framework of non-uniform wavelets has been proposed for a special choice of Haar wavelet. Non-uniform Haar scaling and wavelet functions have been been introduced provided with a corresponding non-uniform multi-resolution analysis and non-uniform wavelet transform and inverse transform. The approach has been tested for the case of bounded intervals, compression, and reconstruction.
In [92], the dependence or the link between returns, betas, and the return interval has been investigated. Based on the well-known Fama-french three-factor model, the authors showed that both the mean returns and the betas are affected by the choice of time interval over which returns are measured. The authors proposed there the use of stochastic (thus, non-uniform) time intervals to describe more the situation of the market.
In the present work, we are concerned with this last approach, which will be applied as a suitable non-uniform wavelet sampling for the study of the CAPM. Other examples and methods to construct non-uniform wavelets and sampling may be found in [90]. To do this, we will recall here the construction of the non-uniform Haar wavelet due to the work in [91].
The Haar wavelet and multi-resolution systems are based on the Haar scaling function , and the mother wavelet . The idea to construct a non-uniform scaling function, nun-uniform wavelet, and a non-uniform corresponding multi-resolution analysis adapted to time series starts by subdividing the time interval of the series into suitable subdivision. Assume without loss of the generality that the series is defined on an interval and let be a partition of I, with given such that , where
for all , and . For each m, there will be a non-uniform scaling function defined on each interval by
Similarly, the non-uniform wavelet will be defined as
where
The non-uniform multi-resolution analysis will be the sequence of spaces
as approximation spaces, and
as detail spaces. In [91], it is proved that this construction leads as in the classical cases, to a 2-scale relation and some construction/reconstruction algorithms. More precisely, the following result is proved.
Proposition 1
([91]). The functions and satisfy the following relations.
Let be written as
We have the following filter rules for the reconstruction,
and the following for the decomposition,
4. Methodology
Our aim, as raised above, is the development of a general version of the CAPM that takes into account two main factors—the missing data and the time factor—by applying wavelet time-frequency analysis. Our new idea consists first in applying a backward-forward method to reconstruct missing data, and next a non-uniform time scaling in the evaluation of the wavelet CAPM by means of a set of non uniformly-timed samples corresponding to the so-called non-uniform wavelets instead of classical wavelets.
4.1. The Original Mathematical Formulation of the CAPM
The CAPM in its initial form is mathematically expressed by means of the equation
based on the return rate of an action i at the period time t denoted , the return of the market measured by means of a general index at the same period of time t and denoted , the beta coefficient or the systematic risk which is a specific factor to each action i that indicates the relation between the fluctuations of the return rate of the action i, and the fluctuations of the general index of the market. This is denoted here as . The factor is a random factor relative to the hidden facts of the return that are not explained by the market. It is generally an error term. Finally, the parameter is a calibration factor for a null expectation of the error .
According to the model (19), the CAPM splits the total variability of an action into two main parts: One part is relative to the market, and corresponds to the systematic risk. The second is related to the specific characteristics of the action, and reflects the variations of the specific prices of such action.
In the literature, due to the movements in the markets, the appearance of new crises, and many socio-political and economic movements in the world, the CAPM has been modified many times to be adapted to the situation studied. For example, in [8] the risk beta is evaluated as the ratio of the covariance of the assets and the market by the variance of the market during the whole period of study,
leading to an expectation based formulation
where is the expected return of the action i, is the expected return of the market, and is the so-called remuneration of the risk-free.
Another form of the CAPM depends on the number of investors in the market. Denote K as the total number of such investors, and assume that each investor must allocate a wealth in a number of actions. The risk beta is evaluated as the ratio the covariance between the return of action i and the portfolio by the variance of the optimal portfolio (relative the the k-th investor), . The CAPM is written in the form
where is the expectation of the return of action i, and is the expectation of the return of the optimal portfolio detained by the k-th investor, see in [1,2,58].
Some extending variants of the CAPM may be also found in the literature, such as the inflation-based CAPM, taxation-based CAPM [93], and CAPM depending on heterogeneity of anticipations [70].
In our present work, the model of the CAPM is expressed by means of Equation (21), where we recall that is the expected return due to the asset i, is the risk-free rate, is the market portfolio expected return, and is the measure of risk for asset i evaluated by means of Equation (20).
Now, empirically, as in the literature, the risk or the coefficient will be evaluated by applying the usual ordinary least square method via a linear regression on the form
where the index t is designated for the time, is the error term, and is a calibration or regulation constant. By means of the variance measure, this means that the variance of the asset i is split into two parts such as
The first part corresponds to the firm’s systematic risk and the second part corresponds to the firm’s unsystematic risk.
4.2. Backward-Forward Wavelet Reconstruction of Missing Data
The present section is concerned with the development of a wavelet approach for the well-known problem of missing and uncertain data confronted usually in financial time series. We aim to develop a prior procedure to complete the gaps of data used in the study. Indeed, in the present case of study, we noticed that in the origin data bases such as web sites, although they are widely used, there is a significant lack of data. Usually the simple method to fill the gaps in the data may be done by searching for different suppliers. This in turn may lead to uncertain data, costs, and also loss of time. We thus thought about using sophisticated methods to fill the gaps of data instead of applying non-scientific methods.
Our procedure to be applied here is in fact a modified or a compilation of the one developed in [47,49] to reconstruct missing data in short time intervals, differently from classical methods where in the majority of cases, the prediction is just applied to construct future values based usually on a long-time training interval from past values. In the present study, some cases of data have missing values in the beginning (the past) that need to be filled. Moreover, in some situations such as the target period applied here, some characteristics such as seasonality, periodicity and/or autoregressive aspect could not be applied. This is obvious for many causes, such as the main characteristic of the period which is known as the spring Arab revolution period, and which in turns was followed by many important political, social, financial and economic movements not present in the past, and which the governments work hardly to overcome them.
Let be the financial time series. To be adequate with the notations of statistical series, we will write , , the financial series, and consider its wavelet decomposition at a level J, relative to a (father,mother) wavelet system ,
The missing values are classified into two classes.
- For a missing value , , we compare the lengths of the known segments after and before these values. We next chose the one with greater length. Denote, for example, such greater length, and the interval corresponding.
- Consider next the truncated time series corresponding to , , and its wavelet decomposition as in (25).
- If is an after-interval to the missing value, we estimate the value by
- If is a before-interval to the missing value, we estimate the value bywhere K is a suitable prediction kernel, and h is a suitable prediction window.
- Whenever the after and before intervals have the same length we take the mean value of the two predicted ones.
- It remains the case where many successive values in the series are missing. We thus consider the extremities of the missing segments as starting points to be predicted.
- Finally, each predicted value is added to the series, and the new series is reconsidered for the next step.
In the present work, a recursive procedure is applied as in [94], by acting the previous rules (26) and (27) on the approximation and the detail coefficients by considering
and similarly
This means that to forecast the value of the series, the procedure is transformed to the prediction of its wavelet/scaling components. We thus obtained a dynamic recursive scheme consisting in applying first a partial estimator at short horizons to all the observations to yield first the predicted values. These values are included as new observations to predict the next. We then follow the same steps until reaching the desired horizon. For backgrounds, more details, and other applications of analog methods to the present one, the readers may refer to the works in [47,82,94,95].
4.3. The Wavelet CAPM Processing
The idea of the wavelet estimation of the CAPM goes back essentially to the works in [52,67,75]. In the first references, the authors introduced the general framework of wavelet analysis of time series and the eventual applications in finance and economics. Next, Fernandez [67] has focused essentially on the CAPM and its improvement by means of wavelets by adopting the time scale factor in the empirical study. The investigations and applications of the wavelet methods in the CAPM have been next growing up (see in [23,34,35,47,52,53,65,66,67,68,69,70,71,75,76,78,83,84]).
The wavelet CAPM consists in decomposing the variance of the financial series issued from the whole market index, and the actions in the market (or the portfolio) into sub-variances corresponding to the decomposition levels j (called the j-level variance or the variance at the scale j). More precisely, denote as in the previous sections , a financial time series, and its variance. Denote also the variance of the projection on the j-level approximation space due to the multi-resolution. The variance is split as
This leads to the analysis of the sub-variances relative to the different horizons j instead of the total one, which facilitates the analysis and the interpretation. The j-level variance is evaluated as in [47,48,67,70] as
where L is the length of the wavelet filter, is the number of wavelet coefficients involved in the j-level approximation of the series, and stands for the number of boundary wavelet coefficients at the level j. The same principle will be also applied for the j-level covariance between a couple of financial series
To apply our wavelet method to the estimation of the CAPM, the series considered will be replaced by the returns due to the market and those due to the actions. The coefficient beta estimated in (20) will be replaced by the so-called wavelet beta at the level j as
where is the wavelet covariance of the component i of the portfolio with the market at the scale j estimated by (30), with X being replaced by the j-level approximation/details of the return , and Y is replaced by the j-level approximation/details of the return , and finally, is the j-level wavelet variance due to the j-level approximation/details of the return of the market.
The final step allowing to explain the explanatory power of the market returns on the portfolio returns, is concerned to the estimation of the determination coefficient for each return time scale as follows:
The main procedure in the present work is to serve of the non-uniform wavelet analysis to estimate the risk beta, compare with existing methods (based on uniform estimations), and deduce eventually the power of the new process. We will thus denote for the rest of the paper to designate the classical beta estimated without use of wavelets, to designate the classical wavelet beta, and to designate the non-uniform wavelets introduced here. Similarly, we will adopt the same notations (upper-scripts) for the R2 determination coefficient.
5. The Multifractality of the Market
Financial time series are always characterized by the stylized facts. The nature or aspect of the distribution tail must be noted. This may be done via the kurtosis measure which permits to confirm if the series is leptokurtic or not.
Financial time series have also high-frequency components, explained by the volatility clustering. This behavior is always explained by the presence of many hidden factors and/or aspects such as the random or stochastic behavior of markets.
To understand these problems in the market, the researchers have included the so-called scaling law invariance in the study of the volatility or the market in general. Many tools have been thus investigated for the aim of understanding aspects of nonstationary, autoregression, filtering, support vector machine models and prediction, neural networks models, and predicting.
However, it seems that wavelets are the last tool involved, and are the most efficient compared to past tools. In financial series, indeed, there are underlying the fluctuations causal information cascades from increasing (large) to decreasing (small) time scales called self-similarity law or generally scaling law. Such facts may be easily visualized with the wavelet representation.
To confirm the presence of the fractal/multifractal behaviour of the market, such as the self-similarity, a multifractal test should be done consisting in evaluating the multifractal spectrum of the index.
An original way to evaluate such a spectrum starts by evaluating the increments of the index. For a series S, these are defined as
for a suitable subdivision of the time interval. Next, we compute an associated partition function by means of the q-increments as
The scaling law is obtained by regressing the logarithm of the partition function against the step time in the sense that
The scaling function yields next the multifractal spectrum by means of the Legendre transform
In general, for monofractal series, we get a linear scaling function. In the case where the series is volatile (highly volatile), the scaling function should be a concave curve. Therefore, the multifractal test will consist in visualizing the scaling law function or equivalently the multifractal spectrum .
Another way to explore the volatile behavior of the market is to conduct the so-called detrended fluctuation analysis (DFA) in its original form or its recent wavelet extension. The DFA of the series , starts by computing its integrated form
where is the mean value of the series . Next, let be fixed and , be a subdivision of the time interval . For all k, the least squares fit (denoted ) of the series is associated . An overage fluctuation function is next introduced as
The DFA consists in evaluating the power-law dependence of the function on n. When , the series is self-fluctuating with scaling exponent .
The DFA is next extended or improved by the so-called multifractal detrended fluctuation analysis (MDFA), which is based essentially on two parameters:
- the Hurst–Hölder exponent which permits to estimated the local regularity of the series and consequently leads to the fluctuations inside it and
- the multifractal spectrum of the series which allows to conclude about its possible multifractality of it.
The main idea improved by the MDFA is by considering general increments of the form
for . Such an increment should be next estimated as
The exponent plays the role of the so-called Hurst–Holder exponent.
However, to avoid the difficult use of the functional spaces mathematical definition of such exponents, the MDFA has been re-developed using the wavelet tools. Indeed, in the wavelet MDFA (WMDFA), the partition function is defined as
at a level of decomposition j. the are the well-known wavelet coefficients (detail) or sometimes the wavelet leaders (applied in the last variant of WMDFA). To test the multifractal structure and compute next the multifractal spectrum, we seek a function that reflects the scaling law of as
Backgrounds and details on multifractal analysis of financial (time) series, DFA, MDFA, and WMDFA may be found in [46,70,85,86,96,97,98,99,100,101,102,103,104,105].
6. Empirical Results and Discussions
In this part, we will examine the influence of non-uniform time scale law on the understanding of the systematic risk beta relative to the Tunisian index TUNINDEX due to the Tunisian market as a representative of the so-called spring Arab countries. The influence of the political and social movements and instabilities on the economic situation and the future of the market will be investigated. In the literature on the CAPM, it is confirmed that a linear dependence between the action’s returns and their systematic risks, and the risk of the market return exists. However, the dependence on the time scale is always hidden, and not explained explicitly in the mathematical model. Therefore, empirical investigations remain necessary to check such a dependence and influence. We thus focus in the present work on testing the hypotheses stating that
- The time scale law explains the stability/instability of the risk beta.
We propose in the empirical section to test a wavelet methodology of beta estimation on daily returns for TUNINDEX collected in the period of 14 January 2016 to 13 January 2021 resulting of a sample size . We focused on a portfolio composed of 73 actions as listed in Table 1 with corresponding sectors. According to the Tunisian stock market web site, the first Tunisian market index was launched in 30 September 1990 under the name of BVMT index. TUNINDEX index and sector indices were created in 31 December 1997 and 31 December 2005, respectively. Theses indices aim to provide managers, analysts, and savers with a measure of portfolios performance and stock market activities as a whole. Upon the decision of the expert committee, since 2 January 2009, the BVMT index is no longer disseminated and the method of calculation of the TUNINDEX index and the sector indexes are changed. The TUNINDEX index and the sector indexes are no longer weighted by the total market capitalization but by the free float adjusted market capitalization. This method of calculation, already used for other major indices around the world, ensures greater coherence between the real nature of companies on the market and how it is expressed in the indices (see http://www.bvmt.com.tn/en-gb/content/documentation, accessed on 12 September 2021). In fact, during 2008–2013 a slightly different composition has been approved, but with no essential and great difference with the present one. It is based on the sector indices listed as Automobiles and parts, Banks, Construction, Consumer Goods, Industries, Raw Materials, Consumer Services, Financial Services, and Financial Companies. However, such a subdivision did not focus on the Energy sector for example, which is an important one in the econo-financial market in Tunisia as Oil and Phosphate are main energy exportation products. Therefore, an independent consideration of this sector is of great interest. Healthcare also is an active and very important sector. Recall that Tunisia was one of the rare countries that reached zero Corovavirus cases during the first waves of COVID-19. Tunisia has also been participating in fighting COVID-19 in many European countries such as Italy and Germany by medical groups. However, in the last period, the country was confronted with a severe wave of COVID-19. The majority of analyzers explained this fact by the wide corruption in the last governments, especially the last one. Besides, the inexperienced governments after the revolution are a strong cause of some failures. The sector of Technology did not appear also in the 2008–2013 composition, despite its importance. Recall here that a large number of industrial technological companies already have branches installed in Tunisia, due to the qualified and also cheap labor as well as the short distance to Europe. The sector of Transportation also needs to be considered because of its basic role in the daily life of the people. It also serves to the transportation of import–export goods and materials such as Oil and Phosphate, and agricultural crops such as olive oil, dates, etc.

Table 1.
Tunindex companies and sectors.
The choice of this market is motivated by the fact that Tunisia is a representative country of the so-called Arab spring, as the target period of study which concerns the first 5 years after the revolution and depends strongly on the socio-econo-political stability in the revolutionary countries. In the end of this period, the situation of the country has been affected by the appearance of the pandemic COVID-19, which has a severe influence on the economic situation in all the world, especially the Arab spring countries where the political situation remained unstable. Besides, and although many factors influenced the economic development in Tunisia, the strategic geographic position of the country in the mid of the south Mediterranean sea, allows it to be a central point in the interchanging between the north and the south rivers, and thus plays a great role in the economic, social and political movements in this region of the world. Thus, a long-standing cooperation has been established with the European council since 2011, just after the revolution, to develop many sectors such as human rights, democracy, combating violence, improving the functioning of justice, the fight against corruption, which were immediately reflected in the partnership with Tunisia especially in the period 2015–2021. These priorities will have surely a great effect on the stability of the country, and thus permit the investment and the development to be pursued. It is also worth to notice that compared to other Arab spring countries, Tunisia is the most stabilized country that could pass the revolutionary period without a great instability as in some others where after-revolution wars have been broken out between the regimes and opposite parts. Such situations have now influenced quasi all the world by inducing great movement of illegal immigration, refugees movements, appearance and spread of terrorist organizations, etc.
Now, the first step consists in using a wavelet (uniform or non-uniform) method to reconstruct missing data. On the total basis, we recorded a total number of 206 missing values dispersed on the whole market, on different time dates (daily) as in Table 2. A complete and adjusted basis on the period of study is thus obtained and applied by the next.
Table 2.
Missing data.
We propose to study the relationship between excess return on each individual stock and the time scales of market portfolio using (23). The daily return of each stock is estimated as a log-price difference
where is the price of asset i at day t. The market return is similarly evaluated as a log-difference
where is the index value at day t.
Table 3 below shows the descriptive statistics of the market. The statistics correspond precisely to the relatively risk-free return excess for each company.
Table 3.
Descriptive statistics of excess returns.
Note from Table 3 that the skewness is non-vanishing for all the stock, which rejects the asymmetry hypothesis. Besides, the kurtosis shows a non-normal value and/or behavior (being different from 3).
Moreover, in the present case, approximately zero mean and median values are obtained. The flatness and distortion features of all stocks’ returns are different from each other. Moreover, the Jarque–Bera test results in , which rejected the null hypothesis at the 5% significance level, and 0 otherwise.
Notice from Table 3 that, as in the majority of studies of financial markets, the return excess of actions relatively to the risk-free as well as the return excess of the market relatively to its risk-free have always low skewness and high kurtosis.
We may further notice that the standard deviation measure is approximately small, which reflects the small deviation of the prices around their mean value. The latter being approximately null, and sometimes negative’ this means that the overall market is characterized by a very slow movement, sometimes a backlash and depression rather than a development in a positive direction. Again, the JB test residues in the fact that the market is not developing a normal distribution way, which confirms and/or encourages the proposition of the investigation of other models for the market, and may be nonlinear ones as proposed later in the conclusion.
Our analysis acts by projecting Equation (23) relatively to time scales to test the effect of time on the systematic risk beta. This will be conducted by splitting the market returns into crystals or horizons relative to different time scales instead of using the classical periods such as weeks, moths, years.
The coefficients of the linear regressions will be estimated by the usual ordinary least square (OLS) estimates of the returns on the one of the market for each level j. This leads to a j-level mathematical formulation as
The correspondence scale and dynamic days applied here are resumed in Table 4.
Table 4.
Time scales.
6.1. The Original CAPM Processing
The first step is concerned with the estimation of the different regressions of the return excess of actions relatively to the one of the market at different scales obtained by the OLS estimates methods due to the classical method based on the dyadic scales. These estimates are resumed in Table 5.
Table 5.
2-Scale law estimations of the return excess of actions on the market.
Note from Table 5 there exits some perturbed linearity between the multi-scale return and systematic risk. Some linear relations are almost positive, while some others are moderately positive. However, no universal law of positivity is dominating for the whole market. A great number of actions are negatively related to the market index. The global view could not permit to conclude a strong interpretation of the evolution of the market. Looking at the individual results indicates a perturbation to conclude if the relationship becomes stronger at the lower, medium, or higher scales. The only conclusion that may be deduced is the existence of the linear relationship, although weak, and some times opposite from horizon to another. The perturbation may be of course a cause of the non-resistance of the market according to time indicator. It may be also due to the lack of many hidden factors that are not involved in the mathematical model such as policy actions, local economic policy, etc. Besides, the perturbation if it is not re-studied and denounced by other methods, means that some crisis is always present in the market explained by an opposite variation of the actions and the market. Mathematically and empirically speaking, Table 5 shows that no strong or confirmed law may be expected simultaneously for all the contribution of the relative to all components of the market based on the time scale. To confirm or denounce, or to understand more the findings in Table 5, the corresponding determination coefficient R2 is computed and presented in Table 6.
Table 6.
The 2-scale law determination coefficient R2 relative to Table 5.
Note from Table 6 that there exists a decreasing aspect of the coefficient R2 according to the time scale. However, it already also presented some perturbation in such a monotony, which is indeed not conserved along all time horizons, especially in the fourth (16–32 dynamic days) and the fifth (32–64 dynamic days) horizons. Globally, at low horizons the market is going down. Economically speaking, this is bad information for small companies and/or short investments.
The next step permits a thorough visual explanation of the situation of the market via the eventual link between the actions’ returns and the one of the market. Figure 1 below illustrates the 2-scale time law recomposed crystal of the excess return on the stock versus the corresponding crystal on the market portfolio.
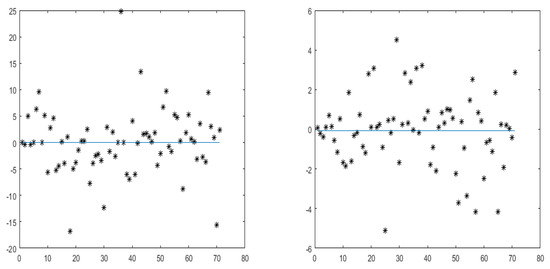
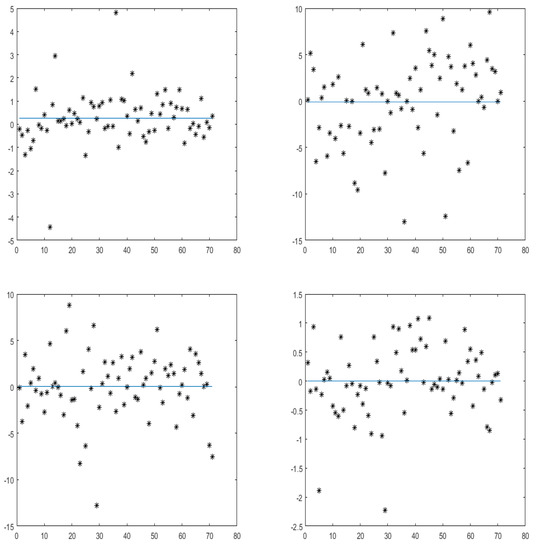
Figure 1.
Excess market return (horizontal axis) versus excess return of the action (vertical axis) for different time scales with the 2-scale law.
In Figure 1, the daily stock returns versus the corresponding stock beta at different time scales are plotted. By inspecting such a representation, it is noticeable that the linearity is confirmed between the average betas of stocks and average returns at every scale (regardless of whether it is strongly positive). This reinforces the usual finding about the CAPM as linear relationship. However, such figure shows clearly the suffering of the market from a serious crisis. Indeed, the market did not conserve the same resistant linearity along the whole period for the majority of actions. At law horizons (scale 1), the linearity is clear and becomes perturbed at the scale 2, to return acceptable at scale 3, perturbed at scale 4, and quietly acceptable at scales 5 and 6. This evidence supports the proposition to act more sophisticated tools to zoom out the market and to discover the hidden behavior. Besides, the figure confirms our conclusion previously about the market being non encouraging for small companies and short investments. The next section essays to overcome these problems by adopting wavelet tools.
6.2. The (Wavelet) Multifractal Processing
In financial case, for example, the studies have shown that the tail distribution is not leptokurtic but in the contrary, it has a kurtosis exceeding the normal case. In the present case, a kurtosis value over-crossing the normal one is detected in quasi all the statistical series. Moreover, the skewness induces for many times some negative values which means that the data are spread out more to the left relatively to the mean of the series than to the right.
To clearly show how highly volatile the market is, a wavelet analysis is conducted in order to appear eventual fluctuations. Such analysis yielded the following illustrations in Figure 2 relative to the wavelet decomposition at the level 6 by means of a uniform wavelet decomposition, see Figure 2.
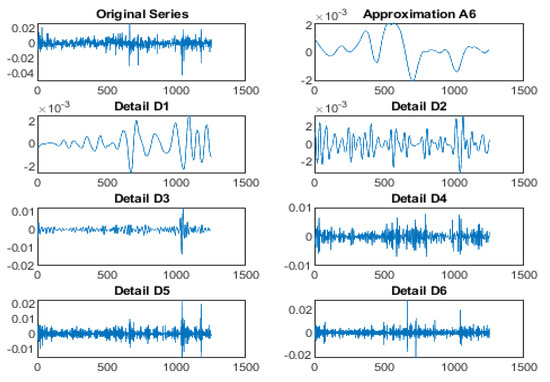
Figure 2.
Wavelet decomposition of Tunindex return series at level 6.
The volatile behavior of the TUNINDEX is clearly shown, which confirms and the idea is to prove the existence of a fractal/multifractal scaling law in the TUNINDEx series, and/or its components. We thus proceed as mentioned previously by plotting its Hurst–H″ older exponent or its spectrum of singularities. This is illustrated by Figure 3 below.
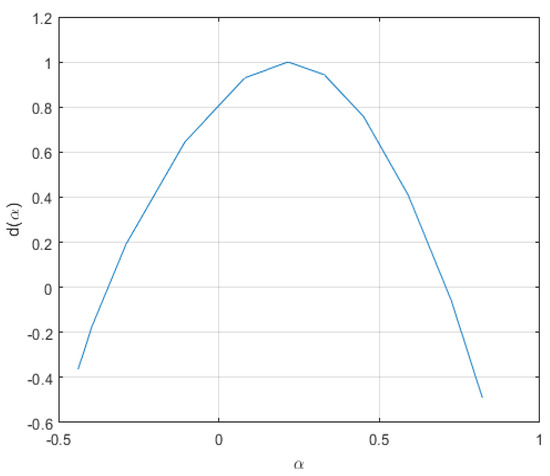
Figure 3.
The multifractal spectrum of Tunindex return series.
Notice from these illustrations that although the wavelet applied is not necessarily non-uniform, the market shows a concave nonlinear scaling function, or equivalently a nonlinear concave multifractal spectrum. This means that the market is multifractally volatile and it represents a point-wise scaling behavior with a point-wise changing Hurst–Holder exponent. This motivated the application of wavelet tools to explore its structure as well as its behavior by means of the CAPM.
6.3. The Classical Wavelet CAPM Processing
The CAPM wavelet approach estimates the systematic risk beta on a scale-by-scale wavelet decomposition of the financial time series. The wavelet variance of the market index and the covariance between the market and the components is computed to obtain a scale-by-scale estimate of stock’s beta. Table 7 represents theses estimations for all the stock components using a uniform wavelet decomposition at the levels .
Table 7.
Uniform wavelet beta for each level.
Notice from Table 7 that the linear dependence between the market index and the actions becomes more illustrated relative to the previous method. Some cases have yielded zero coefficient beta by means of the previous method; however, the wavelet procedure better explained the dependence or the contribution of these actions in the market, although being negative for some cases (see, for example, the AB, ATB, and OTH actions), and some times returns to be perturbed at high scales. This means that to explore really the situation of this type of markets, and/or the at-the-crisis situations, more macroscopic and microscopic tools should be applied to detect the hidden facts. To explore more the dependence detected via the uniform wavelets, and to confirm the efficiency of the wavelet tool, R2 determination coefficient relative to the estimations in Table 7 is provided hereafter in Table 8. It represents precisely the determination coefficient R2 relative to the betas of each stock component at the wavelet levels .
Table 8.
Uniform wavelet relative to Table 7 for each level.
Table 8 presents some acceptable coherence with the results on the uniform wavelet beta estimation illustrated in Table 7, although being quietly null in some cases. The market appears to be efficient at low and medium scales, and the R2 determination coefficients shows some decreasing behavior at low scales; however, it returns to be increasing at medium horizons. This means that to invest in such a market, investors need may be to come over the microscopic and macroscopic scales of the market, and also to explore more adequately different panels to conclude about the best or good returns sectors.
In the TUNINDEX market, it appears that banking sector at low/medium horizons may be encouraging, reminiscent of some risk at high scales, which may be really explained by the instability of the market due to the political and social situations. The Food sector seems to be risky and unstable, although it contains the daily needs of consumers. This may be due to the high increase in food prices compared to the economic situation of the society where a big percentage of the people becomes increasingly poor due to unemployment situation. We notice also that transportation sector is suffering, which is the most comprehensible task due to the COVID-19 pandemic which affected the air transportation sector severely. The real estate, construction, and housing sectors present a slight positive evolution, which may be explained by the fact that in the crisis, the prices in such a sector may decrease, and the facilities of purchasing may be offered by the banks and/or the government to maintain some liquidity in the market. Recall in this context that the migrants and over-broad citizens are the major mass active in this sector.
Besides, the most important notification is the fact that although some encouraging situations appeared in some horizons, such a situation did not resist in all time scales. The evolution of the market according to the time scales already present some perturbations. There are actions and sectors that start to be positively progressing which by the next present some deficiency. The findings in Table 7 and Table 8 are confirmed by the next by the graphical illustrations in Figure 4 hereafter which represents the overage of wavelet excess return of the actions versus the wavelet excess return of the market at the same levels .
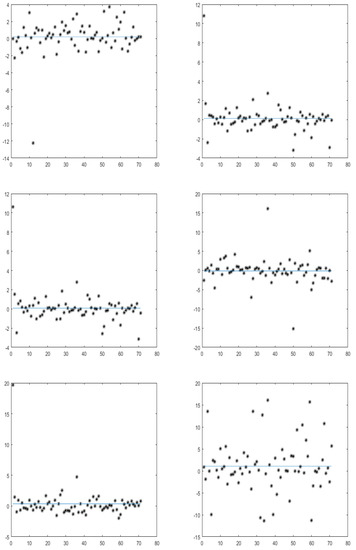
Figure 4.
Uniform wavelet excess market return (horizontal axis) versus uniform wavelet excess return of the action (vertical axis) at levels j = 1, 2, 3, 4, 5, 6.
Notice from Figure 4 that the linearity illustrated clearly. However, the perturbed aspect of the market is also clearly shown at the lower level and the highest level. This may be a bad signal for investors who is/are preparing to a long time investment. This lead us to think about acting the non-uniform wavelet procedure in order to explore more the market evolution.
6.4. The Non-Uniform Wavelet CAPM Processing
In the present section, the purpose is to improve the WCAPm by using non-uniform wavelets. We hypothesize that such type of wavelets will lead to a best exploration of the market comprehension.
The idea empirically acts by similar way as the in the last part based on the dyadic wavelets. In the present part, we applied a non-uniform scaling law for the time intervals and the wavelets supports defined in Section 3.2. By choosing suitable parameters for the subdivision generated by means of a random process
relative an interval . In our case, the parameters are fixed to , where T is the size of the time series TUNINDEX, m is the maximum level, which is also the number of time interval sub-segments, fixed here to . The result of the non uniform wavelet estimation of the systematic risk beta results in 6 levels (chosen deliberately to be adequate with the previous methods). The estimations are gathered in Table 9 where for each scale, the non uniform wavelet variance of the market return and the non uniform wavelet co-variance between the market return and the stock return is computed to obtain a scale-by-scale estimate of stock’s beta.
Table 9.
The non-uniform wavelet beta for each level.
Notice from Table 9 that in contrast to the previous cases, the linear dependence between the market and the actions is confirmed with no zero coefficients. Besides, such dependence is sometimes strongly negative or strongly positive, even for a same action at different time horizons (which may be observed since the first action AB). Compared to the previous methods, the market seems to suffer from unstable situation according to the time factor, which is conformed also in the previous sections. This makes the authorities manly to think about the real causes behind these fragile and ambiguous situation. The main causes in our opinion are, as we said in the abstract and the introduction
- the unstable political situation in the country during this period.
- the possible corruption in the governments during this period.
- the social movements and strikes which yielded a migration of many investors.
However, although many actions in the market have shown some perturbation, the majority or the global view of the market shows that some stability may occur from time to time, but at random periods distributed randomly on the time horizons. These facts allow the investors, analysts, and authorities to think and chose intelligently about the time of investment, and also the time of surveys studies conducted to conclude about the situation of the market. In other words, the non-uniform method tells us that the market is not progressing uniformly as we thought previously, but, in contrast, short horizons sometimes, may be good moments to act even in the moment of long crises.
Now, as in the previous studies, the estimations are followed by the computation of the R2 coefficient of determination. This is the subject of Table 10 below which shows precisely the estimations of the determination coefficient R2 relative to the betas of each stock component estimated in Table 9 at the non uniform wavelet levels .
Table 10.
Non-uniform wavelet relative to Table 9 for each level.
Table 10 shows a coherence with results on the non-uniform wavelet estimation of the systematic risk beta. The market is globally efficient but with some non monotone coefficient R2. In fact, we may notice that in the majority of cases, the determination coefficient decreases as with increasing time scale. This may lead to some corrections and improvements on the previous interpretations. Indeed, although some random deficiencies appear for some actions, globally the market will reach some equilibrium after a long time. This equilibrium has to be well predicted. This lead us to return to the previous idea of intelligently choosing the time of investment and surveys about the market. We think that during the unstable political and social movements, it would not be good to fix at advance the time scales and act according to them. By contrast, predictions may be done at the basis of non-uniform time scales. The global or major stability due to the non-uniform time and wavelet scales is shown clearly in Figure 5 hereafter which illustrates the overage of non-uniform wavelet excess return of the actions against the non-uniform wavelet excess return of the market at the different wavelet levels .
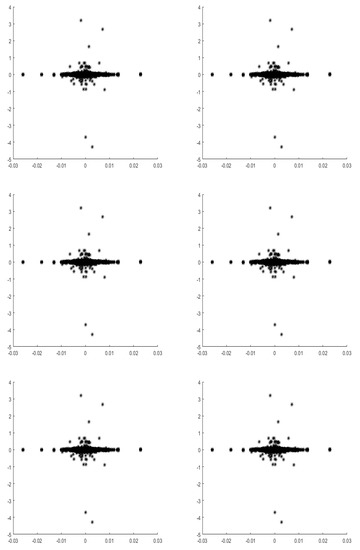
Figure 5.
Non-uniform wavelet excess market return (horizontal axis) versus non-uniform wavelet excess return of the action (vertical axis) at levels j = 1, 2, 3, 4, 5, 6.
6.5. The Sectorial CAPM
This last section concerns a sectorial study of the market in which the classification into sectors is used to explore the situation of the TUNINDEX stock market via the CAPM. Table 11, Table 12 and Table 13 show effectively that the grouping of the market components into sectors may allow us to carry a clear, global view of the market. Indeed, we notice that on 36 coefficients, a minimum of 29 ones are positive for the first method, 28 for the second and 32 coefficients are positive for the non uniform wavelet method. This somehow confirms that although these positivities did not resist on the same law, they explain some good hope, prospect and/or trust to the market. We notice also as in the previous sections that the sector of consumers, and finance are the most leading ones.
Table 11.
The 2-scale mean beta for each sector.
Table 12.
The uniform wavelet mean Beta for each sector.
Table 13.
The non-uniform wavelet mean Beta for each sector.
To resume, especially from the practical point of view, the present paper permitted many conclusions. The first is related to the nature and/or structure of the markets such as emerging ones, and/or unstable ones. Such types of markets should not be investigated by applying the same tools as other developed markets and stable ones. The unstable markets should be explained first by using non-uniform time scales differently from the classical way. Using such random or nonuniform scales will permit to discover and/or to detect may be good moments in these markets as well as the resisting components. For instance, in the present example of TUNINDEX stock market, we although noticed that some sectors, even though moving slowly, they succeeded to maintain a positive development along the period of the crisis such as real estate and consumer. The empirical results permitted to maintain the idea of taking into consideration cultural factors, such as the level of education, the openness of the people to other cultures, the religious effects as important factors that may be behind the failure or the crisis in developing markets especially in the crisis moments. The economic factors and the political stability in their abstracted means may not good parameters to decide on the situation and the future of the market. The empirical results permit also to confirm that markets are always governed by uncertainty and/or randomness in the applied models. This encourages and permits to practitioners as well as theoreticians to improve the existing models and to explore more ideas.
The main advantage of the non-uniform wavelet CAPM is summarized by its ability to fit or follow the random, uncertain, and/or unpredicted behavior of the market movement in situations like the Arab spring revolutions. This fact benefits the investments in such markets and also the aid from worldwide authorities and institutions such as the International Monetary Fund. The old methods have one disadvantage, that is, the negative view to these markets. However, it should explore each case of critical socio-economic movements by means of different cameras. This means that no uniform system can explain the markets simultaneously. For instance, a simple comparison between the case of Tunisia and the closest country to it, Libya, there is a big difference between the two tracks or paths. If the study focuses on the economic track solely, we may notice no essential difference, especially at short horizons. However, the nature and the culture of the two peoples is the main factor that made the difference. We thus may deduce from the present study that differences in educational status may change investment decisions.
Nevertheless, the present method has limitations. The first is universal and related to the choice of the wavelet basis applied. There is in fact no theoretical criterion that may be used to fix the wavelet in advance. It is, however, the empirical study that confirms the efficiency of the wavelet bases compared to each other. The second limit is also due to the adaptability of the same theoretical tool such as the wavelets here to another case of study. An efficient basis for the Tunisian market may not be efficient in the Libyan one for example.
Besides, we think that the CAPM itself should be improved. Alternative methods may evolve other factors especially hidden ones, such as political and social. These factors are always qualitative, and thus should be converted to quantitative forms to be included. A main idea may be the exploration of such factors by means of random/stochastic/fuzzy variables, leading to conditional/fuzzy betas. Recall that in the literature, many alternative methods have been applied to explain the market beta. One well-known alternative is the so-called arbitrage pricing theory (APT). Besides, the multifactor models are generally good alternatives to the CAPM such as the three factor Fama–French model. An interesting future direction may be the investigation of these models by means of non-uniform wavelets, and multifractal analysis. For instance, it is well known that in a financial crisis the government interferes to support firms from failing by nationalizing them, and vice versa. This intervention may be explained by conditional betas relative to after/before privatization or nationalization of firms. These factors may be evolved in the alternative methods also such as the APT and multifactor models in general.
7. Conclusions
In this paper, we proposed a wavelet multifractal procedure to estimate the systematic risk beta via the so-called CAPM. The main idea consists in testing the volatile behavior of the market to act next to a non-uniform version of wavelet analysis. Compared to the existing methods, the new process of non-uniform wavelets has been proved to be more efficient and powerful in exploiting the CAPM to explore the market situation.
The theoretical methodology is applied on the case of the Tunisian TUNINDEX stock market as a representative market of the so-called Arab spring countries. The study is conducted during a critical period chosen deliberately to contain the after period of the Arab spring revolutions, and also the first COVID-19 pandemic wave appearance.
The study shows that in contrast with the existing studies, especially the old ones, the inclusion of the non-uniform time scales law is adequate to understand the situation of the market during the unstable period and the crisis.
The empirical results showed that socio-political movements may induce dynamics in the market that may not be detected well by applying old methods. However, the non-uniformity in the real movement of the society and the market may be well explained by the use of adapted functional bases and/or tools such as the non-uniform random wavelets. The results show also that the applied method may be also adapted to investigate other behaviour in the market such as the non-stationary, the non-constancy, and time-varying parameters in financial time series. Understanding and modeling well these complicated aspects of the market will prepare to a good investment and policies.
Besides, we think that more investigations of different wavelet functions and markets will be of interest, by considering comparisons between these functional bases, and also comparisons between markets based on their common and different aspects. As an example, we may cite the characteristic of different cultures for those countries have Arab spring revolutions. The cultural level and education had a key role in the post-revolution stability. It will be of great interest to include these factors in the study of the market models. The present method, although it indicates the presence of these factors even though hidden, could not explain them nor adequately explore their influence.
The main idea of this paper is to introduce, for example, a conditional beta before and after an event such as a revolution. We may also introduce a conditional beta relative to after/before privatization or nationalization of firms. These phenomena obviously occur in non-uniform and independent times to each other relative to the situation of the firm and the government.
Finally, related to alternative methods or extensions of the CAPM such as the Fama–French model, an interesting extension may be based on polynomial models. For instance, a quadratic form may be obtained by evolving a nonlinear square term due to the market risk, which may be understood as a higher-order moment to obtain a new extended model:
where is the excessive return of the portfolio or the action i relative to the risk free rate, at the time t. , are variables representing the market risk, size, and value, respectively, at time t. , , , and are the coefficients to be estimated relative to the variables , , , and , respectively, at time t. The parameter explains the abnormal return of the portfolio i at the time t. Finally, is a residual term relating to the portfolio i at the instant t. Investigating such a model by means of uniform and non-uniform wavelets will be an interesting future direction.
Author Contributions
Conceptualization, M.S. and A.B.M.; Methodology, M.S. and A.B.M.; Software, M.S. and A.B.M.; Validation, M.S. and A.B.M.; Formal analysis, M.S. and A.B.M.; Investigation, M.S. and A.B.M.; Resources, M.S. and A.B.M.; Data curation, M.S. and A.B.M.; Writing—original draft preparation, M.S. and A.B.M.; Writing—review and editing, M.S. and A.B.M.; Visualization, M.S. and A.B.M.; Supervision, M.S. and A.B.M.; Project administration, M.S. and A.B.M.; Funding acquisition, M.S. and A.B.M. Both authors have read and agreed to the published version of the manuscript.
Funding
This research received no external funding.
Institutional Review Board Statement
Not applicable.
Informed Consent Statement
Not applicable.
Data Availability Statement
Not applicable.
Acknowledgments
The authors would like to thank the editors and anonymous reviewers for the interest given to our work and for the valuable comments which improved it.
Conflicts of Interest
The authors declare no conflict of interest.
References
- Black, F.; Jensen, M.C.; Scholes, M. The capital asset pricing model: Some empirical tests. In Studies in the theory of Capital; Jensen, M.C., Ed.; Praeger: New York, NY, USA, 1972. [Google Scholar]
- Black, F. Capital Market Equilibrium with Restricted Borrowing. J. Bus. 1972, 45, 444–455. [Google Scholar] [CrossRef]
- Lintner, J. Security Prices and Maximal Gaines from Diversification. J. Financ. 1965, 20, 587–615. [Google Scholar]
- Lintner, J. The Valuation of Risk Assets and the Selection of Risky Investments in Stock Portfolios and Capital Budgets. Rev. Econ. Stat. 1965, 47, 13–37. [Google Scholar] [CrossRef]
- Litzenberger, R.H.; Ramaswamy, K. The effect of personal taxes and dividends on capital asset prices: Theory and empirical evidence. J. Financ. Econ. 1979, 7, 163–195. [Google Scholar] [CrossRef]
- Markowitz, H. Portfolio Selection. J. Financ. 1952, 7, 77–91. [Google Scholar]
- Mossin, I. Equilibrium in a Capital Asset Market. Econometrica 1966, 34, 768–783. [Google Scholar] [CrossRef]
- Sharpe, W.F. Capital asset prices: A theory of market equilibrium under conditions of risk. J. Financ. 1964, 19, 425–442. [Google Scholar]
- Roll, R. A critique of the asset pricing theory’s tests, Part I: On past and potential testability of the theory. J. Financ. Econ. 1977, 4, 129–176. [Google Scholar] [CrossRef]
- Fama, E.F.; French, K.R. The CAPM is Wanted, Dead or Alive. J. Financ. 1996, 51, 1947–1958. [Google Scholar] [CrossRef]
- Aydogan, K. An Investigation of Long Cycles in Common Stock Returns (Random Walk). Ph.D. Thesis, Syracuse University, Syracuse, NY, USA, December 1986. [Google Scholar]
- Banz, R.W. The relationship between return and market value of common stock. J. Financ. Econ. 1981, 9, 3–18. [Google Scholar] [CrossRef]
- Basu, S. The relationship between earnings’ yield, market value and return for NYSE common stocks-further evidence. J. Financ. 1977, 32, 663–681. [Google Scholar] [CrossRef]
- Breeden, D. An Intertemporal Asset Pricing Model with Stochastic Consumption and Investment Opportunities. J. Financ. Econ. 1979, 73, 265–296. [Google Scholar] [CrossRef]
- Chae, J.; Yang, C. Which idiosyncratic factors can explain the pricing errors from asset pricing models in the Korean stock market? Asia-Pasific J. Financ. Stud. 2008, 37, 297–342. [Google Scholar]
- Chan, L.K.; Lakonishok, J. Are the reports of beta’s death premature? J. Portf. Manag. 1993, 19, 51–62. [Google Scholar] [CrossRef]
- Fama, E.F. Efficient capital markets: A review of theory and empirical work. J. Financ. 1970, 25, 383–417. [Google Scholar] [CrossRef]
- Fama, E.; French, K. The Cross-section of Expected Stock Returns. J. Financ. 1992, 47, 427–465. [Google Scholar] [CrossRef]
- Fama, E.; French, K. Common risk factors in returns on stocks and bonds. J. Financ. Econ. 1993, 33, 3–56. [Google Scholar] [CrossRef]
- Fama, E.; French, K. The Capital Asset Pricing Model: Theory and Evidence. J. Econ. Perspect. 2004, 18, 25–46. [Google Scholar] [CrossRef]
- Fama, E.; French, K. The Value Premium and the CAPM. J. Financ. 2006, 61, 2163–2185. [Google Scholar] [CrossRef]
- Fama, E.; MacBeth, J. Risk, return and equilibrium: Empirical tests. J. Political Econ. 1973, 81, 607–636. [Google Scholar] [CrossRef]
- Galagedera Don, U.A. A review of capital asset pricing models. Manag. Financ. 2007, 33, 821–832. [Google Scholar] [CrossRef]
- Gibbons, M.R. Multivariate tests of financial models: A new approach. J. Financ. Econ. 1982, 10, 3–27. [Google Scholar] [CrossRef]
- Gursoy, C.T.; Rejepova, G. Test of capital asset pricing model in Turkey. J. Dogus Univ. 2007, 8, 47–58. [Google Scholar] [CrossRef][Green Version]
- Handa, P.; Kothari, S.P.; Wasley, C. The relation between the return interval and beta: Implications for size-effect. J. Financ. Econ. 1989, 23, 79–100. [Google Scholar] [CrossRef]
- Kothari, S.; Shanken, J. On defense of beta. In The Revolution in Corporate Finance; Stern, J., Chew, D., Jr., Eds.; Blackwell Publishers Inc.: Malden, MA, USA, 1998; pp. 52–57. [Google Scholar]
- Cohen, K.; Hawawin, G.; Mayer, S.; Schwartz, R.; Witcomb, D. The Microstructure of Securities Markets; Prentice-Hall: Sydney, Australia, 1986. [Google Scholar]
- Handa, P.; Kothari, S.P.; Wasley, C. Sensitivity of multivariate tests of the CAPM to the return measurement interval. J. Financ. 1993, 48, 1543–1551. [Google Scholar] [CrossRef]
- Ho, Y.W.; Strange, R.; Piesse, J. CAPM anomalies and the pricing of equity: Evidence from the Hong Kong market. Appl. Econ. 2000, 32, 1629–1636. [Google Scholar] [CrossRef]
- Karan, M.B.; Karadagli, E. Risk return and market equilibrium in Istanbul stock exchange: The test of the capital asset pricing model. J. Econ. Adm. Sci. 2001, 19, 165–177. [Google Scholar]
- Levhari, D.; Levy, H. The Capital Asset Pricing Model and the Investment Horizon. Rev. Econ. Stat. 1977, 59, 92–104. [Google Scholar] [CrossRef]
- Merton, R.C. An Intertermporal Capital Asset Pricing Model. Econometrica 1973, 41, 867–887. [Google Scholar] [CrossRef]
- Perold, A. The Capital Asset Pricing Model. J. Econ. Perspect. 2004, 18, 3–24. [Google Scholar] [CrossRef]
- Marfatia, H.A. A fresh look at integration of risks in the international stock markets: A wavelet approach. Rev. Financ. Econ. 2017, 34, 33–49. [Google Scholar] [CrossRef]
- Marfatia, H.A. Wavelet Linkages of Global Housing Markets and Macroeconomy. 2017. Available online: https://ssrn.com/abstract=3169424 (accessed on 20 July 2021).
- Kishor, N.K.; Marfatia, H.A. The time-varying response of foreign stock markets to US monetary policy surprises: Evidence from the Federal funds futures market. J. Int. Financ. Mark. Inst. Money 2013, 24, 1–24. [Google Scholar] [CrossRef]
- Ni, H.; Yin, H. Self-organising mixture autoregressive model for non-stationary time series modelling. Int. J. Neural Syst. 2008, 18, 469–480. [Google Scholar] [CrossRef]
- Manuca, R.; Savit, R. Stationarity and nonstationarity in time series analysis. Physica D 1996, 99, 134–161. [Google Scholar] [CrossRef]
- Bandi, F.M.; Reno, R. Time-varying leverage effects. J. Econom. 2012, 169, 94–113. [Google Scholar]
- Rosenberg, B. Extra-market components of covariance in security returns. J. Financ. Quant. Anal. 1964, 9, 263–274. [Google Scholar] [CrossRef]
- Chow, M.; Zu, J.; Shifren, K.; Zhang, G. Dynamic Factor Analysis Models with Time-Varying Parameters. Multivar. Behav. Res. 2011, 46, 303–339. [Google Scholar] [CrossRef] [PubMed]
- e Silva, P.C.D.L.; Junior, C.A.S.; Alves, M.A.; Silva, R.; Cohen, M.W.; Guimarães, F.G. Forecasting in Non-stationary Environments with Fuzzy Time Series. Appl. Soft Comput. 2020, 97, 106825. [Google Scholar] [CrossRef]
- Michaelides, M.; Spanos, A. On modeling heterogeneity in linear models using trend polynomials. Econ. Model. 2020, 85, 74–86. [Google Scholar] [CrossRef]
- Dette, H.; Wu, W.; Zhou, Z. Change point analysis of correlation in non-stationary time series. Stat. Sin. 2019, 29, 611–643. [Google Scholar] [CrossRef]
- Balalaa, M.S.; Ben Mabrouk, A.; Abdessalem, H. A wavelet-based method for the impact of social media on the economic situation: The Saudi Arabia 2030-vision case. Mathematics 2021, 9, 1117. [Google Scholar] [CrossRef]
- Ben Mabrouk, A. Wavelet-Based Systematic Risk Estimation: Application on GCC Stock Markets: The Saudi Arabia Case. Quant. Financ. Econ. 2020, 4, 542–595. [Google Scholar] [CrossRef]
- Ben Mabrouk, A.; Kortass, H.; Ben Ammou, S. Wavelet Estimators for Long Memory in Stock Markets. Int. J. Theor. Appl. Financ. 2009, 12, 297–317. [Google Scholar] [CrossRef]
- Ben Mabrouk, A.; Kahloul, I.; Hallara, S.-E. Wavelet-Based Prediction for Governance, Diversification and Value Creation Variables. Int. Res. J. Financ. Econ. 2010, 60, 15–28. [Google Scholar]
- Ben Mabrouk, A.; Ben Abdallah, N.; Hamrita, M.E. A wavelet method coupled with quasi self similar stochastic processes for time series approximation. Int. J. Wavelets Multiresolut. Inf. Process. 2011, 9, 685–711. [Google Scholar]
- Ben Mabrouk, A.; Zaafrane, O. Wavelet Fuzzy Hybrid Model for Physico Financial Signals. J. Appl. Stat. 2013, 40, 1453–1463. [Google Scholar] [CrossRef]
- Percival, D.B.; Walden, A.T. Wavelet Methods for Time Series Analysis; Camridge University Press: New York, NY, USA, 2000. [Google Scholar]
- Selcuk, F. Wavelets: A new analysis method (in Turkish). Bilkent J. 2005, 3, 12–14. [Google Scholar]
- Sharpe, W.F. Computer-Assisted Economics. J. Financ. Quant. Anal. 1970, 5, 353–366. [Google Scholar] [CrossRef]
- Sharpe, W.F. Stock market price behavior. A Discuss. J. Financ. 1970, 25, 418–420. [Google Scholar]
- Sharpe, W.F. Portfolio Theory and Capital Markets; McGraw-Hill College: New York, NY, USA, 1970. [Google Scholar]
- Brennan, M.J. Taxes, market valuation and corporate financial policy. Natl. Tax J. 1970, 23, 417–427. [Google Scholar] [CrossRef]
- Lévy, H. Equilibrium in an imperfect market: A constraint on the number of securities in the portfolio. Am. Econ. Rev. 1978, 68, 643–658. [Google Scholar]
- Vasichek, A.A.; et McQuown, J.A. Le modèle de marché efficace. Anal. Financ. 1973, 15, 71–84. [Google Scholar]
- Desmoulins-Lebeault, F. Distribution of Returns and the CAPM Empirical Problems; Post-Print halshs-00165099; HAL: Lyon, France, 2003. [Google Scholar]
- Magni, C.A. Project selection and equivalent CAPM-based investment criteria. Appl. Financ. Econ. Lett. 2007, 3, 165–168. [Google Scholar] [CrossRef]
- Magni, C.A. Project valuation and investment decisions: CAPM versus arbitrage. Appl. Financ. Econ. Lett. 2007, 3, 137–140. [Google Scholar] [CrossRef][Green Version]
- Marfatia, H.A. Impact of uncertainty on high frequency response of the US stock markets to the Fed’s policy surprises. Q. Rev. Econ. Financ. 2014, 54, 382–392. [Google Scholar] [CrossRef]
- Marfatia, H.A. Monetary policy’s time-varying impact on the US bond markets: Role of financial stress and risks. N. Am. J. Econ. Financ. 2015, 34, 103–123. [Google Scholar] [CrossRef]
- Marfatia, H.A. Investors’ Risk Perceptions in the US and Global Stock Market Integration. Res. Int. Bus. Financ. 2020, 52, 101169. [Google Scholar] [CrossRef]
- Gençay, R.; Whitcher, B.; Selçuk, F. Systematic Risk and Time Scales. Quant. Financ. 2003, 3, 108–116. [Google Scholar] [CrossRef]
- Fernandez, V. The CAPM and value at risk at different time-scales. Int. Rev. Financ. Anal. 2006, 15, 203–219. [Google Scholar] [CrossRef]
- Rhaiem, R.; Ben Ammou, S.; Ben Mabrouk, A. Estimation of the systematic risk at different time scales: Application to French stock market. Int. J. Appl. Econ. Financ. 2007, 1, 79–87. [Google Scholar]
- Rhaiem, R.; Ben Ammou, S.; Ben Mabrouk, A. Wavelet estimation of systematic risk at different time scales, Application to French stock markets. Int. J. Appl. Econ. Financ. 2007, 1, 113–119. [Google Scholar]
- Aktan, B.; Ozturk, M.; Rhaeim, N.; Ben Mabrouk, A. Wavelet-Based Systematic Risk Estimation An Application on IstanbulStock Exchange. Int. Res. J. Financ. Econ. 2009, 23, 34–45. [Google Scholar]
- Cifter, A.; Ozun, A. Multiscale Systematic Risk: An Application on ISE 30; MPRA Paper 2484; University Library of Munich: Munich, Germany, 2007. [Google Scholar]
- Cifter, A.; Ozun, A. A signal processing model for time series analysis: The effect of international F/X markets on domestic currencies using wavelet networks. Int. Rev. Electr. Eng. 2008, 3, 580–591. [Google Scholar]
- Conlon, T.; Crane, M.; Ruskin, H.J. Wavelet multiscale analysis for hedge funds: Scaling and strategies. Physica A 2008, 387, 5197–5204. [Google Scholar] [CrossRef]
- DiSario, R.; Saroglu, H.; McCarthy, J.; Li, H. Long memory in the volatility of an emerging equity market: The case of Turkey. Int. Mark. Inst. Money 2008, 18, 305–312. [Google Scholar] [CrossRef]
- Gençay, R.; Selçuk, F.; Whitcher, B. An Introduction to Wavelets and Other Filtering Methods in Finance and Economics; Academic Press: San Diego, CA, USA, 2002. [Google Scholar]
- Gençay, R.; Whitcher, B.; Selçuk, F. Multiscale systematic risk. J. Int. Money Financ. 2005, 24, 55–70. [Google Scholar] [CrossRef]
- In, F.; Kim, S. The hedge ratio and the empirical relationship between the stock and futures markets: A new approach using wavelet analysis. J. Bus. 2006, 79, 799–820. [Google Scholar] [CrossRef]
- In, F.; Kim, S. A note on the relationship between Fama-French risk factors and innovations of ICAPM state variables. Financ. Res. Lett. 2007, 4, 165–171. [Google Scholar] [CrossRef]
- In, F.; Kim, S.; Marisetty, V.; Faff, R. Analysing the performance of managed funds using the wavelet multiscaling method. Rev. Quant. Financ. Account. 2008, 31, 55–70. [Google Scholar] [CrossRef]
- Sharkasi, A.; Crane, M.; Ruskin, H.J.; Matos, J.A. The reaction of stock markets to crashes and events: A comparison study between emerging and mature markets using wavelet transforms. Physica A 2006, 368, 511–521. [Google Scholar] [CrossRef]
- Soltani, S. On the use of the wavelet decomposition for time series prediction. Neurocomputing 2002, 48, 267–277. [Google Scholar] [CrossRef]
- Soltani, S.; Modarres, R.; Eslamian, S.S. The use of time series modeling for the determination of rainfall climates of Iran. Int. J. Climatol. 2007, 27, 819–829. [Google Scholar] [CrossRef]
- Xiong, X.; Zhang, X.; Zhang, W.; Li, C. Wavelet-based beta estimation of China stock market. In Proceedings of the 4th International Conference on Machine Learning and Cybernetic, Guangzhou, China, 18–21 August 2005. [Google Scholar]
- Yamada, H. Wavelet-based beta estimation and Japanese industrial stock prices. Appl. Econ. Lett. 2005, 12, 85–88. [Google Scholar] [CrossRef]
- Arfaoui, S.; Rezgui, I.; Ben Mabrouk, A. Wavelet Analysis on the Sphere, Spheroidal Wavelets; Degryuter: Berlin, Germany; Boston, MA, USA, 2017; ISBN 978-3-11-048188-4. [Google Scholar]
- Arfaoui, S.; Ben Mabrouk, A.; Cattani, C. Wavelet Analysis Basic Concepts and Applications, 1st ed.; CRC Taylor-Francis, Chapmann & Hall: Boca Raton, FL, USA, 2021. [Google Scholar]
- Daubechies, I. Ten Lectures on Wavelets; Society for Industrial and Applied Mathematics: Philadelphia, PA, USA, 1992. [Google Scholar]
- Hubbard, B.B. The World According to Wavelets: The Story of a Mathematical Technique in the Making; Ak Peters Ltd.: New York, NY, USA, 1998. [Google Scholar]
- Mallat, S.A. Wavelet Tour of Signal Processing, 3rd ed.; Academic Press: Cambridge, MA, USA, 2008. [Google Scholar]
- Pelissier, M.; Studer, C. Non-Uniform Wavelet Sampling for RF Analog-to-Information Conversion. IEEE Trans. Circuits Syst. I Regul. Pap. 2018, 65, 471–484. [Google Scholar] [CrossRef]
- Dubeau, F.; Elmejdani, S.; Ksantini, R. Non-uniform Haar wavelets. Appl. Math. Comput. 2004, 159, 675–693. [Google Scholar] [CrossRef]
- Brennan, M.; Zhang, Y. Capital Asset Pricing with a Stochastic Horizon. J. Financ. Quant. Anal. 2020, 55, 783–827. [Google Scholar] [CrossRef]
- Friend, L.; Landskroner, Y.; Losq, E. The demand for risky assets and uncertain inflation. J. Financ. 1976, 31, 1287–1297. [Google Scholar] [CrossRef]
- Ben Mabrouk, A.; Ben Abdallah, N.; Dhifaoui, Z. Wavelet decomposition and autoregressive model for time series prediction. Appl. Math. Comput. 2008, 199, 334–340. [Google Scholar] [CrossRef]
- Zhang, K.; Gençay, R.; Yazgan, M.E. Application of wavelet decomposition in time-series forecasting. Econ. Lett. 2017, 158, 41–46. [Google Scholar] [CrossRef]
- Angue, K. Régression Floue: Principes et Applications en Sciences de Gestion; Université de Nice Antipolis, Laboratoire Gredge: Angers, France, 2007. [Google Scholar]
- Arfaoui, S.; Ben Mabrouk, A.; Cattani, C. Fractal Analysis Basic Concepts and Applications, 1st ed.; World Scientific: Singapore, 2021. [Google Scholar]
- Azizieh, C. Modélisation de Séries Financières par un Modèl Multifractal. Mémoire pour Diplôme d’Actuaire; Université Libre de Bruxelles: Brussels, Belgique, 2002. [Google Scholar]
- Chen, Y.; Yang, B.; Dong, J. Time-series prediction using a local wavelet neural network. Neurocomputing 2006, 69, 449–465. [Google Scholar] [CrossRef]
- Chou, R.Y. Forecasting financial volatilities with extreme values: The conditional autoregressive Range (CARR) model. J. Money Credit. Bank. 2005, 37, 561–582. [Google Scholar] [CrossRef]
- Hafner, C.M. Cross-correlating wavelet coefficients with applications to high-frequency financial time series. J. Appl. Stat. 2012, 39, 1363–1379. [Google Scholar] [CrossRef]
- Mitra, A.; Mitra, S. Forecasting business cycle mouvements using wavelets filtering and neural networks. Financ. India 2004, 18, 1605–1626. [Google Scholar]
- Struzik, Z.R. Wavelets Methods in Financial Time Series Processing, Physica A: Statistical Mechanics and its Applications; Elsevier: Amsterdam, The Netherlands, 2001; Volume 296, pp. 307–319. [Google Scholar]
- Walter, C. Les échelles de temps sur les marchés financiers. Rev. Synthèse 2001, 4, 55–69. [Google Scholar] [CrossRef]
- Wong, H.; Ip, W.C.; Xie, Z.; Lui, X. Modelling and forecasting by wavelets, and the application to exchange rates. J. Appl. Stat. 2003, 30, 537–553. [Google Scholar] [CrossRef]


Publisher’s Note: MDPI stays neutral with regard to jurisdictional claims in published maps and institutional affiliations. |
© 2021 by the authors. Licensee MDPI, Basel, Switzerland. This article is an open access article distributed under the terms and conditions of the Creative Commons Attribution (CC BY) license (https://creativecommons.org/licenses/by/4.0/).