Abstract
The irreducible water saturation of reservoirs seriously restricts the efficient drainage of unconventional energy sources. NMR logging can be used to determine parameters such as total porosity, effective porosity, irreducible water saturation, and permeability, which play an important role in oil and gas identification. T2 cut off value identification using the NMR T2 spectrum is the key to clarifying the irreducible water saturation of unconventional reservoirs. In this paper, saturation and centrifugal T2 spectra of sandstone and coal samples are used to study and calculate the T2 cut off value, with methods including single fractal dimension, multi-fractal dimension, and spectrum morphological discrimination; in addition, the applicability of these three methods in characterizing T2 cut off is discussed. According to the morphological difference of the saturated T2 spectrum, relationships between morphological parameters and the T2 cut off of four types of sample are described. The parameters related to T2 cut off can be divided into two types: (1) the first type includes morphological parameters main peak position (TM) and smaller-pore volume percentage (SPVP); with an increase of T2 cut off, TM increases linearly and SPVP decreases exponentially, and the correlation between SPVP and T2 cut off is stronger than that of TM. (2) The other type includes fractal parameters D2 (fractal dimension of larger pore), D−10 – D10, and D−10/D10; with the increase of T2 cut off, single and multi-fractal dimensions all increase linearly, and the correlation between D2 and T2 cut off is stronger than that of the multi-fractal dimension. When calculating the T2 cut off of samples with macro-pores developed, spectrum morphological methods should be used preferentially, while the fractal dimension discrimination methods need be used for the T2 cut off of samples with developed micro-pores. Then, the T2 cut off value prediction and evaluation system are described. The overall results of this work can provide a theoretical basis for the inversion of bound water content in the original formation.
1. Introduction
Unconventional reservoirs are characterized by low porosity and extra-low permeability, which leads to fluid (water and gas) micro-distribution complexity under in situ geological conditions. This restricts unconventional oil and gas production. As a fluid occurrence parameter, water saturation (irreducible and movable water) plays an important role in controlling the desorption, diffusion, and seepage of coalbed, shale, and sandstone gas [1,2,3,4,5].
The low field nuclear magnetic resonance (LF-NMR) technique has several advantages, as it is non-destructive, fast, and of high precision. It is widely used in the fields of fluid identification and pore-fracture structure characterization, among others [6,7,8,9]. NMR logging can distinguish movable fluid from immovable fluid, with the key distinguishing parameter being the T2 cut-off value. This value is related to the measurement accuracy of irreducible water saturation and permeability [9,10]. At present, there are two methods for T2 cut-off value determination. One the one hand, a comparison of the T2 spectrum integral curve can be obtained after water saturation and centrifugation shows the T2 cut-off value under laboratory conditions [11,12]; however, this method has the disadvantages of high cost, a long cycle, and only generating a limited amount of data. One the other hand, the T2 cut-off value of sandstone and limestone has been determined empirically as 33 and 93 ms, respectively; nevertheless, the T2 cut-off values of different study areas, target layers, and reservoir types are quite different and with a large error [13].
One of the current research methods to predict the T2 cut-off value is to use the saturated T2 spectrum obtained from the NMR logging curve. After studying the relationship between the T2 spectrum and the T2 cut-off value for a large number of water-saturated samples, a calculation method for the variable T2 cut-off using the difference in the T2 spectrum morphological value was proposed [7,8,9,10]. Based on this, a normal distribution function was used to fit the T2 spectrum of centrifugal bound water; then, a variable T2 cut-off value was obtained [10]. To quantitatively characterize pore-fracture complexity, fractal theory is used to characterize pore distribution heterogeneity. Results show that there is a linear relationship between multifractal parameters (D0−D10) and the T2 cut-off value; thus, a T2 cut-off prediction model using multi-fractal parameters was proposed [14,15,16].
A related T2 cut-off prediction model has been established in the literature. However, there are at least three problems in this research field. Firstly, the work only studies the T2 cut-off of specific reservoir types, and the applicability of the prediction model to different reservoirs needs to be further studied. Secondly, relevant results show that there is a relationship between the T2 spectrum morphology and the T2 cut-off value, but there is a lack of research on representative morphological parameters. Meanwhile, while the relationship between multifractal parameters and T2 cut-off has been studied, the correlation analysis between single-fractal parameters and T2 cut-off needs to be further investigated. Thirdly, parameters obtained from the published literature vary greatly, and the applicability of fractal models for specific study areas and rock types needs to be analyzed.
In this paper, the saturation and centrifugal T2 spectra of sandstone and coal samples collected from Qinshui and Qianxi basins are used to obtain the T2 cut off value using the NMR technique to derive a relationship between the T2 spectrum morphology and the T2 cut-off value. Then, single fractal dimension, multi-fractal dimension, and spectrum morphological discrimination methods are adopted to calculate the T2 cut off value. Moreover, the correlation of representative parameters for various methods is analyzed, and the applicability of these three methods in characterizing T2 cut off is discussed.
2. Study Area and Experimental Methods
2.1. Sample Preparation and Experimental Analyses
A total of 18 samples were collected from the underground coal mines of Qinshui basin, Shanxi Province, China, which is a sweet spot for coal bed methane and tight gas exploitation. The sample size was about 25 × 25 × 25 cm. The maximum vitrinite reflectance (Ro, max) for 18 samples ranged from 0.39 to 2.76%. Representative sandstone samples from Benxi, Taiyuan, and Shanxi Formations of the Upper Paleozoic in eastern Ordos Basin, China, were selected. These samples were sampled from 9 coring wells with a burial depth of 2280~3267 m and were prepared into cylinders with a diameter of 25 mm and a length of 35 mm.
The coal samples obtained in this study were taken from Western Guizhou and eastern Yunnan, which are in the Yangtze Block and cover an area of approximately 2.58 × 10⁴ km2. The CBM resource is approximately 2.20–2.75 × 10¹² m3. The main coal-bearing strata in this area are the late Permian Longtan Formation and Changxing Formation, which belong to a delta–tidal–lagoon sedimentary system. After the coal-bearing strata were deposited, the study areas underwent Indosinian–Yanshan–Himalayan tectonic movements. Faults and folds generated by structural movements of different stages control the distribution pattern of CBM resources in this area. The evolution degree of coals in this region fluctuates from bituminous to anthracite coal, and the coal reservoirs have different evolutions, including deep metamorphism during the early Yanshanian period and structural–thermal metamorphism during the Yanshan period (Figure 1).
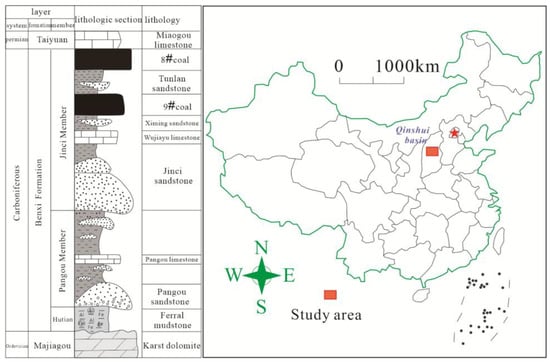
Figure 1.
Sample types and locations of study areas.
2.2. Calculation Methods
2.2.1. Experimental Process
For NMR analyses, 25 mm diameter cylinders 30 mm in length were prepared from all coal and sandstone samples. The samples were placed in the drying oven before the tests, with the temperature adjusted to 105 °C for approximately 12 h. The dry samples were thereafter weighed by a balance. The samples were saturated with distilled water in a vacuum (i.e., without confining pressure) for 48 h. After 24 h of saturation, continuous T2 spectrum detection was performed on the same sample. If the difference in T2 spectrum change after a half-hour interval was small, it was considered that the sample reached saturation. By comparison, it can be seen that this type of sample could reach saturation after 24 h of vacuum pressure saturation. It is worth noting that this article uses distilled water saturation, so the influence of factors such as salinity was not considered. After saturation, the wet samples were weighed, and the porosity (%) of samples was calculated. After measuring the T2 spectrum, the samples were centrifuged at a certain speed to compare water content before and after centrifugation (Figure 2a). Compared with the relevant literature, the saturation process of the samples is consistent with previous methods, so it is believed that these samples can be used for comparison.
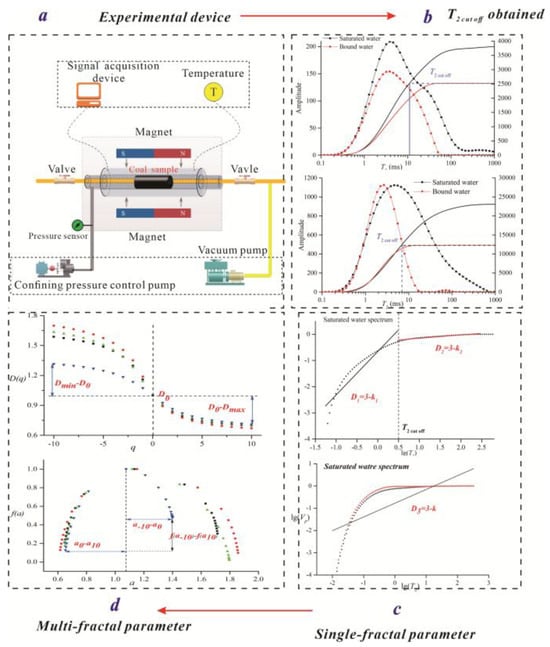
Figure 2.
T2 cut off calculation process and related parameter division. (a) Experimental device; (b) T2 cut off obtained; (c) Single-fractal parameter; (d) Multi-fractal parameter, the four different colors represent different samples.
2.2.2. T2 cut off Value
The calculation process of the T2 cut off value is shown in Figure 2b. It is noted that there are differences in the physical significance of T2 cut off. When T2 is less than the T2 cut off value, smaller pores (T2 is smaller than T2 cut off) are filled with immovable water. When T2 is larger than the T2 cut off value, larger pores (T2 is larger than T2 cut off) are filled with movable water (Figure 2b) [17,18,19].
2.2.3. T2 Spectrum Morphological Parameter
Based on the saturated T2 spectrum, the following three morphological parameters are proposed:
- The main peak position (TM) represents the T2 value corresponding to the highest spectral quantity. The TFPP of the two samples is 8 and 7 ms, respectively (Figure 2c).
- The pore volume percentage of smaller pores (SPVP) and larger pores (LPVP) represents the spectral area percentage within a certain T2. The relationship between the T2 value and pore diameter is studied in the relevant literature; however, the conversion coefficient among the two parameters is not uniform [20]. Based on the results of [11], pore-fracture systems are classified into smaller pores (0–102 nm, T2 < 2.5 ms) and large pores (102–104 nm, 2.5 ms < T2) by using the T2 spectrum and the response characteristics (relaxation time) of different pore diameters. The equation for SPVP is given as
2.2.4. Single Fractal Parameter
Equation (2) is used to calculate the single fractal dimension of the saturated T2 spectrum:
where Vp is the percentage of cumulative pore volume (amplitude) in a saturated water state; T2max is the maximum transverse relaxation time, ms; Dw is the NMR fractal dimension value in a saturated water state. The detailed calculation process is shown in Figure 2d. The results show that the fractal curve can be divided into two sections by using the T2 cut off value obtained from the saturated water. A slope of T2 less than 2.5 ms corresponds to smaller pore size distribution heterogeneity, and a slope of T2 greater than 2.5 ms corresponds to larger pore size distribution heterogeneity [21].
2.2.5. Multi-Fractal Parameter
For strongly inhomogeneous reservoirs, the pore size distribution curve usually fluctuates randomly and may exhibit different types of self-similarity at different pore size intervals. Thus, it is difficult to fully characterize the homogeneity of pore space by a single fractal dimension. the calculation process of multiple fractals and the physical meaning of parameters are detailed in the literature [22,23,24,25,26].
It should be noted that the multifractal calculation results include two expressions, i.e., the a~f(a) singular spectrum and q~D fractal dimension spectrum. The values of these two expressions have a clear linear correlation, and thus we suggest that either expression can be selected for the multifractal calculation using NMR data. By taking the singular spectrum parameters as an example, the characteristic parameters mainly include amin, amax, a0, a0 − amax, amin − a0, and A. Particularly, the right branch width (amin − a0), the left branch (a0 − amax), and amin − amax characterize the distribution heterogeneity of the data. For the NMR T2 spectra, larger amin − a0 indicates a more heterogeneous pore size distribution in the low pore volume development area, while higher a0 − amax indicates a more heterogeneous pore size distribution in the high pore volume development area.
3. Results and Discussion
3.1. Pore Type Classification Using T2 Spectrum
To study the NMR T2 spectra response of different reservoir types, the T2 spectra of tight sandstone and coal samples were studied separately by using the peak number, main peak position, and pore structure of the T2 spectra measured for the water-saturated state. Compared with unconventional reservoirs such as coal and shale, micro-pores of tight sandstone reservoirs are not developed, and the T2 spectrum is dominated by a single peak [12]. The T2 spectrum of 21 sandstone samples can be divided into three types. That is, a single peak of larger pores (Type A; Figure 3a), a single peak of meso-pores (Type B and C; Figure 3b,c) and a single peak of smaller pores (Type D; Figure 3d). Moreover, the single peak of meso-pores can be divided into right- (Figure 3b) and left- (Figure 3c) shifting forms. Specific definitions are as follows: Type A is characterized by a main peak greater than 100 ms, and the T2 cut off is smaller than the main peak position; Type B is characterized by a main peak at 10~100 ms, and the T2 cut off is smaller than the main peak position; Type C is characterized by a main peak at 1~10 ms, and the T2 cut off is equal to the main peak position; and Type D is characterized by a main peak at 0.1~1 ms, and the T2 cut off is larger than the main peak position. The smaller-pore volume percentage of Type D is the largest (86~92%), followed by Types C and B, and Type A is the smallest (4~27%) (Table 1).
Figure 3.
Typical T2 spectrum distribution of 24 sandstone samples. (a) Type A; (b) Type B; (c) Type C; (d) Type D.

Table 1.
Summary of morphological parameters of all sandstone samples.
Figure 4 and the related literature have shown that the pore fracture of low-middle-high ranking coal samples exhibits obvious differences, which also leads to T2 spectrum morphology differences in all coal samples; the T2 spectrum is dominated by single, double, and multi-peaks. The T2 spectrum of 18 coal samples are divided into three types, that is, a single peak of larger pores (Type A; Figure 4a), three peaks (Types B and C; Figure 4b,c), and a single peak of smaller pores (Type D; Figure 4d). Moreover, three peaks of meso-pores can be divided into the right (Figure 4b) and left (Figure 4c) shift form. Specific definitions are as follows: Type A is characterized by a main peak greater than 100 ms, and the T2 cut off is smaller than the main peak position; Type B is characterized by a main peak at 10~100 ms, and the T2 cut off is smaller than the main peak position; Type C is characterized by a main peak at 1~10 ms, and the T2 cut off is equal to the main peak position; and Type D is characterized by a main peak at 0.1~1 ms, and the T2 cut off is larger than the main peak position. The smaller-pore volume percentage of Type D is the largest (32~92%), followed by Types C and B, and Type A is the smallest (3~24%) (Table 2). Overall, the main peak position, peak number, and spectral area ratio are three important parameters for identification of the type of T2 spectrum.
Figure 4.
Typical T2 spectrum distribution of 18 coal samples. (a) Type A; (b) Type B; (c) Type C; (d) Type D.
Table 2.
Basic parameters of samples used in this study.
3.2. Single Fractal Dimension Identification Method
Based on Figure 4, single fractal dimension of D1 (smaller pores), D2 (larger pores), and DT (total pore-fracture system) is obtained by using the saturated T2 spectrum. Figure 5a shows that D1 is not 2~3, which serves as a practical boundary indicator for the validity of the chosen fractal model rather than a direct descriptor of the pore geometry itself.
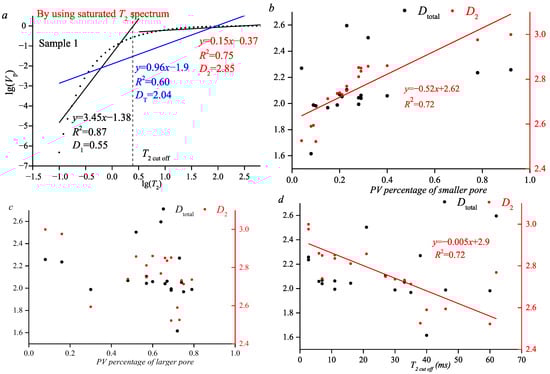
Figure 5.
Calculated single fractal dimension and relationship between fractal parameters and T2 cut off of all coal samples (a) fractal dimension curve; (b,c) fractal dimension versus PV percentage; (d) T2 cut off versus fractal dimension value.
The main reasons for this phenomenon are as follows. Sensitivity to Data Noise and Processing: The low-amplitude tail of the T2 spectrum corresponding to small pores is particularly susceptible to noise and baseline drift. The calculation of D1, which often relies on a linear fit in the log-log plot of the NMR-derived capillary pressure curve, can be significantly skewed by inaccuracies in this noisy region. Anomalous D1 values may thus partly reflect the sensitivity of the model to data quality and signal-to-noise ratio at the measurement limits. Metric Choice and Normalization: The specific formulation of the NMR fractal model, including the choice of metrics for cumulative volume and pore radius (T2 time), and the normalization procedures applied during data transformation can influence the slope of the log-log plot. Inconsistent or inappropriate handling in these steps, especially for the small-pore data segment, could artificially produce slopes corresponding to D1 < 2. Inherent Model Simplification: The model employed assumes a single, contiguous fractal regime for the pore surface. Real coal pore systems are highly heterogeneous and may comprise multiple fractal sets or non-fractal structures. A calculated D1 value outside the 2–3 range may highlight the inadequacy of a single-fractal approximation to capture the true complexity, suggesting the need for multi-fractal analysis or different geometric descriptors for that sub-interval of pores.
The D2 and DT of all samples are 2.5~2.95 and 1.98~2.51, indicating that larger pores have fractal significance. Figure 5b shows that there is a positive linear relationship between D2 and SPVP, while the correlation between DT and pore volume is weak. However, there is not an obvious relationship between LPVP and single fractal parameters (Figure 5c), which indicates that smaller pores are the key factor in restricting pore size distribution heterogeneity. Figure 5d shows that D2 decreases linearly with an increasing T2 cut off value, with an R2 of 0.72.
Based on Figure 3, single fractal dimensions of D1, D2, and DT are obtained by using the saturated T2 spectrum of sandstone samples. Figure 6a,b shows that the D1, D2, and DT of all samples are 2.12~2.54, 2.5~2.95, and 2.23~2.65, respectively, indicating that smaller and larger pores all have a fractal significance. Figure 6c shows that there is a negative linear relationship between D2 and T2 cut off, and the correlation between DT and T2 cut off is weak, indicating that the single fractal parameter D2 is the key parameter to predict the T2 cut off. It is noted that there is a phased relationship between DT and T2 cut off. When T2 is less than 20 ms, there is a linear negative correlation among those two parameters. When T2 is greater than 20 ms, T2 cut off increases linearly as DT increases (Figure 6d). It can be seen from Figure 3 and Figure 4 that most samples with a T2 cut off of 20 ms belong to Types B and C, and the smaller-pore volume percentage is about 50%; that is, pores with different diameters of this sample type are relatively uniform. This may be related to the significant differences in the bound water state between samples with macropore development and those with micropore development. Hence, the single fractal parameter D2 (larger pore distribution heterogeneity) of all coal and sandstone samples has a good linear relationship with the T2 cut off value, which can be used to predict the T2 cut off value.
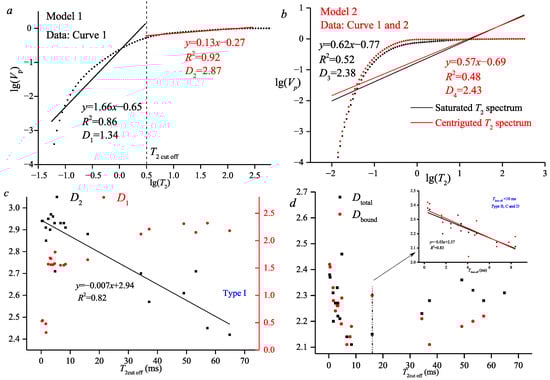
Figure 6.
Single fractal dimension calculation and relationship between fractal parameters and T2 cut off of all the coal samples (a) fractal dimension curve; (b,c) fractal dimension versus PV percentage; (d) T2 cut off versus fractal dimension value [21].
The observed reversal in the correlation trend between the fractal dimension D and the T2 cut off value at approximately 20 ms is interpreted as a signature of a structural transition within the sandstone pore system. For a T2 cut off > 20 ms (focusing on larger pores), the positive correlation suggests that the geometry of effective flow channels becomes increasingly complex and tortuous with increasing pore size, likely due to dominant control by secondary diagenetic processes like dissolution. Conversely, for a T2 cut off < 20 ms (incorporating smaller pores), the negative correlation indicates that the abundant micro-/mesopores—often associated with primary depositional textures or early diagenetic clay minerals—exhibit relatively more homogeneous shapes and poorer connectivity. Their inclusion “dilutes” the overall morphological complexity calculated for the pore network. This phase change highlights the dual nature of the pore system: a flow-dominant, diagenetically modified macro-pore network with high complexity, and a storage-dominant, depositionally influenced small-pore system with lower apparent connectivity. The ~20 ms threshold may thus mark the approximate boundary between these two genetically and functionally distinct pore populations.
3.3. Multi-Fractal Dimension Identification Method
According to Section 2.2.5, the multi-fractal parameter of the 18 coal samples is obtained by using the saturated T2 spectrum. There is a good linear positive correlation between fractal spectrum parameters and singular spectrum parameters, with correlation coefficients greater than 0.9 (Figure 7). It is indicated that only one expression parameter should be used to describe multifractal results.
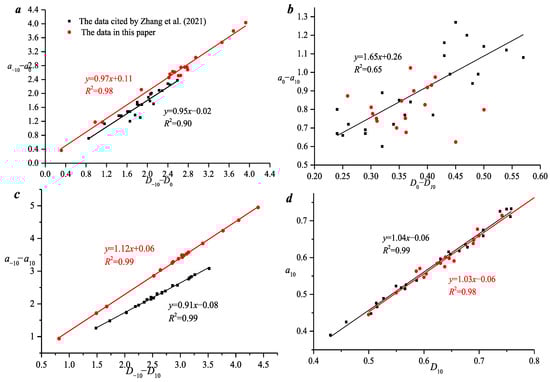
Figure 7.
Relationship between the generalized fractal parameters and singular fractal parameters [24]. (a) D−10 − D0 versus a−10−a0; (b) D0 − D10 versus a0−a10; (c) D−10 − D10 versus a−10 − a10; (d) D10 versus a10.
Figure 8a,b shows that there is a positive correlation between D−10 and T2 cut off in [15,17], and the R2 is 0.78 and 0.90. When T2 cut off is larger than 20 ms, the linear correlation coefficient between T2 cut off and D−10 is less than 0.5. Figure 8 and Figure 9 show that the pore volume distribution heterogeneity of the maximum lowest value area is of great significance to the prediction of T2 cut off.
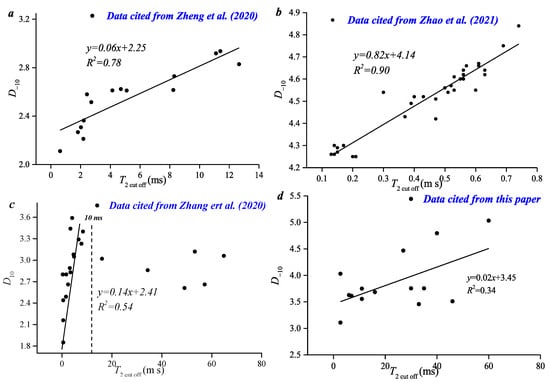
Figure 8.
Relationship between T2 cut off and D−10 based on the data in four papers. (a) cited by [14]; (b) cited by [16]; (c) cited by [24]; (d) data from this paper.
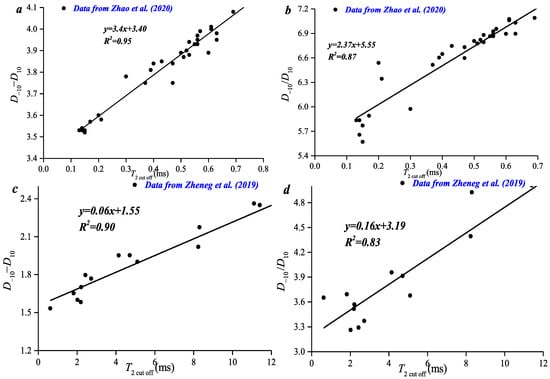
Figure 9.
Relationship between T2 cut off and D−10−D10 and D−10/D10 [14] (a,b), T2 cut off vs D−10 − D10 and D−10/D10; (c,d) [16], T2 cut off vs D−10 − D10 and D−10/D10 [24].
As mentioned in the related literature, D−10 − D10 and D−10/D10 were used to calculate the T2 cut off value. It is shown that the above two parameters have a good linear positive correlation with the T2 cut off value, and the correlation coefficients are greater than 0.9 (Figure 9a,b). For sandstone samples with a T2 cut off of 0~70 ms, there is a good linear positive correlation between the above two parameters and the T2 cut off value when the T2 cut off is smaller than 20 ms. For coal samples with a T2 cut off of 0~60 ms, there is a weak linear positive correlation between the above two parameters and the T2 cut off value (Figure 9c,d). This indicates that parameters D−10 − D10 and D−10/D10 can be used to predict the T2 cut off value of small-pore samples (the T2 cut off value of those samples is smaller than 20 ms).
3.4. T2 Spectrum Morphological Discrimination Methods
As mentioned in Section 3.1, the main peak position, peak number, and spectral area ratio are three important parameters in identifying the type of T2 spectra (Figure 10). For sandstone samples with a T2 cut off of 0~70 ms, the T2 cut off increases linearly with a higher TM value (Figure 11a). Its linear correlation is much higher than multifractal parameters (Figure 10). Moreover, the smaller-pore volume percentage decreases polynomially with a higher T2 cut off value, and the fitting coefficient between this parameter and T2 cut off is the highest, namely 0.93 (Figure 11b,c). However, there is no obvious relationship between the larger pore volume percentage and T2 cut off. It is worth noting that due to laboratory conditions, this article does not discuss the sensitivity of noise, the selection of spectral smoothing windows, or the impact of the quality of nuclear magnetic resonance signal inversion on signal quantity. To mitigate this impact, we selected the same CPMG sequence number for analysis, but the influence of these external factors can still interfere with the signal.
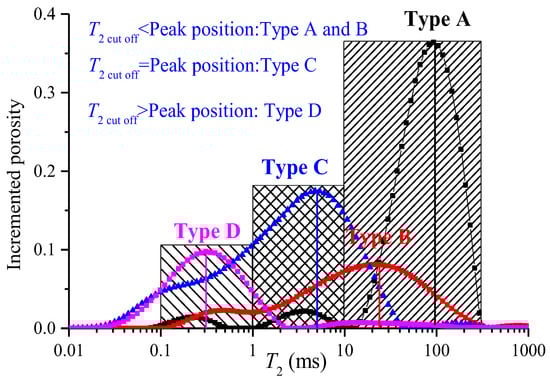
Figure 10.
Relationship between T2 cut off and peak position in different types of T2 spectra.
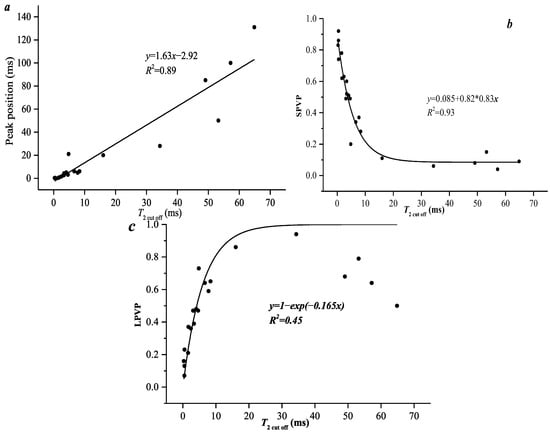
Figure 11.
Correlation between T2 cut off and peak position and the adsorption pore volume percentage of sandstone samples. (a) T2 cut off vs Peak position; (b) T2 cut off vs SPVP; (c) T2 cut off vs LPVP.
For coal samples with a T2 cut off of 0~70 ms, the T2 cut off increases linearly with a higher TM value (Figure 12a), and its linear correlation is stronger than multifractal parameters. Moreover, the smaller-pore volume percentage also decreases polynomially with a higher T2 cut off value, and the fitting coefficient between this parameter and the T2 cut off is lower, namely 0.88 (Figure 12b,c). However, there is no clear relationship between larger pore volume percentage and T2 cut off (Figure 13d). It is noted that the fitting coefficient between this parameter and T2 cut off is higher (R2 is 0.96) when T2 cut off is smaller than 20 ms. In conclusion, the smaller-pore volume percentage is a valid parameter for the prediction of the T2 cut off value.
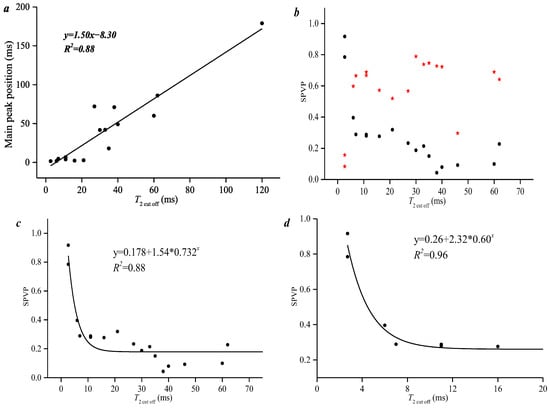
Figure 12.
Correlation between T2 cut off and peak position and the smaller-pore volume percentage of coal. (a) T2 cut off vs Main peak position; (b) T2 cut off vs SPVP; (c) T2 cut off vs LPVP; (d) T2 cut off vs SPVP.
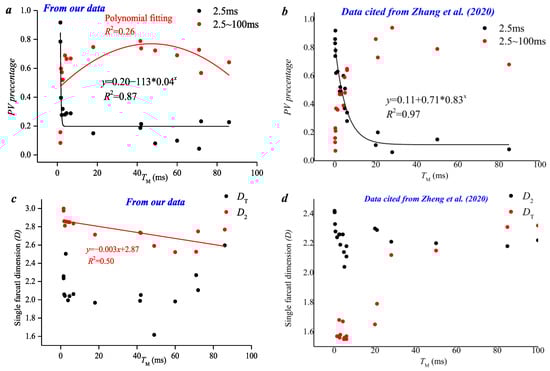
Figure 13.
Correlation between TM and fractal dimension and adsorption pore volume percentage. (a) our data; (b) data cited by [24]; (c) our data; (d) data cited by [12].
3.5. Correlation Degree of T2 cut off-Related Parameters
Parameters affecting T2 cut off are discussed based on single and multi-fractal methods as well as morphological discrimination methods. A related parameter includes single fractal dimension D2, multi-fractal dimension D−10−D10, D−10/D10, morphological parameter TM, and smaller-pore volume percentage. Figure 14a,b shows that there is an obvious polynomial relationship between TM and smaller-pore volume percentage; this is because a larger TM of samples represents the development of larger pore volume, resulting in smaller pores being undeveloped. Affected by echo duration, echo interval, and related parameters, the T2 range of 18 coal samples is greater than 1000 ms (Figure 4). The T2 value range of this kind of samples is much larger than that of other types in the three papers; thus, the correlation between the parameters of this type of samples and T2 cut off is weak.
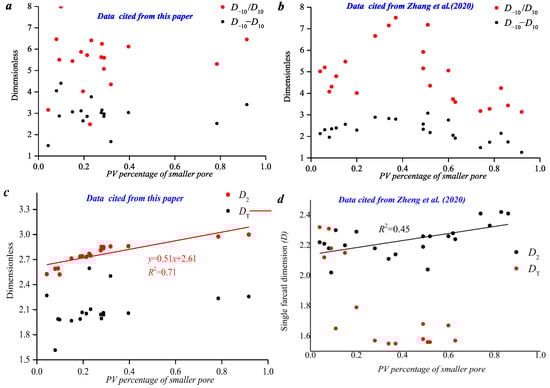
Figure 14.
Correlation between PV percentage and fractal dimension. (a) our data; (b) cited by [24]; (c) cited by this paper; (d) cited by [12].
Figure 14a,b shows that there is no obvious correlation between pore structure and multifractal parameters. Figure 14b shows that the relationship between D−10−D10, D−10/D10, and smaller pore volume can be divided into two sections, with a smaller-pore volume percentage of about 40%. Specifically, when the smaller-pore volume percentage is less than 40%, two parameters increase with higher pore volume. When the smaller-pore volume percentage is greater than 40%, D−10 − D10 gradually decreases. This result is consistent with the plots in Figure 14. In addition, Figure 14c,d shows that there is a positive linear relationship between pore structure and single fractal parameter D2.
3.6. Applicability Analysis of Different Calculation Methods
Above all, multifractal parameters D−10 − D10 and D−10/D10 are used to fit the linear regression equation, which can realize the accurate measurement of the T2 cut off value [14]. For samples with larger pores developed, the T2 cut off is 20~70 ms, and there is a lower precision in the prediction of the T2 cut off value by using multifractal parameters. This is because D−10 − D10 and D−10/D10 are 2~3 and 6~8, and value range of the two parameters is small. This also leads to large errors in predicting a large T2 cut off value.
The results also show that single-fractal parameters D2, TM, and SPPV have a good linear relationship with the T2 cut off value of samples with larger pores developed. The comparison shows that the single fractal and curve type parameter has good applicability in predicting the T2 cut off value of samples with larger pores developed (SPPV is larger than 30%). This is because the T2 cut off value is mainly restricted by pore structure. The more developed the larger pores are, the larger the T2 cut off value is. Morphological parameters TM and SPPV can directly reflect the degree of pore development; thus, the above three parameters have good applicability in predicting the T2 cut off value. More importantly, the above three parameters are relatively easy to obtain and have the advantages of fast calculation and high precision.
4. Conclusions
- The T2 spectra of all coal and sandstone samples are divided into three types, that is, a single peak of larger pores (Type A), a single peak of meso-pores (Types B and C), and single peak of smaller pores (Type D). Type A is characterized by a main peak greater than 100 ms and a T2 cut off smaller than the main peak position. Type B is characterized by a main peak of 10~100 ms and a T2 cut off smaller than the main peak position. The main peak position, peak number, and spectral area ratio are three important parameters in identifying the type of T2 spectrum.
- Related parameters include single fractal dimension D2, multi-fractal dimension D−10 − D10, D−10/D10, morphological parameter TM, and smaller-pore volume percentage. The single fractal parameter D2 (larger pore distribution heterogeneity) of all coal and sandstone samples has a good linear relationship with the T2 cut off value.
- When calculating the T2 cut off of samples with macro-pores developed, spectrum morphological methods should be used preferentially. Fractal dimension discrimination methods should be used when the T2 cut off of samples with micro-pores developed is calculated. Multi-parameters D−10 − D10 and D−10/D10 can be used to predict the T2 cut-off value of small-pore samples (the T2 cut off value of those samples is smaller than 20 ms).
Author Contributions
Conceptualization, Z.Q., F.Y., Z.L., F.S., and S.M.; Methodology, Z.Q., J.J., S.G., and W.S.; Software, F.Y.; Validation, S.G. and S.M.; Resources, F.Y. and F.S.; Data curation, Z.Q., Z.L., J.J., F.S., S.G., S.M., and W.S.; Writing—original draft, Z.L., F.S., and W.S.; Project administration, Z.L. and J.J. All authors have read and agreed to the published version of the manuscript.
Funding
This research was supported by Hubei Provincial Key R&D Program (No. 2023BCB084), the Scientific Research Foundation of Wuhan Institute of Technology (No. K2023039), and the National Science and Technology Major Project (No. 2025ZD1010906).
Data Availability Statement
The original contributions presented in this study are included in the article. Further inquiries can be directed to the corresponding author.
Conflicts of Interest
The authors declare no conflicts of interest.
References
- Krzyżak, A.T.; Habina, I. Low field 1 H NMR characterization of mesoporous silica MCM-41 and SBA-15 filled with different amount of water. Microporous Mesoporous Mater. 2016, 231, 230–239. [Google Scholar] [CrossRef]
- Shen, W.; Ren, W.; Chen, Z. Pressure Reduction Effectiveness Evaluation of Entry Under Longwall Mining Disturbance: A Case Study. Rock Mech. Rock Eng. 2025. [Google Scholar] [CrossRef]
- Li, H.; Lin, B.; Chen, Z.; Hong, Y.; Zheng, C. Evolution of coal petrophysical properties under microwave irradiation stimulation for different water saturation conditions. Energy Fuels 2017, 31, 8852–8864. [Google Scholar] [CrossRef]
- Gao, J.; Li, Z. Water saturation-driven evolution of helium permeability in Carboniferous shale from Qaidam Basin, China: An experimental study. Mar. Pet. Geol. 2018, 96, 371–390. [Google Scholar] [CrossRef]
- Zhang, J.; Wei, C.; Ju, W.; Yan, G.; Lu, G.; Hou, X.; Kai, Z. Stress sensitivity characterization and heterogeneous variation of the pore-fracture system in middle-high rank coals reservoir based on NMR experiments. Fuel 2019, 238, 331–344. [Google Scholar] [CrossRef]
- Habina, I.; Radzik, N.; Topór, T.; Krzyżak, A.T. Insight into oil and gas-shales compounds signatures in low field 1H NMR and its application in porosity evaluation. Microporous Mesoporous Mater. 2017, 252, 37–49. [Google Scholar] [CrossRef]
- Adenutsi, C.D.; Li, Z.; Xu, Z.; Sun, L. Influence of net confining stress on NMR T2 distribution and two-phase relative permeability. J. Pet. Sci. Eng. 2019, 178, 766–777. [Google Scholar] [CrossRef]
- Zhang, X.; Wu, C.; Wang, Z. Experimental study of the effective stress coefficient for coal permeability with different water saturations. J. Pet. Sci. Eng. 2019, 182, 106282. [Google Scholar] [CrossRef]
- Zhu, L.; Zhang, C.; Shi, W. Study on the method of prediction of irreducible water saturation by combining mercury intrusion and NMR logging data. Sci. Technol. Eng. 2016, 16, 22–30. [Google Scholar]
- Zhu, M.; Jia, C.; Mum, Y.; Li, J.; Hu, T. A method of predicting T2 cut off from NMR logging data of tight glutenite reservoirs based on normal distribution simulation. Oil Geophys. Prospect. 2021, 56, 612–621. [Google Scholar]
- Yao, Y.; Liu, D.; Che, Y.; Tang, D.; Tang, S.; Huang, W. Petrophysical characterization of coals by low-field nuclear magnetic resonance (NMR). Fuel 2010, 89, 1371–1380. [Google Scholar] [CrossRef]
- Zhang, J.; Hu, Y. Comparative evaluation of pore structure heterogeneity in low-permeability tight sandstones using different fractal models based on NMR technology: A case study of Benxi Formation in the Central Ordos Basin. Energy Fuels 2020, 34, 13924–13942. [Google Scholar] [CrossRef]
- Testamanti, M.N.; Rezaee, R. Determination of NMR T2 cut-off for clay bound water in shales: A case study of Carynginia Formation, Perth Basin, Western Australia. J. Pet. Sci. Eng. 2017, 149, 497–503. [Google Scholar] [CrossRef]
- Zheng, S.; Yao, Y.; Liu, D.; Cai, Y.; Liu, Y.; Li, X. Nuclear magnetic resonance T2 cutoffs of coals: A novel method by multifractal analysis theory. Fuel 2019, 241, 715–724. [Google Scholar] [CrossRef]
- Hu, Y.; Guo, Y.; Zhang, J.; Shangguan, J.; Li, M.; Quan, F.; Li, G. A method to determine nuclear magnetic resonance T2 cutoff value of tight sandstone reservoir based on multifractal analysis. Energy Sci. Eng. 2020, 8, 1135–1148. [Google Scholar] [CrossRef]
- Zhao, Y.; Lin, B.; Liu, T.; Zheng, Y.; Sun, Y.; Zhang, G.; Li, Q. Multifractal analysis of coal pore structure based on NMR experiment: A new method for predicting T2 cutoff value. Fuel 2021, 283, 119338. [Google Scholar] [CrossRef]
- Heidary, M. A novel computational method for determination of water saturation in oil reservoirs using discrete wavelet transform and nuclear magnetic resonance (NMR)T2 log. J. Pet. Sci. Eng. 2021, 205, 108828. [Google Scholar] [CrossRef]
- Jin, G.; Xie, R.; Xiao, L.; Wu, B.; Xu, C.; Wang, X.; Wang, T. Quantitative characterization of bound and movable fluid microdistribution in porous rocks using nuclear magnetic resonance. J. Pet. Sci. Eng. 2021, 196, 107677. [Google Scholar] [CrossRef]
- Liu, M.; Xie, R.; Guo, J.; Jin, G. Characterization of pore structures of tight sandstone reservoirs by multifractal analysis of the NMR T2 distribution. Energy Fuels 2018, 32, 12218–12230. [Google Scholar] [CrossRef]
- Lyu, C.; Ning, Z.; Wang, Q.; Chen, M. Application of NMR T2 to pore size distribution and movable fluid distribution in tight sandstones. Energy Fuels 2018, 2, 1395–1405. [Google Scholar] [CrossRef]
- Miao, H.Y.; Veerle, V.; Zhang, J.J.; Chen, S.B.; Chang, X.C.; Du, Y.; Wang, Y.; Wei, C.T.; Luo, J.H.; Quan, F.K.; et al. Control mechanism of pressure drop rate on coalbed methane productivity by using production data and physical simulation technology. Fuel 2026, 406, 137060. [Google Scholar] [CrossRef]
- Sun, Y.; Zhai, C.; Zhao, Y.; Xu, J.; Cong, Y.; Zheng, Y.; Tang, W. Multifractal analysis and neural network prediction of pore structures in coal reservoirs based on NMR T2 spectra. Energy Fuels 2021, 35, 11306–11318. [Google Scholar] [CrossRef]
- Timur, A. Nuclear magnetic resonance study of carbonate rocks. Log Anal. 1991, 13, 518–535. [Google Scholar]
- Zhang, J.; Wei, C.; Chu, X.; Vandeginste, V.; Ju, W. Multifractal analysis in characterizing adsorption pore heterogeneity of middle- and high-rank coal reservoirs. ACS Omega 2020, 5, 19385–19401. [Google Scholar] [CrossRef] [PubMed]
- Zhang, J.; Wei, C.; Ju, W.; Qin, Z.; Ji, Y.; Quan, F.; Hu, Y. Microscopic distribution and dynamic variation of water under stress in middle and high rank coal samples. J. Nat. Gas Sci. Eng. 2020, 79, 103369. [Google Scholar] [CrossRef]
- Yao, P.; Zhang, J.; Lv, D.; Vandeginste, V.; Chang, X.; Zhang, X.; Wang, D.; Han, S.; Liu, Y. Effect of water occurrence in coal reservoirs on the production capacity of coalbed methane by using NMR simulation technology and production capacity simulation. Geoenergy Sci. Eng. 2024, 243, 213353. [Google Scholar] [CrossRef]
Disclaimer/Publisher’s Note: The statements, opinions and data contained in all publications are solely those of the individual author(s) and contributor(s) and not of MDPI and/or the editor(s). MDPI and/or the editor(s) disclaim responsibility for any injury to people or property resulting from any ideas, methods, instructions or products referred to in the content. |
© 2025 by the authors. Licensee MDPI, Basel, Switzerland. This article is an open access article distributed under the terms and conditions of the Creative Commons Attribution (CC BY) license.