Abstract
Location-based social networks (LBSNs) leverage geo-location technologies to connect users with places, events, and other users nearby. Using GPS data, platforms like Foursquare enable users to check into locations, share their locations, and receive location-based recommendations. A significant research gap in LBSNs lies in the limited exploration of users’ tendencies to withhold certain location data. While existing studies primarily focus on the locations users choose to disclose and the activities they attend, there is a lack of research on the hidden or intentionally omitted locations. Understanding these concealed patterns and integrating them into predictive models could enhance the accuracy and depth of location prediction, offering a more comprehensive view of user mobility behavior. This paper solves this gap by proposing an Associative Hidden Location Trajectory Prediction model (AHLTP) that leverages user trajectories to infer unchecked locations. The FP-growth mining technique is used in AHLTP to extract frequent patterns of check-in locations, combined with machine-learning methods such as K-nearest-neighbor, gradient-boosted-trees, and deep learning to classify hidden locations. Moreover, AHLTP uses association rule mining to derive the frequency of successive check-in pairs for the purpose of hidden location prediction. The proposed AHLTP integrated with the machine-learning models classifies the data effectively, with the KNN attaining the highest accuracy at 98%, followed by gradient-boosted trees at 96% and deep learning at 92%. Comparative study using a real-world dataset demonstrates the model’s superior accuracy compared to state-of-the-art approaches.
1. Introduction
The rapid growth of mobile technologies has attracted research attention to studies focusing on location-based social network (LBSN) data. Numerous specialized areas, like the study of people’s behavior in festivals, shopping centers, dining venues, tourism, and many more, have used LBSN data for analysis. These types of data contain heterogeneous features about customers from various venues; in order to perform more specialized studies, researchers must filter out the data related to particular venues. The dataset frequently contains thousands or millions of records before any data analysis, and it is necessary to manually filter out data pertinent to particular venue classifications. This is a laborious and time-consuming task for this kind of research [,,].
Thus, in order to organize data without requiring manual labor, machine-learning techniques that can categorize the data according to certain features are needed. Using check-ins from diverse venues, such data offers a sample of different features of human actions and characteristics whilst engaging with LBSN throughout an array of activities. Information about broad demographic trends can be gathered from the analysis of such actions, and such information can be used to organize and develop celebrations, playgrounds, eateries, retail centers, and, eventually, smart cities. Additionally, the LBSN data have been utilized in more specific studies that have been shown to be extremely beneficial in various domains, such as determining the factors that influence restaurant appeal, the importance of parks, and tourism actions, among many others []. However, within the vast number of records, it is crucial for these specialist studies to take into account the data pertinent only to these venues and manually classify the unique data for each individual research project. Large volumes of data are one of the benefits of using LBSN data to study human behavior, but classifying the data to discover pertinent information can frequently be more challenging and time-consuming [].
In location-based social networks, users and places are the two primary elements that engage with one other. This results in three distinct types of networks constituting an LBSN: (1) user–user social network, (2) user–location network, and (3) location–location spatial network. Figure 1 is a schematic illustration of these three networks and their interactions. Users are interconnected by relationships with family, friends, and colleagues, much like a traditional social network. However, it is also possible to specify spatial network connections by providing locations []. Subsequently, LBSN’s user–location network is a crucial element that links individuals and places.
Figure 1.
LBSN overview [].
With the help of LBSN’s check-in feature, users can engage in a variety of activities, maintain social connections with other users, and communicate spatiotemporal information (position and time). Since check-ins occur in real time, the trajectories derived from them depict a user’s actual physical movement. Consequently, check-in services in LBSNs fill the gap between the virtual and real worlds of social media. In recent years, the location prediction problem has gained much popularity [,]. It has been discovered, meanwhile, that people are hesitant to disclose places they have visited in private in their publicly available check-in trajectories. Advertising can more effectively target consumers by identifying unchecked places.
A large spatiotemporal dataset analysis reveals that check-ins are typically clustered around a small number of important points of interest []. This challenge is discussed in Section 5. The location prediction task uses these locations’ geographical coordinates and their semantic meaning as inputs. Furthermore, comparable check-ins made by people with similar social connections may be helpful in location prediction [].
This paper primarily focuses on hidden locations for prediction, which involves locations that users privately visit but do not publicly check into. Scientifically, this can be identified as a sparsity problem in check-in data. An illustrative example, considering a user’s daily commute: First, the user leaves their home, passing several streets that are often tracked. On their way, they stop at a park for a break. The park’s location is known to locals, but the user prefers not to reveal that they visit it. Afterwards, the user continues to their office, where they check in publicly. The park visit remains hidden, presenting a challenge for location-based prediction models.
Given a published trajectory (la → lb → lc → ld), the challenge is to infer unrecorded locations between successive check-ins, such as predicting a missing location between (lb → lc), which is known as the hidden location prediction problem. Unlike the next-location prediction problem, hidden location prediction aims to uncover unshared visits using historical check-in data.
Trajectory prediction plays a crucial role in developing applications for smart cities in a variety of fields, such as intelligent transportation systems []. It seeks to anticipate each entity’s future location over a specified period. Recently, trajectory prediction has attracted significant attention from a variety of academic fields, including machine learning, web and information retrieval, mobile computing, and others []. Basically, a trajectory can be shown as a series of nodes, where each node represents a place at a certain time interval. Trajectory data typically consist of spatial and temporal information, such as the sequence of locations or positions a user visits over time.
The key challenges of this research as mentioned above are the difficulty of predicting unchecked locations, along with the issue of data sparsity, which implies a substantial spatiotemporal dataset wherein check-ins are generally concentrated around a limited number of significant points of interest.
In this paper, we propose a model named Associative Hidden Location Trajectory Prediction (AHLTP), which employs a data mining technique to infer hidden locations from users’ publicly available trajectories. Addressing this challenge will unlock a more accurate, efficient location prediction model. AHLTP utilizes association rule mining to extract the frequency of consecutive check-in pairs. Mining the user check-in sequences, the model enhances the identification of implicit mobility patterns. Eventually, by integrating the preprocessed and resolved locations with the classifier, the AHLTP model significantly improves overall trajectory prediction, offering a more comprehensive and precise understanding of user movement behavior and dynamics. To further assess the efficiency of the AHLTP model, a comparison study is made with recent previous studies that have employed the same dataset.
The key contributions of the paper can be outlined as follows:
- Machine Learning for LBSN Data Analysis: Machine learning techniques are utilized to categorize LBSN data into popular location categories and predict user and resident mobility patterns.
- Hidden Location Prediction: A method is developed for predicting hidden or privately visited locations that are not explicitly disclosed in a user’s publicly available trajectory, thereby reconstructing a more complete movement history.
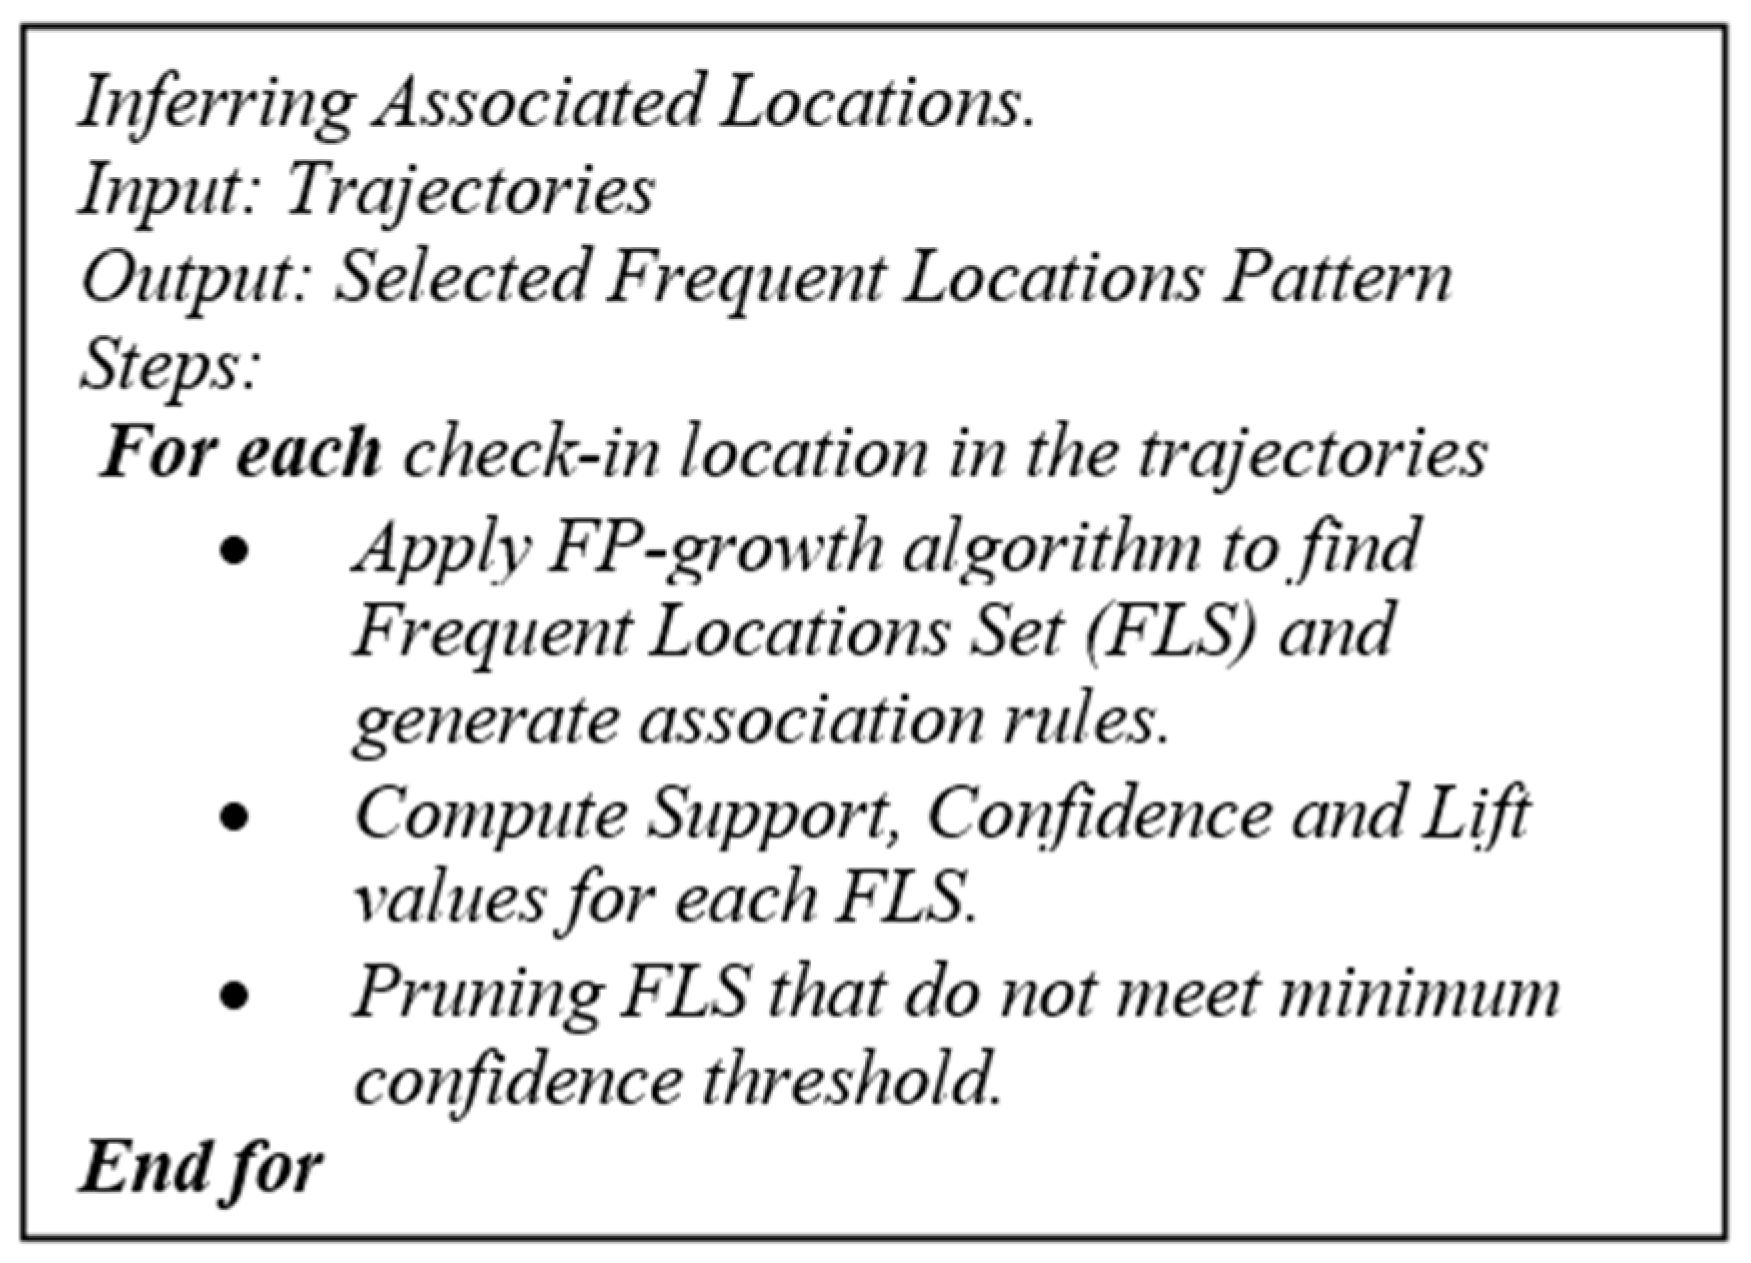
- Association Rule Mining for Hidden Locations: Consecutive check-in pairings are identified and leveraged to infer hidden locations, hence enhancing trajectory prediction accuracy.
- Semantic Context Analysis: Implicit attributes are considered for evaluation, such as the semantic aspects of locations (e.g., location types), to improve the understanding of user mobility behavior.
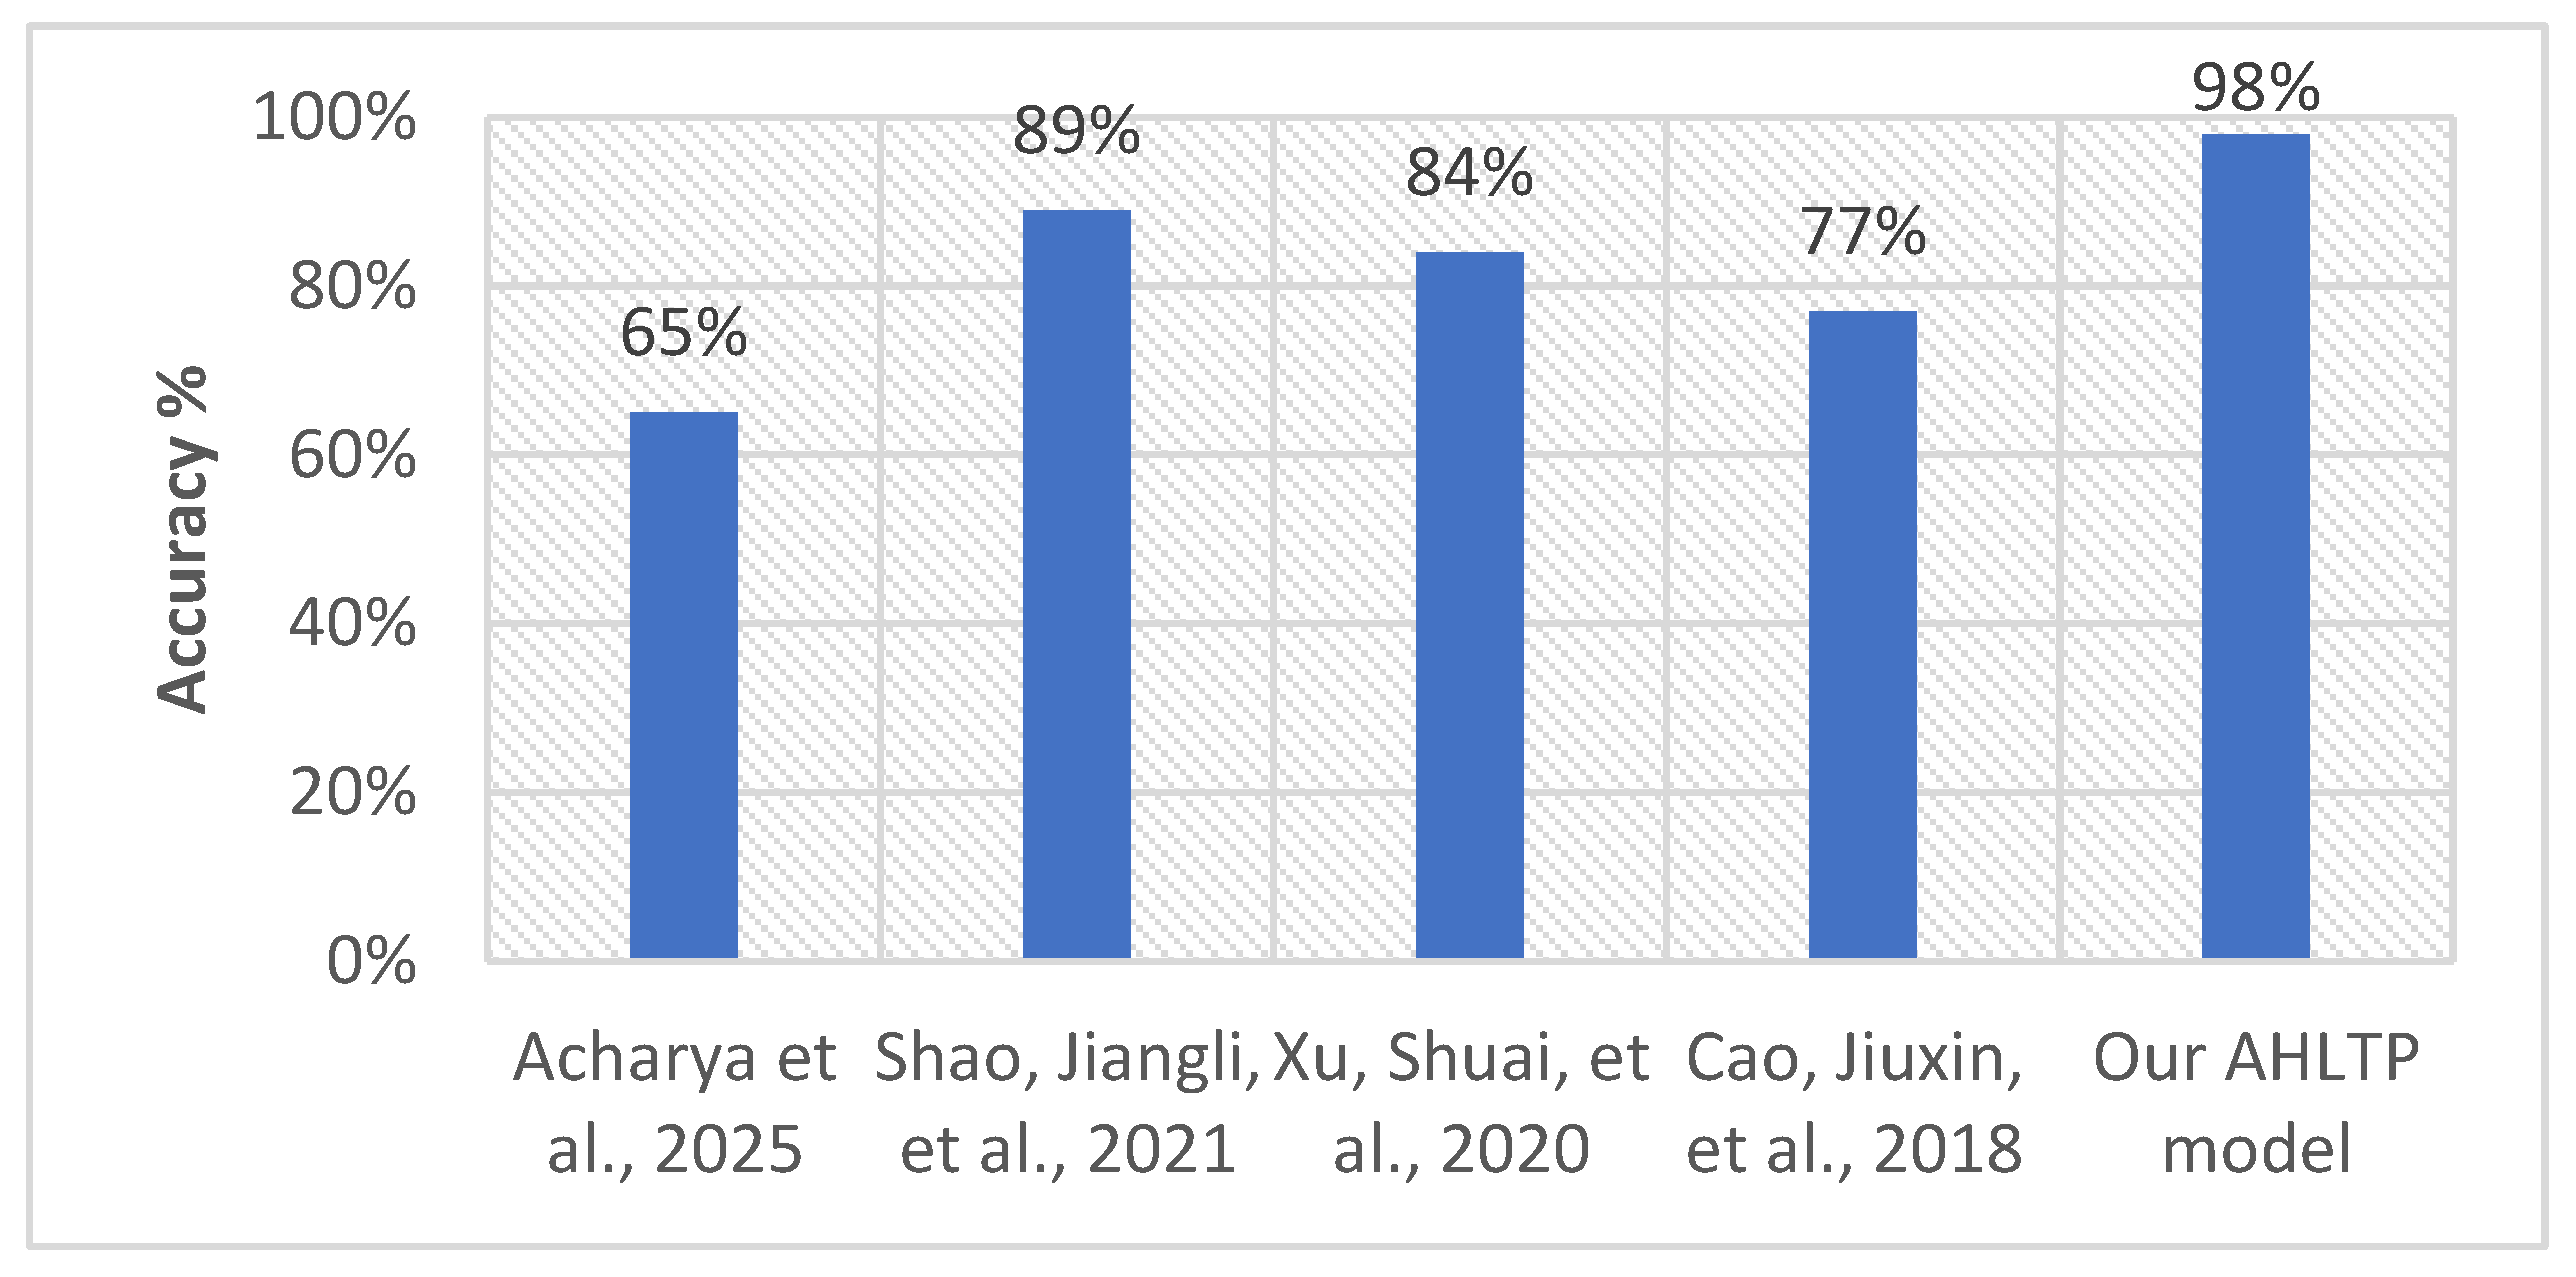
- Comprehensive Real-World Evaluation: Extensive experiments on real-world LBSN datasets are conducted, demonstrating that the proposed model outperforms state-of-the-art techniques in trajectory prediction.
Location prediction in LBSNs is an exciting yet challenging task. One major challenge is handling the study of users’ behavior to conceal information about specific hidden locations and investigate these hidden locations. Addressing this challenge will unlock a more accurate, efficient location prediction model. We will further discuss this research challenge in the following sections and how the proposed AHLTP model considers it.
The rest of the paper is organized as follows. Section 2 surveys the related work, while Section 3 states the empirical data analysis. The problem definition and proposed model are presented in depth in Section 4. Section 5 reviews the experimental evaluation, and Section 6 discusses the important key findings. Finally, the paper is concluded in Section 7 with a discussion of future work.
2. Related Work
Numerous analyses of user behavior in social networks have been made possible by the simplicity of spatiotemporal data collection technologies. These fall under several categories, such as location prediction, locating hidden social relationships, locating similar users, and spatiotemporal data analysis []. Spatiotemporal data can be acquired via the trajectories of moving objects captured by GPS devices, social events (e.g., postings, microblogs) that include location tags and timestamps, and environmental monitoring (e.g., forecasts, weather), etc. Concealed social connections in online social networks pertain to recognizing relationships among individuals that lack direct links within the social graph [].
Zhao et al. [] presented a spatiotemporal gated network, named STGN, for next points of interest (POI) recommendation by enhancing a long short-term memory network. Experiments were conducted to evaluate the performance of STGN on Foursquare, Gowalla and brightkite. Si et al. [] introduced the APRA-SA, an adaptive point of interest recommendation method that incorporates user behavior and location data. Experiments were applied on Foursquare and Gowalla datasets. Zhao et al. [] examined the emotional characteristics of locales by integrating user similarities with location data, alongside the POI recommendation method. They worked on Sina Weibo as the dataset. Neither of these works accounted for the time effect or user classification.
A heterogeneous graph embedding technique is used in [] to model the trust-aware concept for LBSN, representing the components of LBSN and their relationships (user–location, user–user). In [], the authors presented another graph convolutional network (PPR_IGCN) model that integrates social impact and cooperative influence into POI recommendations. It extracted the potential features of users and POIs, the results were conducted on Foursquare and Yelp datasets. Based on the anchoring effect, a latent Dirichlet allocation (LDA) model for the POI recommendation system was introduced in []. This model emphasized the critical role of initial check-in data and was evaluated on the Gowalla dataset. These studies, however, disregarded the temporal sequential influence of check-ins.
The impact of temporal sequential pattern has been discussed in [], For frequent pattern mining of time-informed sequences, the authors presented the TimeInformed Pattern Mining (TiPam) technique. This technique is based on actual data that was gathered in Kampala, Uganda.
The investigation of data patterns related to venues is one of the main areas of inquiry in the study of LBSN []. Authors in [] introduced a method for large-scale trajectory prediction called Relationship-aware Adaptive Hierarchical Graph Learning, or REAHG. They worked on hidden relationships between users and applied an evaluation based on a real-world Foursquare dataset and other taxis datasets. Another RNN approach utilizing spatiotemporal contexts to model sparse user mobility traces is introduced in []; the model was evaluated on Gowalla and Foursquare datasets. They claimed that their results outperform state-of-the art spatiotemporal RNNs by 15.9% when tackling the next location prediction task. In [], location categories were identified utilizing various machine-learning algorithms for the prediction of venue classes. They registered SinaWeibo (or Weibo), one of the most extensively utilized location-based social networks in China. Four different classifiers were applied on a Chinese dataset, including the generalized linear model, logistic regression, deep learning, and gradient-boosted trees. The results showed the deep learning with 99% accuracy, gradient-boosted trees with 93%, logistic regression with 91%, and generalized linear model with 85% accuracy. Xu, Shuai, et al. [] introduced a Venue2Vec model that makes it possible to predict a user’s next check-in location, as well as their future check-in location. The Foursquare real-world dataset was used for research in three separate cities: NYC, CA, and TKY.
The authors of [] provided a framework for user identity linkage that helps locate people across networks and formalizes the relationship between geolocations and texts to help in location prediction. Two datasets are used in the experiment: the trajectories data from Foursquare and Dianping3, a Chinese dataset. According to their model, they claimed that the prediction accuracy was 89% and 96% for Foursquare and the Chinese dataset, respectively. In [], the authors introduced self-ensembled contextual Thompson sampling (SECTS). The strategy sought to address the issues of cold-start users and data sparsity within the target domain. For experimentation, they utilized two real-world datasets, Gowalla and Foursquare, achieving an accuracy of 65% for point-of-interest recommendations.
Some related works considered the time context. As an illustration, Mazumdar, Pramit, et al. [], when analyzing users’ movement habits, separated time into workdays and weekends. In other words, they were limited to making predictions in two time modes. In contrast, Cao et al. [] analyzed users’ day-mode and week-mode mobility patterns to predict users’ future check-in positions in any fine-grained period.
Table 1 summarizes the related studies and their methodologies for location prediction.
Table 1.
Summary of different cross-domain recommendation methods in related work.
Although previous research proposed several effective methods, there are still some issues that need to be addressed to enhance the prediction of hidden location trajectories. First, while temporal sequential patterns for LBSNs have been developed to reflect user actions and behaviors, there has been limited research on understanding the preferences of users when checking into POIs and how to categorize these preferences. Moreover, the association relationships between checked-in locations are often not considered when making predictions. Besides, identifying hidden locations that are not displayed in a user’s publicly available trajectory.
3. Problem Definition
This section outlines how the proposed model was inspired by findings of hidden (implicit) relationships and dynamic relationships for sequential patterns. The section begins by describing the problem statement, followed by an explanation of the proposed AHLTP model.
Problem of Hidden Relationships
A sequential pattern is the behavior or routine in which people, groups, or objects move. It refers to approaches working with sequential patterns normally considering the interactions between people and concentrates on building relationships using geographical features and manually created rules. For example, two individuals connected to each other and walking together have similar trajectories. However, it is possible for different people who are not connected to each other to share similar movement patterns and the same interests. As illustrated in Figure 2, for instance, users A and B are not connected to each other; however, during weekdays, their patterns of mobility are similar: They always leave their residence to go to work, then to an event, then to eat lunch or dinner, and return to their residence. Such comparable connections are concealed in people’s actions and are not observable by rules that are created by hand.
Figure 2.
An illustration of dynamic and hidden relationships. Hidden relationships: although individual A and individual B are unrelated users, they move in a similar pattern during the weekdays. Dynamic relationships: because of their jobs, individuals A and B have similar movement patterns throughout the week, but these patterns might change on the weekends. Rather, during weekends, individual A moves similarly to individual C.
In order to simplify and accurately present the problem definition, the temporal information is left out, and the checked-in places will be ordered in chronological order of occurrence within the sequence trajectory. Consequently, Ti = {c1→ c2 → c3 → c4 → … cn} represents the published check-ins of an active user n. Notably, a location may show up more than once in a series. The proposed solution predicts the hidden location through the four steps:
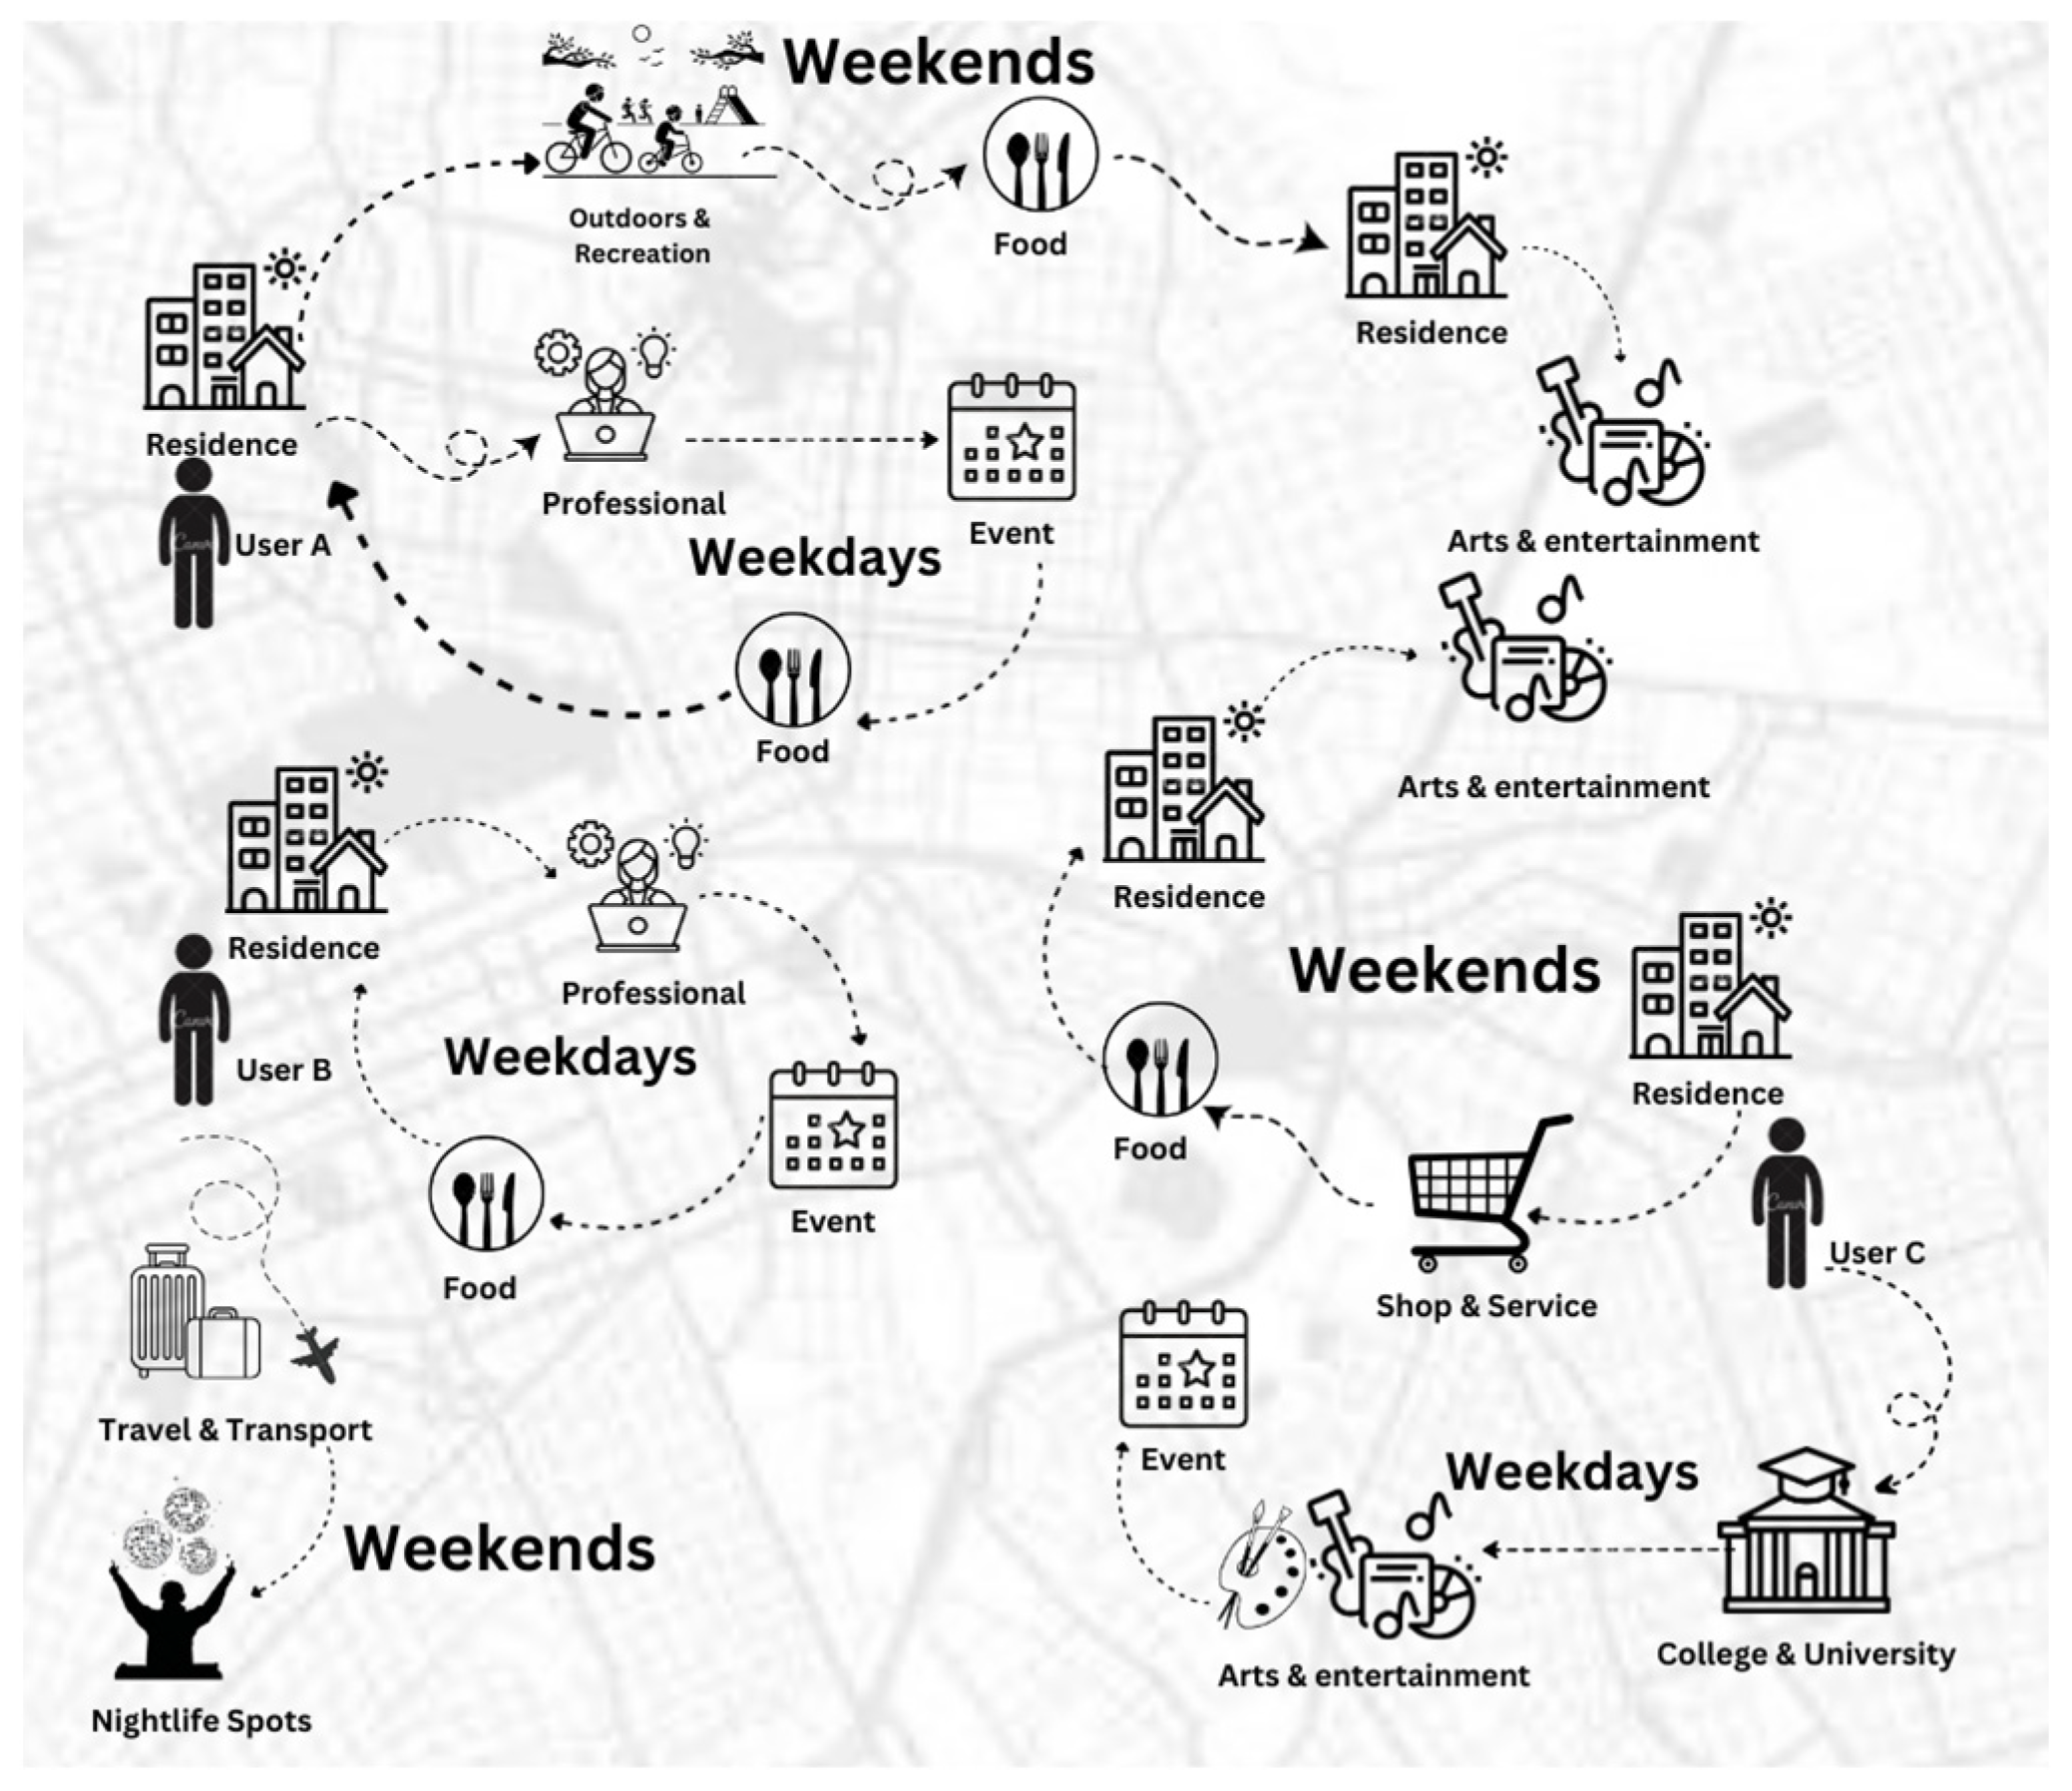
- Build the user trajectory Ti, which can be represented as a set of nodes {c1 → c2 → c3 → … cn}, each of which stands for a location at a specific point in time.
- Choose a series of check-ins as possible candidates for predicting a hidden location.
- Predict a collection of unchecked or hidden locations for every pair of successive check-ins that are chosen.
- Sort the anticipated locations according to the chance of occurrence.
- The trajectory prediction indicates the prediction of the whole check-in trajectory whether it includes explicit locations or hidden locations. In other words, the hidden location prediction is a part of trajectory prediction.
The proposed AHLTP model utilizes the association rule mining technique to deduce relationships among the submitted check-ins to predict the next location of a user based on historical movement patterns.
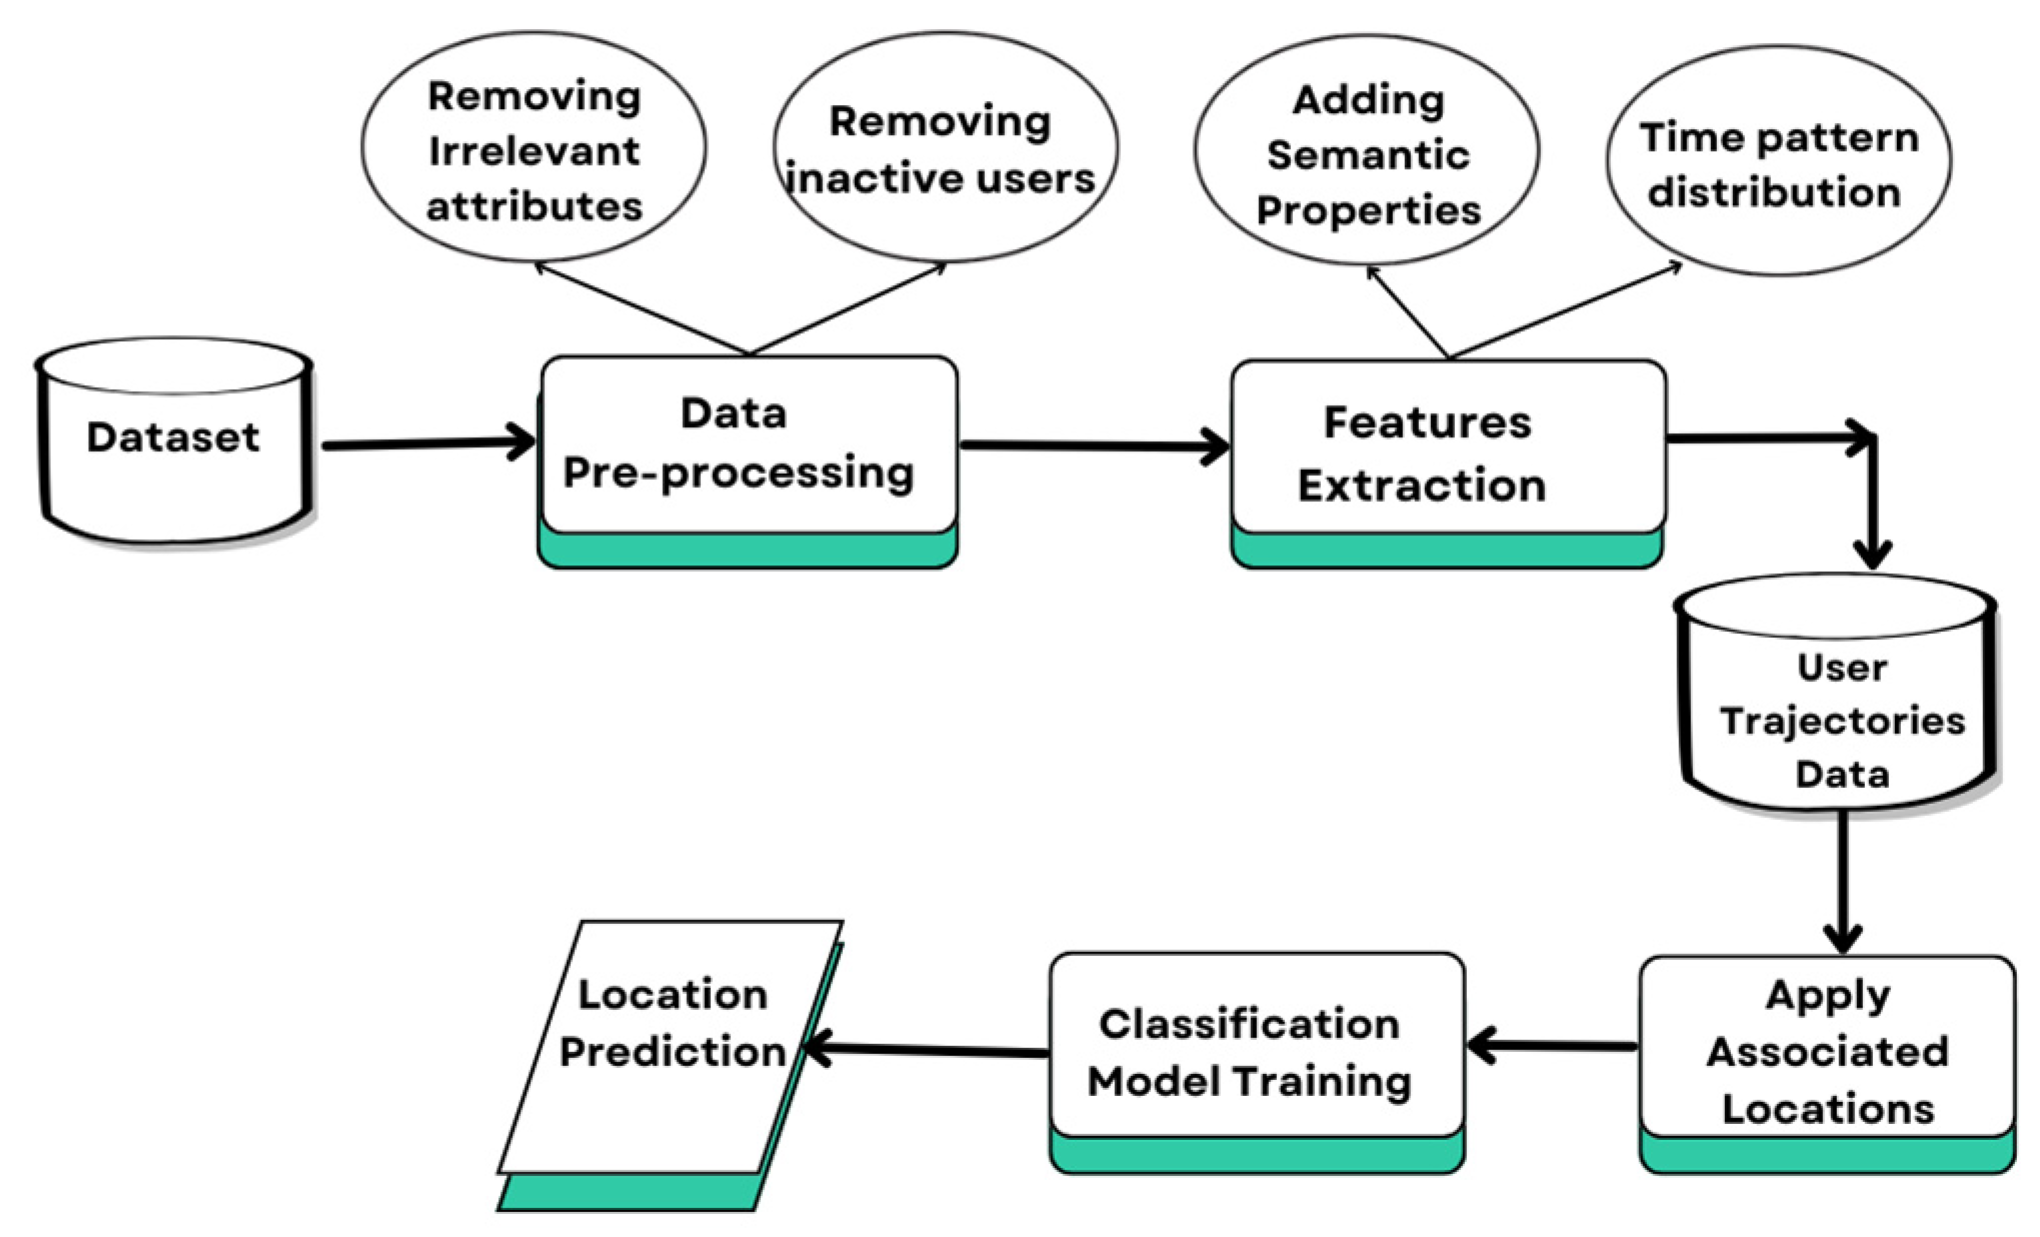
4. Proposed AHLTP Model and Methodology
The associative hidden location trajectory prediction (AHLTP) model consists of four key processing steps, as illustrated in Figure 3. Data pre-processing involves cleaning and structuring raw check-in data to remove noise and standardize formats for further analysis. Feature extraction is performed on check-ins that are transformed into trajectories, and the trajectories are built as a series of POI categories. Associated locations are applied by employing association rule mining to uncover hidden relationships between visited locations. Finally, classification into several types of venues categorizes the inferred locations into predefined venue types based on extracted features, improving the model’s accuracy in predicting user movement patterns.
Figure 3.
The proposed AHLTP model.
4.1. Data Pre-Processing
To transform the raw check-in data into a form that is both intelligible and helpful, pre-processing is an essential step. Missing, weakly managed, and out-of-range values are common problems with data. This is done in an effort to improve space performance and accuracy. As the amount of missing data is minimal and does not introduce significant bias, rows with missing values may simply be dropped. In order to determine the future location, trajectory pre-processing includes data cleaning, as the users with particularly low check-in records are excluded. To assess behavioral changes, it is essential to define discrete time intervals: one week (including weekdays and weekends), which will serve as an atomic unit for further temporal analysis.
4.2. Feature Extraction
Data splitting and feature selection: Using the location’s semantic properties (location type) is one way to take into account one of the implicit attributes. As shown in Table 2, the dataset includes the features as extracted during the data acquisition. Using the venueCategoryID, the crawling process was implemented on the dataset to add the location’s type. The location’s type feature has an important impact on our AHLTP model, as we build the trajectory by using it.
Table 2.
A sample of features in Foursquare check-in dataset.
After the dataset is crawled to extract the primary category_name variable, discrete time intervals are defined as follows: one week (including weekends and weekdays). Eventually, the trajectories are stored as a separate dataset, where each trajectory is represented by a series of nodes, each denoting a place at a particular moment in time.
4.3. Inferring Associated Locations
The AHLTP model investigates association rule mining [] to determine the relationship between locations based on social network users’ publicly available check-in trajectories. Association rule mining is predominantly utilized on market basket data to forecast user behaviors. It can also yield substantial insights into user mobility from public trajectory data. Utilizing association rules on check-in data will help uncover correlations among the check-ins.
In AHLTP, frequent patterns of check-in locations are mined using the Frequent Pattern growth technique. Both the number of candidate location sets and the overall quantity of database crawls needed can be diminished with FP growth. Support, Confidence, and Lift are essential metrics that guide the discovery of meaningful patterns from data.
To formulate the association rules, we initially compile the users’ location datasets along with those of associated users, which will be analyzed to filter and organize location elements based on the established support and confidence levels. Next, the lift value is computed using confidence and support. Confidence is a direct measure of the usefulness of a rule for predicting the next step in a trajectory. Higher confidence means more reliable predictions of future locations in the trajectory. To exclude the least representative POI and decrease the number of candidates, locations with a confidence level below 0.8 are excluded from the trajectories. Concurrently, we gather the sets of frequently visited locations and organize the objects based on their respective lift values, with the most frequented location positioned at the top. The steps for inferring associated locations are demonstrated in Figure 4.
Figure 4.
Steps for inferring associated locations.
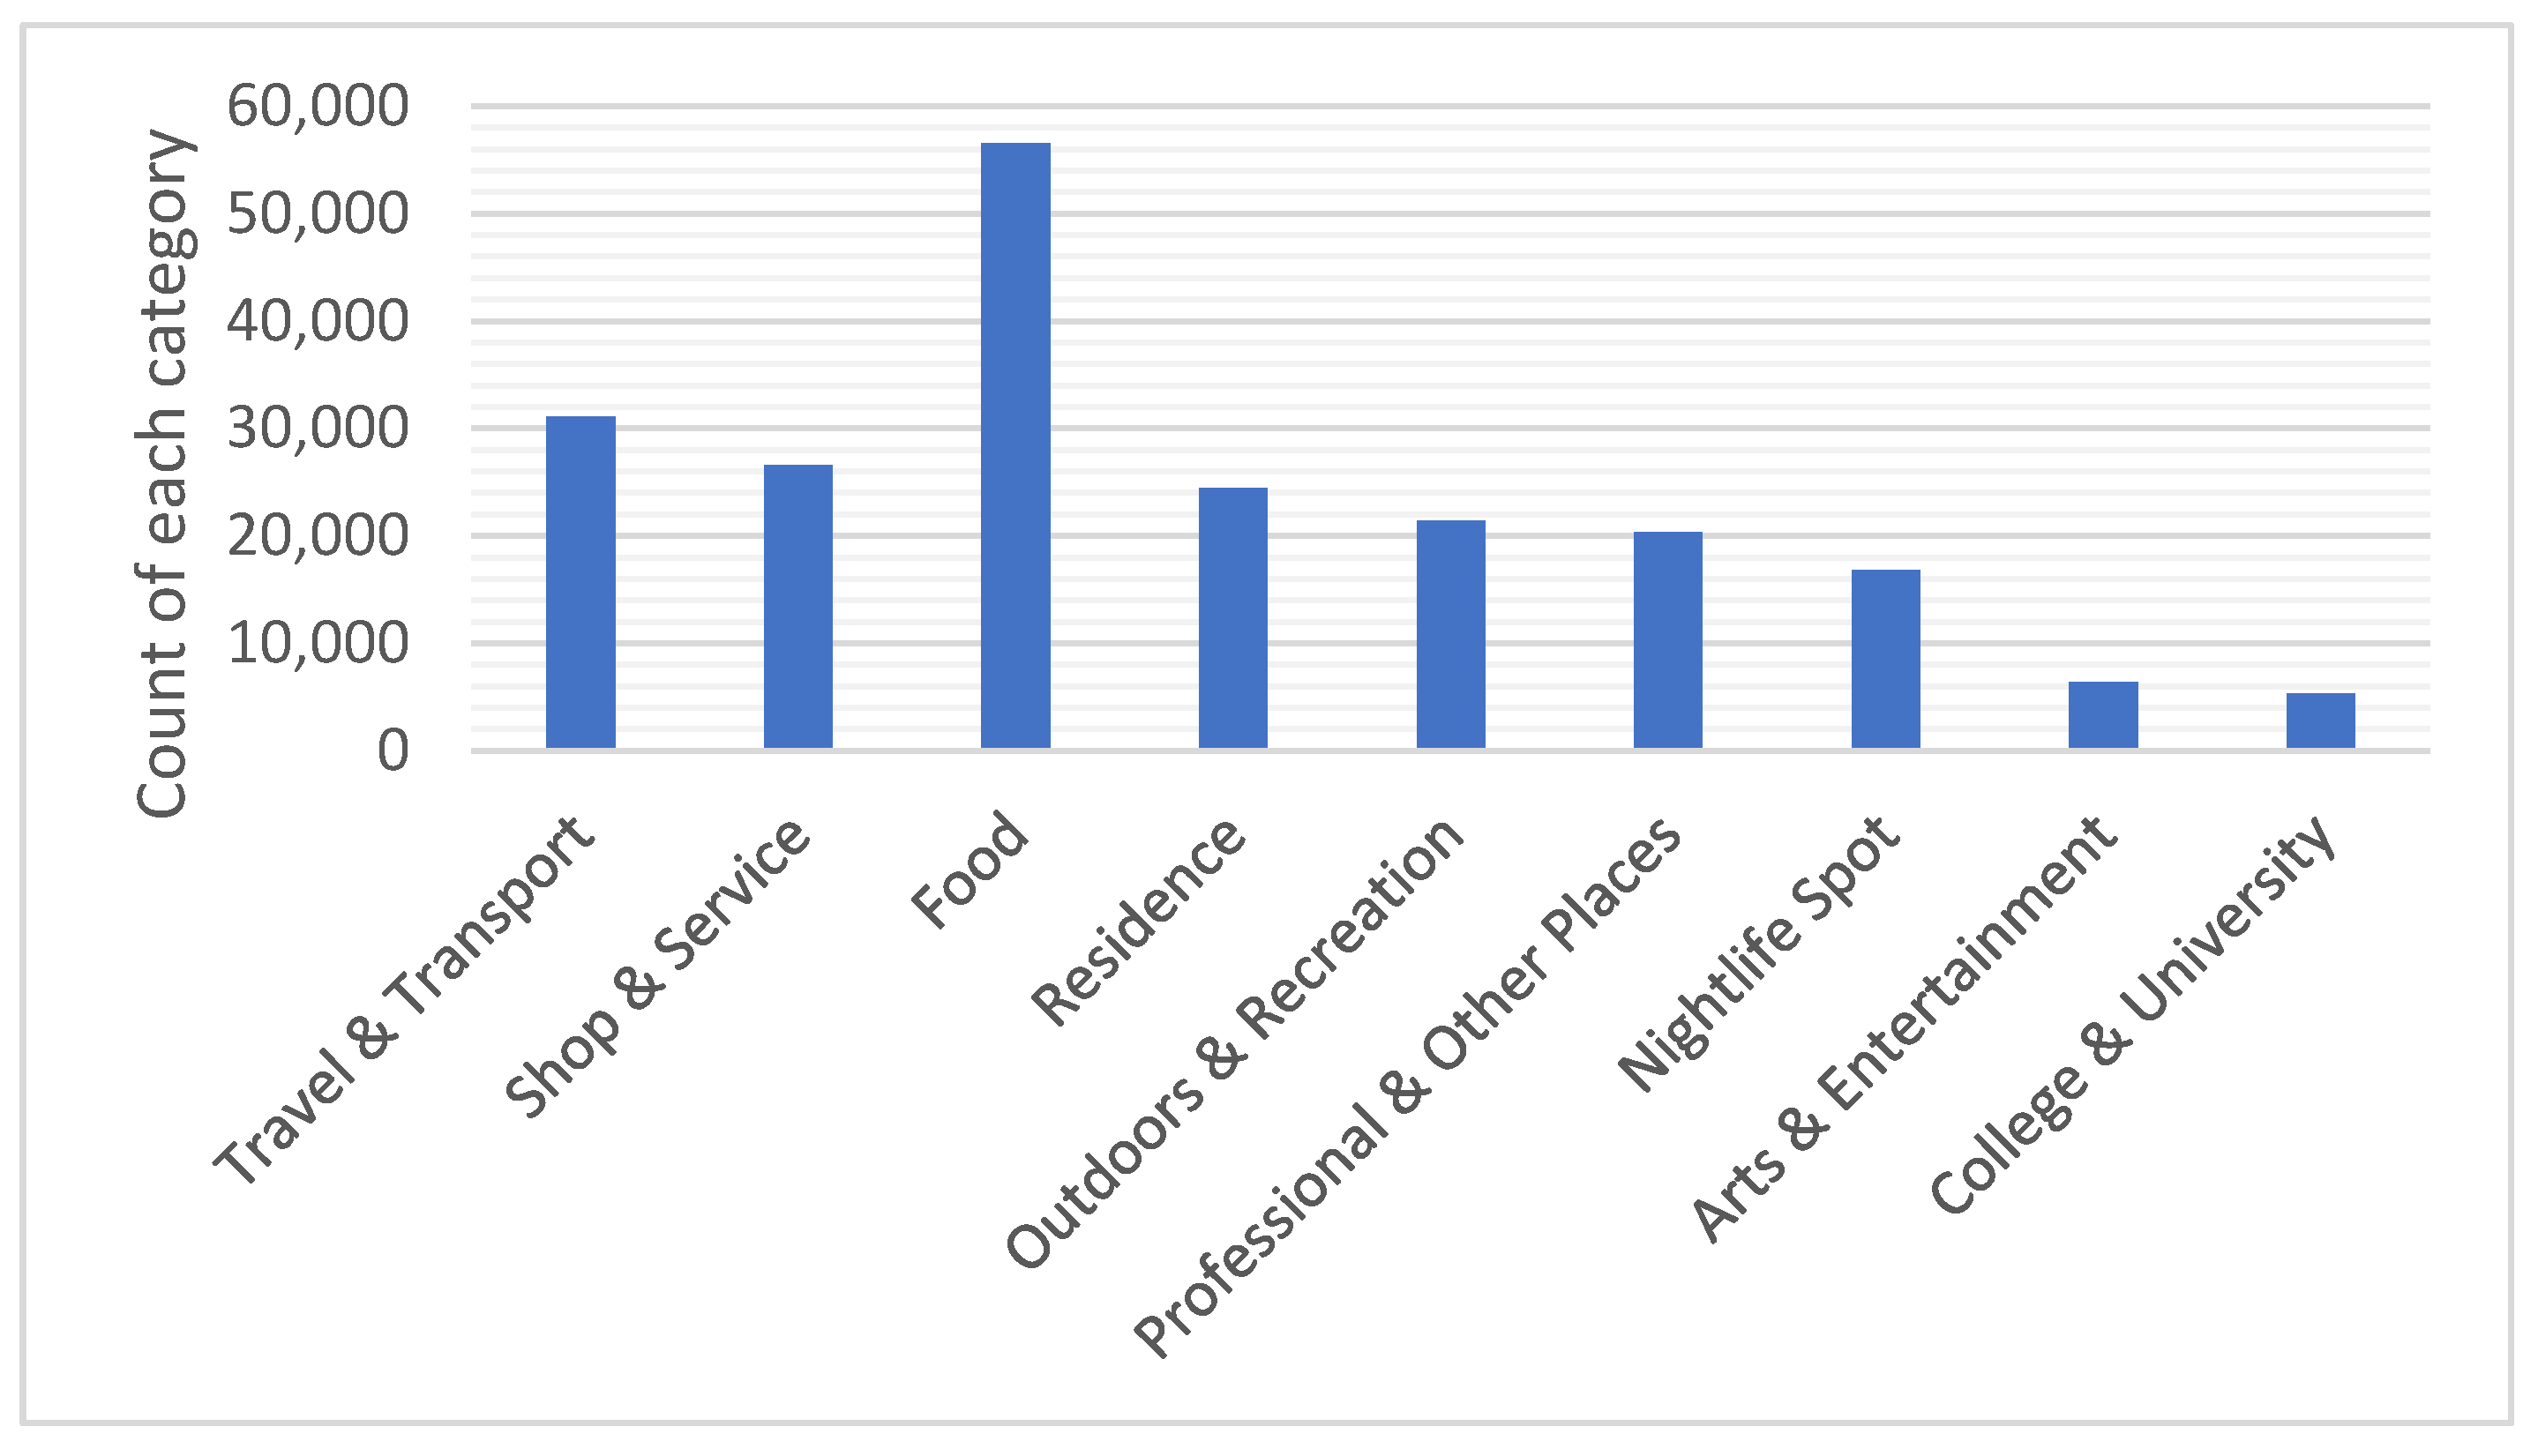
4.4. Classification into Several Types of Venues
For classifying the venues’ types, the following three machine learning techniques: deep learning, KNN, and gradient boosted tree, are suggested. Each of these classifiers is well-suited for LBSN prediction due to their strengths in handling spatial-temporal data and complex feature interactions [,,].
4.4.1. K-Nearest Neighbor
One of the most basic machine learning methods for prediction is the K-nearest neighbor classifier. With cluster members serving as the objects and the clustering criterion being determined by their distance from one another, the K-nearest neighbor classifier creates clusters. KNN remains one of the initial algorithms learned in data science because of its simplicity and precision. As the dataset expands, KNN’s efficiency diminishes, adversely affecting overall model performance. It is frequently employed for basic recommendation systems, pattern recognition, data mining, financial market forecasting, intrusion detection, and other applications [].
The Euclidean distance is frequently employed. The following formula is used to calculate the Euclidean distance for two entities having n-dimensional feature vectors, p = {p1, p2, …, pn} and q = {q1, q2, …, qn}:
The anticipated entity is then allocated to the cluster that contains the majority of its K-nearest neighbors. Lastly, it is anticipated that the entity will produce the same results as the entities in its cluster. The interval, nominal, and ordinal data types are features that the K-nearest neighbor classifier handles. Depending on the dataset being utilized, preparation may occasionally be required for data manipulations [].
4.4.2. Deep Learning
This neural network-based technique is employed using the H2O framework along with utilizing layered data information to uncover relevant patterns and classes. Based on the data at hand, each neuron is taught via alteration and functions as a classifier by combining predictions for the output. It functions in an adaptive way, reducing the effort and time needed for categorization by naturally optimizing the neurons by developing with no human involvement. The design of feed-forward artificial neural networks serves as the foundation for this deep learning technique. The ability to understand intricate correlations connecting both input and output factors is made possible by the hidden layers. It employs supervised learning methods, and in order to develop the algorithm using our earlier research, designated training information is needed. By maximizing a loss function, the algorithm discovers throughout development the associations connecting the variables being used and the target classes. The difference across the true and expected outputs is measured by the loss function.
In deep learning models, the Rectified Linear Unit is the most often utilized activation function due to its simpler mathematical procedures, as ReLU requires less computing power than other activation functions like tanh and sigmoid. Because just a small number of neurons are active at once, the network is sparse, which makes computation simple and effective []. The ReLU function returns 0 if it receives any negative input, but for any positive value x, it returns that value back. So it can be written as f(x) = max(0, x).
4.4.3. Gradient Boosted Trees
Gradient Boosted Tree (GBT) is an ensemble learning method that builds multiple decision trees sequentially, where each new tree corrects the errors of the previous ones. This iterative approach helps capture complex non-linear relationships in location-based social network (LBSN) prediction, making GBT robust for predicting user mobility, check-in behaviors, and venue preferences []. The effectiveness of using a gradient-boosted tree-based model for the classification of LBSN data can be observed in the results section.
To optimize the model’s performance, the following GBT hyperparameters are tuned:
- Learning Rate (eta)—Controls the contribution of each tree to the final model. Default: 0.1, but in LBSN, a lower value (e.g., 0.05) can prevent overfitting, improving generalization.
- Number of Trees (n_estimators)—Defines how many trees are built. A higher number (50–300 trees) can improve accuracy, but too many may lead to overfitting.
- Maximum Depth (max_depth)—Determines how deep each tree can grow. Shallow trees (depth = 4–6) prevent overfitting while still capturing complex relationships.
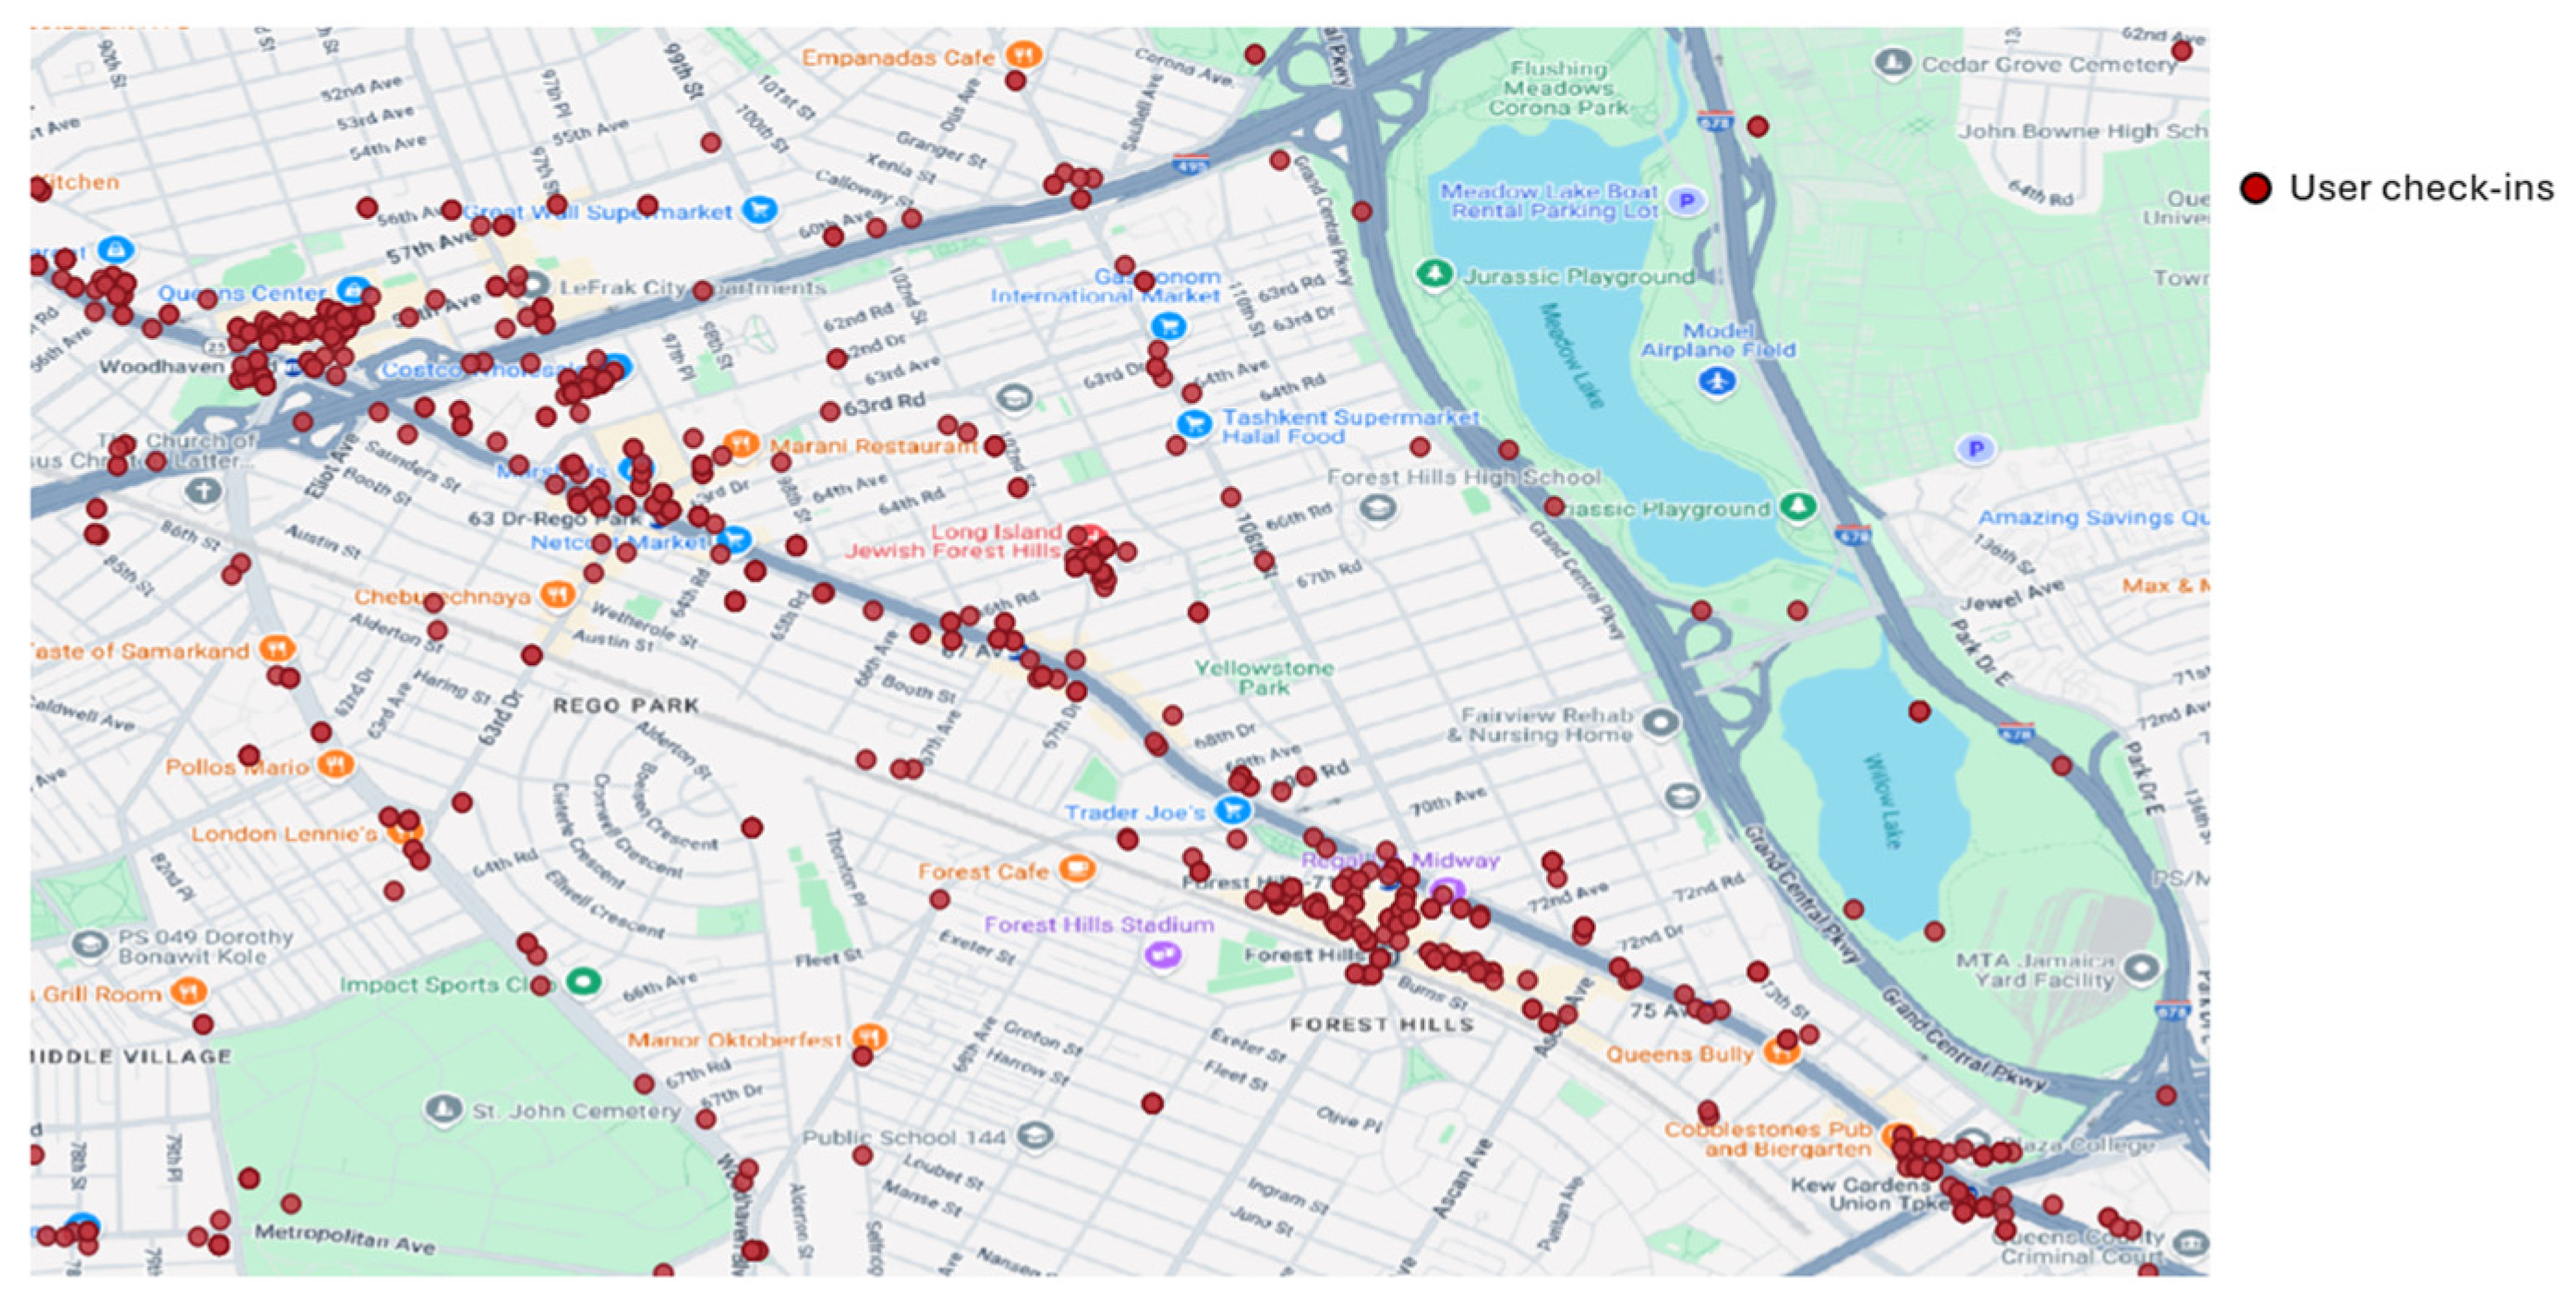
5. Empirical Data Analysis
This section presents an overview of the primary approaches for evaluating work performed in location-based social networks (LBSNs) and the associated public LBSN datasets. Researchers utilize several LBSNs to examine the challenge of point-of-interest (POI) recommender systems, with four notable platforms: Foursquare, Gowalla, Brightkite, and Yelp. Owing to privacy concerns associated with publicizing such data, real-world LBSN datasets are few. Additionally, service providers are reluctant to share researchers’ huge datasets since they view these datasets as vital when it comes to offering a competitive product. The main characteristics of publicly accessible datasets that are frequently utilized by the LBSN research community are listed in Table 3.
Table 3.
Real-World LBSN datasets that are openly accessible [].
An empirical data analysis was performed on Foursquare dataset to identify the LBSNs’ check-in trends with regard to spatial and semantic parameters, making use of the worldwide check-in data gathered in []. The Foursquare dataset includes check-in data venues in NYC collected from Foursquare from 24 October 2011 to 20 February 2012. It contains 227,428 check-ins. The data source used in the current study is acquired from Foursquare, containing the following attributes:
- User ID (anonymized)
- Venue ID (Foursquare)
- Venue Category ID (Foursquare)
- Latitude
- Longitude
- UTC time
As has been outlined in the previous section, recent research methods on POI recommendation focused on explicit interactions of LBSN objects such as users’ check-ins on POIs and social relationships, while neglecting implicit attributes (e.g., hidden locations and the association relations between locations) that cannot be directly observed but may notably contribute to the POI recommendation.
In this paper, a recommendation for considering one of the implicit attributes is to use the semantic properties of the location (location type). The main category of the location can be added by crawling the Foursquare dataset.
As seen in Figure 5, the chosen check-ins are plotted over an actual geographic map. The analysis of the dataset shows that the users’ check-in frequency is distributed unevenly. Figure 5 addresses the challenge of a large spatiotemporal dataset that shows check-ins are typically clustered around a small number of important points of interest.
Figure 5.
Checked-in locations in NYC.
As shown in the statistics count of each venue type in Figure 6, this dataset includes check-in, tip, and tag data of mainly food venues in NYC and nine other venue activity types (Travel & Transport, Shop & Service, Residence, Outdoors & Recreation, Professional & Other Places, Nightlife Spot, Arts & Entertainment, College & University, and Event).
Figure 6.
Category statistics for NYC Foursquare dataset.
6. Experimental Evaluation and Results
For the AHLTP model evaluation, the performance of classifiers is evaluated using two measures: Accuracy and Cohen’s kappa.
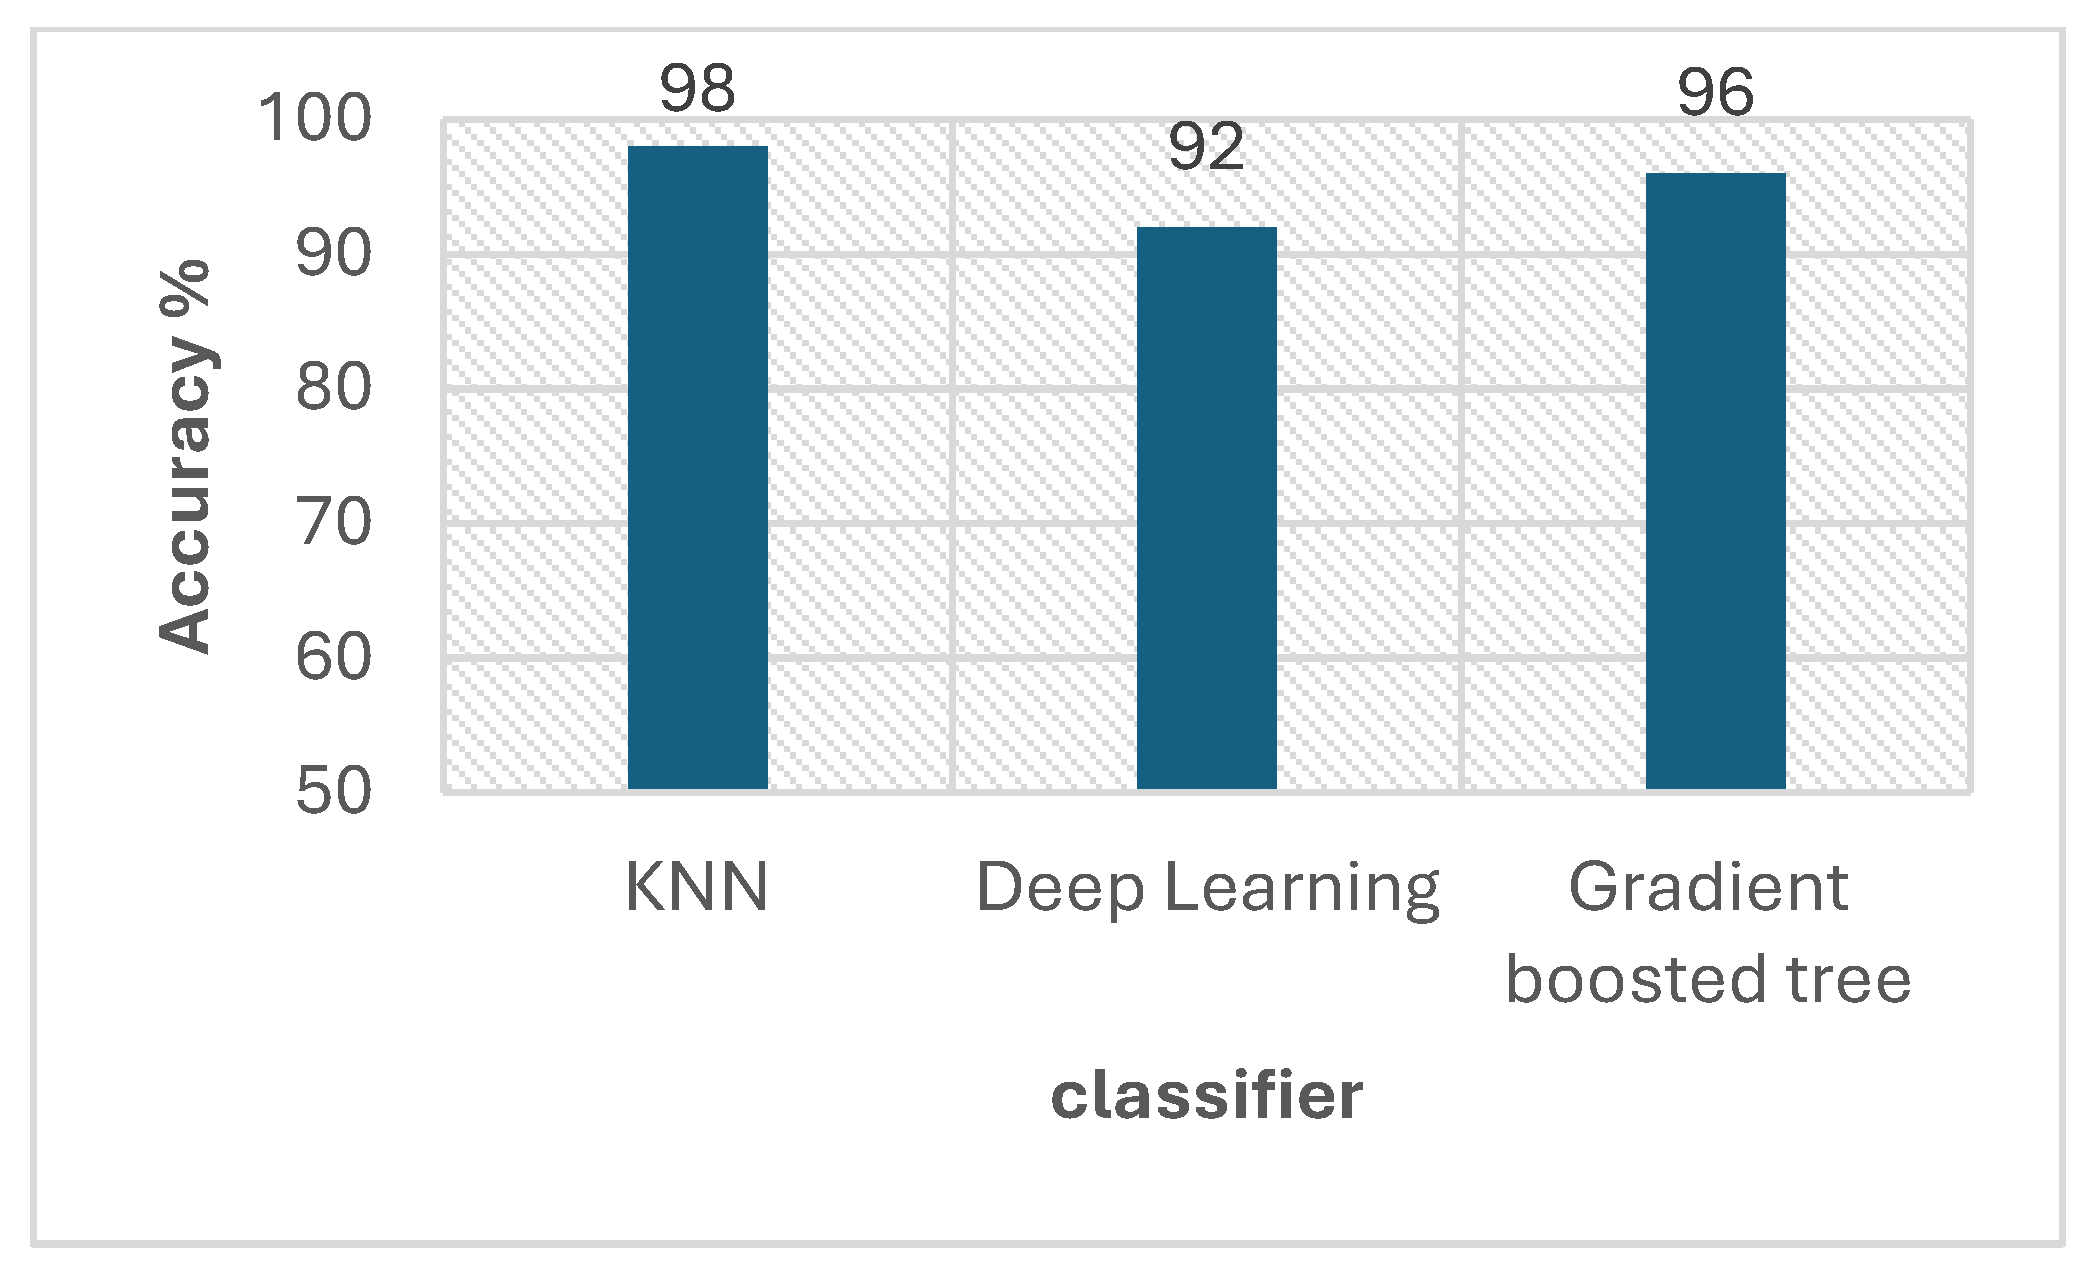
- To compute the accuracy measure, the confusion matrix is calculated. The accuracy is calculated by dividing the number of correct predictions by the total number of predictions made by the model.
Accuracy = Correct Predictions/All Predictions
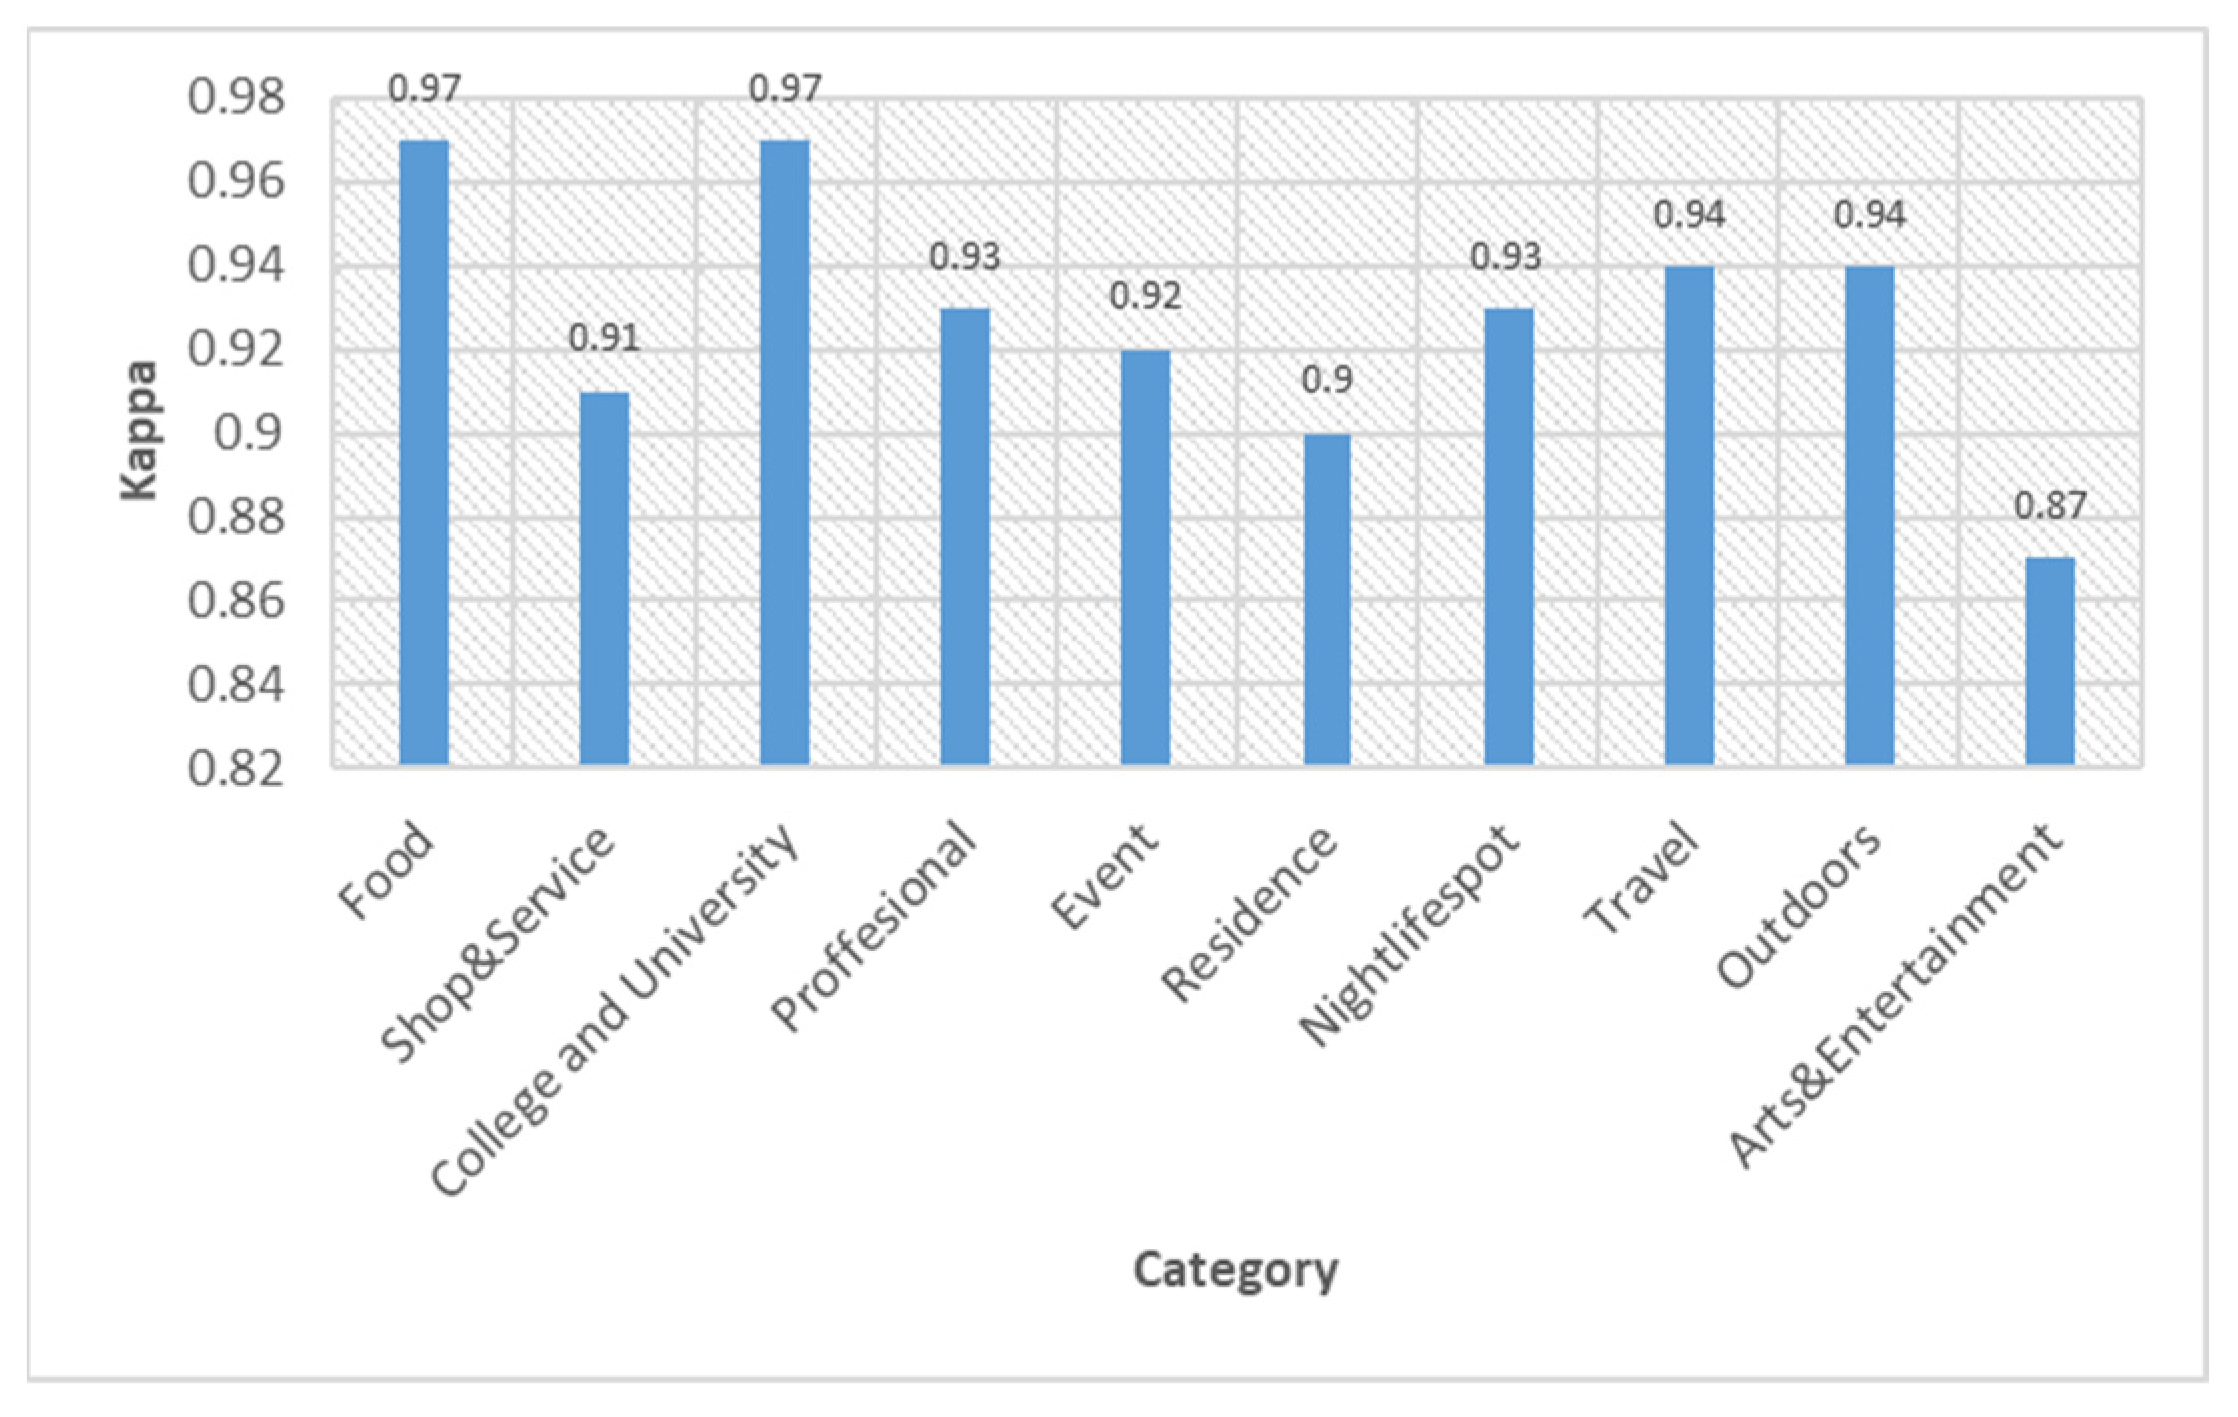
- Cohen’s kappa () is a statistical measure used to assess the agreement between two raters (or classifiers) who each classify items into mutually exclusive categories. It accounts for the possibility of an agreement occurring by chance.
- (Observed Agreement) is the proportion of times the two raters agree.
- (Expected Agreement by Chance) is the proportion of agreement that is expected if both raters are classifying randomly.
The values of Cohen’s kappa (κ) range from 0 to 1. κ = 1 implies perfect agreement, whereas κ = 0 means that the agreement is purely by chance.
All the machine learning models and evaluation criteria are developed via RapidMiner, a well-known machine learning tool. The testing is conducted using the 10-fold cross-validation method, ensuring a robust and reliable evaluation, where the dataset is split into 10 subsets. In each iteration, 80% of the data is used for training, while the remaining 20% is used for testing. This approach minimizes bias, enhances generalization, and provides a comprehensive assessment of the model’s performance across different data partitions.
This section presents the findings, accompanied by a comparison of the proposed model against related work. The proposed model is assessed through three phases. The first phase, A, is Machine Learning-Based Venue Classification. It aims to categorize location types by analyzing spatial, temporal, and contextual attributes, and hence assesses the improvement in location-based recommendations and user behavior modeling. The second phase, B, is building a sequential trajectory pattern. It assesses the improvement in classification accuracy through the incorporating of sequential movement patterns. The final phase, C, focuses on handling the prediction of hidden and missing locations in a user’s trajectory. The assessment evaluates the leveraging of both venue classification and sequential trajectory patterns after such handling.
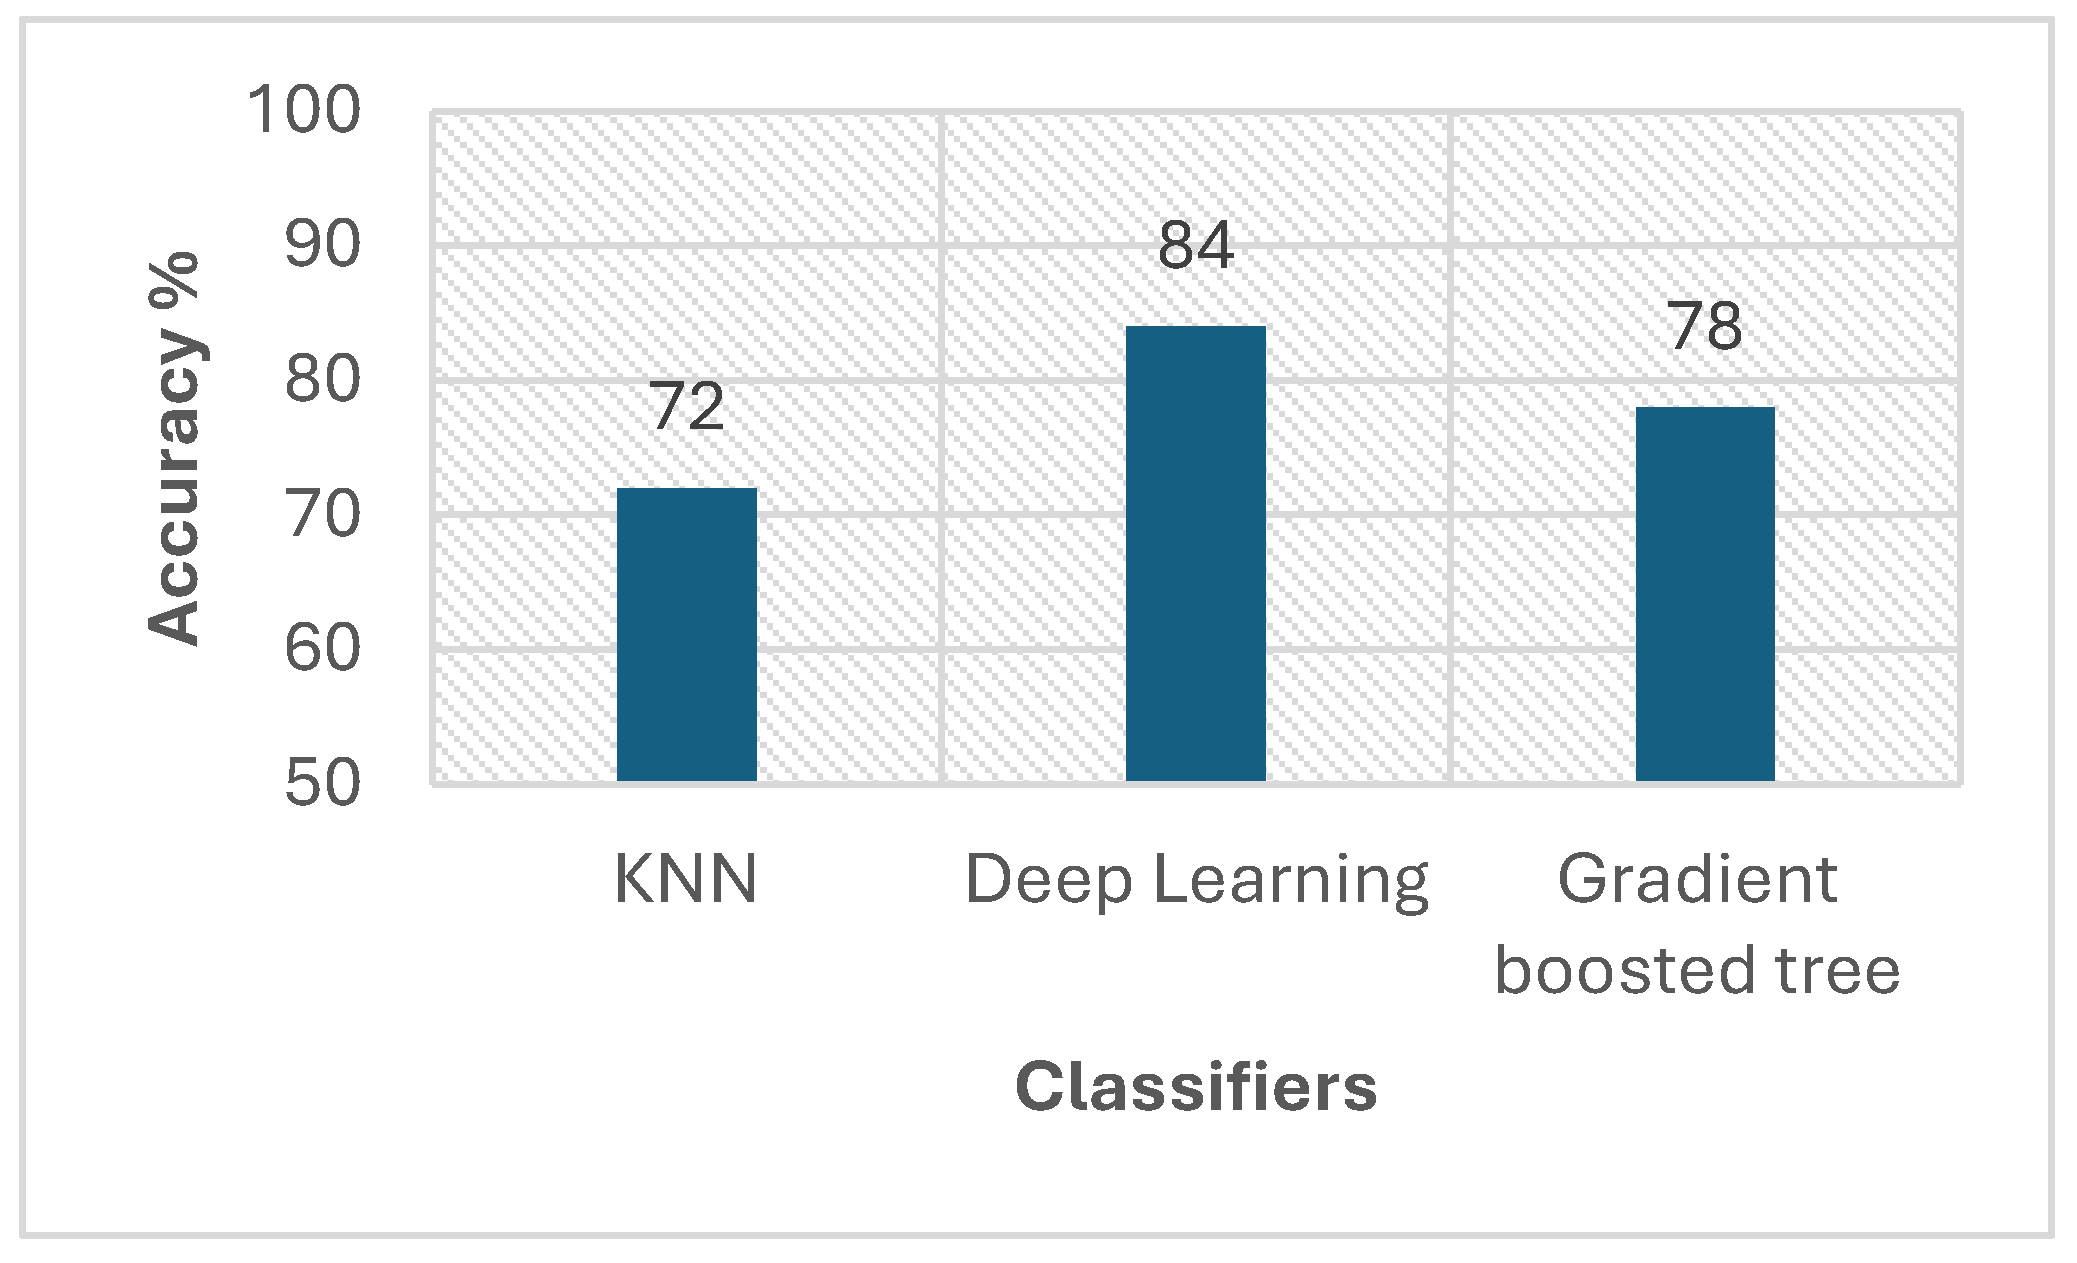
6.1. Machine Learning-Based Venue Classification
The initial step (phase A) entails predicting the location after applying the preprocessing process and crawling the Foursquare to extract the location semantic attributes. Subsequently, three different classifiers were applied.
Figure 7 displays the accuracy performance measure after the preprocessing stage is completed and the semantic attributes for each location’s category are added.
Figure 7.
Accuracy of phase A.
The figure demonstrates the high accuracy of deep learning for classification of the LBSN data into predefined categories. The KNN and GBT were among the other models that did exceptionally well in classifying the LBSN data.
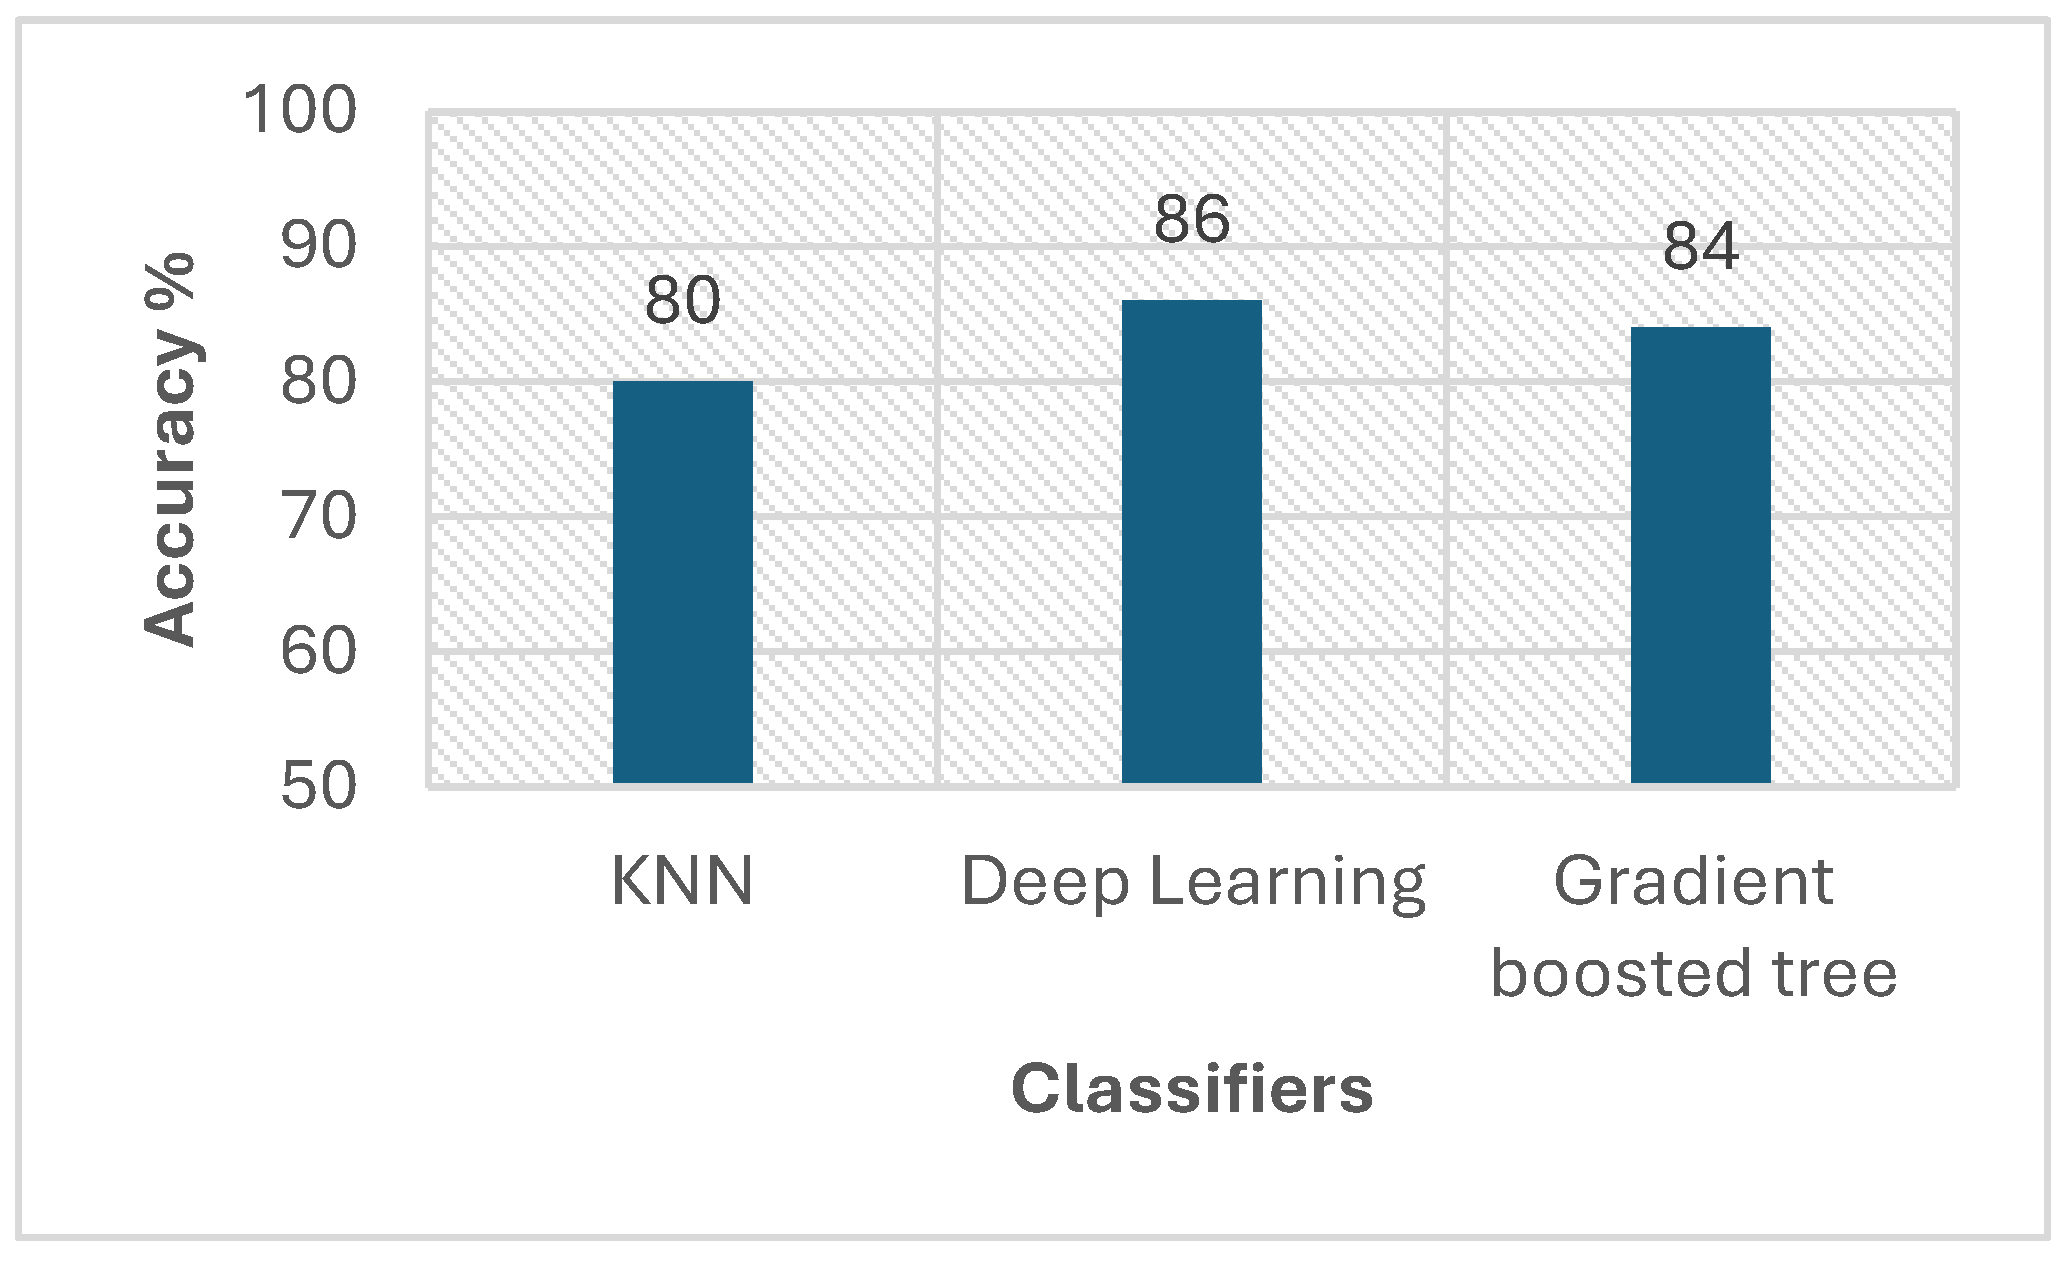
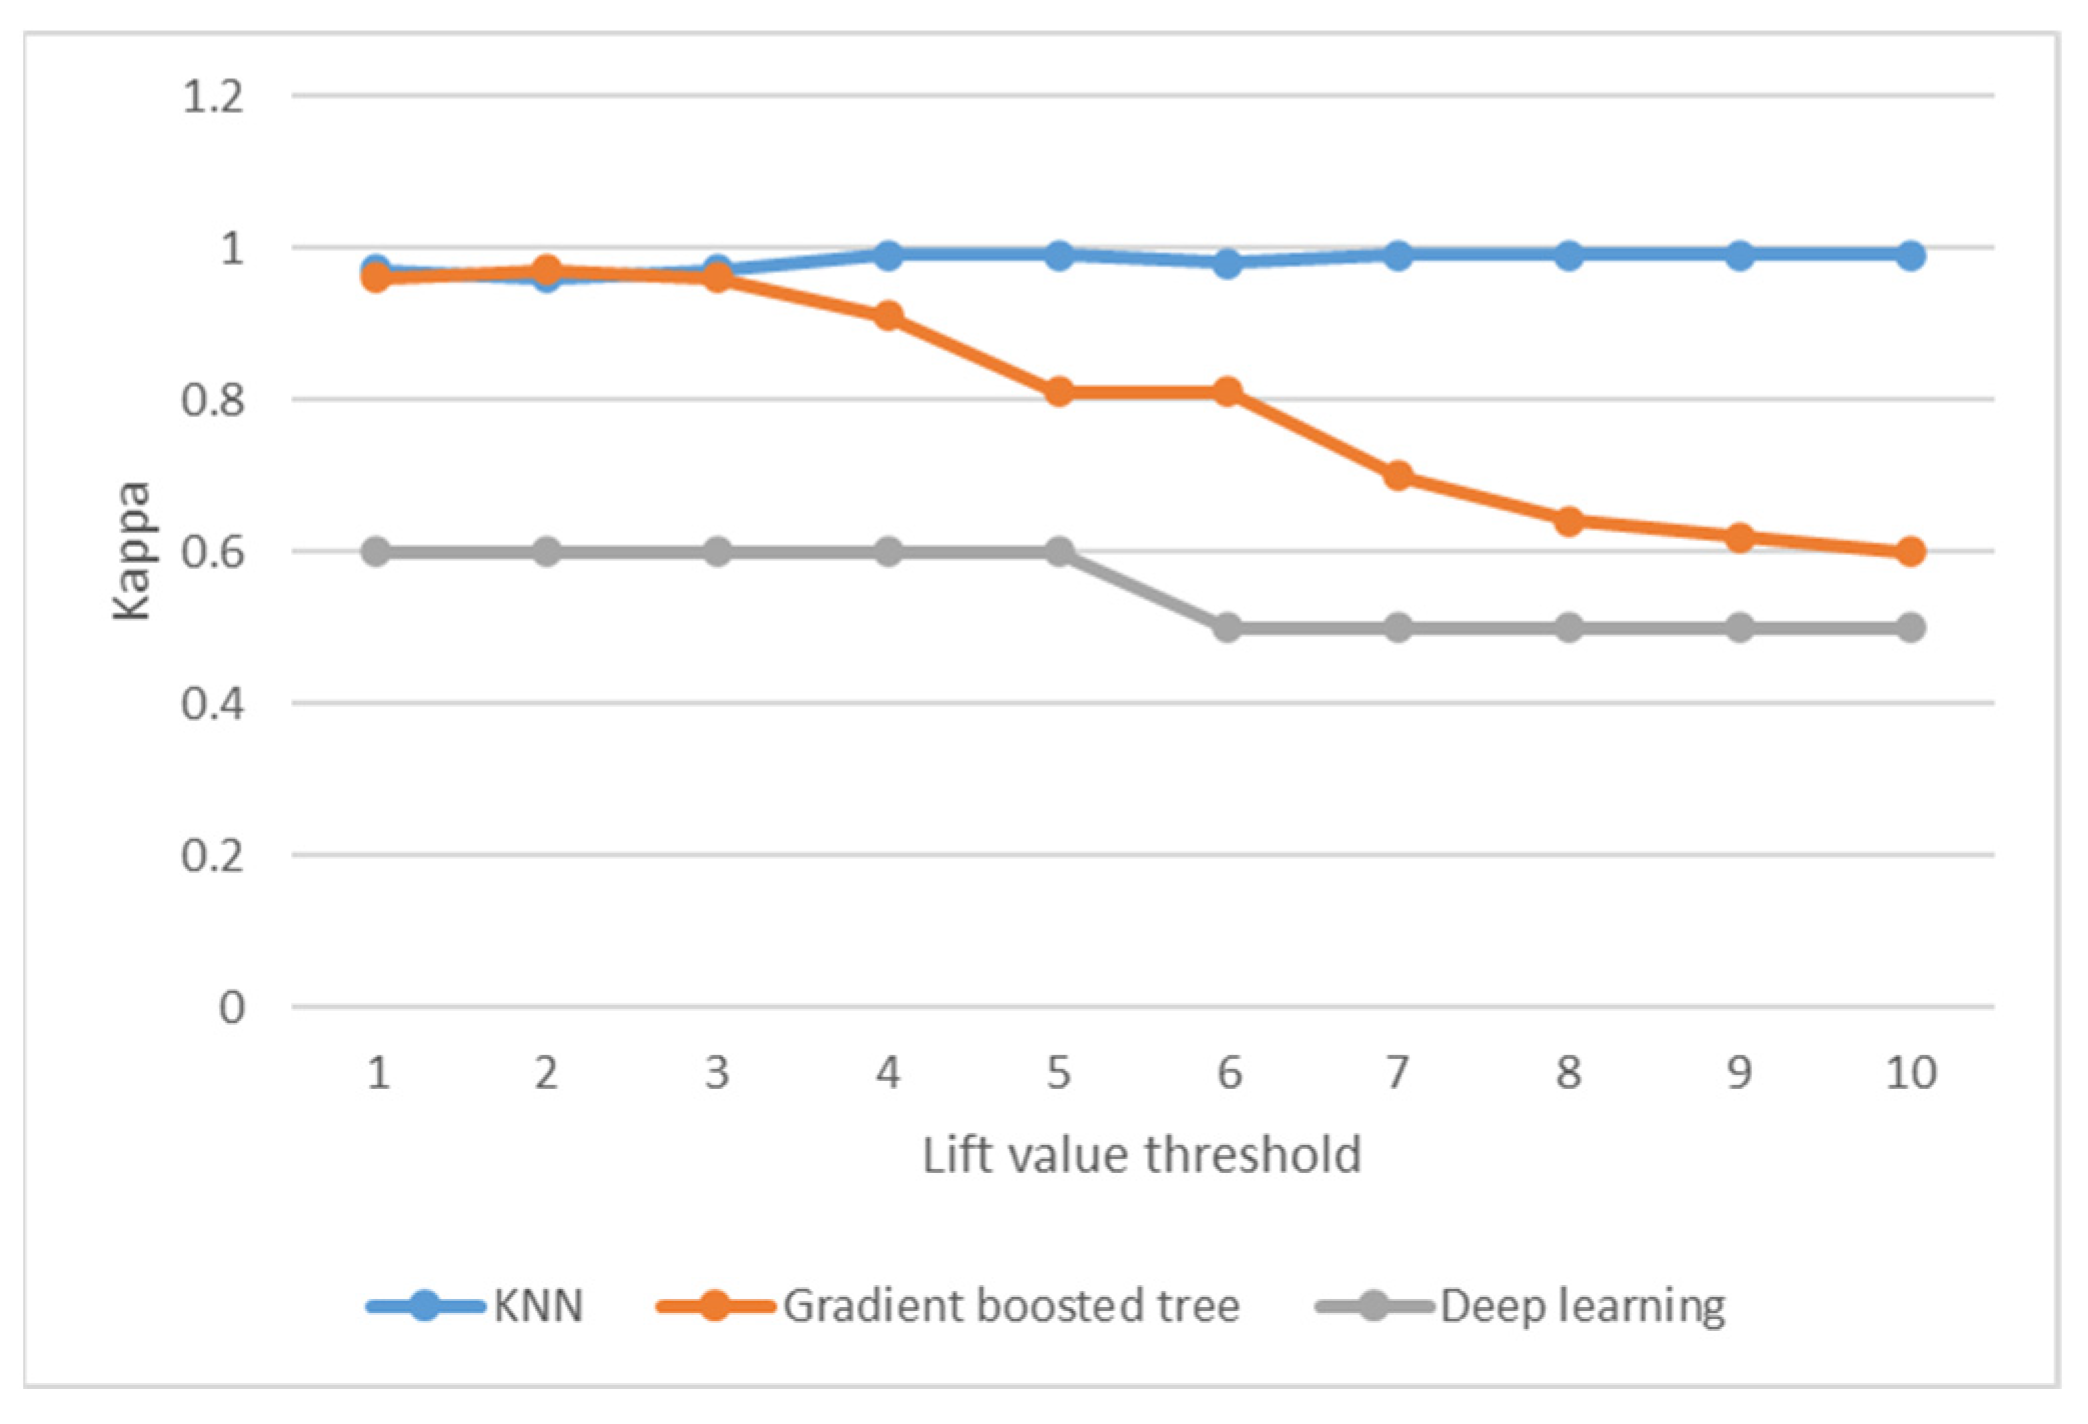
6.2. Enhanced ML by Integrating Sequential Trajectory Pattern for Check-Ins
Phase B of our approach involves constructing trajectories, represented as a collection of nodes, each signifying a place at a particular moment in time.
In particular, users with exceptionally low check-in records are separated out. For each individual check-in, the trajectories are shown as a series of POI categories; on average, each trajectory has 6.65 POI categories.
The segmentation of the check-ins is determined by temporal sequence for weekdays and weekends during a week. Figure 8 demonstrates improved accuracy values for the various classifiers, which indicates 8% accuracy enhancement for KNN, 6% enhancement for GBT, and 2% enhancement for deep learning.
Figure 8.
Accuracy of phase B.
The confusion matrix for each constructed model is presented to illustrate their performance on the testing data. Table 4, Table 5 and Table 6 show the confusion matrix for KNN, deep learning, and gradient boosted tree, respectively.
Table 4.
Confusion matrix for KNN in phase B.
Table 5.
Confusion matrix for deep learning in phase B.
Table 6.
Confusion matrix for gradient boosted tree in phase B.
The confusion matrix helps analyze the classification performance of a model by showing actual vs. predicted values. In Table 4, the model correctly classified 9006 Food, 730 Arts & Entertainment, 2376 Nightlife Spot, 5245 Travel & Transport, 3302 Outdoors & Recreation, 3902 Shop & Service, 3375 Professional & Other Places, 2637 Event, 4475 Residence, and 930 College & University venues. This indicates that the model is operating effectively, especially for Food (9006 correct classifications). In Table 5 and Table 6, the model works effectively in the food area as well. This can be explained by the fact that, according to the statistics in Figure 3, food has the highest check-in count.
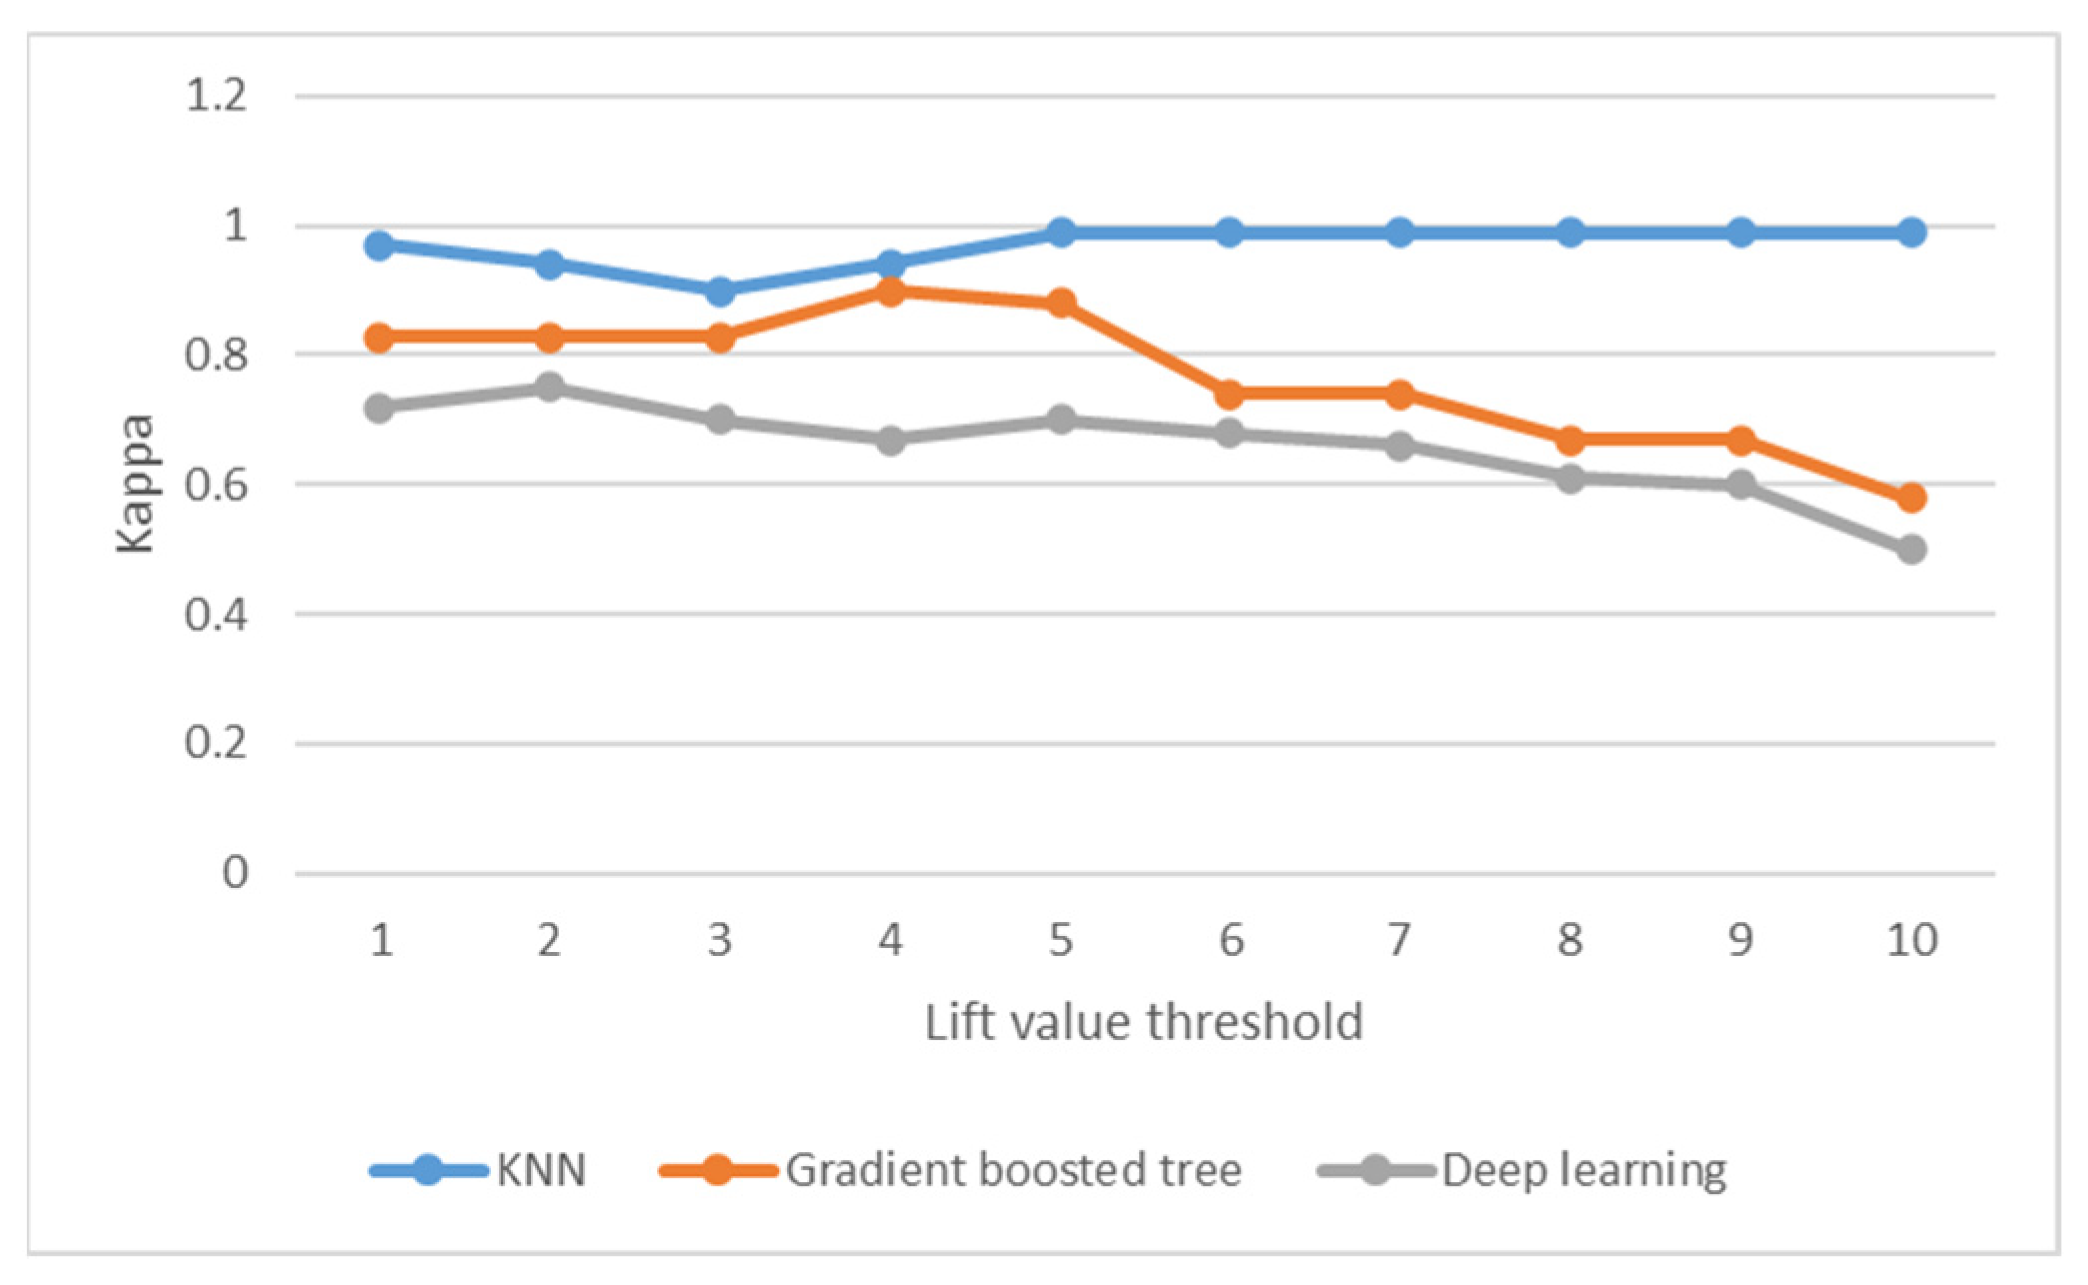
6.3. Enhanced Inference by AHLTP Model
The final phase C focuses on predicting hidden or missing locations in a user’s trajectory. By leveraging both venue classifications and sequential trajectory patterns, the model infers potentially unrecorded check-ins and predicts future locations, enhancing the accuracy of mobility forecasting in LBSN applications. During this phase, we employed the FP-Growth algorithm to identify frequent location sets and generate association rules. Improved accuracy values for the different classifiers are shown in Figure 9. Results in this phase have been significantly improved compared to phase B. KNN recorded accuracy of 98% with 18% enhancement compared to experiments in phase B. Deep learning had accuracy of 92% with 6% enhancement, while GBT recorded 96% accuracy with 12% enhancement compared to experiments in phase B.
Figure 9.
Accuracy of phase C.
To examine the quality of the inference of association rules, the comparison of each categorical variable is plotted through the computation of the Kappa measure. Figure 10 shows the significance of each category variable. The two primary kappa measures—for the Food and College & University categories—have the highest value with a 0.97 kappa measure. Subsequently, they are employed in the analysis of the lift threshold. Figure 11 and Figure 12 illustrate the kappa measure for Food and College & University, respectively. The threshold is standardized to fall within the interval [,,,,,,,,,]. The KNN has the highest and most stable kappa results compared with the other classifiers, followed by GBT. GBT achieves high accuracy and strong generalization, making it ideal for predicting user mobility patterns and personalizing location recommendations.
Figure 10.
The Kappa measure for different categories (for KNN classifier).
Figure 11.
The Kappa measure for the three different classifiers, for Food category versus Lift value threshold.
Figure 12.
The Kappa measure for the three different classifiers, for College & University category versus Lift value threshold.
The dataset in this study consists of structured check-in data with clear categorical labels. Since KNN is a straightforward non-parametric technique, it directly leverages the spatial proximity of locations without requiring feature transformation.
It effectively manages the local structures present in geolocation data, where neighboring points, like locations or check-ins, frequently exhibit similar characteristics or behaviors. In other words, the check-in dataset exhibits clustered patterns where users frequently visit specific locations. KNN excels in such cases by assigning labels based on nearest neighbors (by using distance-based metrics) rather than requiring deep hierarchical feature extraction. Moreover, the AHLTP model employs association rule mining to infer hidden locations. KNN benefits from these pre-extracted relationships by making direct nearest-neighbor comparisons.
On the other hand, deep learning models often need high-dimensional features to develop hierarchical representations, which may not be fully leveraged with geolocation data, particularly if the data size is not large or lacks complex, high-dimensional relationships. Additionally, deep learning might struggle with sparse data where certain check-ins are underrepresented, leading to potential overfitting or suboptimal generalization.
To reinforce performance claims, we conducted a statistical significance test using a pairwise t-test to compare the performance of three classifiers. The pairwise t-test helps to assess whether the observed differences in classifier performance are statistically significant or not.
Table 7 shows the p-values for the three classifiers KNN, deep learning, and gradient boosted-tree integrated with the proposed AHLTP model, measured at a confidence level of 5%. In our analysis, performance is measured by accuracy. The highest p-value of 0.977 obtained for the KNN supports the results obtained, indicating KNN outperformed the other two classifiers.
Table 7.
Pairwise t-test performance for the three classifiers.
Figure 13 presents a comparison of the accuracy of previous models and the proposed AHLTP method for trajectory prediction. Figure 13 compares models from related studies [,,,]. In [], the authors provided a model named Venue2Vec, which incorporates temporal-spatial context, semantic information for textual analysis, and sequential relationships. The authors in [] provided a methodology for linking user identities by comparing texts and geolocations across two social media platforms, using information inputs that are asymmetric, while the authors in [] examined users’ check-in patterns using certain variables related to time periodicity and personal preference, which were then integrated into a classification model and a supervised scoring model. To solve the problem of cold-start users, the authors in [] offered a model called SECTS that identifies POIs with a high probability for users with the same source and target domains.
Figure 13.
Comparative state-of-the-art models in references [,,,], respectively.
As the predictions are made without taking into account the associations between checked-in locations, the proposed AHLTP model concentrates on this aspect. The result is that it outperforms the other models in Figure 13 with an accuracy of 98% for the KNN classifier. This comparison shows how successful the suggested method is in enhancing trajectory prediction accuracy.
7. Conclusions and Future Work
In this paper, an associative hidden location trajectory prediction (AHLTP) model is proposed to predict related locations to solve the sparsity problem in check-in data (hidden locations). The proposed AHLTP model explicitly utilizes spatiotemporal contexts to identify historical hidden states with significant predictive value. AHLTP illustrates the effectiveness of trajectory mining in location-based social networks (LBSN) for revealing hidden locations through association rule mining algorithms, including FP-Growth, while also considering implicit features by leveraging the semantic characteristics of the location. Based on the input data, the KNN had a high accuracy measure of 98%, which indicates that it can correctly predict a user’s location category. Additionally, the gradient-boosted tree model’s excellent accuracy of 96% shows that it can produce accurate predictions. Deep learning showed strong results in location prediction but requires large datasets to achieve high classification accuracy. With accuracy values of up to 98%, the experimental evaluation was conducted on a real-word dataset from Foursquare, demonstrating the efficacy of the suggested strategy and outperforming some of the most representative approaches in the field.
Future work will incorporate neighboring user movement data for better location prediction, in addition to expanding some real-world applications and datasets for smart city development and business intelligence.
Author Contributions
Conceptualization was conducted by E.M.B., A.A.-a., S.R. and T.F.G.; methodology by E.M.B., A.A.-a., S.R. and T.F.G.; software by E.M.B.; validation by E.M.B., A.A.-a., S.R. and T.F.G.; formal analysis by E.M.B., A.A.-a., S.R. and T.F.G.; investigation by E.M.B., A.A.-a., S.R. and T.F.G.; resources E.M.B., A.A.-a. and S.R.; data curation by E.M.B., A.A.-a. and S.R.; writing—original draft preparation by E.M.B.; writing—review and editing by A.A.-a., S.R. and T.F.G.; visualization by E.M.B., A.A.-a. and S.R.; supervision by A.A.-a., S.R. and T.F.G.; project administration by T.F.G.; funding acquisition by E.M.B., A.A.-a., S.R. and T.F.G. All authors have read and agreed to the published version of the manuscript.
Funding
This research received no external funding.
Data Availability Statement
The Foursquare dataset was collected from Foursquare. It can be accessed via: https://foursquare.com.
Conflicts of Interest
The authors declare no conflict of interest.
References
- Koolwal, V.; Mohbey, K.K. A Comprehensive Survey on Trajectory-Based Location Prediction. Iran J. Comput. Sci. 2020, 3, 65–91. [Google Scholar] [CrossRef]
- Khan, N.U.; Wan, W.; Yu, S. Location-Based Social Network’s Data Analysis and Spatio-Temporal Modeling for the Mega City of Shanghai, China. ISPRS Int. J. Geo-Inf. 2020, 9, 76. [Google Scholar] [CrossRef]
- Muhammad, R.; Zhao, Y.; Liu, F. Spatiotemporal Analysis to Observe Gender Based Check-In Behavior by Using Social Media Big Data: A Case Study of Guangzhou, China. Sustainability 2019, 11, 2822. [Google Scholar] [CrossRef]
- Bahgat, E.M.; Rady, S.; Abo-Alian, A.; Gharib, T.F. A Comparative Study on Point-of-Interest Recommendation Techniques in Location-Based Social Network. In Proceedings of the Eleventh International Conference on Intelligent Computing and Information Systems (ICICIS), Cairo, Egypt, 21–23 November 2023; IEEE: New York, NY, USA, 2024; pp. 360–365. [Google Scholar]
- Kim, J.S.; Jin, H.; Kavak, H.; Rouly, O.C.; Crooks, A.; Pfoser, D.; Wenk, C.; Züfle, A. Location-based social network data generation based on patterns of life. In Proceedings of the 2020 21st IEEE International Conference on Mobile Data Management (MDM), Versailles, France, 30 June–3 July 2020; IEEE: New York, NY, USA, 2020; pp. 158–167. [Google Scholar]
- Bao, J.; Zheng, Y.; Wilkie, D.; Mokbel, M.F. Recommendations in Location-Based Social Networks: A Survey. Geoinformatica 2015, 19, 525–565. [Google Scholar] [CrossRef]
- Abideen, Z.U.; Sun, X.; Sun, C. The Multi-Module Joint Modeling Approach: Predicting Urban Crowd Flow by Integrating Spatial–Temporal Patterns and Dynamic Periodic Relationship. Eng. Appl. Artif. Intell. 2024, 141, 109721. [Google Scholar] [CrossRef]
- Gad, W.; Mostafa, T.; Badr, N. A Location Prediction Methods: State of art. Int. J. Intell. Comput. Inf. Sci. 2021, 21, 119–133. [Google Scholar]
- Nezhadettehad, A.; Zaslavsky, A.; Abdur, R.; Shaikh, S.A.; Loke, S.W.; Huang, G.-L.; Hassani, A. Predicting Next Useful Location With Context-Awareness: The State-Of-The-Art. arXiv 2024, arXiv:2401.08081. [Google Scholar] [CrossRef]
- Yan, Z.; Chakraborty, D.; Parent, C.; Spaccapietra, S.; Aberer, K. Semantic Trajectories: Mobility Data Computation and Annotation. ACM Trans. Intell. Syst. Technol. 2013, 4, 49. [Google Scholar] [CrossRef]
- Yang, Y.; Fang, Z.; Xie, X.; Zhang, F.; Liu, Y.; Zhang, D. Extending Coverage of Stationary Sensing Systems with Mobile Sensing Systems for Human Mobility Modeling. Proc. ACM Interact. Mob. Wearable Ubiquitous Technol. 2020, 4, 100. [Google Scholar] [CrossRef]
- Chen, W.; Liang, Y.; Zhu, Y.; Chang, Y.; Luo, K.; Wen, H.; Li, L.; Yu, Y.; Wen, Q.; Chen, C.; et al. Deep Learning for Trajectory Data Management and Mining: A Survey and Beyond. arXiv 2024, arXiv:2403.14151. [Google Scholar] [CrossRef]
- Scellato, S.; Noulas, A.; Mascolo, C. Exploiting place features in link prediction on location-based social networks. In Proceedings of the 17th ACM SIGKDD International Conference on Knowledge Discovery and Data Mining, San Diego, CA, USA, 21–24 August 2011; pp. 1046–1054. [Google Scholar]
- Zhao, P.; Luo, A.; Liu, Y.; Xu, J.; Li, Z.; Zhuang, F.; Sheng, V.S.; Zhou, X. Where to Go Next: A Spatio-Temporal Gated Network for Next POI Recommendation. IEEE Trans. Knowl. Data Eng. 2022, 34, 2512–2524. [Google Scholar] [CrossRef]
- Si, Y.; Zhang, F.; Liu, W. An Adaptive Point-of-Interest Recommendation Method for Location-Based Social Networks Based on User Activity and Spatial Features. Knowl. Based Syst. 2019, 163, 267–282. [Google Scholar] [CrossRef]
- Zhao, G.; Lou, P.; Qian, X.; Qian, X.; Hou, X. Personalized Location Recommendation by Fusing Sentimental and Spatial Context. Knowl. Based Syst. 2020, 196, 105849. [Google Scholar] [CrossRef]
- Canturk, D.; Senkul, P.; Kim, S.-W.; Toroslu, I.H. Trust-Aware Location Recommendation in Location-Based Social Networks: A Graph-Based Approach. Expert Syst. Appl. 2022, 213, 119048. [Google Scholar] [CrossRef]
- Liu, J.; Yi, H.; Gao, Y.; Jing, R. Personalized Point-of-Interest Recommendation Using Improved Graph Convolutional Network in Location-Based Social Network. Electronics 2023, 12, 3495. [Google Scholar] [CrossRef]
- Seo, Y.-D.; Cho, Y.-S. Point of Interest Recommendations Based on the Anchoring Effect in Location-Based Social Network Services. Expert Syst. Appl. 2021, 164, 114018. [Google Scholar] [CrossRef]
- Yang, H.; Yao, X.; Whalen, C.C.; Kiwanuka, N. Exploring Human Mobility: A Time-Informed Approach to Pattern Mining and Sequence Similarity. Int. J. Geogr. Inf. Sci. 2025, 39, 627–651. [Google Scholar] [CrossRef]
- Khan, N.U.; Wan, W.; Yu, S.; Muzahid, A.A.M.; Khan, S.; Hou, L. A Study of User Activity Patterns and the Effect of Venue Types on City Dynamics Using Location-Based Social Network Data. ISPRS Int. J. Geo-Inf. 2020, 9, 733. [Google Scholar] [CrossRef]
- Yan, H.; Yu, Y. Large-Scale Trajectory Prediction via Relationship-Aware Adaptive Hierarchical Graph Learning. CCF Trans. Pervasive Comput. Interact. 2023, 5, 351–366. [Google Scholar] [CrossRef]
- Yang, D.; Fankhauser, B.; Rosso, P.; Cudr’e-Mauroux, P. Location Prediction over Sparse User Mobility Traces Using RNNs: Flashback in Hidden States! In Proceedings of the Twenty-Ninth International Joint Conference on Artificial Intelligence Main track, Yokohama, Japan, 11–17 July 2020; pp. 2184–2190. [Google Scholar] [CrossRef]
- Khan, N.U.; Wan, W.; Riaz, R.; Jiang, S.; Wang, X. Prediction and Classification of User Activities Using Machine Learning Models from Location-Based Social Network Data. Appl. Sci. 2023, 13, 3517. [Google Scholar] [CrossRef]
- Xu, S.; Cao, J.; Legg, P.A.; Liu, B.; Li, S. Venue2Vec: An Efficient Embedding Model for Fine-Grained User Location Prediction in Geo-Social Networks. IEEE Syst. J. 2020, 14, 1740–1751. [Google Scholar] [CrossRef]
- Shao, J.; Wang, Y.; Gao, H.; Shen, H.; Li, Y.; Cheng, X. Locate who you are: Matching geo-location to text for user identity linkage. In Proceedings of the 30th ACM International Conference on Information & Knowledge Management, Virtual Event, 1–5 November 2021; pp. 3413–3417. [Google Scholar]
- Acharya, M.; Mohbey, K.K. Time-Aware Cross-Domain Point-of-Interest Recommendation in Social Networks. Eng. Appl. Artif. Intell. 2025, 139, 109630. [Google Scholar] [CrossRef]
- Mazumdar, P.; Patra, B.K.; Babu, K.S.; Lock, R. Hidden Location Prediction Using Check-in Patterns in Location-Based Social Networks. Knowl. Inf. Syst. 2018, 57, 571–601. [Google Scholar] [CrossRef]
- Cao, J.; Xu, S.; Zhu, X.; Lv, R.; Liu, B. Effective Fine-Grained Location Prediction Based on User Check-in Pattern in LBSNs. J. Netw. Comput. Appl. 2018, 108, 64–75. [Google Scholar] [CrossRef]
- Ghanaati, F.; Ekbatanifard, G.; Khoshhal, K. Using a Flexible Model to Compare the Efficacy of Geographical and Temporal Contextual Information of Location-Based Social Network Data for Location Prediction. ISPRS Int. J. Geo-Inf. 2023, 12, 137. [Google Scholar] [CrossRef]
- Kamal, R.; Hussein, W.; Ismail, R.M. A Novel Approach for Hiding Sensitive Association Rules Using DPQR Strategy in Recommendation Systems. Int. J. Intell. Comput. Inf. Sci. 2020, 20, 44–58. [Google Scholar] [CrossRef]
- Galal, M.; Rady, S.; Aref, M. Enhancing Machine Learning Engineering for Predicting Youth Loyalty in Digital Banking Using a Hybrid Meta-Learners. Int. J. Intell. Comput. Inf. Sci. 2024, 24, 28–40. [Google Scholar] [CrossRef]
- Zhang, S.; Menon, S.P. Challenges in KNN Classification. IEEE Trans. Knowl. Data Eng. 2021, 34, 4663–4675. [Google Scholar] [CrossRef]
- Forsquare Dataset. Available online: https://foursquare.com (accessed on 12 December 2024).
Disclaimer/Publisher’s Note: The statements, opinions and data contained in all publications are solely those of the individual author(s) and contributor(s) and not of MDPI and/or the editor(s). MDPI and/or the editor(s) disclaim responsibility for any injury to people or property resulting from any ideas, methods, instructions or products referred to in the content. |
© 2025 by the authors. Licensee MDPI, Basel, Switzerland. This article is an open access article distributed under the terms and conditions of the Creative Commons Attribution (CC BY) license (https://creativecommons.org/licenses/by/4.0/).