1. Introduction
In 2023, the UK reported a total of 5.6 million private sector businesses, marking a decrease of 7.1% compared to 2020. Small businesses, defined as those with 0–49 employees, constituted 99.2% of all businesses but contributed only 35.6% to the total turnover. Meanwhile, Small and Medium-sized Enterprises (SMEs), encompassing businesses with 0–250 employees, represented 99.9% of UK businesses and generated 52.5% of the total turnover. Notably, the number of non-employing businesses decreased by 10% between 2020 and 2023, while employing businesses saw a modest increase of 2.3%. At the start of 2024, the average turnover of all UK businesses rose by 6.9% compared to 2022, amounting to £806,381 [
1]. These data show the importance of SMEs for the UK economy and how powerful any steps taken to assist their rapid growth would be in boosting the economy of the country. Between 2020 and 2021, as a consequence of the COVID-19 pandemic and lockdown measures, the number of businesses in the UK decreased by 6.5%. SME numbers fell across all regions and countries in the UK—the greatest fall occurred in Northern Ireland, where businesses fell by 16.6%, followed by London by 8.0% and Scotland by 7.4% [
2]. Moreover, in emerging economies, SMEs are estimated to generate 60% of employment and 40% of Gross Domestic Product (GDP), while in the European Union the proportion of the workforce employed by SMEs is higher, 66% [
3].
SMEs and their investors are recognising the value data provide for their business [
4]. Contemporary companies worldwide [
5,
6,
7,
8] and typically in the UK seek data-driven innovations not only to modernise business operations and increase their competitiveness advantage, but also to carve out new markets, and meet varying government policies and numerous regulators, as well as make their businesses more sustainable [
9]. An IBM report cited in [
10] states that 2.5 quintillion bytes of data are generated every day. Remarkably, 90 percent of the world’s data has been created in just the past decade, making it the “new oil” of this digital era [
11]. Data are like crude oil, without analysis they are of little use to businesses if they do not know how to process or use them. Technologically efficient companies are among those that achieve high growth rates, according to research [
12,
13]. Data-drivenness is about building tools, abilities and more crucially a culture that acts on data. A leading factor that shapes this transformation is the data collected in databases and other repositories maintained by the business. Companies that see data as a strategic asset will thrive as data becomes a key part of their competitive advantages in the coming years. Obviously, not just any data will work; they have to be the right data (e.g., timely, accurate, clean, unbiased and most importantly trustworthy). Good data have the power to transform businesses with the actionable insights required to become more productive. Evidently, there can be subtle hidden biases in the data that can sway drawing the right conclusions. However, cleaning and managing data can be tough, time-consuming and expensive operations.
Data scientists use data analysis techniques to develop new business models that are used to deliver, create and capture value for business growth, success and profitability. Their skills are now essential to industry transformation. The analytic value chain in a data-driven organisation stimulates deeper analysis. Decision makers usually incorporate these into their decision-making processes so they can influence the direction taken by the company, and therefore add value and impact. This process transforms data into knowledge and value, which creates new income streams. Yet, despite the benefits and opportunities digital technologies bring, and despite the significant uptake in recent years, many SMEs are still lagging in the adoption of digital technology and, for smaller SMEs with 10–49 employees, the digital adoption gap has widened significantly compared to larger firms [
14]. For example, SMEs in the UK are adopting big data analytics at a rate of less than 1% [
15,
16]. However, recently businesses in the UK are becoming more aware of the value of data-driven decision making and data analytics is increasing in popularity, according to recent reports. The data science industry is also poised to expand over the next few years.
This paper aims to explore trends and challenges towards effective data-driven decision making for UK businesses, how SMEs pivot their business models around data to handle data-driven products, and how this contributes to their innovation and performance. We present an analysis of the challenges and opportunities of digitalisation, and adoption of data science and artificial intelligence (AI) within the UK SME business sector. Our analysis of 85 UK SMEs is based on case studies of SMEs located primarily in England’s West Midlands who are supported in the areas of data management, machine learning, data analytics and other related digital technologies under a 3-year long European Regional Development Fund (ERDF) project named Big Data Corridor (BDC). Our study also briefly examines how small businesses can take advantage of data-driven innovation and decision making, while highlighting challenging areas where support for digital technology adoption is most needed.
The multi-perspective analysis and case studies in this paper inform the SME business industry as well as business innovation and growth bodies about potential challenges and key opportunities in AI usage. In addition, the analysis encourages small businesses to derive meaningful insights from closed (private business) and open (publicly available) data by taking advantage of emerging data science and AI techniques and technologies. The research also highlights areas where future support and funding are most needed to enable SMEs to embark on the digital revolution and AI adoption thereby contributing to the growth and development of this key sector in the UK.
This study focuses on the lessons learnt from the analysis of business data and the adoption of data-driven solutions by SMEs. The specific contribution of this paper is to find answers to the following research questions:
How can data science and AI adoption benefit Small and Medium-sized Enterprises (SMEs) in terms of business productivity, economic growth, innovation and job creation?
What are the challenges faced by SMEs in integrating data science decisions into their operations, considering limited resources and restricted access to financing?
What are the potential benefits of data analytics and digital transformation for SMEs, including marketing optimisation, demand forecasting, and customer retention and acquisition?
How can SMEs in the UK take advantage of data-driven innovation and decision making, and what areas require the most support for digital technology adoption?
The rest of the paper is organised as follows.
Section 2 and
Section 3 present related works and the research methodology used in order. In
Section 4, we analyse SMEs’ data, digital technology trends, faced challenges, and the key lessons learned while supporting and collaborating with businesses.
Section 5 covers two case studies on SMEs that embarked on digitisation and data science adoption. We provide a summary and conclusion in
Section 6.
2. Related Works
Data analytics and digital transformation offer businesses new opportunities, such as marketing optimisation, the forecasting of demand for their products and services, and staying one step ahead in retaining and acquiring customers. In a related study, Bhardwaj [
17] provides a comprehensive review of 42 peer-reviewed studies from 2010 to 2021 on data analytics in SMEs. The review identifies four main themes: enabling factors, restraining factors, investing SMEs and performance indicators. It highlights the significant role of data analytics in enhancing SME competitiveness and identifies barriers such as poor IT infrastructure and lack of analytics knowledge. The paper emphasises the need for more research on underexplored themes and suggests future research directions to bridge existing gaps. This work consolidates current knowledge and guides future studies to improve the strategic use of data analytics in SMEs. Also, a survey of 500 UK companies found a positive correlation between the use of data and business performance and productivity: top data-using companies are 13% more productive than those in the lowest quartile [
18]. Many government institutions, including the EU, recognise the importance of empowering SMEs to benefit from the digital revolution and generate measurable economic benefits. This is evident from the proportion of EU funding allocated to data-related projects, big data and data science [
19]. To increase the number of highly skilled workers in AI and data science, the UK government, the Office for Students, universities and industry partners have established a fund of up to £24 million [
20].
In another related work, Schönberger [
21] examines the adoption of artificial intelligence (AI) by Small and Medium-sized Enterprises (SMEs), highlighting key applications, benefits and challenges. The study employs a quantitative research approach through an online survey distributed among German SMEs, focusing on AI tools like virtual assistants, recommendation systems and machine learning. The findings reveal that these technologies enhance efficiency, productivity and decision making, but also present challenges such as privacy concerns and the need for specialised skills. Despite limited resources hindering AI adoption, the study underscores the potential of AI to transform business processes in SMEs and serves as a basis for future research and practical guidance for SMEs considering AI implementation. Furthermore, Griesch, Rittelmeyer and Sandkuhl explore AI-as-a-Service (AIaaS), which leverages AI and cloud computing to provide accessible AI solutions for Small and Medium-sized Enterprises (SMEs) [
22]. The paper addresses the research gap concerning the differences between AIaaS and on-premise AI implementations. It includes a literature review to identify factors affecting AI adoption and a detailed case study comparing AIaaS with on-premise AI in a real-world SME context. The study also employs a morphological box to systematically compare these approaches, highlighting AIaaS’s potential to overcome SMEs’ technical and resource limitations while detailing its practical applications and limitations.
Our paper sheds light on the research questions set out in
Section 1 by analysing data from 85 SMEs in the West Midlands region, focusing on their digitisation trends, challenges faced and lessons learned from adopting data-driven solutions. The two case studies presented in the paper (
Section 5) will serve as examples to demonstrate the potential benefits and challenges of implementing digitisation and AI in SMEs. By addressing these research questions, this paper seeks to contribute valuable insights to the SME business industry and encourage the growth and development of this sector in the United Kingdom through the effective use of data and emerging trends in machine learning and analytics.
4. Analysis of SMEs’ Digitisation Trends, Challenges and Learned Lessons
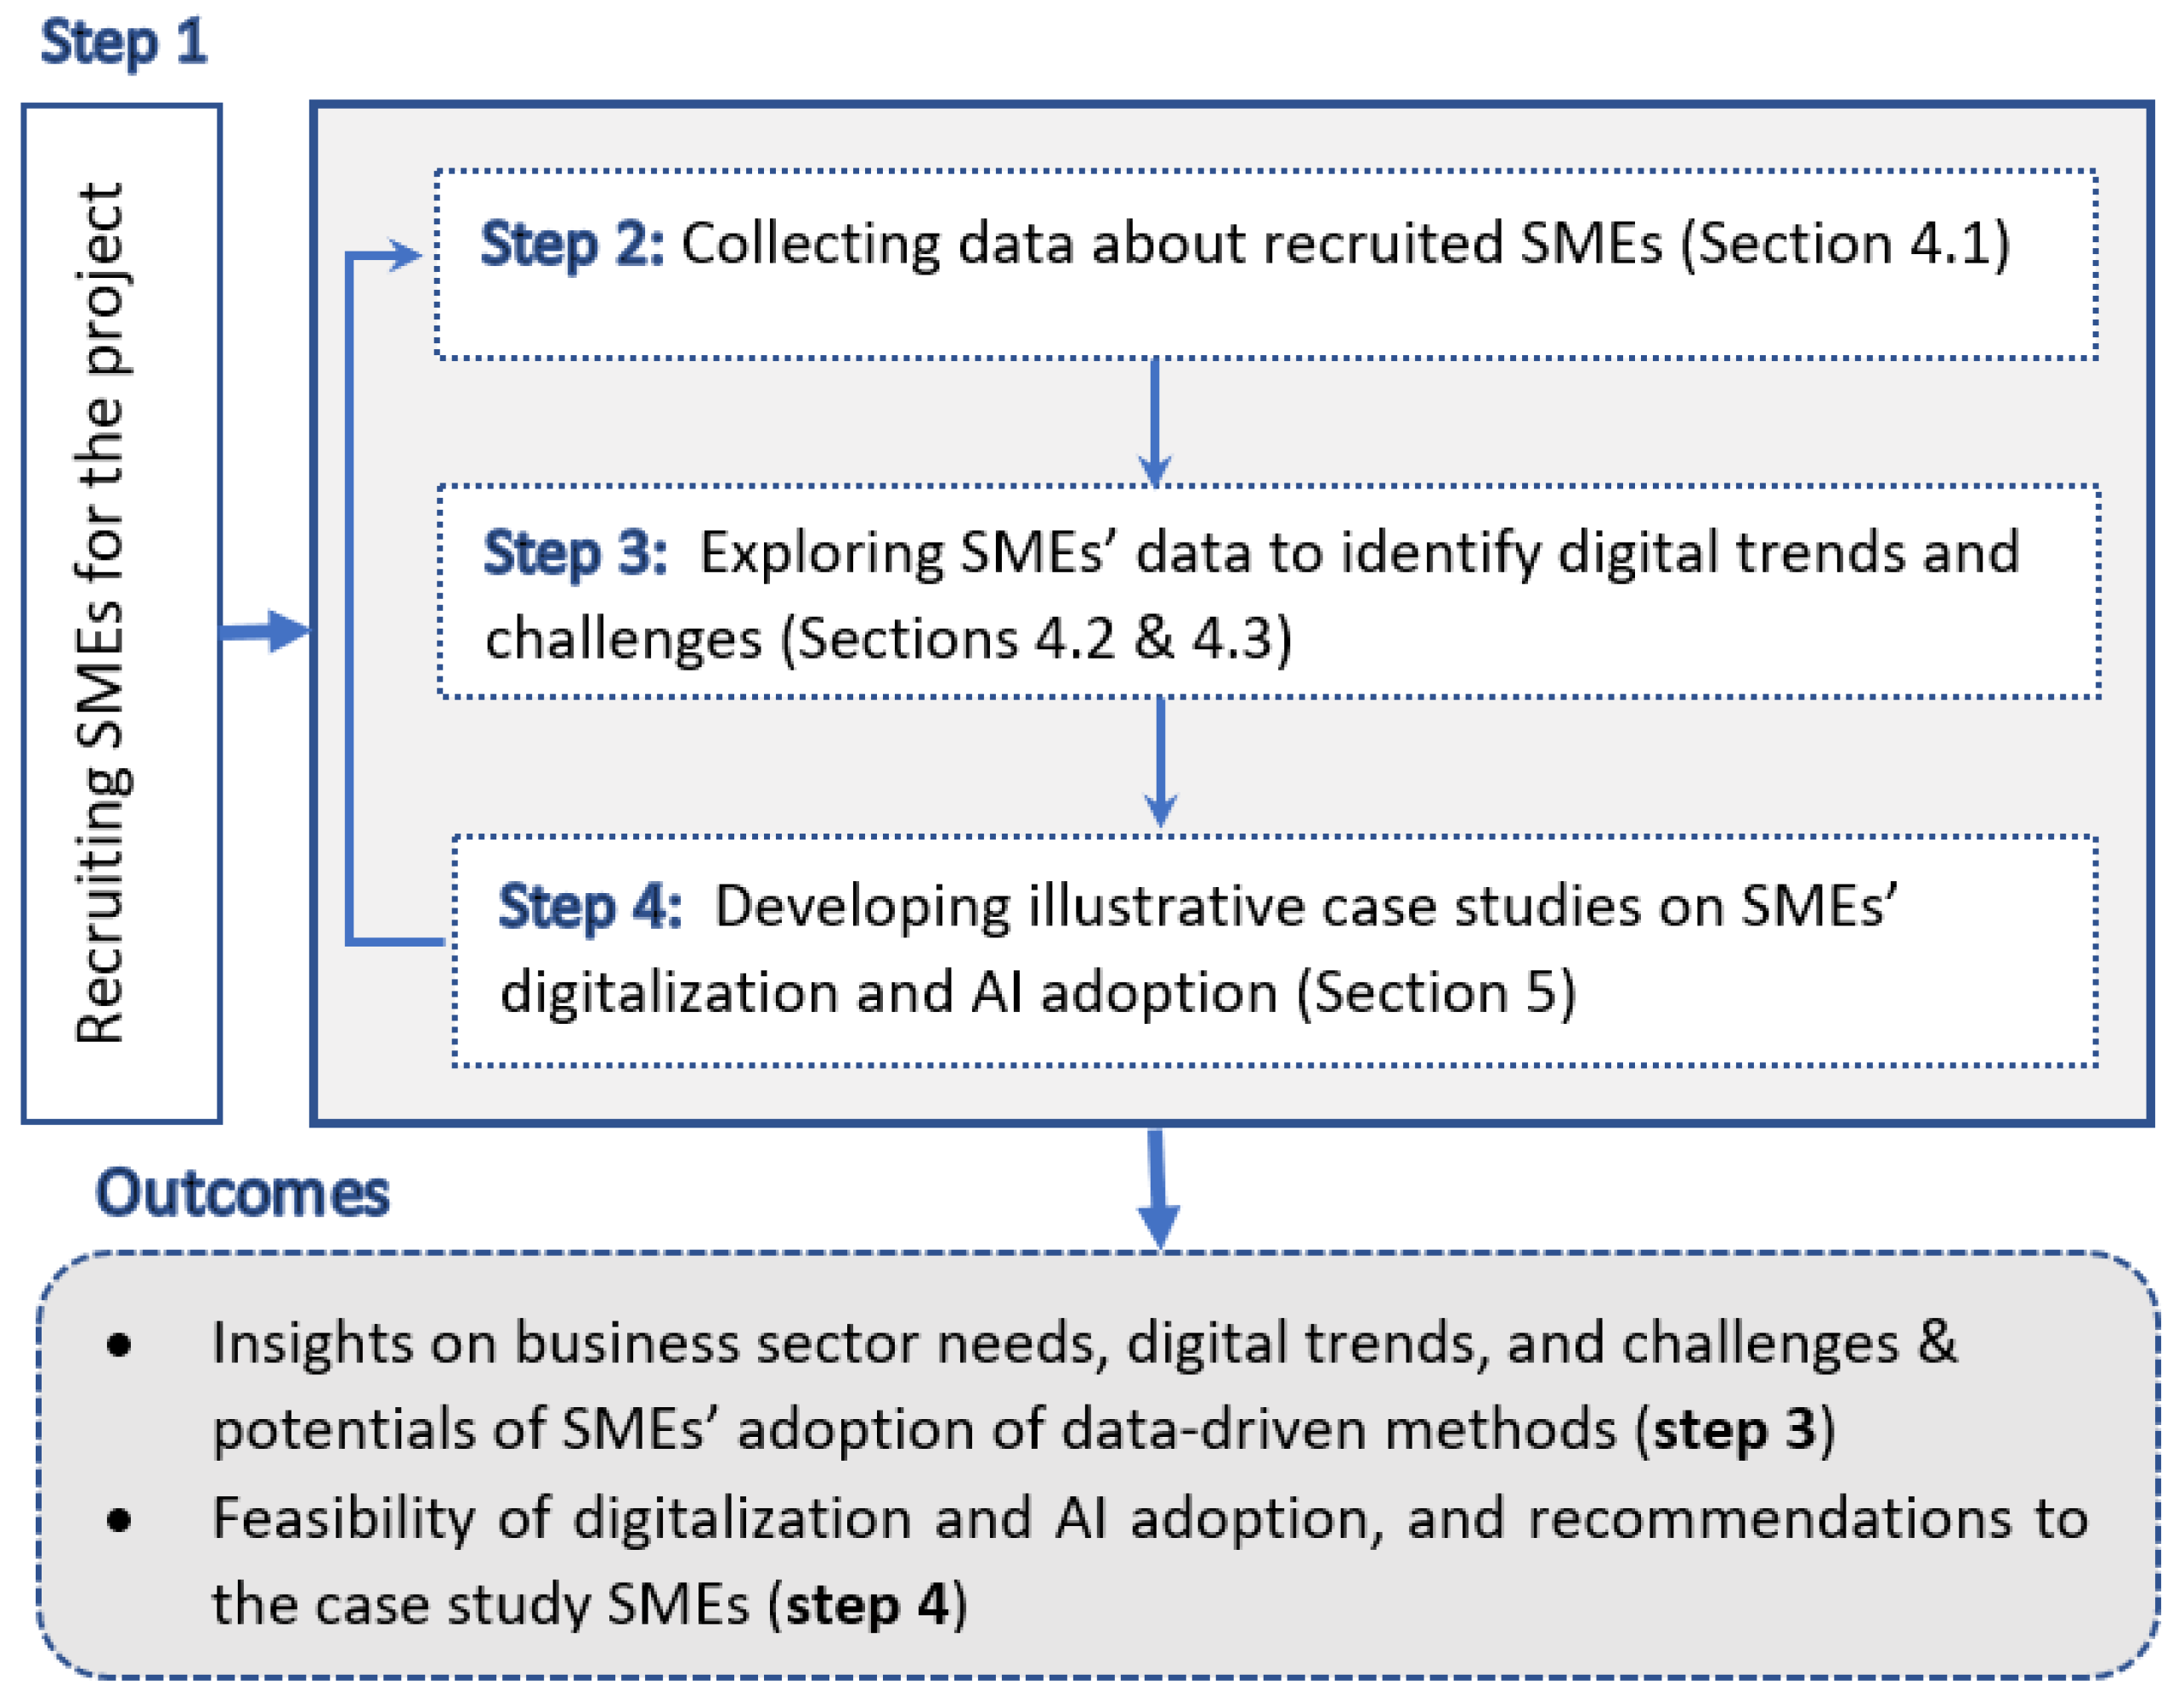
4.1. Data Collection
Eighty-five SMEs received support during the period from June 2017 to August 2019 from two academic partners of the BDC project and are used as the basis for our analysis and discussions.
Figure 2 depicts the BDC project support life cycle for SMEs including SME engagement, checking SME eligibility and commencement of support which could lead to the introduction of new products or services. Once recruited, SMEs’ data are primarily collected via designed project forms and structured meetings with them. These SMEs were mostly based in the West Midlands region of the UK and more precisely in the Greater Birmingham and Solihull Local Enterprise Partnership (GBSLEP) area, which was the focus of the BDC project. Due to non-disclosure agreements and the need to preserve business confidentiality, we do not detail individual SMEs’ support or provide any associated private data except in the two case studies that were used as examples with the permission of these businesses, which are also anonymised.
4.2. SMEs’ Digitisation Trends from Different Perspectives
The sample SMEs had a minimum of one (the owner) and a maximum of 146 employees. The minimum turnover of the SMEs was £10,000 and the maximum reported turnover was £10 million. Companies were categorised based on their activities into 20 different sectors.
Table 1 shows the top 10 business sectors based on the count of SMEs, together with ranges for the number of employees and turnover for the SMEs of each sector.
The top 10 business sectors presented in
Table 1 together account for 78.9% of the total SMEs from the sample. Notably, most of the SMEs were from the Information and Communications Technology sector with 16 businesses representing 18.8% of the total companies involved in the project. Other sectors represented with a higher number of SMEs include Education and Training (10 SMEs and 11.8% of total), Consultancy (10 SMEs and 11.8% of total), Marketing and Public Relations (7 SMEs and 8.2% of total) and Human Health and Social Work activities with 6 SMEs and 7.1% of total. These numbers suggest that companies in the technology and services sectors rely more on data-driven solutions to support their business when compared to companies in other sectors.
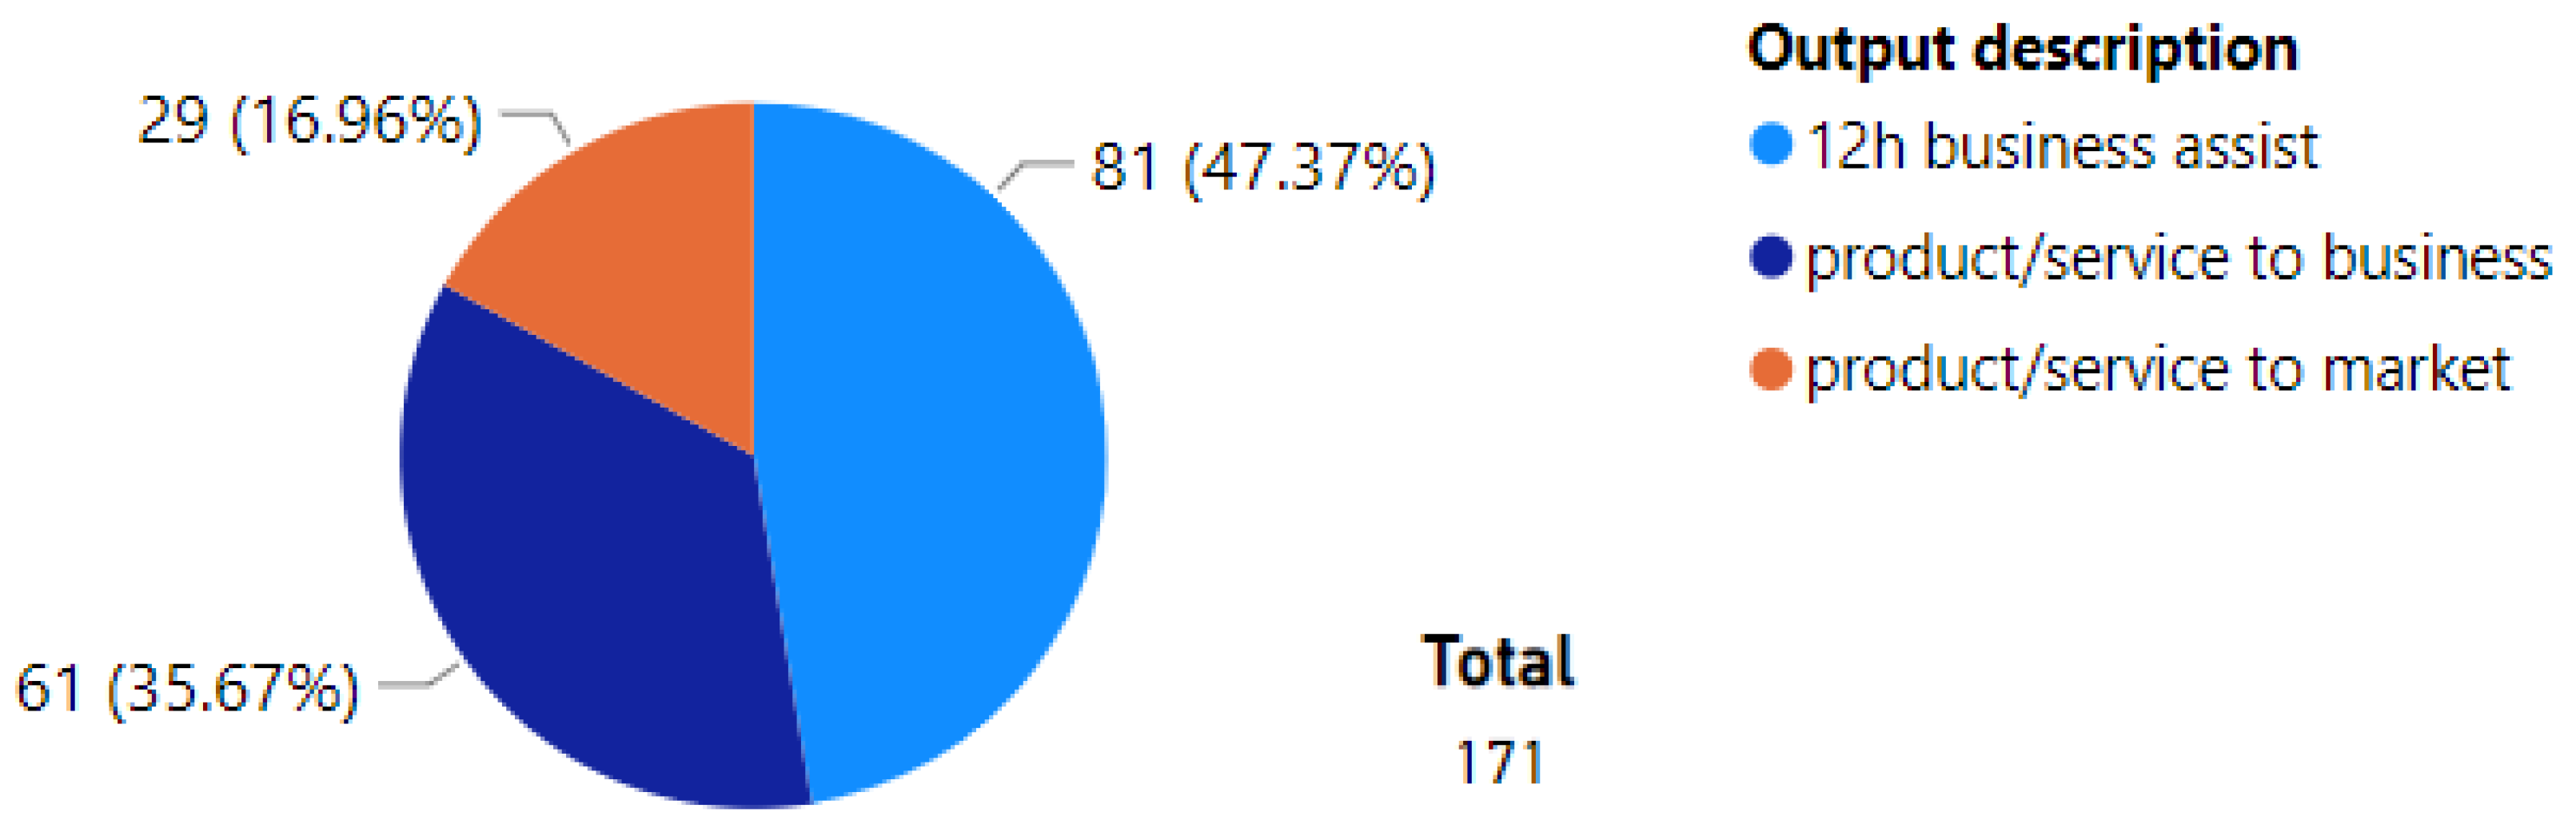
The SMEs included in this analysis completed at least one of the following types of business support (outputs) provided by the BDC project:
Twelve hours of business assist and training;
Support to introduce a new product/service to the business;
Support to introduce a new product/service to the market.
In
Figure 3, the count and proportion of project outputs by type are shown.
The total number of outputs was 171, which is higher than the total number of SMEs involved, indicating that some companies received multiple types of business support. The most common type of output was the 12-h business assist, with 81 assists in total. This type of support benefited the majority of companies (81 out of 85 or 95%), and included seminars, workshops and quick assistance for non-complex data-related business problems.
Among the remaining outputs that required longer-term collaboration, 61 SMEs introduced a new product or service internally, while 29 SMEs introduced a new product or service to the market. These results indicate that companies primarily sought data-related support to upgrade their internal services, gain insights from their data and improve decision-making processes. It is worth mentioning that some outputs not introduced to the market were either Proof of Concept (PoC) solutions or components of larger projects intended for future market release.
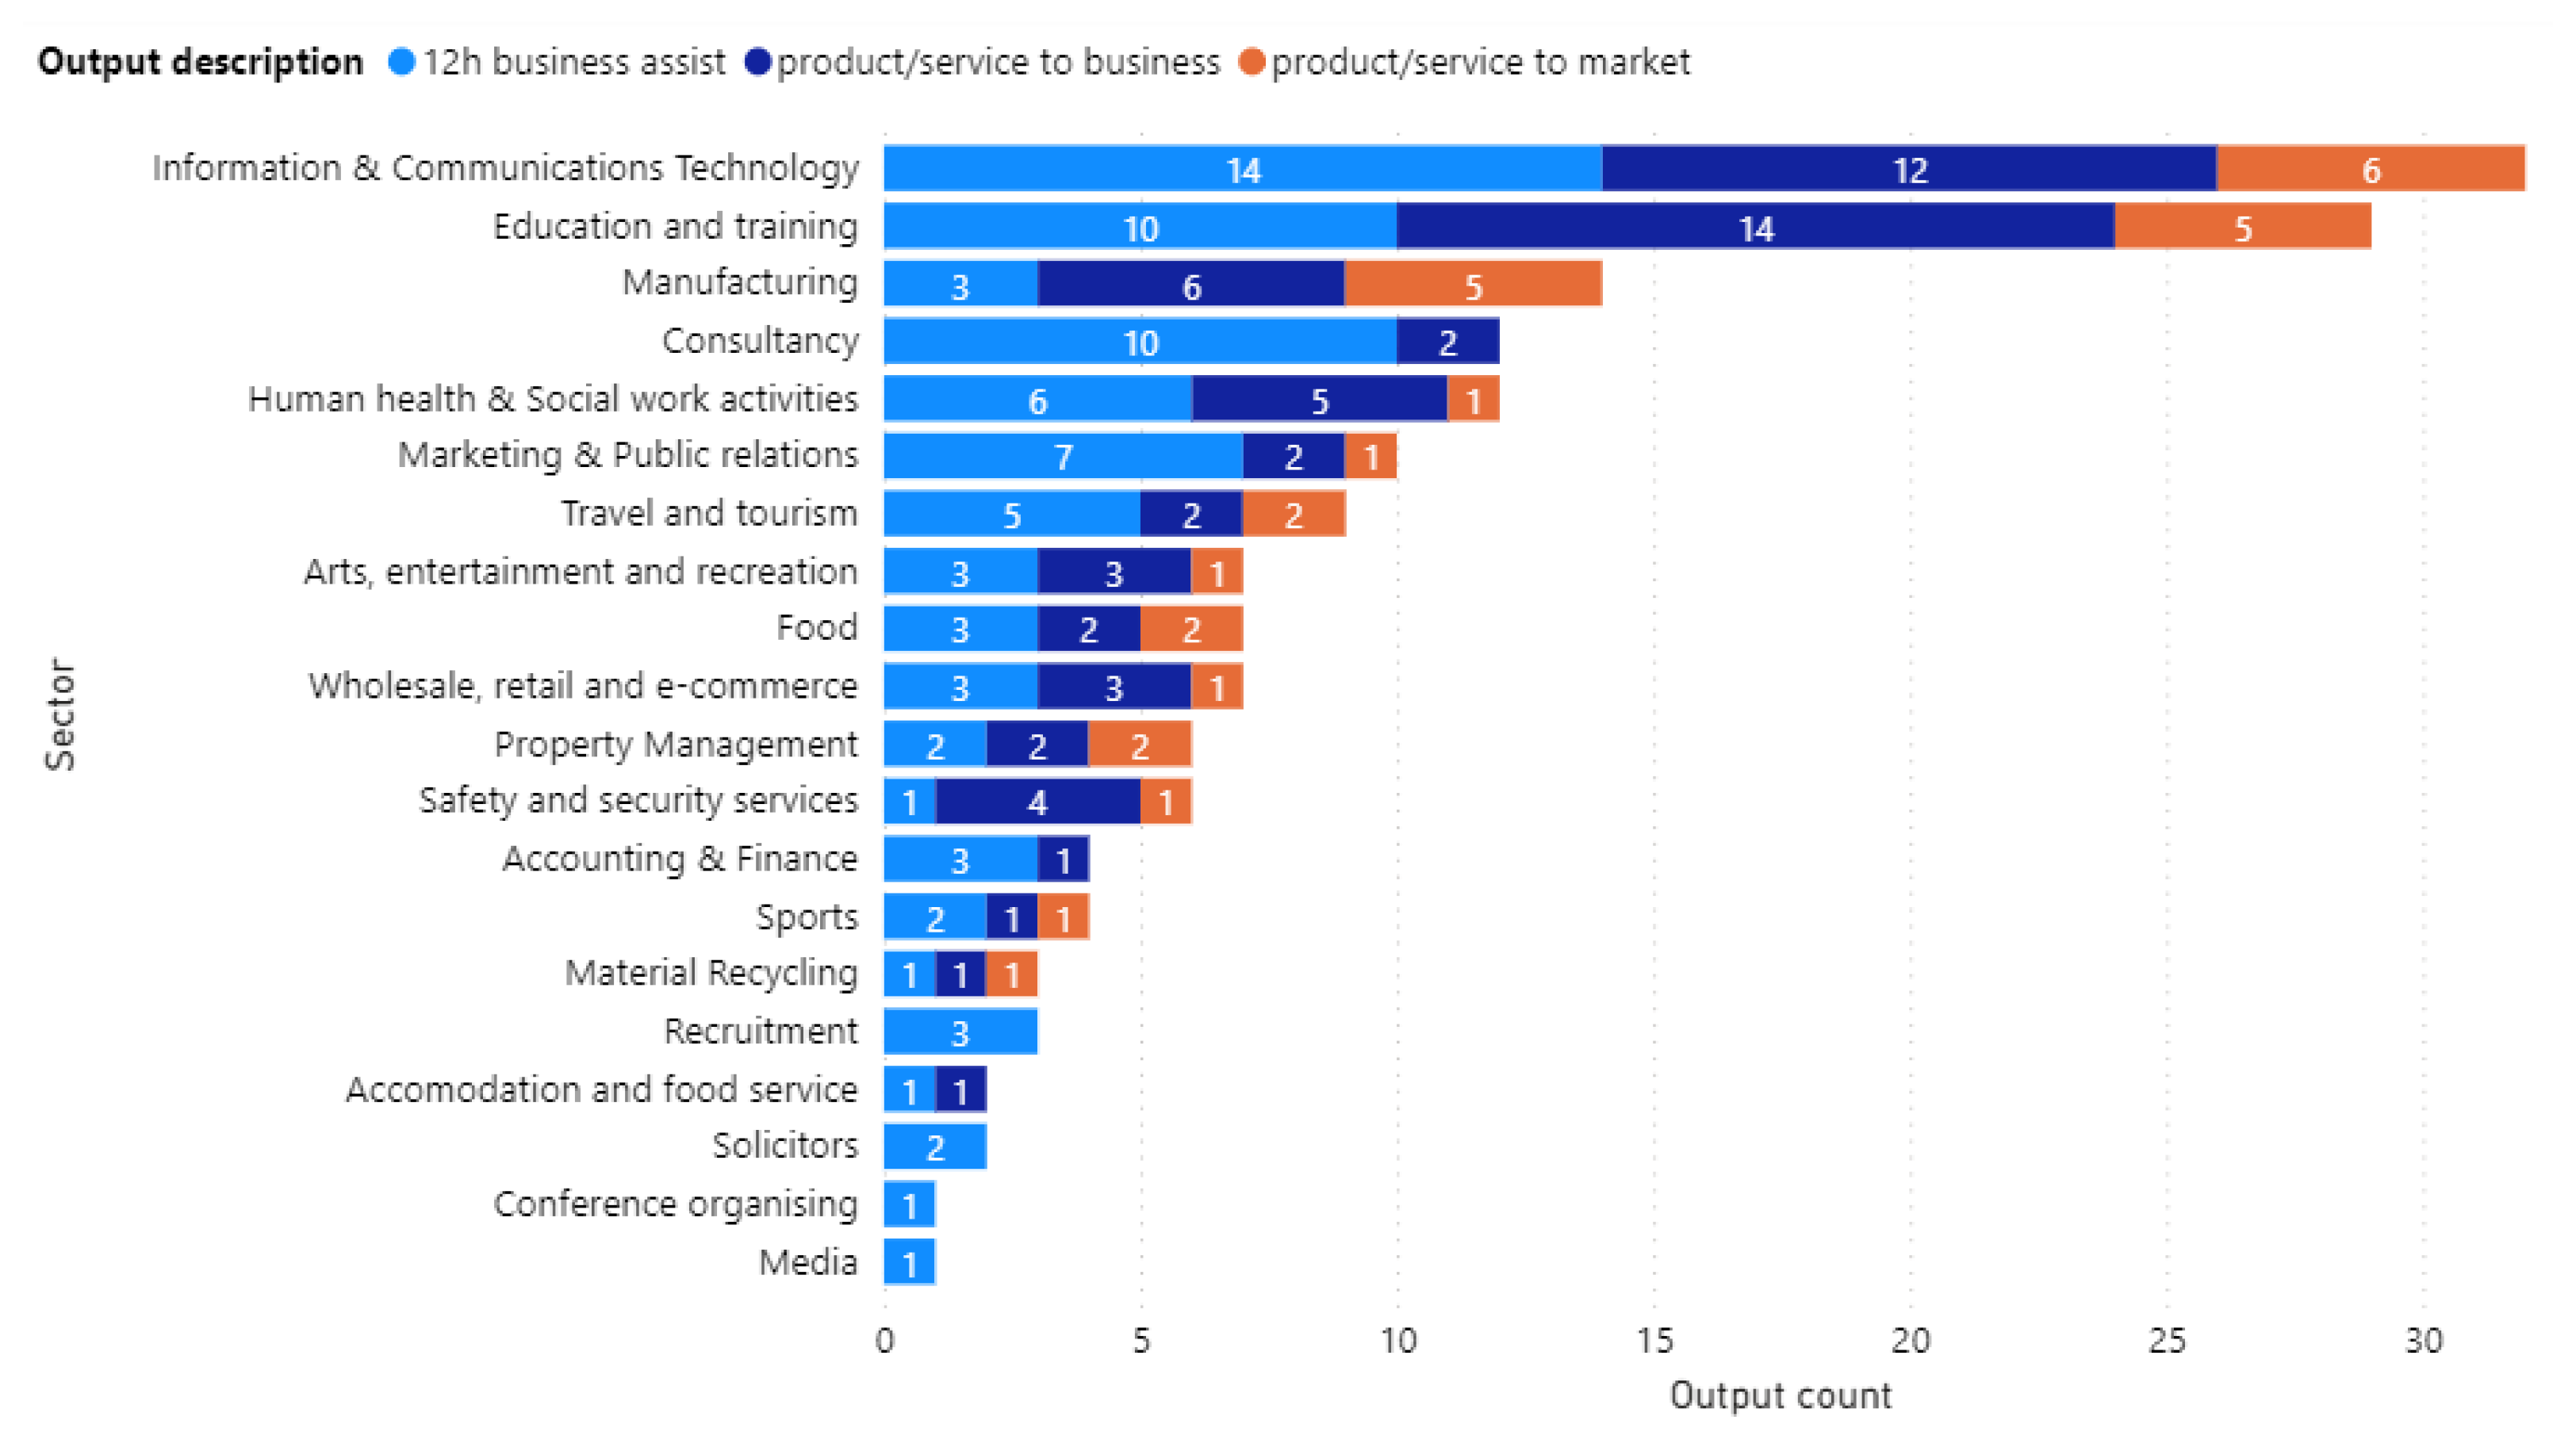
Figure 4 presents counts of support type by business sector.
Apparently, the sectors with the most sought technical support were Information and Communication Technology (32 outputs) and Education and Training (29 outputs). However, considering the count of SMEs from each sector, the Education and Training sector had almost three assistances per SME (29 outputs for 10 SMEs) while Information and Communication Technology had two per SME (32 outputs for 16 SMEs). In this category, the Manufacturing sector comes first with 14 outputs for four SMEs (3.5 outputs per SME). The sector that received most of the 12-hour support was Information and Communication Technology with 14 outputs followed by the Education and Training and Consultancy sectors with 10 outputs each. The Information and Communication Technology sector also received most of the product/service to market support with 6 outputs, and the Education and Training sector received most of the product/service to business support with 14 outputs.
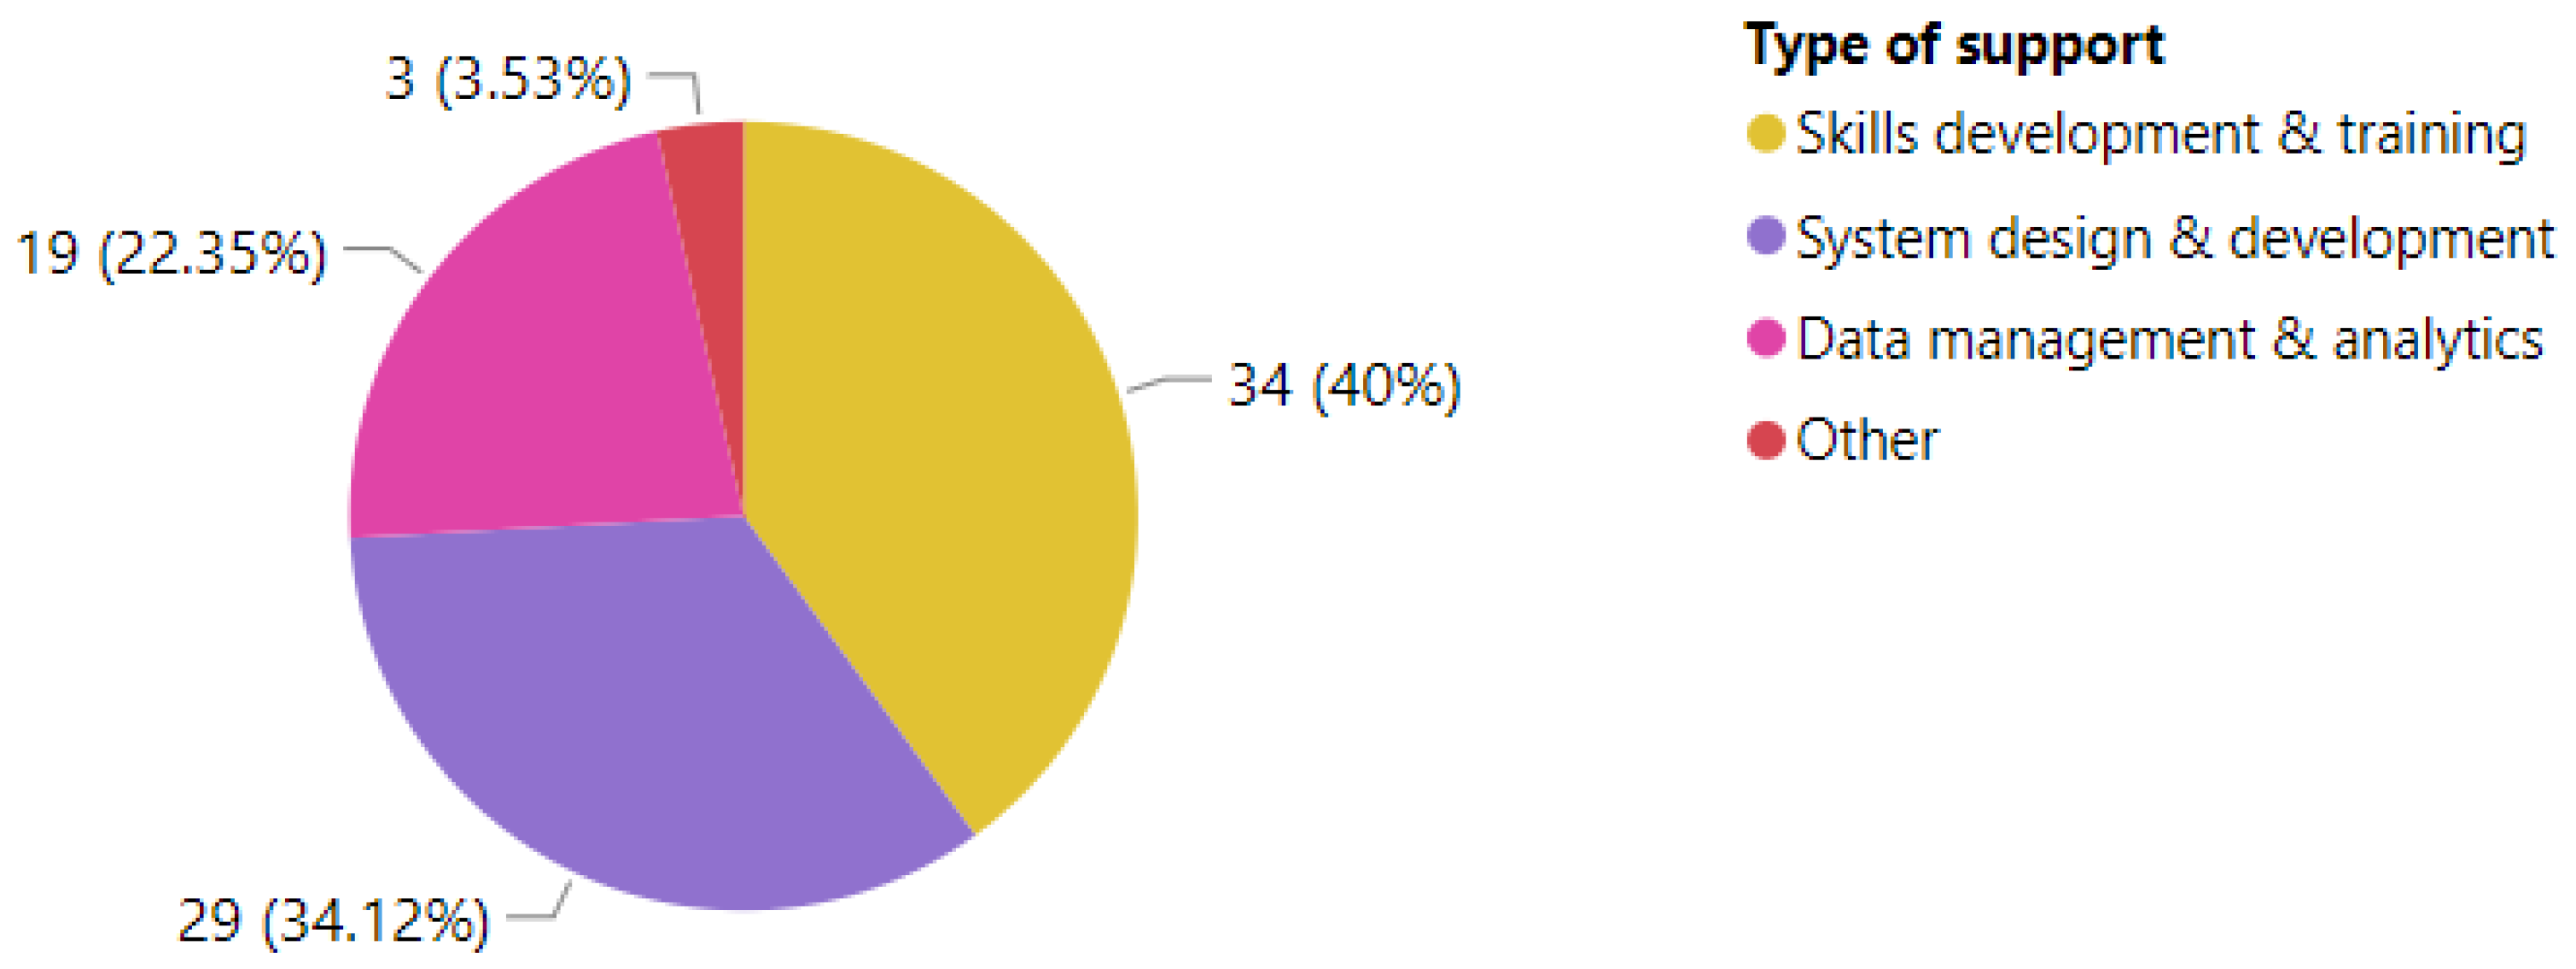
For the purpose of this analysis, we further introduced four categories of digital support based on the requirements of the support provided to businesses from the project’s academic partners:
Skills development and training: Companies attended training seminars and workshops focused on data collection, transformation and storage as well as seminars about data analysis, visualisation and using data science and machine learning to get better insight and make data-driven decisions.
Data management and analytics: Supported SMEs to collect and store data more efficiently, in order to make them accessible for analysis and visualisation and allow for better business insight extraction.
System design and development: Supported SMEs to design and develop end-to-end business solutions either to improve their products and services or to enhance internal business decision making and planning.
Other: This refers to a small number of SMEs provided with support that does not directly fall under one of the above three categories, such as recycling, fire and safety, etc.
As illustrated in
Figure 5, 34 companies (40%) required support related to skills development and training, 29 (34.1%) for system design and development, and 19 (22.3%) for data management and analytics. Across all different types of support, the main data science and analytics aspects in which the companies required assistance can be summarised as follows:
Acquiring data (open or proprietary) from external web resources such as APIs, websites or web repositories, and transforming, filtering or combining these data to extract business insight.
Creating advanced visualisations including interactive dashboards and performing descriptive analytics to gain insight and improve products/services or marketing practices.
Collecting, storing and analysing data originating from sensors including IoT.
Using machine learning (ML) to improve their products/services with data-driven processes or to provide recommendations for their customers.
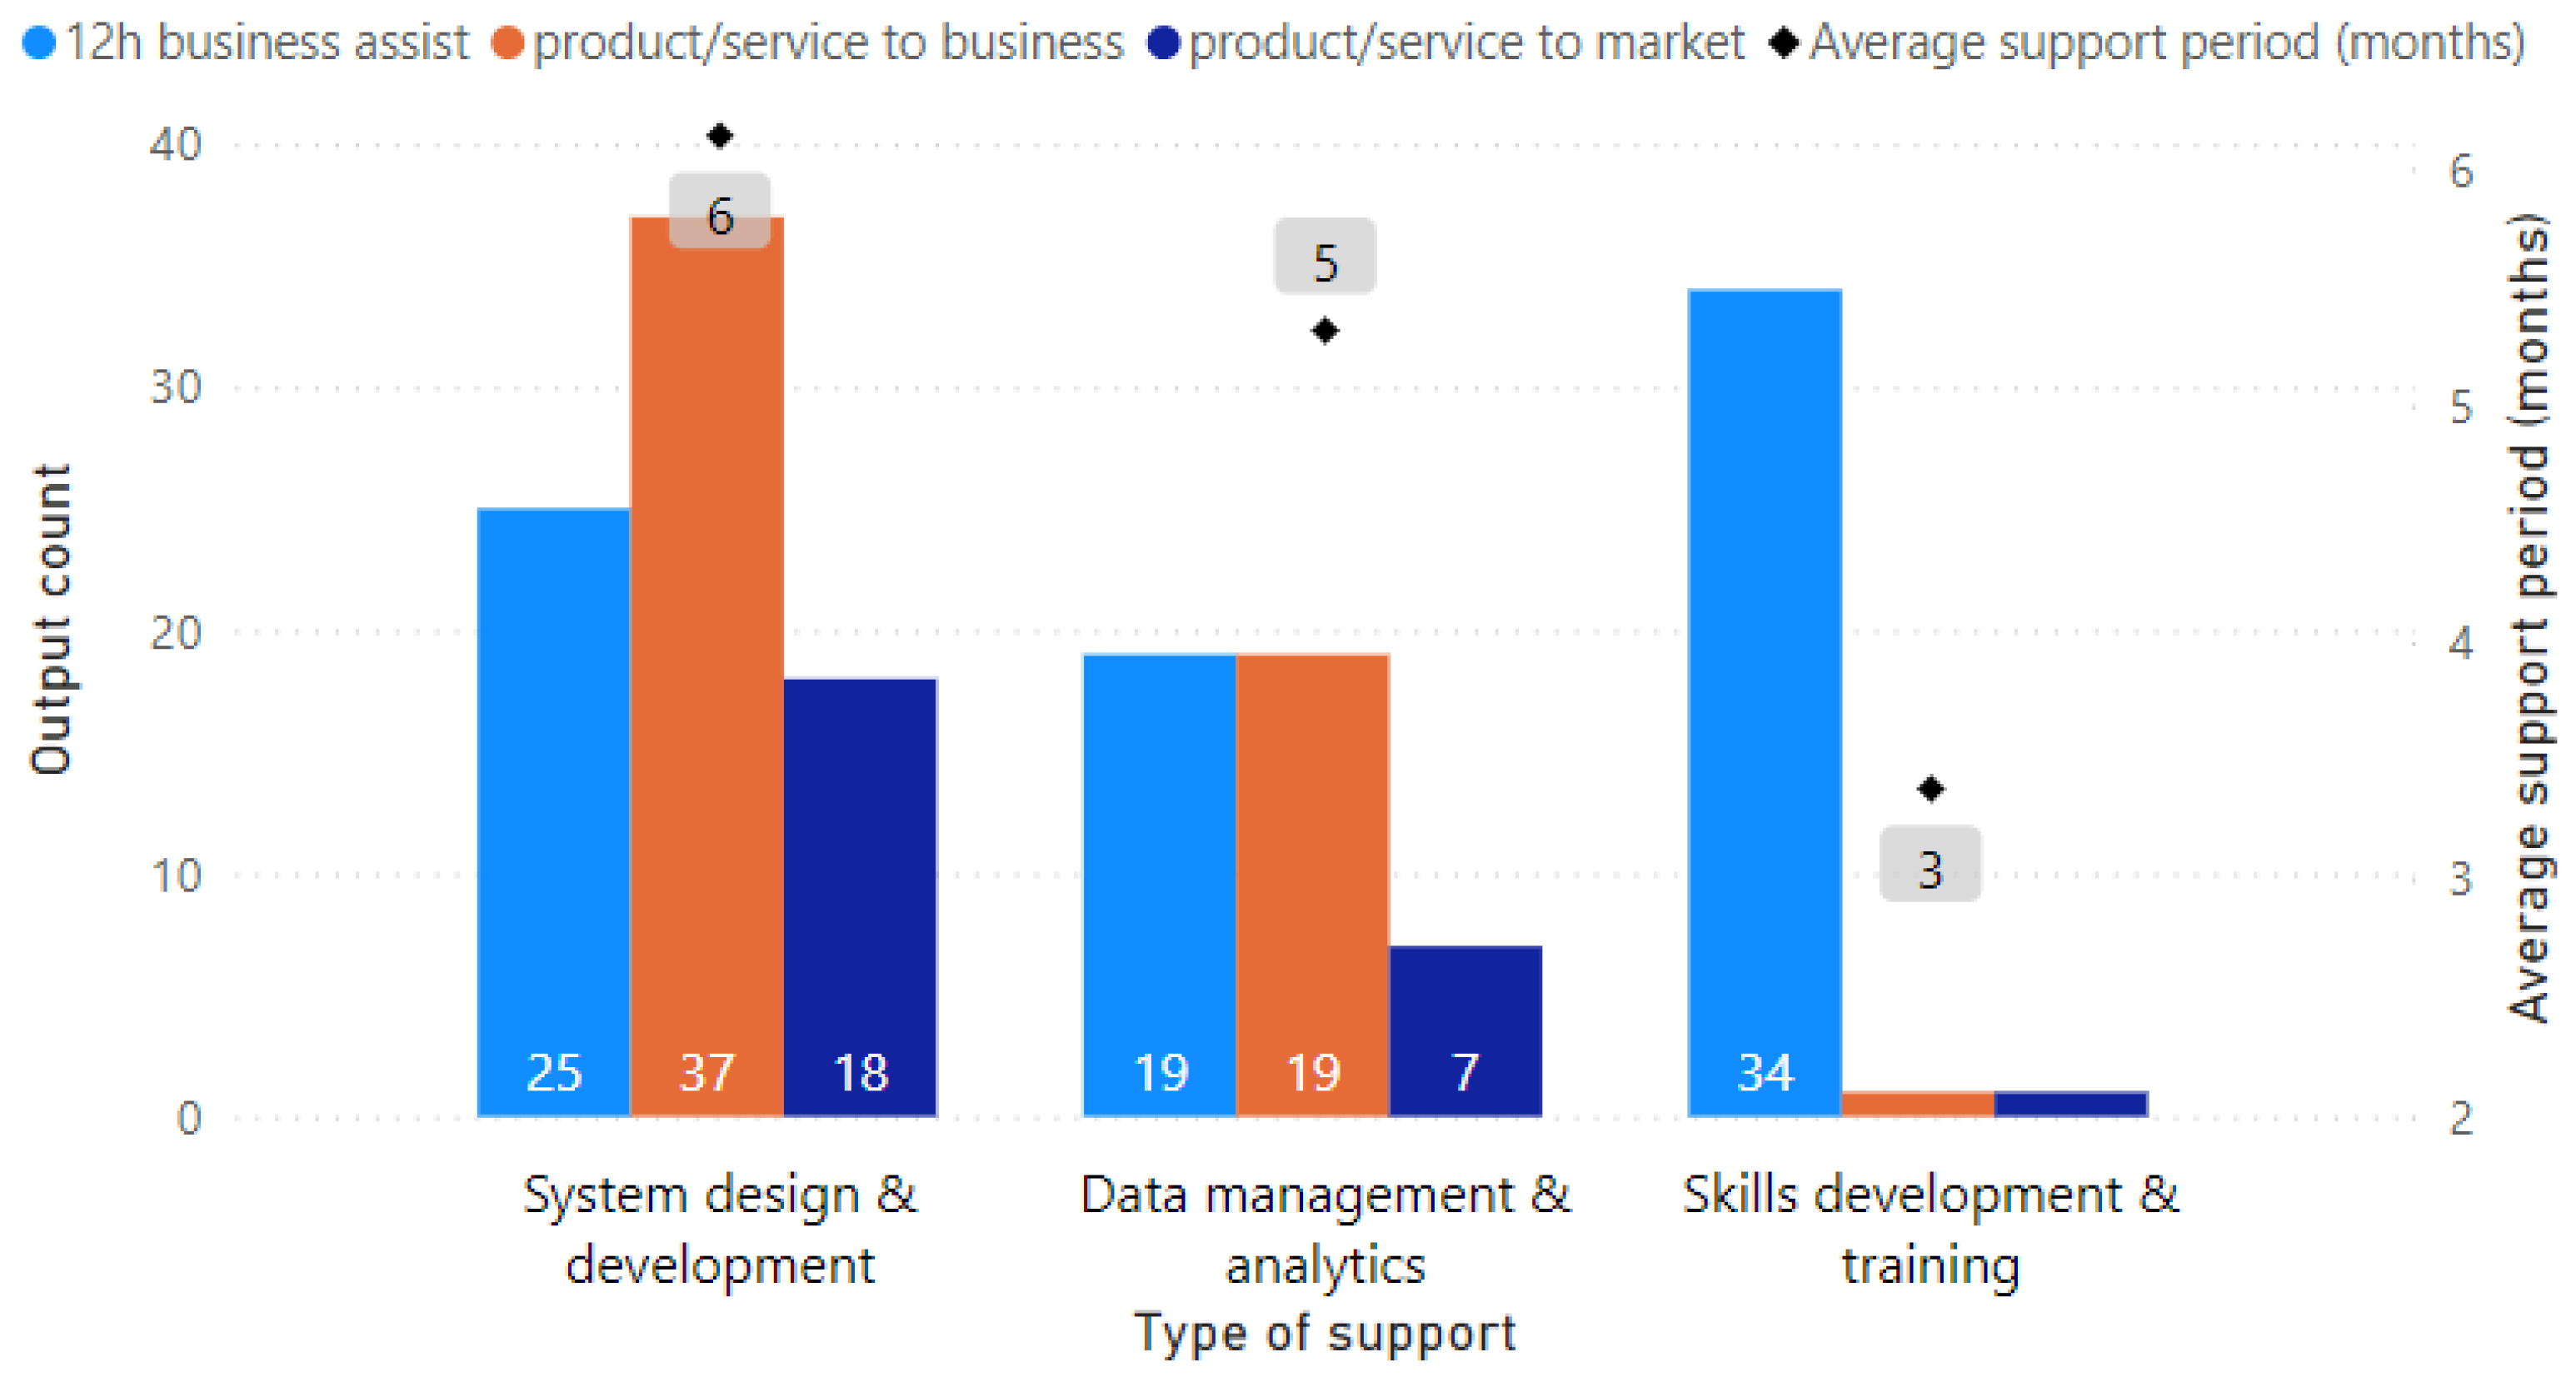
Figure 6 presents the number of outputs per type of support. It is evident that the project produced a higher number of outputs for system design and development and data management and analytics support when compared to skills development and training, especially for interventions that assisted companies to introduce new products and services internally or to the market.
The duration of support received by SMEs ranged from 1 to 16 months and the average support period was slightly below 5 months (4.75) per SME. As evident in
Figure 6, companies that received support to design and develop data-related solutions or to improve their data management and analytics processes required longer support periods on average (5–6 months) when compared to companies that received support for skills development and training (average support period of 3 months). In
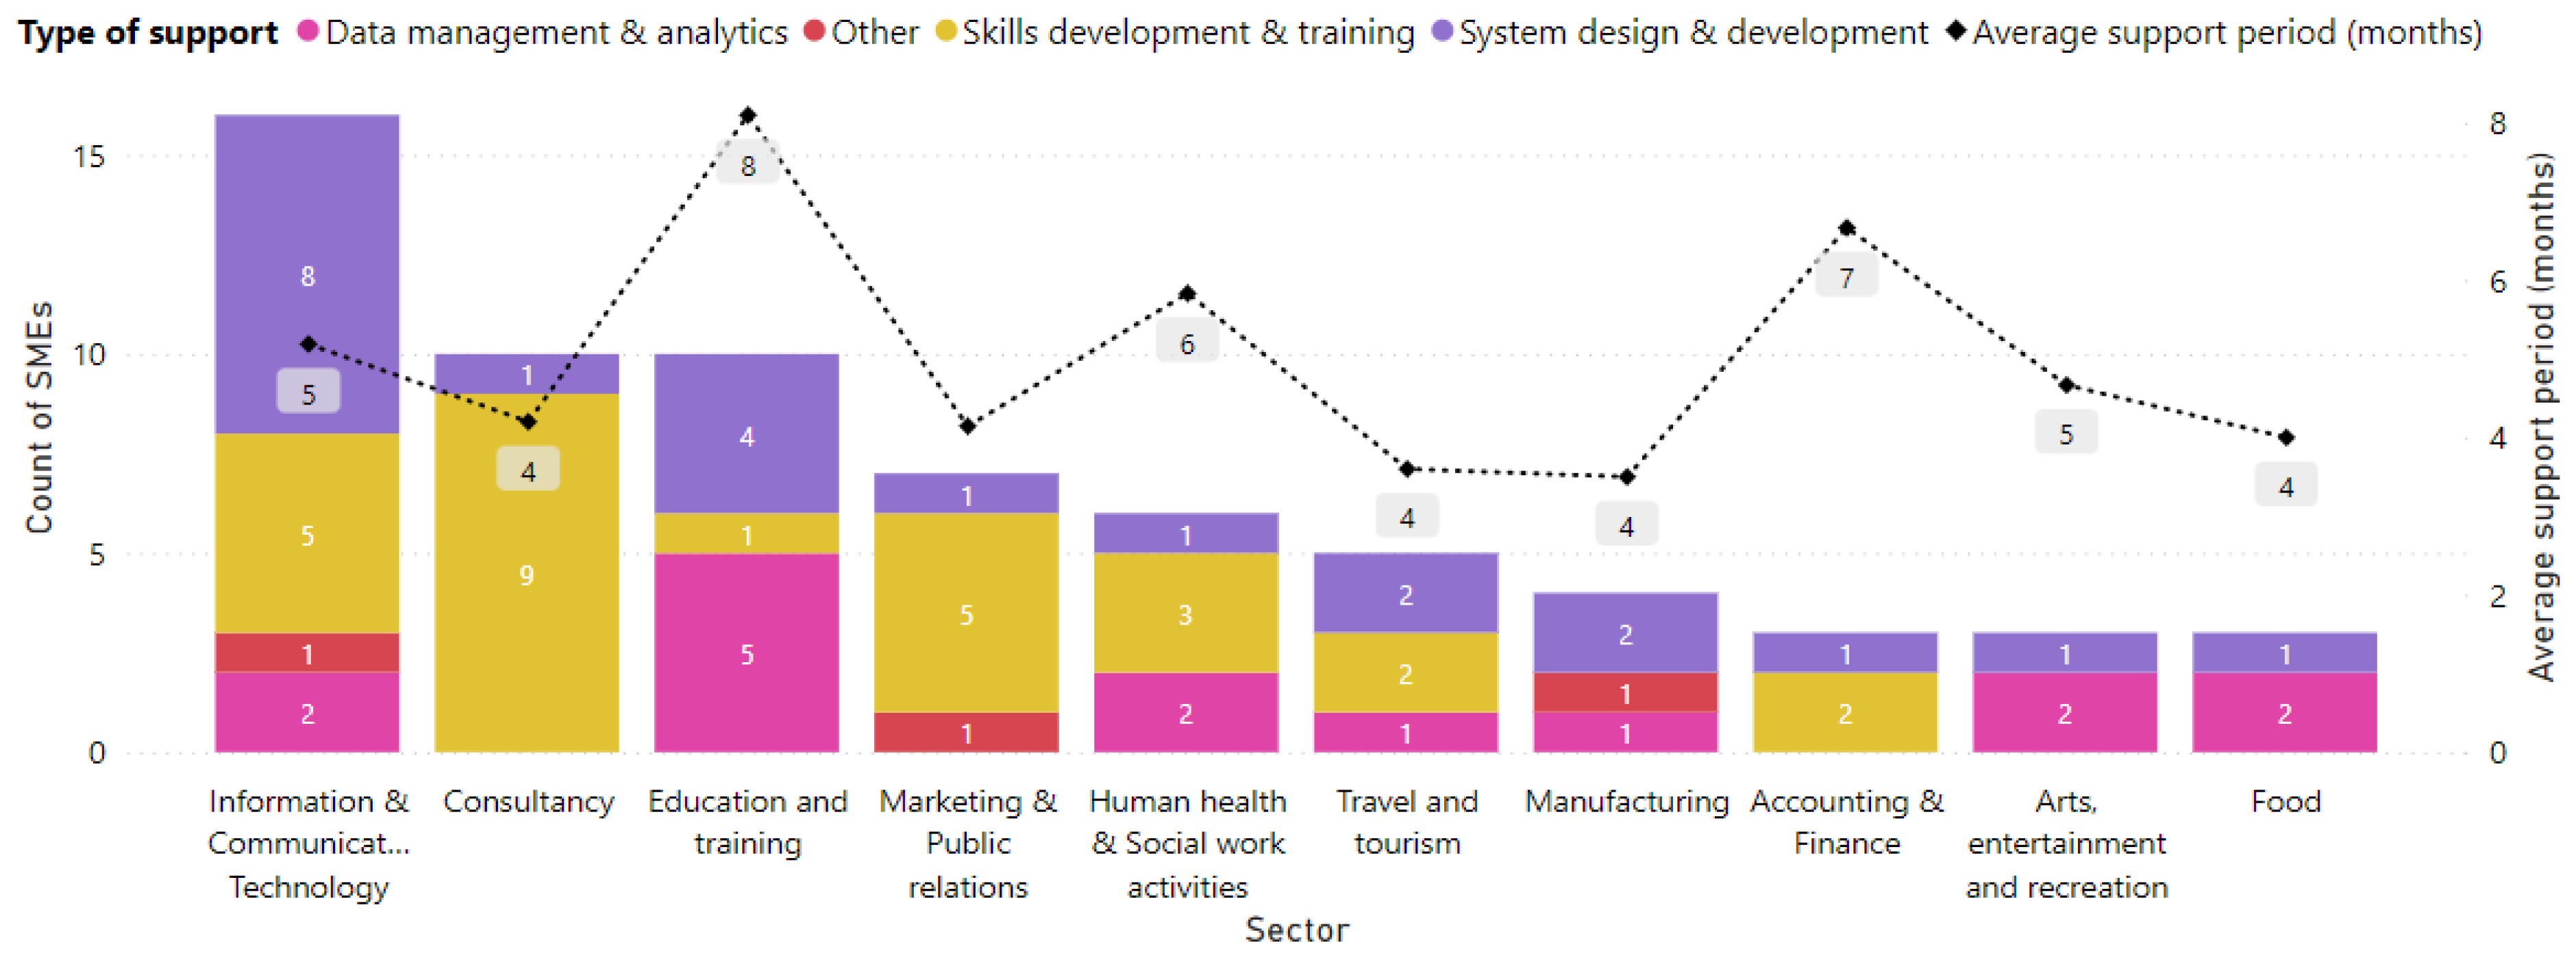
Figure 7, we show the top 10 business sectors supported and the average support period received by SMEs from each sector. SMEs in the Education and Training sector had the highest average support period (8 months), followed by Accounting and Finance (7 months) and Human Health and Social Work Activities (6 months). In general, it was observed that longer support periods were required for sophisticated projects, either because these projects demanded expert knowledge, or due to lower levels of data science and technical skills within the companies.
Another important observation derived from
Figure 7 is that system design and development support was requested by companies across all sectors. This highlights the high demand for data-driven solutions and services in the market which corroborates with the main aim of the study, to encourage digital transformation and use of data in SMEs to achieve growth.
4.3. Challenges and Learned Lessons
The digital transformation of SMEs and their adoption of data science techniques require organisational changes, investment and resources before businesses can reap any resulting profits and benefits. However, we have observed during this study that the majority of micro and small enterprises are hesitant to invest in new digital tools and methods if they cannot anticipate quick positive results and revenues. From our analysis, we have empirically recognised four main areas (without excluding other potential ones) in which SMEs effectively utilise data-driven strategies and techniques to enhance their business operations.
First, improving digital marketing proved to be a common data-driven use case among small businesses. Specifically, a large number of the study’s SMEs managed to derive immense marketing insights from analysis performed on their own data or relevant open data, e.g., identifying lead customers, gaining a better understanding of customer purchasing patterns, etc.
Second, the use of social media (SM) platforms for digital marketing was found popular among our case study SMEs. This is driven by the valuable data generated because of customers communicating with SMEs via their dedicated channels on these platforms. The SM analytics was used by some enterprises to study their marketing performance on various platforms (e.g., Instagram, Facebook, LinkedIn and Twitter) about customer purchase and service use intents. This leads SMEs to retain the highest revenue-generating platforms and unsubscribe from underperforming ones, eventually reducing costs. The same analytics was also used to identify working marketing strategies based on specifically studied Key Performance Indicators (KPIs), e.g., views, likes, reach, impressions, etc.
Table 1 and
Figure 7 show that Marketing and Public Relations represent the top support-seeking business sectors according to our study. Linked to this, a study on the adoption of social media and SMEs’ performance found that around 70% of SMEs use social media for marketing [
23].
Third, a good number of the SMEs supported under BDC used data-driven methods to identify potential new markets by performing cross-analysis of their customer data and various relevant open datasets, e.g., government open datasets, such as census, demographics and geospatial data. Such customer analytics enabled SMEs to locate new markets with a high demand for their services and products, thus allowing them to expand their market presence.
Eventually, performing exploratory analysis on historical data with the objective of creating predictive models was another common application observed among the case study SMEs. Going to the predictive stage of the analytics ladder enables many small and medium-sized businesses to make use of cutting edge ML and AI technologies. The selected two case studies presented in
Section 5 represent good examples for this type of application. They include an SME transforming from manual to digital business operations and another adopting machine learning for parameter optimisation in additive manufacturing.
Linked with the above, the research and consultancy work with SMEs under this project has also produced other lessons. In particular, we underline a number of factors found to be the leading barriers preventing most SMEs from embracing new and emerging data-driven technologies and AI.
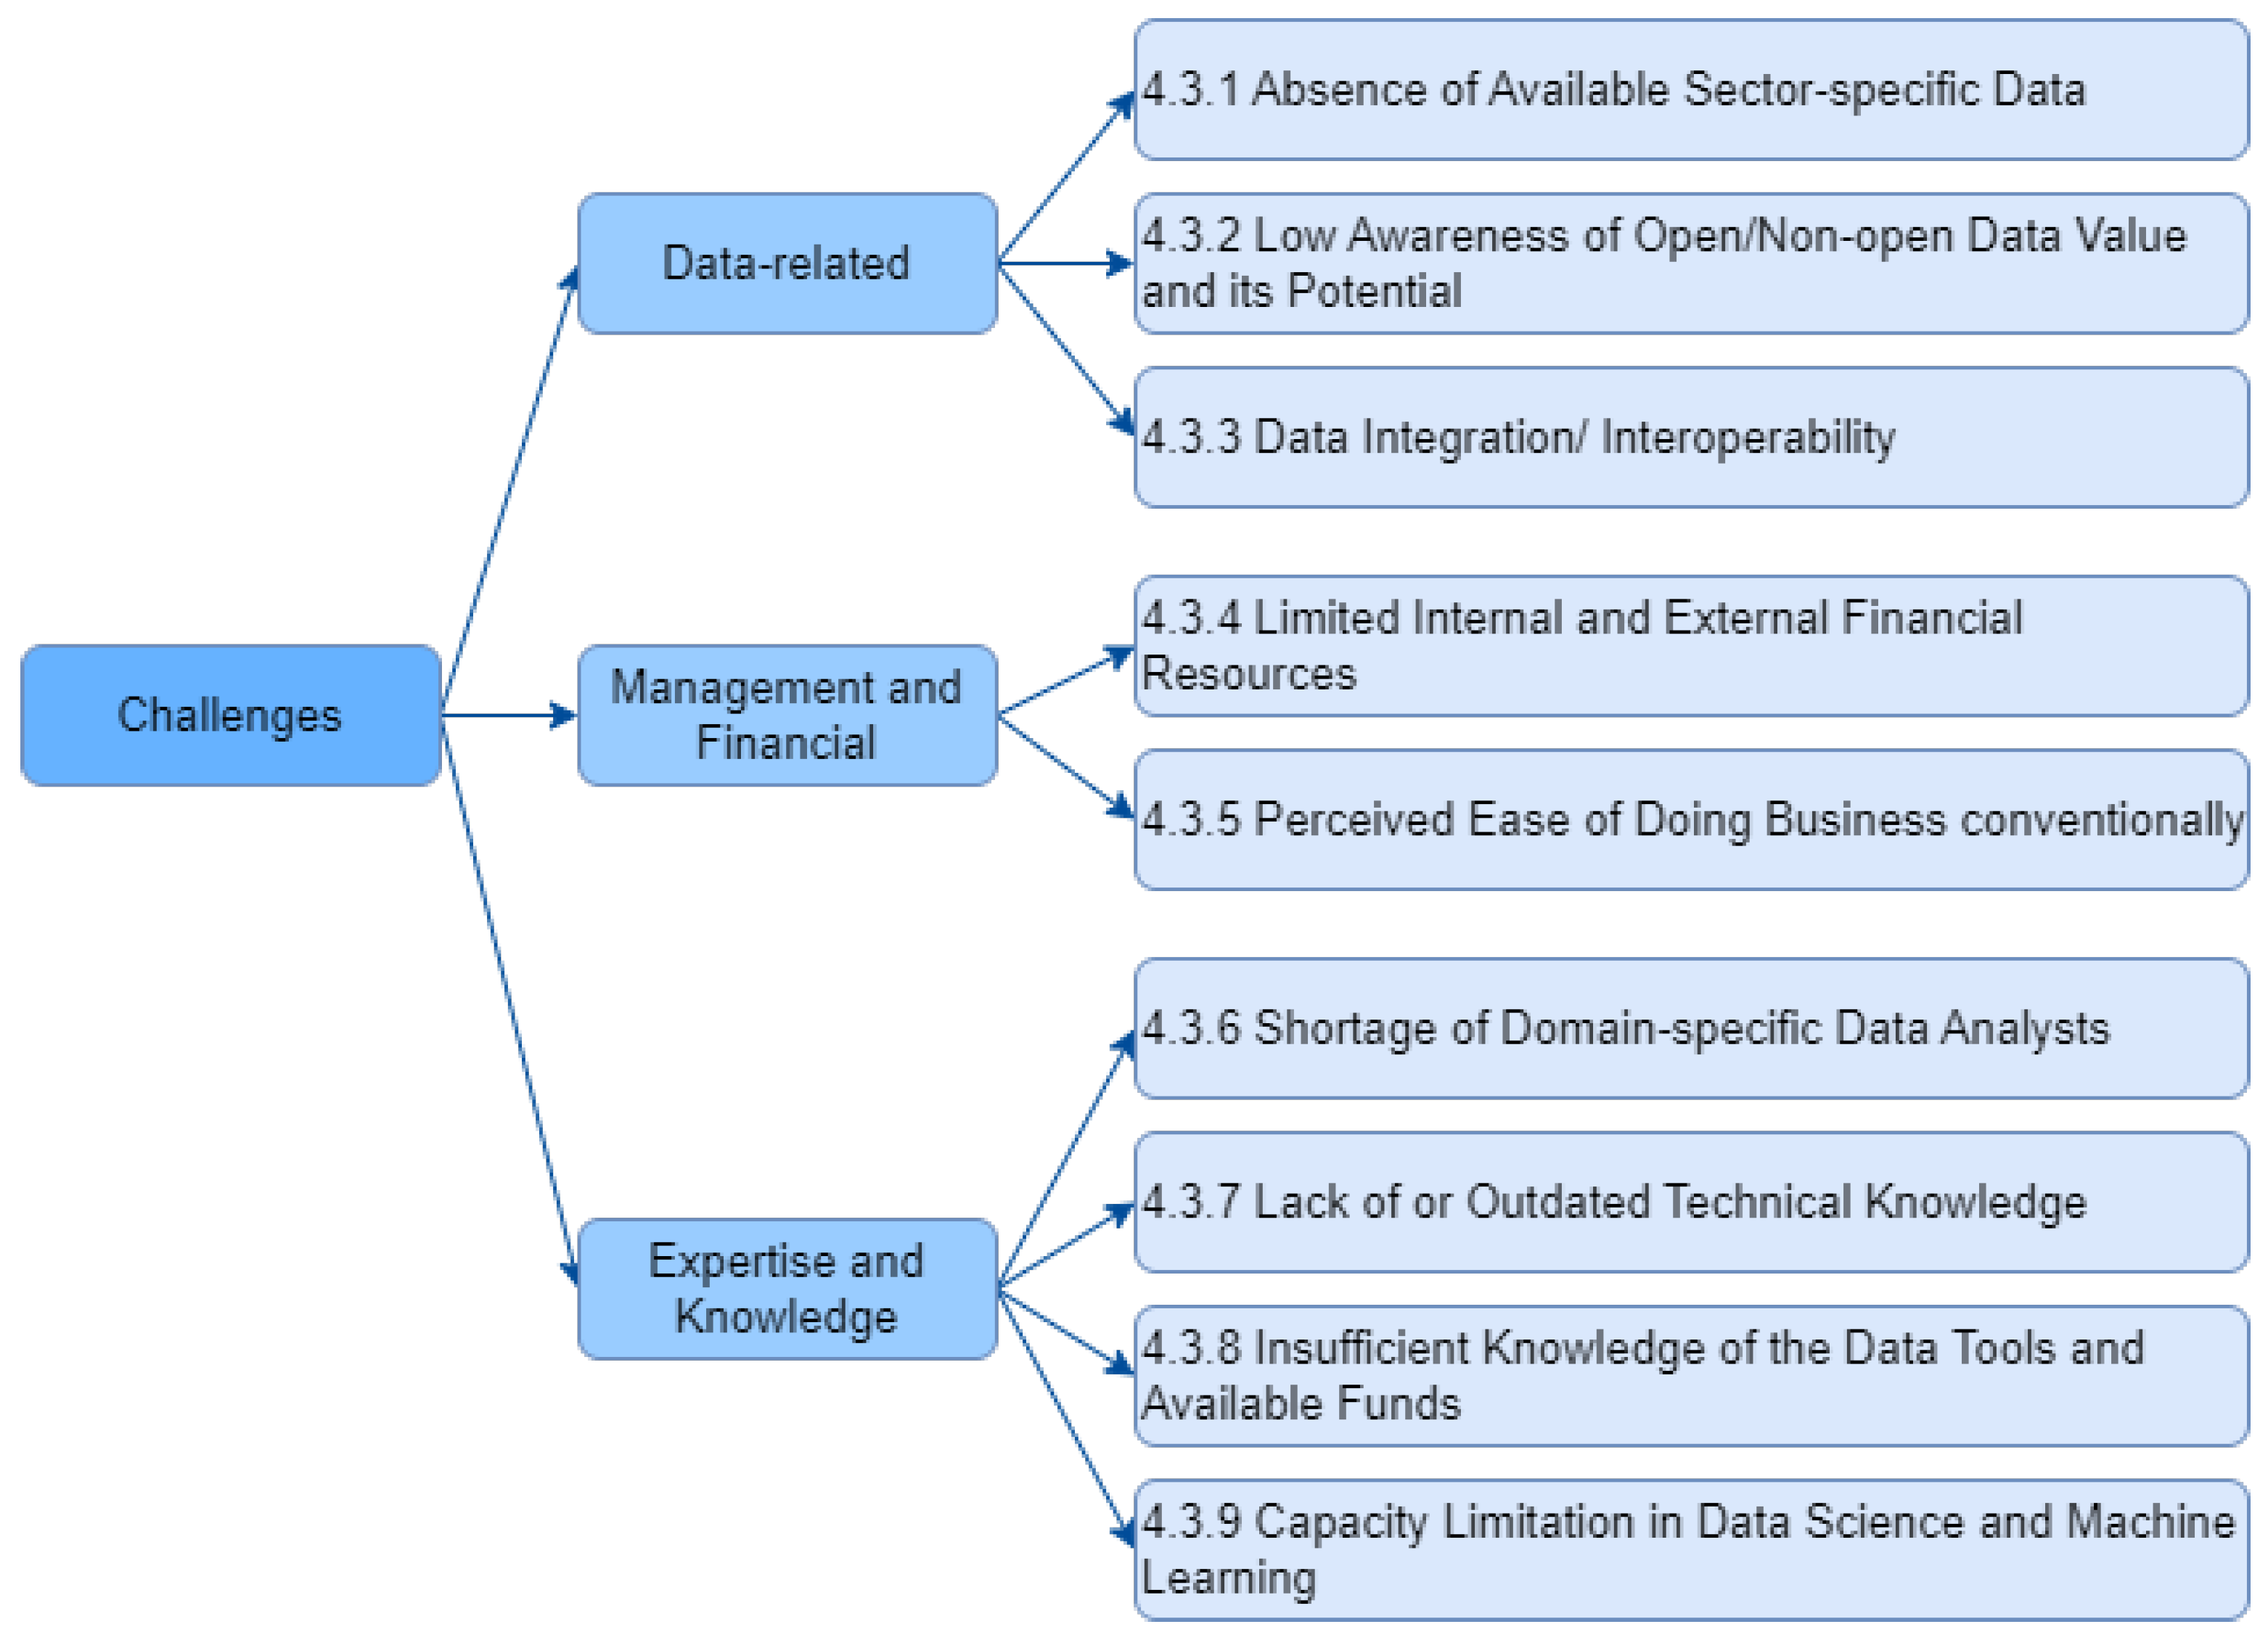
Figure 8 summarises the primary challenges facing SMEs to successfully adopt digitisation and data-driven approaches as identified in this study. The challenges are roughly classified into three broad categories: data-related, management and financial, in addition to expertise and knowledge.
4.3.1. Absence of Available Sector-Specific Data
Some AI and big data analytics applications are relatively new in the context of their deployment and use for some specific domains. This means that any meaningful and successful application in such areas will be hampered by the lack of existing analytic data. For example, we performed a pilot study for one SME by applying supervised machine learning to input–output parameter optimisation in additive manufacturing, and one main limitation we found was the insufficiency of fabrication data in the 3D printing sector. This is not to suggest that there is no reasonable closed data among the SMEs in this sector, but that may not be enough to implement supervised machine learning models and there are no feasible current mechanisms by which such SMEs can share their own hard-earned limited data. This led to suggestions of using simulated data for ML-based parameter optimisation in AM [
24].
4.3.2. Low Awareness of Open/Non-Open Data Value and Its Potential
In many cases, government datasets are made available for free and are made public through data openness. Usually, the reasons are related to improving the service, increasing economic value or achieving political transparency. These datasets can be valuable to the success of small businesses, but they seem to be largely unknown to them. Around 20 percent of the SMEs we supported created new services and discovered new markets using open data from education, e-recruitment and transportation. The more SMEs understand open data advantages and how it can deliver positive outcomes, the more innovative products and services they are able to design using it at a lower cost. Moreover, many of the SMEs we worked with were aware that they could use data not only to keep records but also to gain useful insights into their business. Yet, learning data science skills is a challenge for SMEs as many are unsure of the types of data from their operations that should be collected. The fact that SMEs lacked knowledge about data handling tools also made them unable to use this data.
4.3.3. Data Integration/Interoperability
The competitiveness of SMEs can be improved by integrating their systems with their suppliers or other open data available from governments or trading partners [
25]. The demand for businesses to exchange real-time information has grown since the adoption of technologies such as mobile commerce, electronic funds transfers, supply chain management and online transaction processing. Organisations could benefit from integrating their IT infrastructures to address this need. In many cases, however, portability and interoperability measures for SMEs are still being implemented relatively slowly, while in others they are at an early stage. Data integration is a significant problem for SMEs due to high costs and technological requirements and is frequently cited as being a sticking point within organisations. Some existing approaches to integration, such as Electronic Data Interchange (EDI), inventory management and automated data collection systems, can help SMEs overcome some of their integration challenges, but they have their limitations. It is possible to further simplify these integration problems by utilising web services nowadays. The need for case studies on the integration efforts of SMEs and how they deal with integration and interoperability problems is critical.
4.3.4. Limited Internal and External Financial Resources
In our research work with SMEs, we discovered that most of them are able to recognise and utilise data and analytics to grow their businesses. Also, we noted their willingness to use data analytics and invest in related technologies to derive meaning from their data. Despite their attempts at adopting data technology, their capabilities are insufficient since most do not possess the required knowledge and expertise, nor the budget to hire specialists or outsource their analytic needs. A further barrier comes from SMEs having limited access to funding and loans compared to big companies. Thus, the significance of this ERDF and other similar projects, which aim to bridge the gap, is justified. A greater level of financial and technical support is also needed to foster the adoption of data analytics by micro- and small-sized businesses, especially during the period of COVID-19 [
14].
4.3.5. Perceived Ease of Doing Business Conventionally
The majority of SMEs operate in specific business sectors and are dependent upon conventional business methods. Thus, many business owners would prefer to maintain their traditional business practices and refrain from adopting disruptive technologies, such as artificial intelligence, data analytics, etc. As a consequence, they are not tempted to use data other than for record-keeping purposes. There are a number of possible explanations for this reluctance to leverage the benefits of advanced data usage—not just a misunderstanding of what these advances are meant to offer their companies, but also the perceived short-term disruption such changes might cause—such as learning new tools, implementing software packages or investing in cloud computing, and hiring employees with data analytics skills. However, the result is an overlooked data-driven business opportunity, which could have been beneficial for the SMEs in the long run. SMEs’ decision-making process could be made more data-driven by encouraging a business shift.
4.3.6. Shortage of Domain-Specific Data Analysts
It is often necessary to combine data analytics skills with business context and domain knowledge in order to analyze business data effectively [
26]. As a result of the limited number of analysts in the business who meet such criteria, SMEs outsource their data analytics needs to experts at comparatively higher costs. Data science and machine learning for process control and modelling are still in their infancy in some domains, e.g., additive manufacturing, due to the lack of many experts who understand the business context. SMEs in manufacturing are less likely to use data for analytics and decision-making [
27], which makes it harder for them to exploit their data to enhance growth and productivity.
4.3.7. Lack of or Outdated Technical Knowledge
Small businesses need to develop and upgrade employee skills in order to grow. The lack of finance, capacity in data science and machine learning, and awareness of innovation funds, among other things, prevent many SMEs from remaining competitive as technology advances in terms of employee skills and competence. These are especially applicable to smaller companies, such as manufacturing and technology companies, who face challenges when designing, developing and testing new products, or upgrading their existing ones to meet new needs. Based on the analysis in
Section 4.2, we can understand that the percentage of SMEs with skills and training development needs is roughly 40% as shown in
Figure 5.
4.3.8. Insufficient Knowledge of the Data Tools and Available Funds
In our study, we found that SMEs are unaware of the available funding, especially for adopting innovative digital and data-driven ideas. Knowledge Transfer Partnerships (KTPs) are considered one of the most appealing funding schemes with respect to the BDC’s digital assistance and collaboration with SME business owners since minimal contributions are required from companies and the partnership may have a high level of impact on SMEs. In addition, our study found that only a very small percentage of micro enterprises are aware of some of the most widely used data management and analysis tools, and the benefits these tools can provide. It proved crucial to many SMEs to support their adoption of these tools (including Dropbox, Power BI and R Studio).
4.3.9. Capacity Limitation in Data Science and Machine Learning
One other primary challenge facing SMEs in digitising and adopting AI and data science technologies is the inadequacy or lack of working knowledge and capacity in these technologies. This barrier is partially linked to the other aforementioned challenges such as SMEs’ limited resources, e.g., finance.
Figure 5 shows the breakdown analysis of the digital technology support sought by the sample SMEs of which skills development and training forms the largest percentage (40%) followed by system design and development (34%). For some SMEs, this was partially compensated by outsourcing data science and AI needs to external solutions such as cloud computing-based Machine Learning as a Service (MLaaS) platforms [
14].
6. Summary and Conclusions
Digitalisation in SMEs has never been more needed than in the post-COVID-19 era as most businesses adopted online and hybrid operations with many of their employees working from home. In fact, earlier studies in the pandemic have found that up to 70% of SMEs stepped up digital technology use during the COVID-19 era [
14]. However, considering constraints such as the lack of sufficient finance to invest in IT infrastructure and to hire the right skilled experts, SMEs are still far from being in full swing as part of the digital revolution.
Evidently, there is a need to raise awareness among SME owners, managers and entrepreneurs about the advantages and challenges digitalisation could bring to their business, and how different subfields of data science could apply to different industries, business functions and business models. Decision makers have to train in order to rethink their business processes and to reconfigure tasks and organisational structures. More staff would also require upskilling in order to consider and guide analytical outputs, and take a data-driven approach to solve problems leading to more informed decisions that benefit the business. The range of challenges identified as a result of our analysis includes the following:
Need to support SMEs in building a culture of data, from collection, to management, to protection and processing, in order to ensure that the digitisation transition takes place with the least risk to SMEs.
Raise awareness of the benefits of data science and analytics to the business.
Upskill SME managers and employees, ensuring an involved approach for redesigning business processes and training required to run applications, and analysing results.
Consider mechanisms to bridge the financing gap until the data science solution can deliver its full potentials.
Enable SMEs to gradually increase their capacity before being eventually able to develop their own data science solutions.
Provide an analysis of the sectoral impact of data science on SMEs’ business activities, with specific business use cases, and inform pertinent investors.
Better understand the role that business associations, chambers of commerce, academia, national and local governments, international organisations and other SMEs could play to progress on these different dimensions, and support with knowledge sharing and open data availability.
Our analysis clearly suggests that most SMEs collect and store some sort of business data but require skills to analyse and produce useful insights for data-driven decision making. If SMEs are empowered with the right skills and/or supported financially for this purpose, they can make full utilisation of data to help them, hence driving the growth of the entire economy.


 ,
, 

