You are currently viewing a new version of our website. To view the old version click .
Big Data and Cognitive Computing
  • Article
  • Open Access

8 March 2021

A Network-Based Analysis of a Worksite Canteen Dataset

,
,
,
and
1
Dipartimento di Matematica e Informatica, Universitá degli Studi di Catania, I95125 Catania, Italy
2
Dipartimento di Ingegneria Elettrica, Elettronica e Informatica, Universitá degli Studi di Catania, I95125 Catania, Italy
*
Author to whom correspondence should be addressed.
This article belongs to the Special Issue Big Data and Cognitive Computing: Feature Papers 2020

Abstract

The provision of wellness in workplaces gained interest in recent decades. A factor that contributes significantly to workers’ health is their diet, especially when provided by canteen services. The assessment of such a service involves questions as food cost, its sustainability, quality, nutritional facts and variety, as well as employees’ health and disease prevention, productivity increase, economic convenience vs. eating satisfaction when using canteen services. Even if food habits have already been studied using traditional statistical approaches, here we adopt an approach based on Network Science that allows us to deeply study, for instance, the interconnections among people, company and meals and that can be easily used for further analysis. In particular, this work concerns a multi-company dataset of workers and dishes they chose at a canteen worksite. We study eating habits and health consequences, also considering the presence of different companies and the corresponding contact network among workers. The macro-nutrient content and caloric values assessment is carried out both for dishes and for employees, in order to establish when food is balanced and healthy. Moreover, network analysis lets us discover hidden correlations among people and the environment, as communities that cannot be usually inferred with traditional or methods since they are not known a priori. Finally, we represent the dataset as a tripartite network to investigate relationships between companies, people, and dishes. In particular, the so-called network projections can be extracted, each one being a network among specific kind of nodes; further community analysis tools will provide hidden information about people and their food habits. In summary, the contribution of the paper is twofold: it provides a study of a real dataset spanning over several years that gives a new interesting point of view on food habits and healthcare, and it also proposes a new approach based on Network Science. Results prove that this kind of analysis can provide significant information that complements other traditional methodologies.

1. Introduction

The impact of the diet adopted in canteens is highly relevant for peoples’ health [,], helping in diseases prevention [], improving productivity [], and providing a contribution to a global healthy population []. In this work, we focus on worksite canteens but some of the results and the methodology can be applied to several others, such as school canteens [,] and in [] that performs analysis of both environments.
The common characteristic is the presence of complex correlation among meals, as well as people and habits that usually arise in creation of communities. The analysis and improvement of food quality in workplaces is a challenging task for several reasons:
  • a shifting towards lower quality food has been detected in nutritional surveys, e.g., [], sometimes to guarantee profit margin for canteen operators [];
  • many people spend a relevant amount of their life at work (approximately more than 60 percent of waking hours), and about one-third of our daily energy intake is consumed in worksites [], therefore the quality of meals, both in terms of health and pleasure, is significant along the day [,] and the promotion of good eating habits further improves such a scenario [];
  • workers usually have limited access to nutrition information, and this prevents them from making an aware choice [];
  • a trade-off between high-quality food intake in worksites and the reduction of related costs and waste must be achieved [], e.g., by exploiting solutions as pre-ordering of meals, weight-based billing, and flexible portion size [,].
To cope with all these issues, an analysis of actual dishes intake is helpful; this can be accomplished, for instance, by evaluating the compliance of canteen menus with well-known healthy diets as the Mediterranean diet [], as well as considering dishes composition in terms of macro-nutrients as lipids, carbohydrates and proteins [].
In this paper, a multi-company dataset of workers and their dishes intake within a canteen worksite is considered. Therefore, while other studies (e.g., []) operate on a statistical basis of semi-automatically collected data (for instance via questionnaires), our dataset comes from users’ pre-ordering menu selection made via a dedicated App. Moreover, we adopt a Network Science approach that has been successfully used to represent and analyze data in disparate fields as economy [,], biology [], migration [] and only recently in food-related contexts [].
The results of our analysis is concerned with with the topological analysis of tripartite network including workers, the company they belong to, and consumed dishes. Then, the macro-nutrient content and caloric values of both dishes and the average meal of each employee are considered to assess to what extent served dishes are balanced and healthy, to promote a healthful lifestyle. Finally, we also investigate the community structure of the canteen network.
In summary, the main contributions of this case study paper are:
  • the study of the eating habits at a worksite canteen, and their impact on health that take into account also the correlation among the contact network existing among people due to the presence of different companies;
  • the use of network analysis techniques that allow us to search for hidden correlations among people and their environment, for instance, the presence of communities (not only due to company belonging) that cannot be studied or inferred with traditional or statistical methods since they are not known in advance;
  • to provide a different view of the dataset, represented as a tripartite network.
As for the last point, we believe that a tripartite network representation of our dataset clearly highlights relations among companies, people and dishes. Moreover, from this representation, we can further elaborate the so-called network “projections”, where the network among specific kind of nodes (e.g., people or dishes) is inferred. This allows performing community analysis using standard network community detection algorithms and well-developed network analysis tools.
Existing literature is considered in Section 2, whereas the dataset is introduced in Section 3, and in Section 4 network analysis is described in detail, and results are discussed. We finally consider further works and concluding remarks in Section 5.

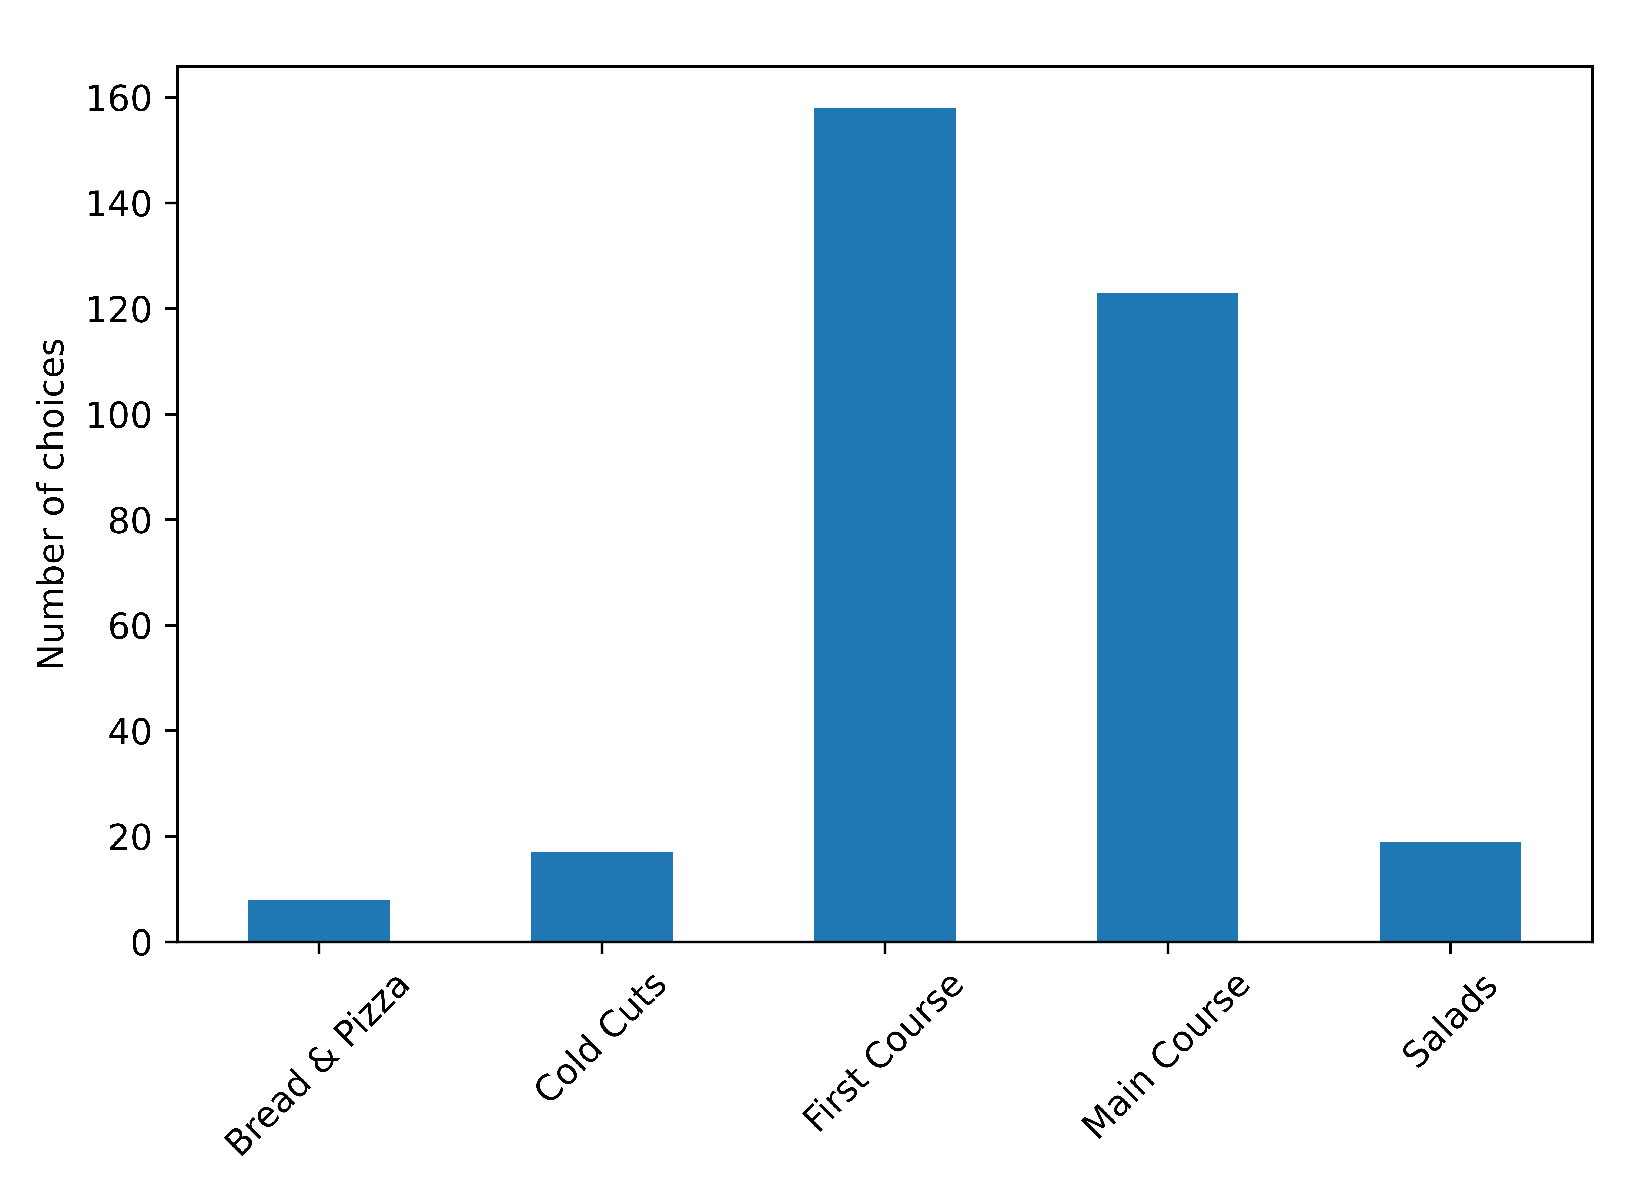
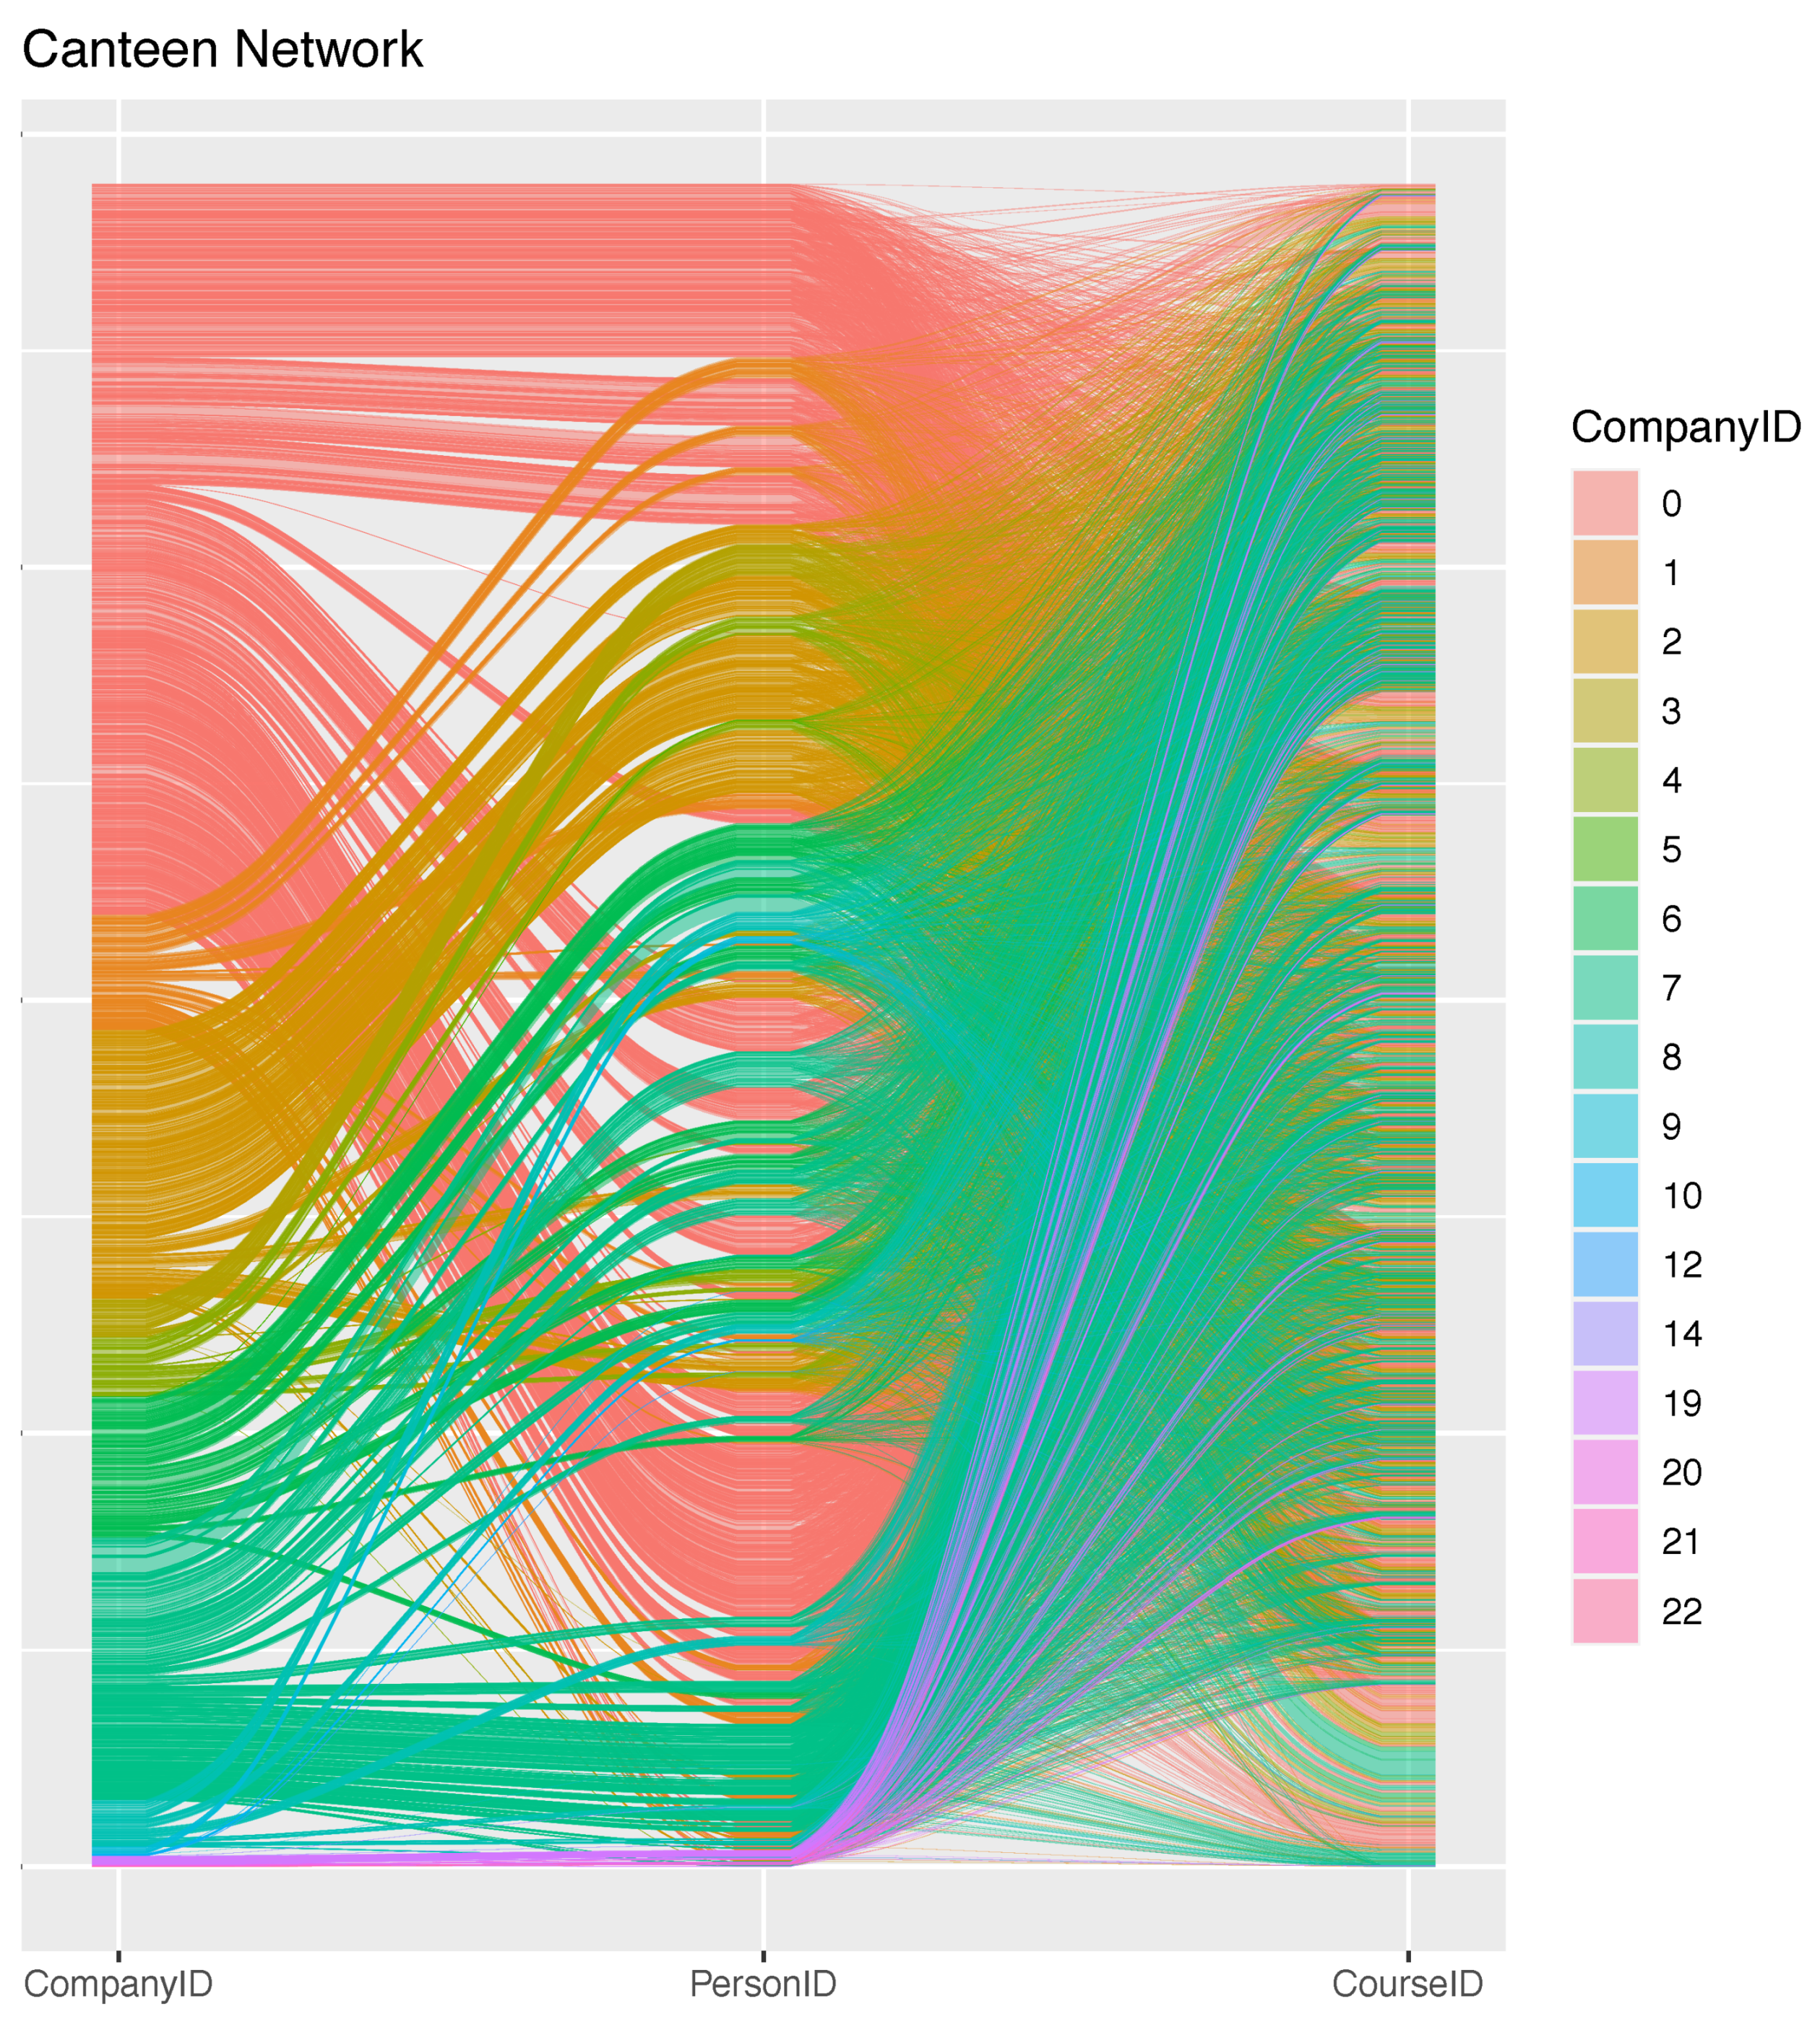
3. Dataset Description and Representation

The dataset analyzed in this work includes 49,539 dishes ordered in about 2.5 years, from August 2017 to March 2020, by 646 employees of multiple companies. The companies differ both in number and the average age of employees and their core business; however, their business is related to Information and Communications technology. The companies belong to an innovation hub, which provides several other services with the main aim being the improvement of the quality of life of the employees [] to increase their productivity through a better sense of belonging. The hub is located in Sicily, Italy and the employees are from different Italian regions and even different countries. In particular, the canteen is accessible by the employees of 22 different companies through a cross-platform proprietary App, which allows them to book their meal by choosing from the daily menu and provides the canteen management with statistical information. Each company employs from 1 to 264 employees and the average number of meals consumed by workers of each company is extremely variable (from 1 to more than 262). For a deeper view on the number of employees of the companies and the number of meals consumed, we refer the reader to Table 1.
Table 1. Distribution of Employees, total and average number of meals over companies. The companies are anonymized therefore it is not possible to trace them by the id.
For this study, the dataset was anonymized by removing personal information about employees and identifying each of them with a randomly chosen “employee code”; however information about the company id they work for was retained.
Each dataset record is created by the App when an employee makes a reservation and includes the timestamp, the anonymous employee code and the dish chosen. We pruned all the records where some of the data is missing, discarding about 20 % of them.
Regarding the dishes served during the collection of the data, there are 317 dishes in the dataset and they are identified by name and their type. Dishes have a different number of occurrences in the menu (i.e., they are not proposed periodically), and for each dish additional information is also available (for instance, if the dish comes with bread, if it is gluten-free, suitable for vegetarians, etc.).
Dishes were grouped by canteen management into 5 different categories according to the typical structure of a menu in Italy [], as shown in Figure 1 where it is possible to note that the multiplicity of proposals in the different categories is not homogeneous and two of them are way larger than others.
Figure 1. Total number of meals chosen by workers, grouped by category.
In Figure 2 we represent the dataset using a tripartite network that allows us to connect companies (C) (each with a different color), employees (P), and meals (D). A tripartite network is a graph whose vertices can be divided into three disjoint and independent sets C, P and D, such that every edge connects a vertex in C to one in P or a vertex in P to one in D. Vertex sets C, P and D are usually called the modes of the network. Each line (or edge) in the figure connects the employee (center column) with the chosen dish (right column) and the company he/she belongs to (left column). Given the characteristics of our dataset, the tripartite network representation appears the most appropriate. In fact, it clearly highlights relations among companies, people and courses and allows us to perform dataset analysis using standard and well-developed network analysis tools.
Figure 2. Tripartite network representation of the dataset. Each colored line connects the employee (center column) with chosen dish (right column) and the company he/she belongs to (left column).
The canteen’s menu has several options, some of which are repeated several times while others are offered only once or very rarely. The menus contain several choices, some of which may require that the diner also choose to get bread. As customary in the Italian culinary tradition, we included a 100 g portion of bread for categories 2, 3 and 5. In Table 2 a typical menu proposed by the canteen is shown.
Table 2. Some example of the dishes and the category they belong to. We reported the menu item in the original language and its translation.
Additional information regarding the ingredients of dishes is also available, along with the caloric value and macro-nutrients (as carbohydrates, proteins, and lipids); these values come from both classical Italian cooking recipes and the average portion size, and they play a relevant role in the present study to discuss the nutritional quality of the meals. No information is present in the dataset regarding extra foods or courses (such as fruit, desserts, or drinks) that can be consumed by the employee during lunch.
During the data collection period, 317 different served dishes exhibit a grand total of about 146 different ingredients. However, most courses are very similar, and they slightly differ in the recipe, meaning that ingredients and macro-nutrients are quite the same. Moreover, each course usually includes up to seven ingredients as depicted in Figure 3 while few courses include more than eight ingredients.
Figure 3. Number of ingredients used in dishes preparation. The graph shows how many dishes (y-axis) use k ingredients (k ranging from 1 to 11 on x-axis).
The single most common ingredient is extra virgin olive oil used for the preparation of 83 % of the dishes.
In Table 3 the average, minimum and maximum values of caloric values and macro-nutrients in the dishes are summarized. Figure 4 reports the distribution of proteins, lipids, carbohydrates, and calories over the proposed dishes for each category, the presence of many outliers for category 2 and 3 indicates that the dishes present in these categories are very varied in their composition.
Table 3. Insight of the macro-nutrients and caloric values of the dishes in the dataset.
Figure 4. Distribution of the proteins, lipids, carbohydrates and kilocalories across categories (1: Bread and pizza, 2: Cold cuts, 3: First course, 4: Main course, 5: Salads).

4. Dataset Analysis

In this section, we analyze the dataset from several perspectives. In the first step we study the dataset topology in order to evaluate the people-vs-dishes relation, while in the second step we study the macro-nutrients and the caloric value of both dishes and the diet of the employees. Finally, we analyze which communities emerge from the data.

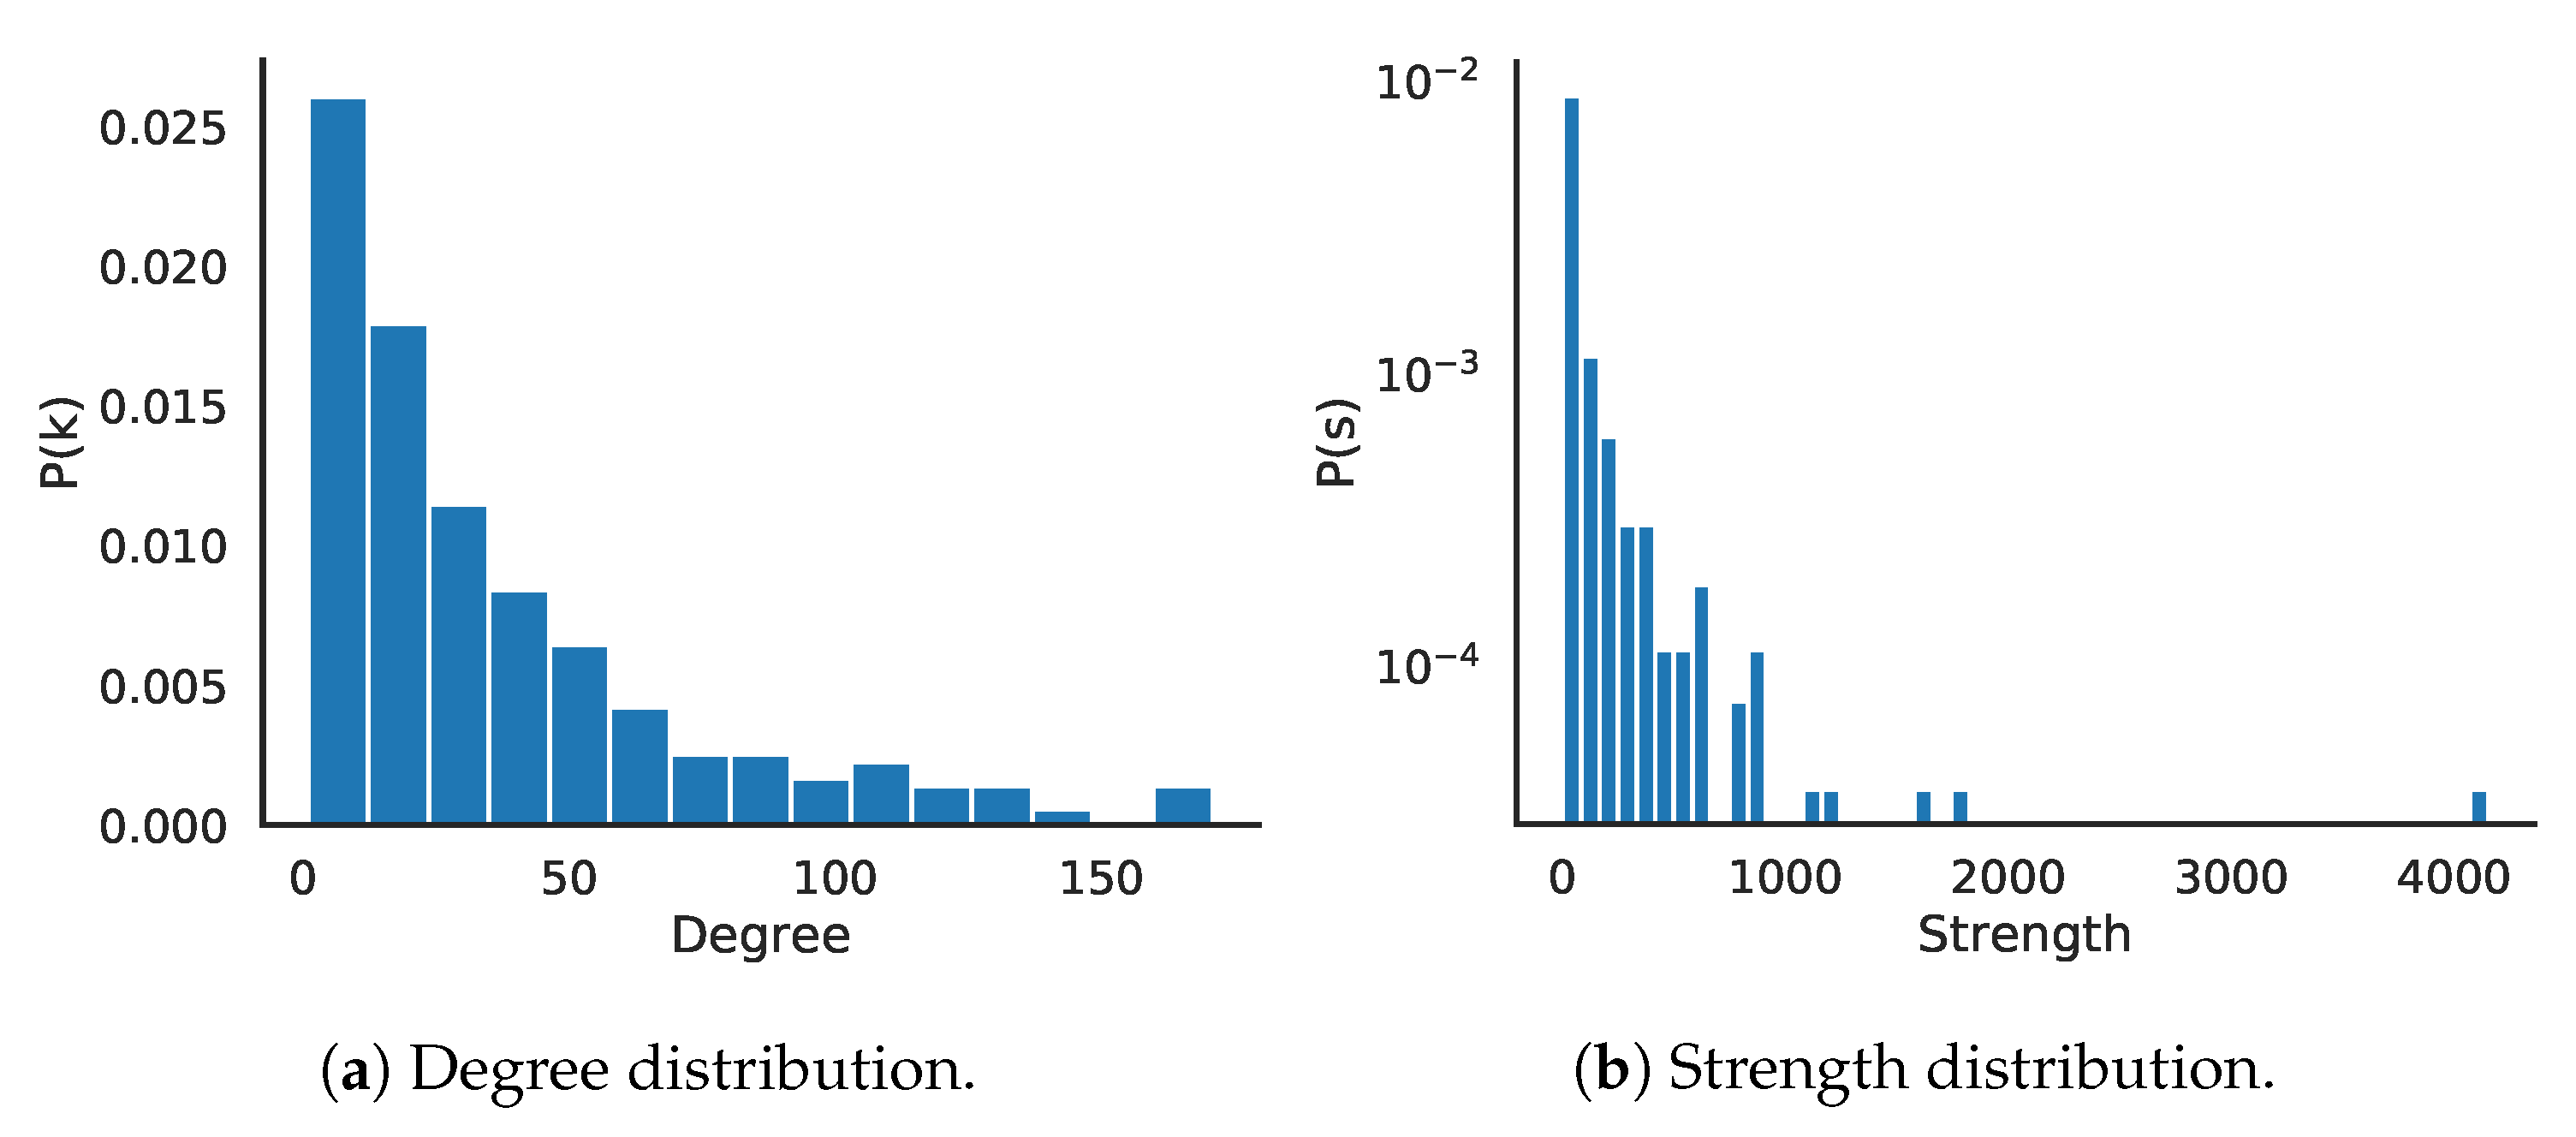
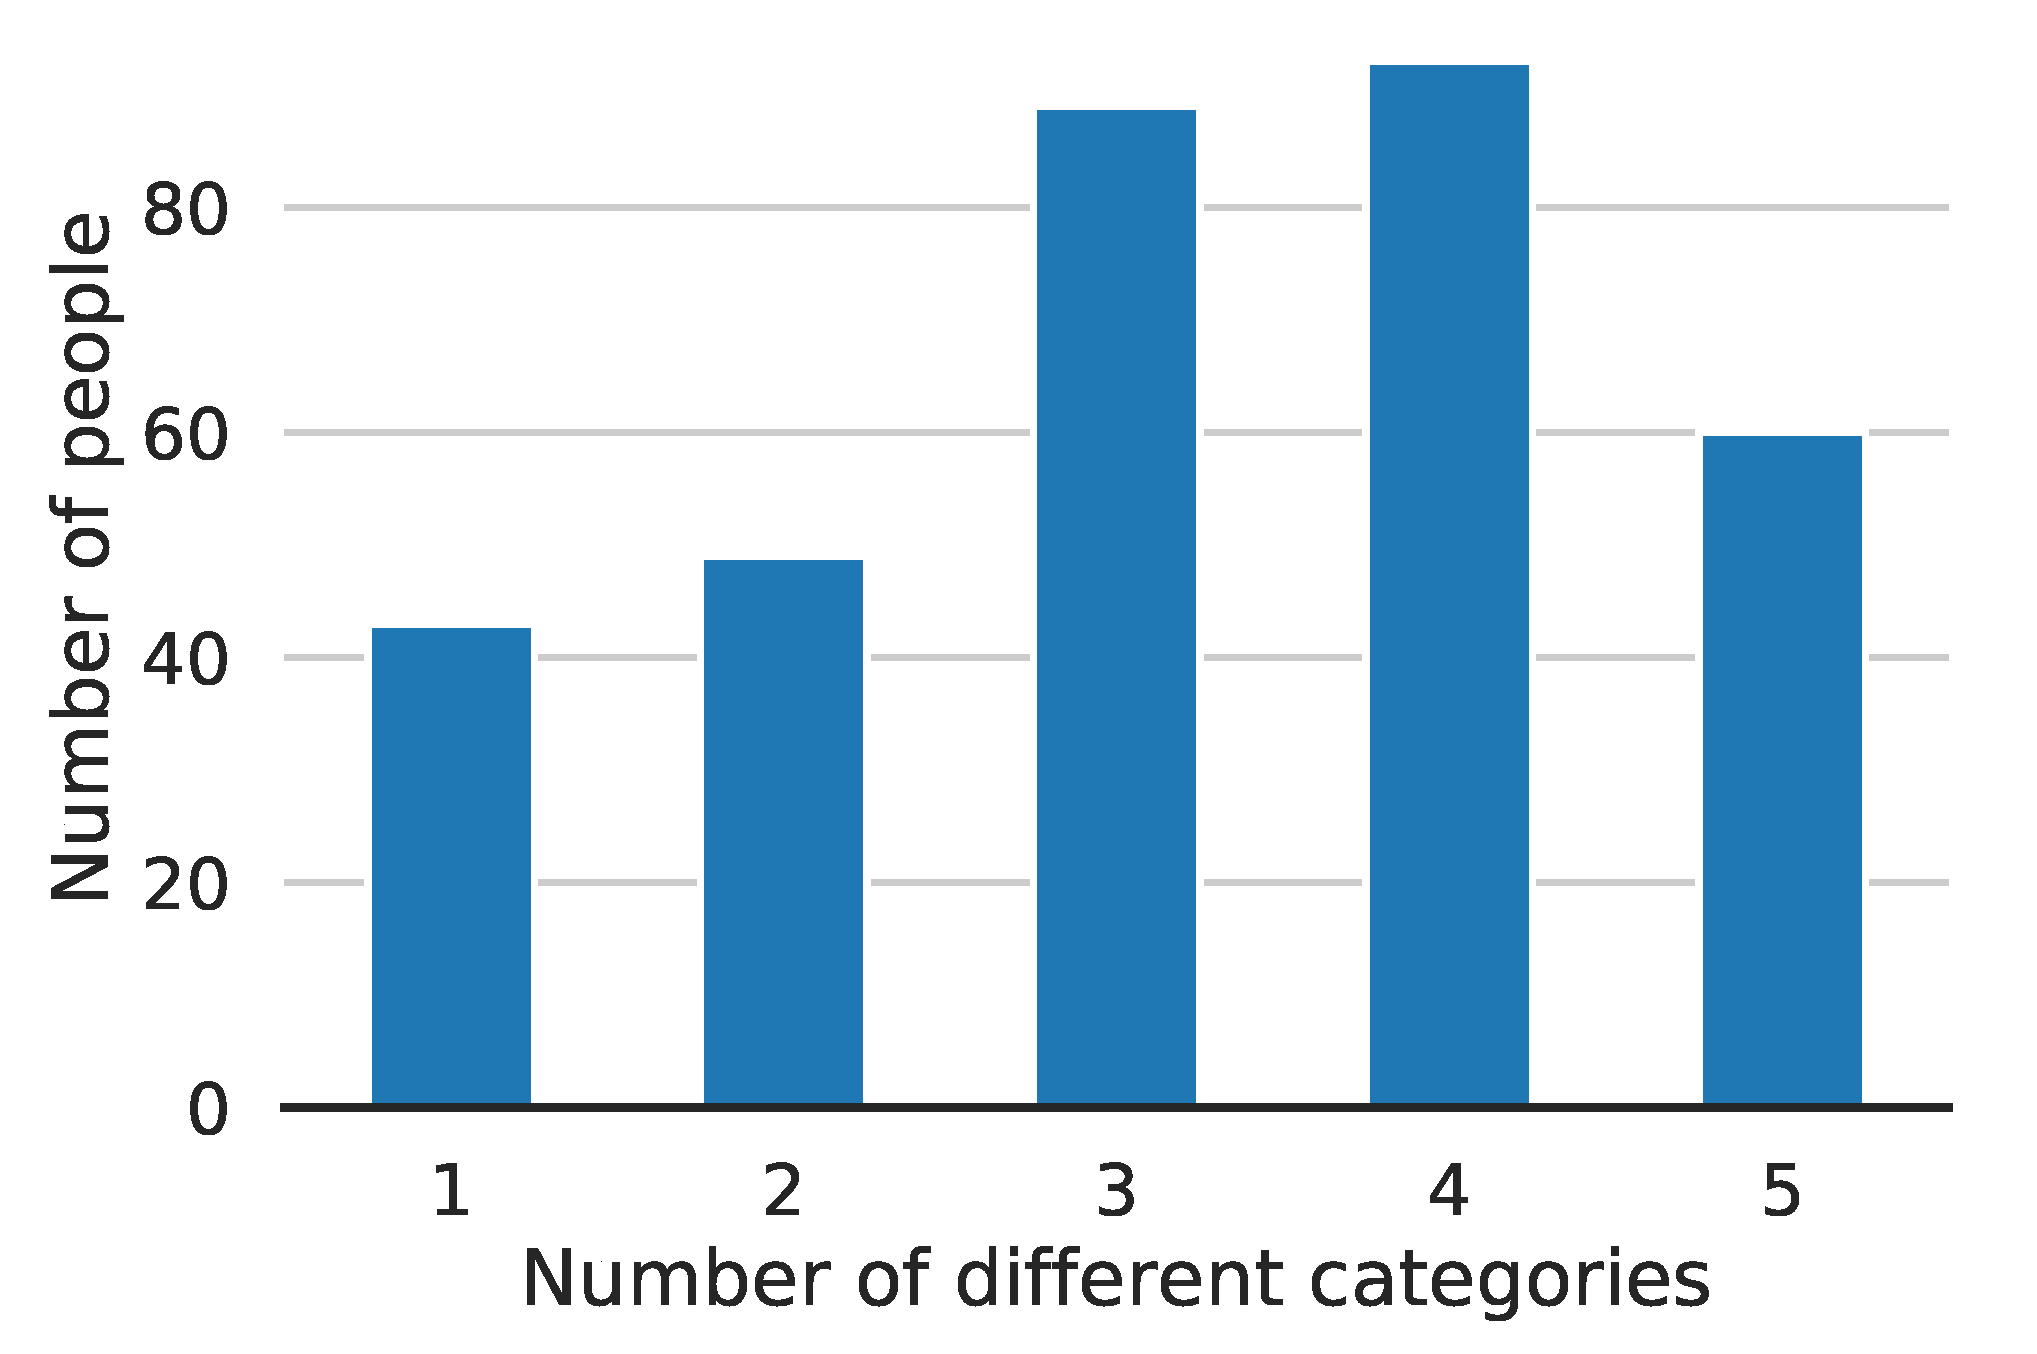
4.1. Topological Analysis

The first step in our analysis concerns the network topology. We study the degree and the strength of each node in the second and third modes of our tripartite network, which represent people who had a meal in the canteen and the dishes served. From now on, we will call these two modes People and Dishes, respectively.
The degree of nodes in the People mode is the number of unique different dishes consumed by that person: the higher the degree, the larger the number of dishes tried. Vice versa, the degree of nodes in the Dishes mode is the number of different people that ordered that dish at least once. More than one person in four sticks with the same small selection of dishes while the number of people that try more dishes decreases with the number of dishes itself, as shown in Figure 5a which illustrates the degree distribution of the People mode. On the other hand, most dishes have been chosen by very few people, as illustrated by the degree distribution of the Dishes mode in Figure 6a, and very few are very popular choices.
Figure 5. Degree and Strength distributions in the People network. The degree (a) is the number of unique different dishes consumed by a given number of people (x-axis). The strength (b) is the number of times that persons had a meal.
Figure 6. Dishes degree and strength distributions.The degree (a) is the number of different people that ordered a given number of dishes at least once (x-axis). The strength (b) is the number of times meals have been ordered.
Unlike the degree, the strength of a node accounts not only for the number of unique different choices made but also for the number of times they have been made, i.e., the strength of a node in the People mode is the number of times that person had a meal in the canteen, while the one of a node in the Dishes mode is the number of times that meal has been ordered. As depicted in Figure 5b, almost 10 % of people rarely order a meal, while a small number have a long order history. This should not be surprising as the dataset includes guests, people that travel for work and so on. More interesting is the strength distribution of the dishes, depicted in Figure 6b, which shows that most dishes are ordered not only by few people but just very few times, as opposed to very few dishes that are chosen often. Another key fact is that all these distributions follow a power-law, which is typical, for instance, in real-world social networks.
In Table 4 we report the 10 most popular dishes along with the number of times they have been ordered. Let us note that they include meat dishes with very few exceptions.
Table 4. The ten most popular dishes in the canteen.
At this point, the following question arises. Do people choose a wide variety of food? We try to answer with Figure 7, which shows how many people choose different food categories. As evident, most people ordered one dish from at least three of the categories described in the previous section (Figure 1), and just a few (which may include guests), only stick with one category.
Figure 7. Dishes category distribution. How many people (y-axis) choose food categories (1: Bread and pizza, 2: Cold cuts, 3: First course, 4: Main course, 5: Salads)

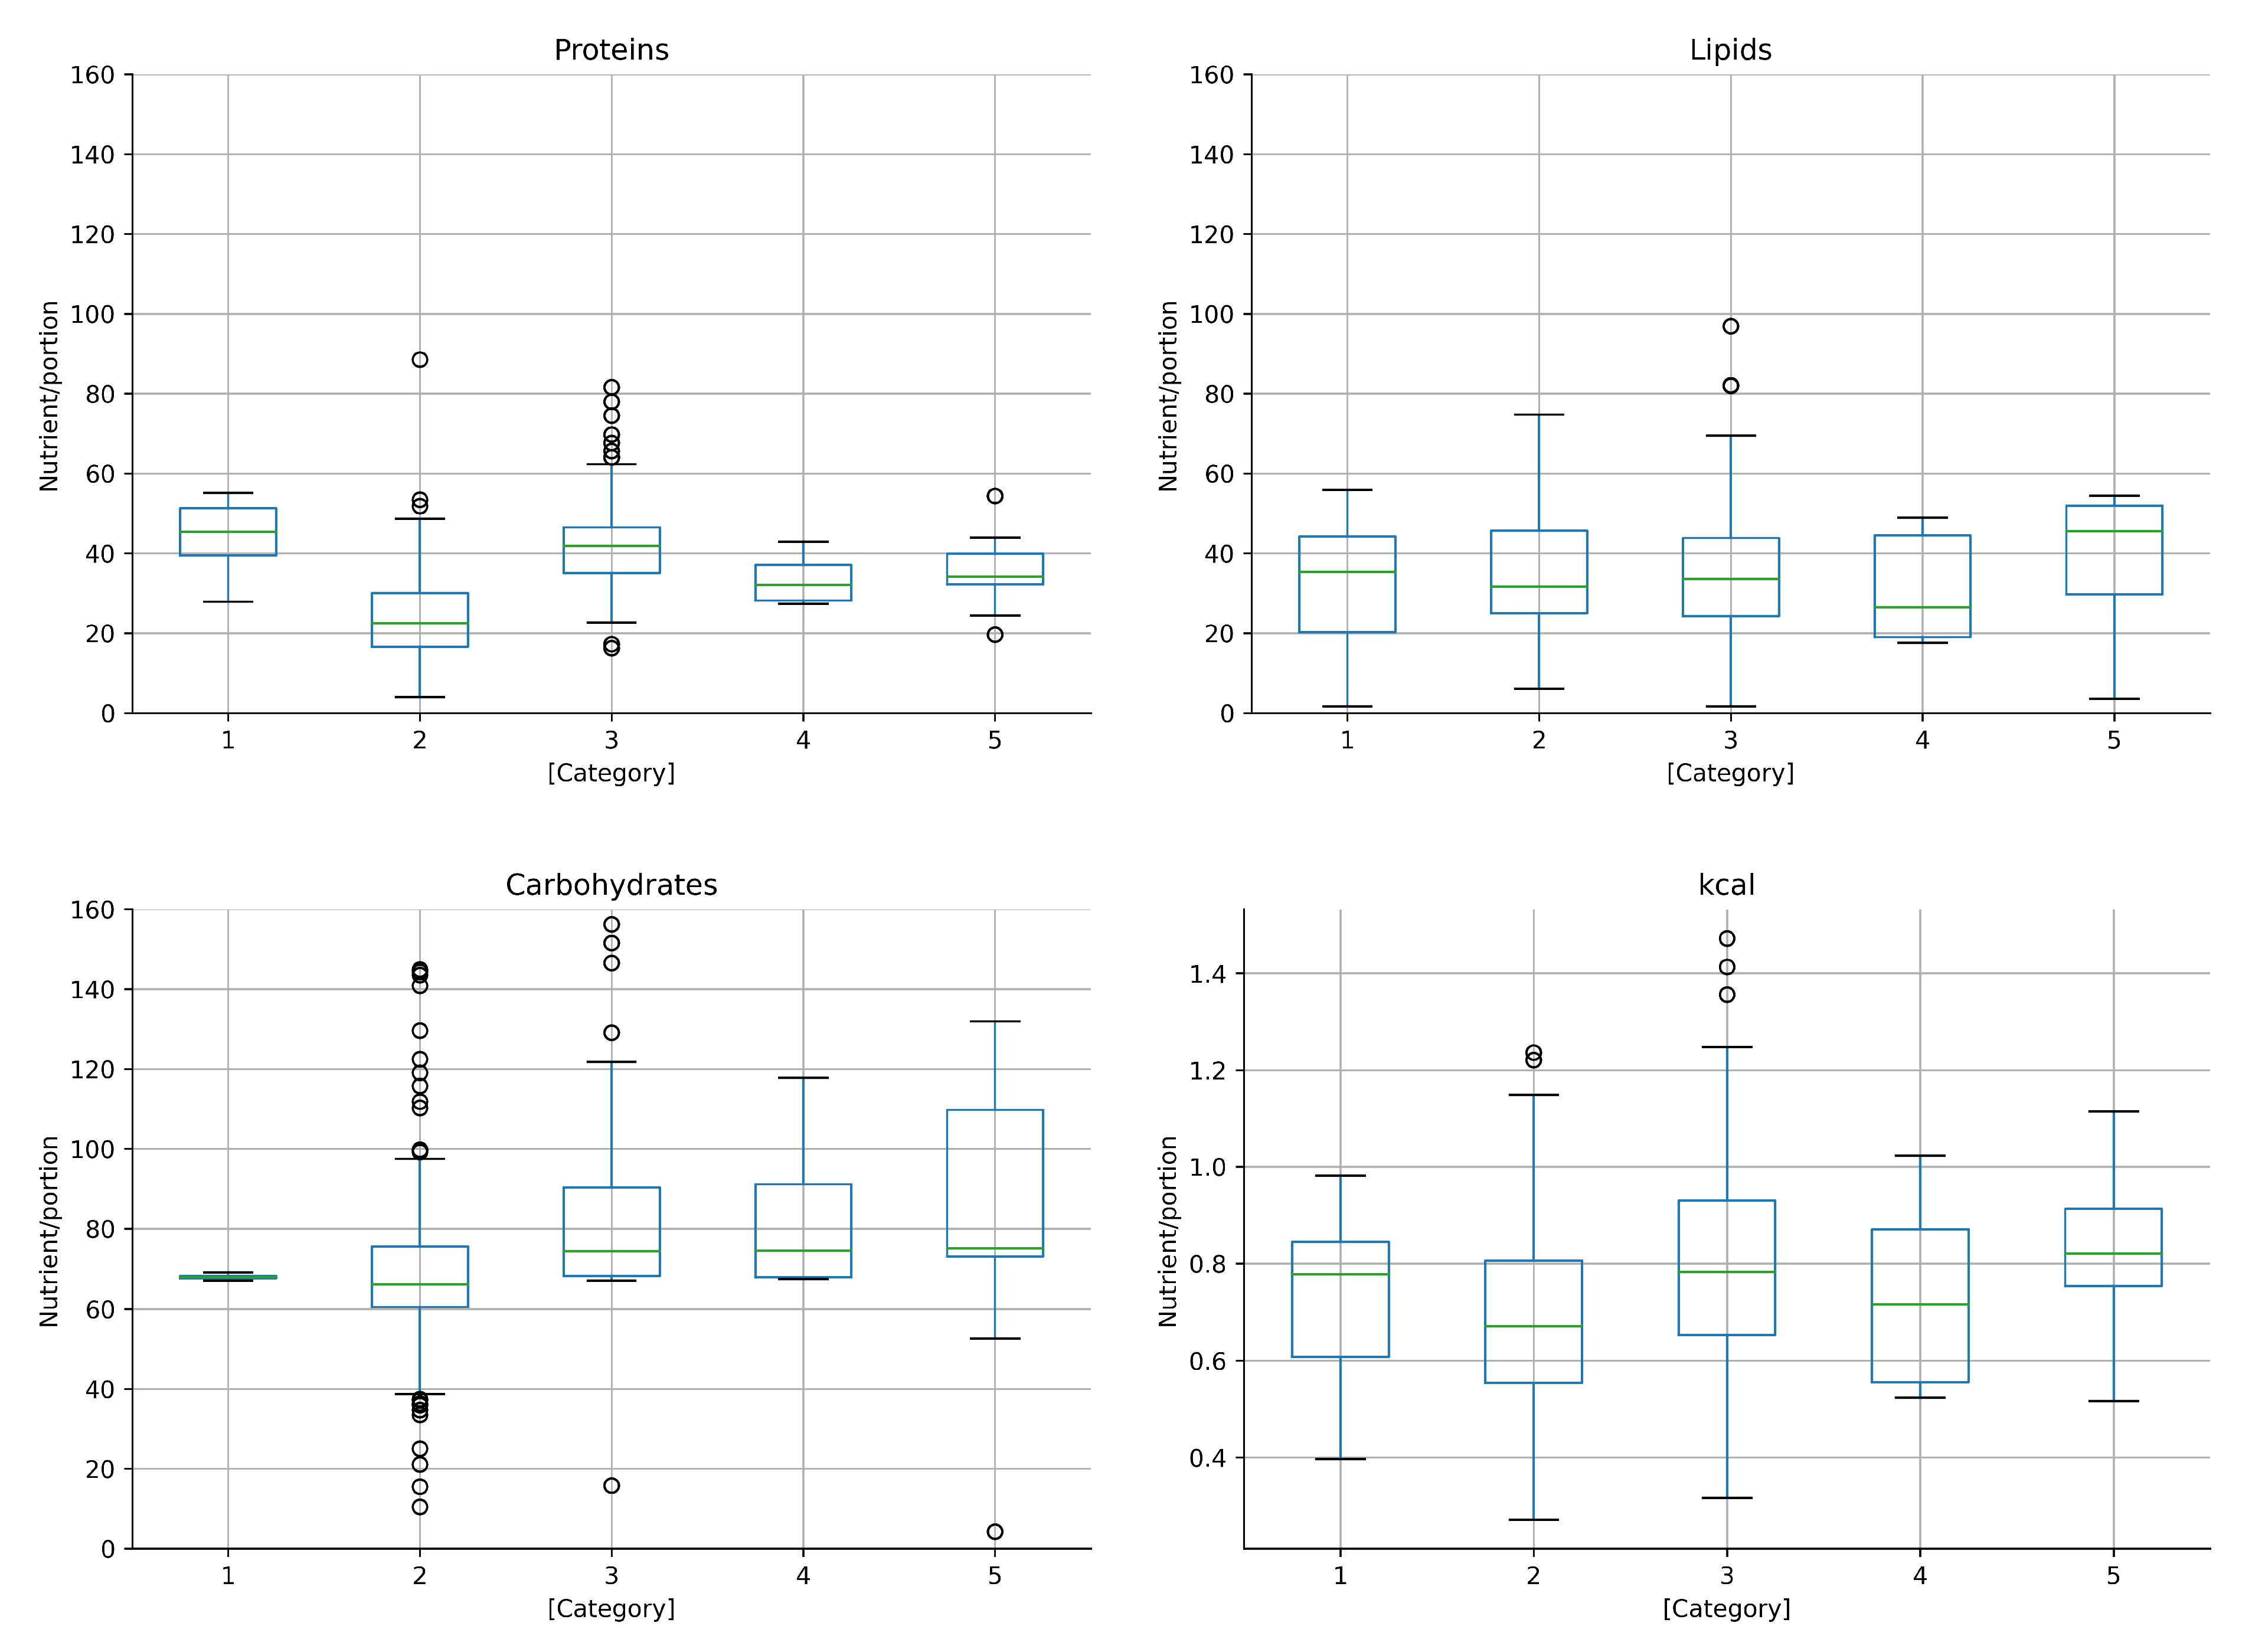
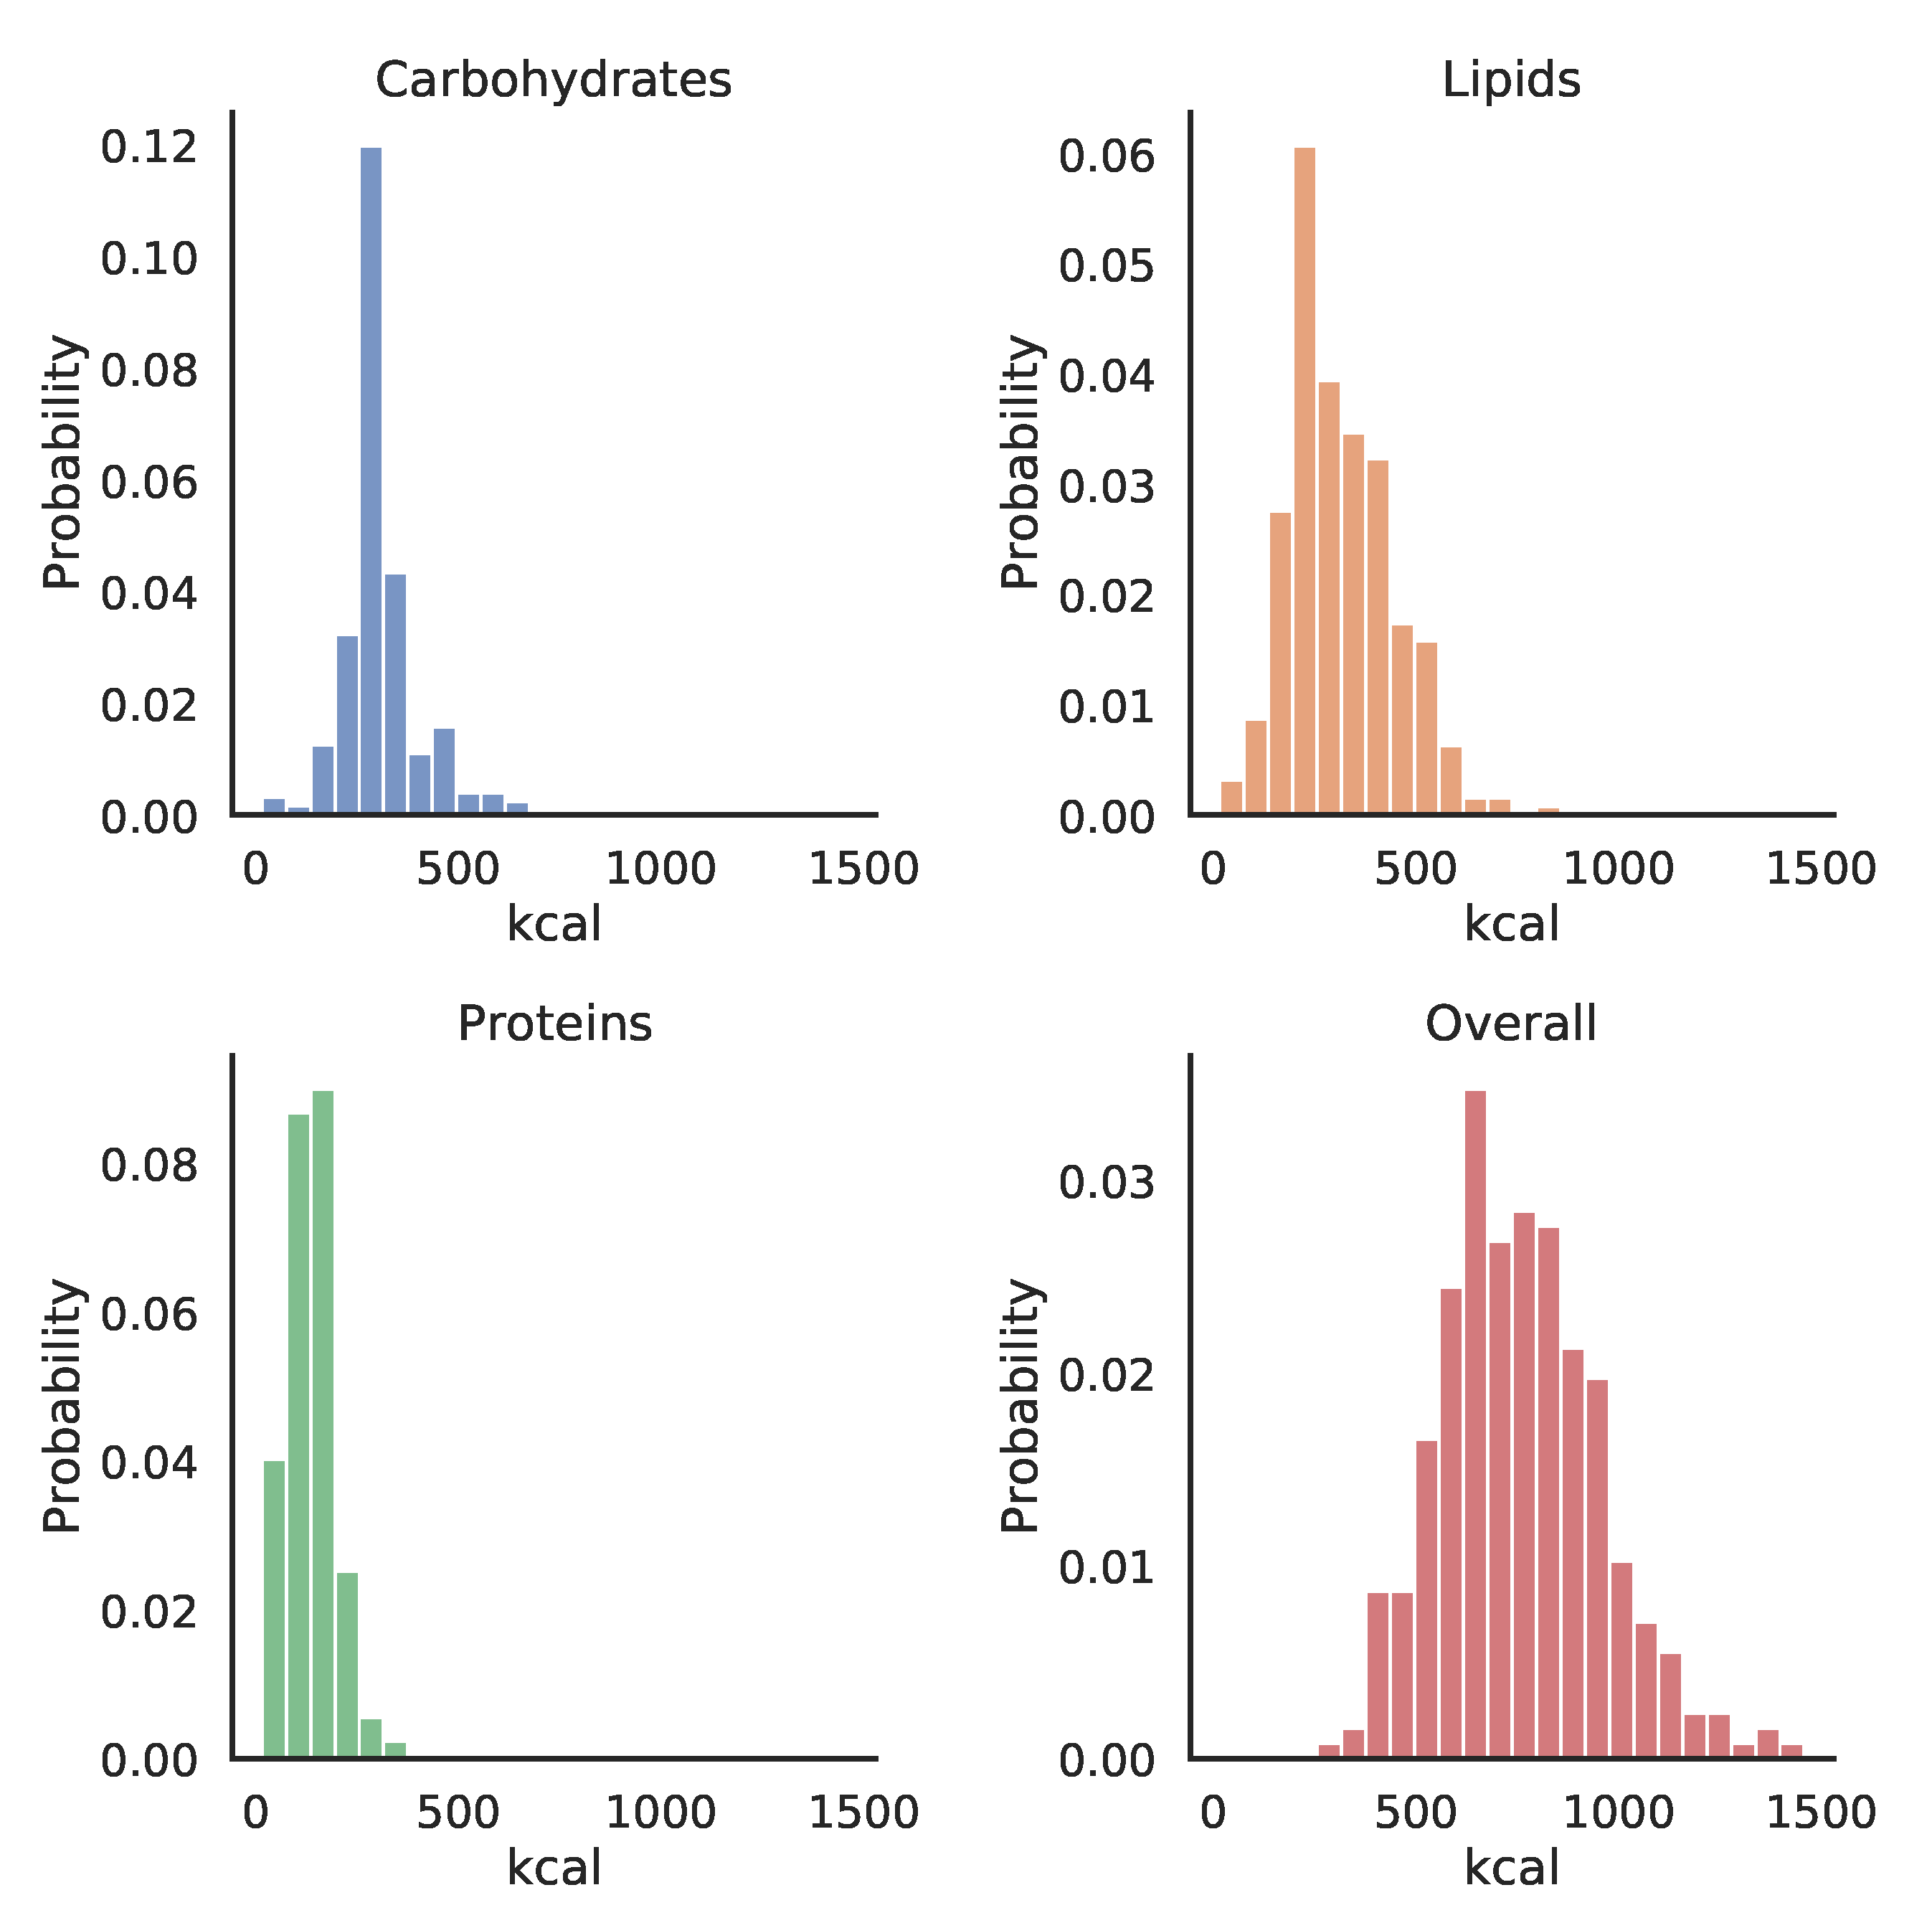
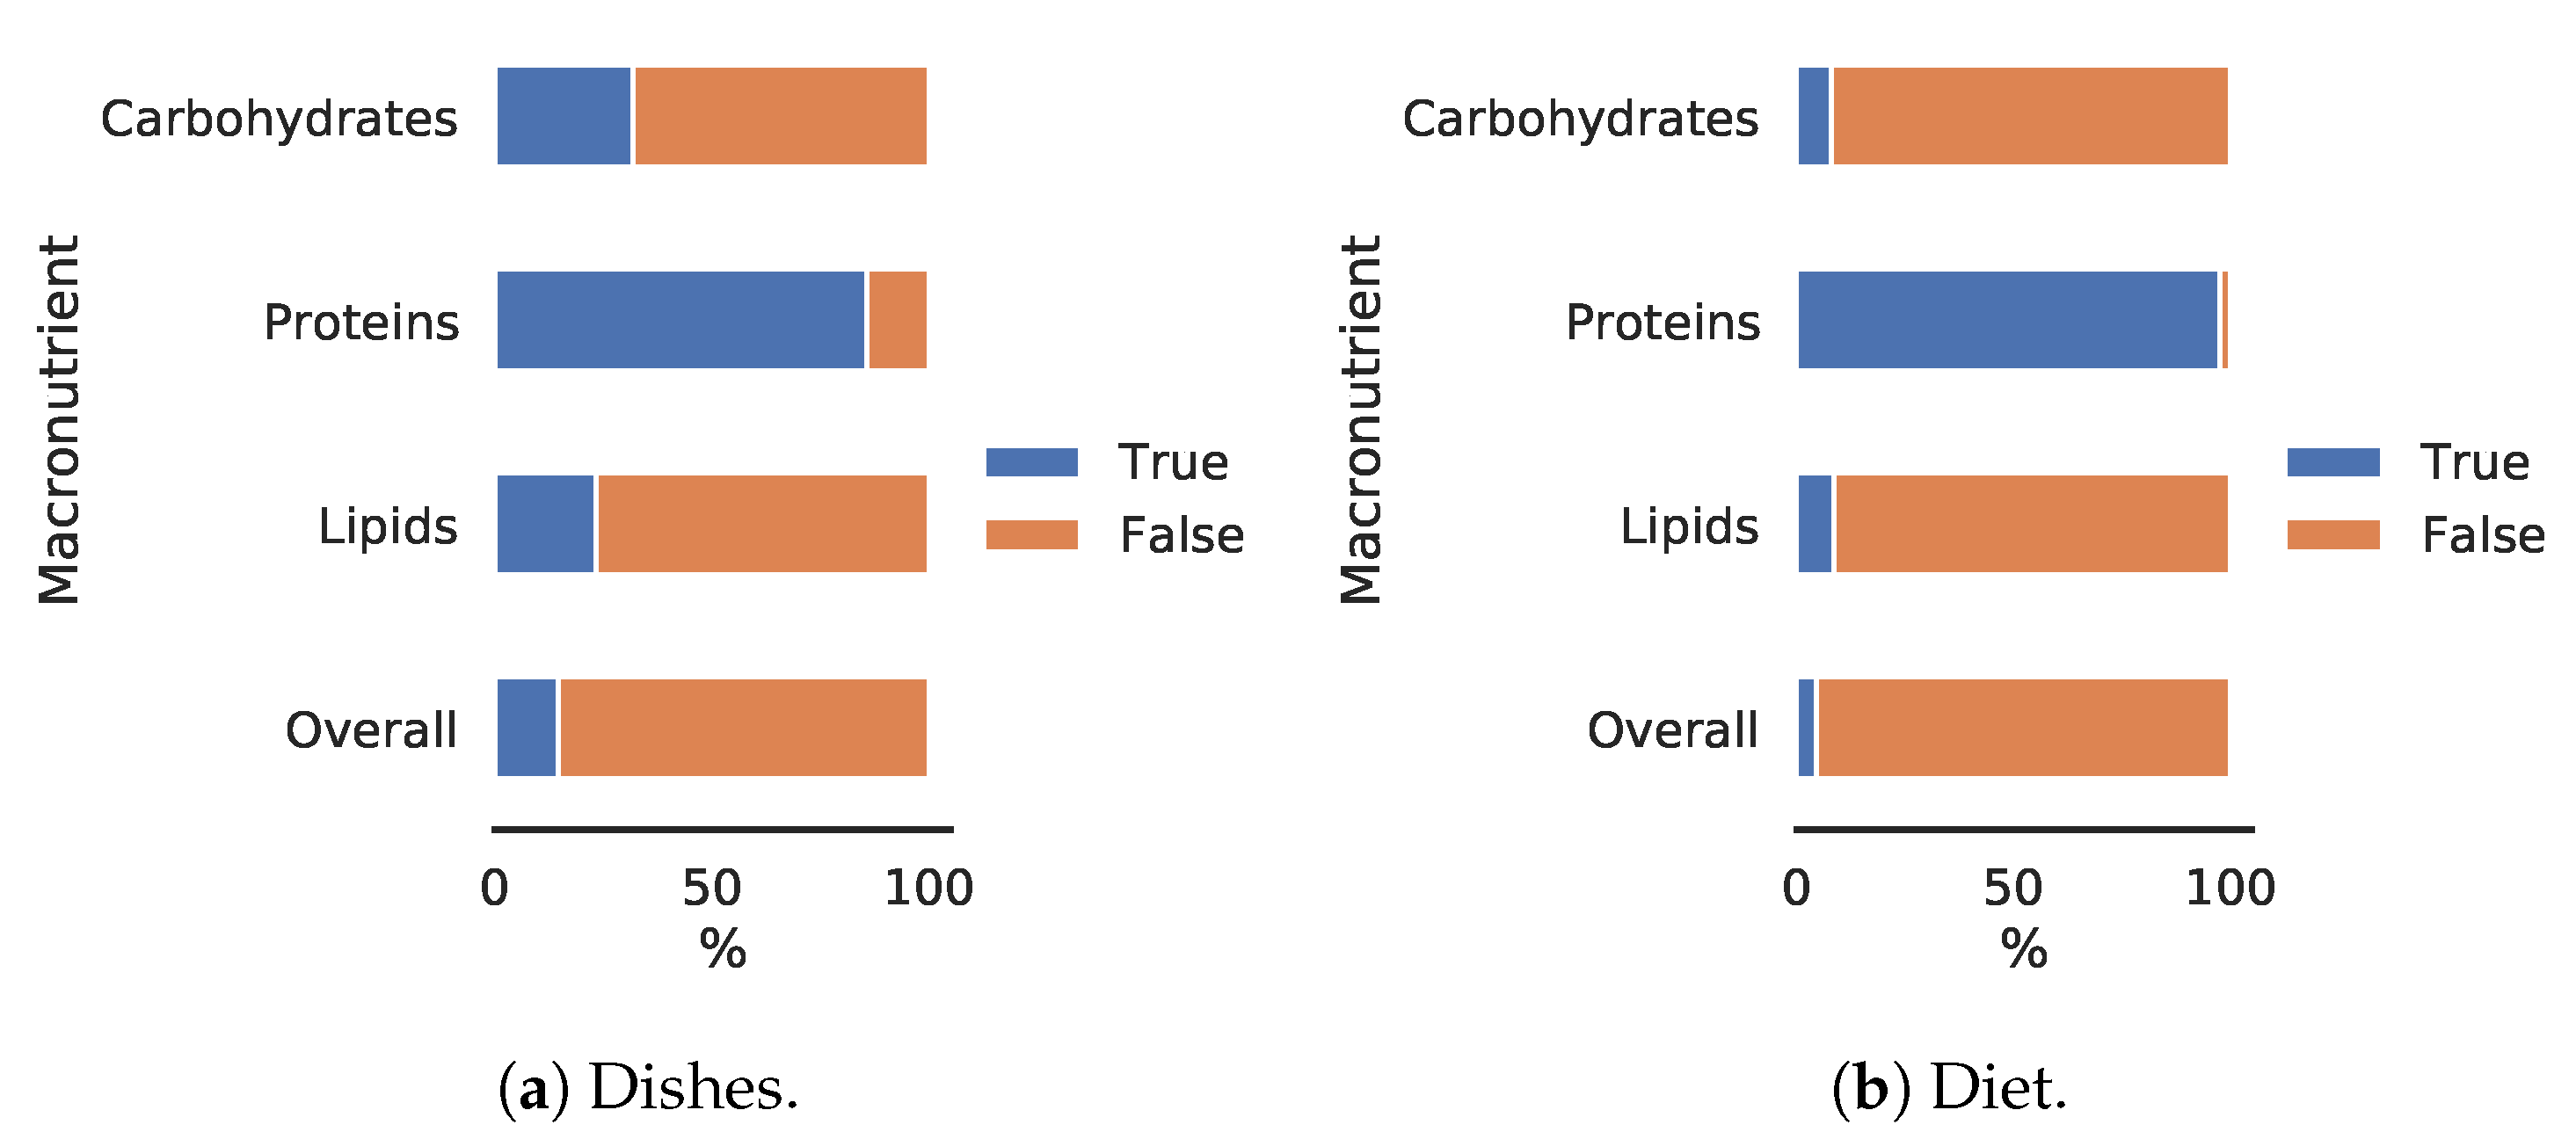
4.2. Macro-Nutrient Analysis

After analyzing the topology of the network, we analyze the macro-nutrient content and caloric values of both the dishes and the average meal of each employee. We show the macro-nutrients’ and overall caloric value of dishes in Figure 8.
Figure 8. Distribution of caloric values among served dishes.
To get a better understanding of their healthiness, we divide the dishes into balanced and unbalanced according to the [,] guidelines, which set the distribution of daily calories intake from carbohydrates between 45 % and 65 % , from proteins between 10 % and 35 % , and from fats between 20 % and 35 % . As shown in Figure 9a, just 14.5 % of the dishes are balanced overall macro-nutrients, while most are unbalanced in carbohydrates ( 68.1 % ) and in fats ( 76.6 % ). We analyze further the content of macros of the unbalanced dishes and show the distribution of their lack or abundance in Figure 10. Specifically, we first compute the caloric value ratio of each macro, and then compute the distance from the guideline’s range, i.e., we subtract the lower bound if the caloric value ratio is lower than the minimum suggested, or the upper bound if it is greater than the maximum suggested. As illustrated in the figure, the caloric value of most dishes comes from an excess of fats at the expense of carbohydrates.
Figure 9. Division of the dishes (a) and diet (b) of employees in balanced (True) and unbalanced (False) according to [,] guidelines.
Figure 10. Distribution of the unbalance of macro-nutrients (Carbohydrates, Lipids, Proteins) among dishes. Caloric value of most dishes comes from an excess of lipids at the expense of carbohydrates.
We also perform a similar analysis for the average diet of the employees. In particular, we first show the distribution of the macro-nutrients’ and overall caloric value of their diet in Figure 11. Then, we compute how many have an unbalanced diet and show the result in Figure 9b, while most of them ( 97.6 % ) get the correct caloric value from proteins, the large part ( 95.5 % ) gets, on average, unbalanced dishes from the canteen. Again, as illustrated in Figure 12 that depicts the unbalance distribution of macros, the unbalance comes from an abundance of fats at the expense of carbohydrates.
Figure 11. Distribution of overall and macro-nutrients’ caloric value of customers’ diet.
Figure 12. Distribution of the unbalance of macro-nutrients of the diet of customers. Unbalance comes from an abundance of lipids at the expense of carbohydrates.

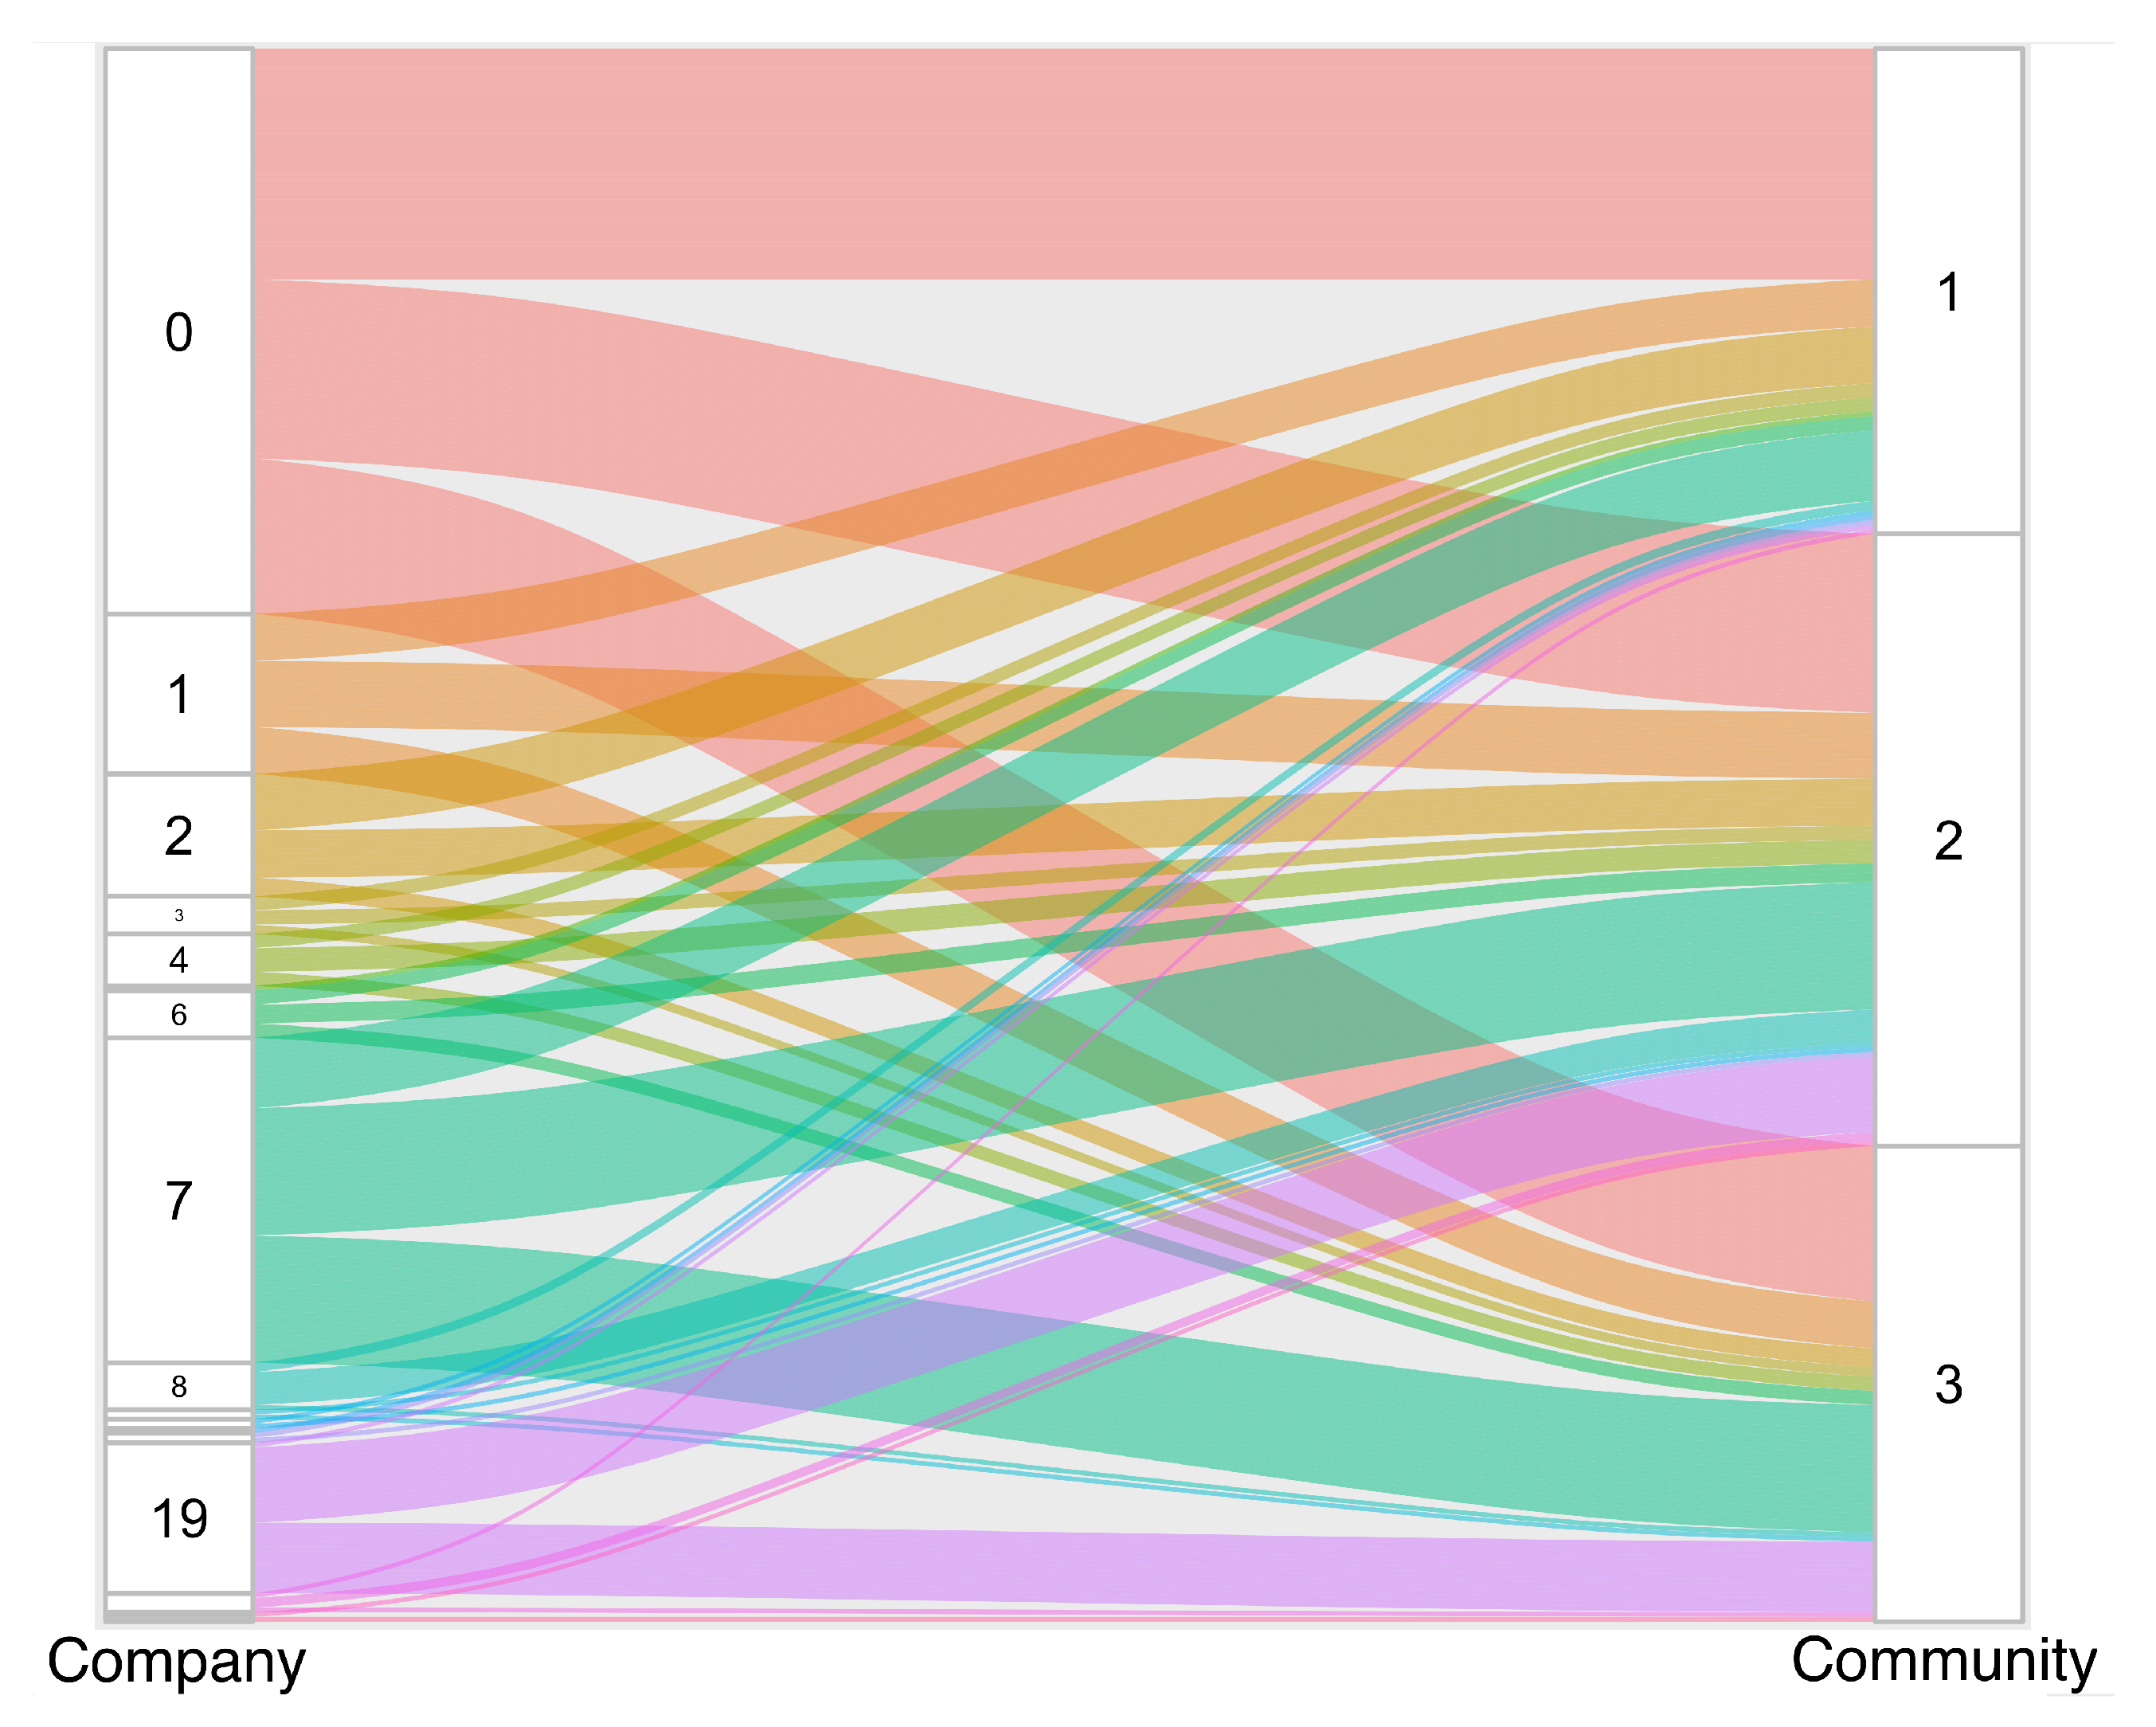
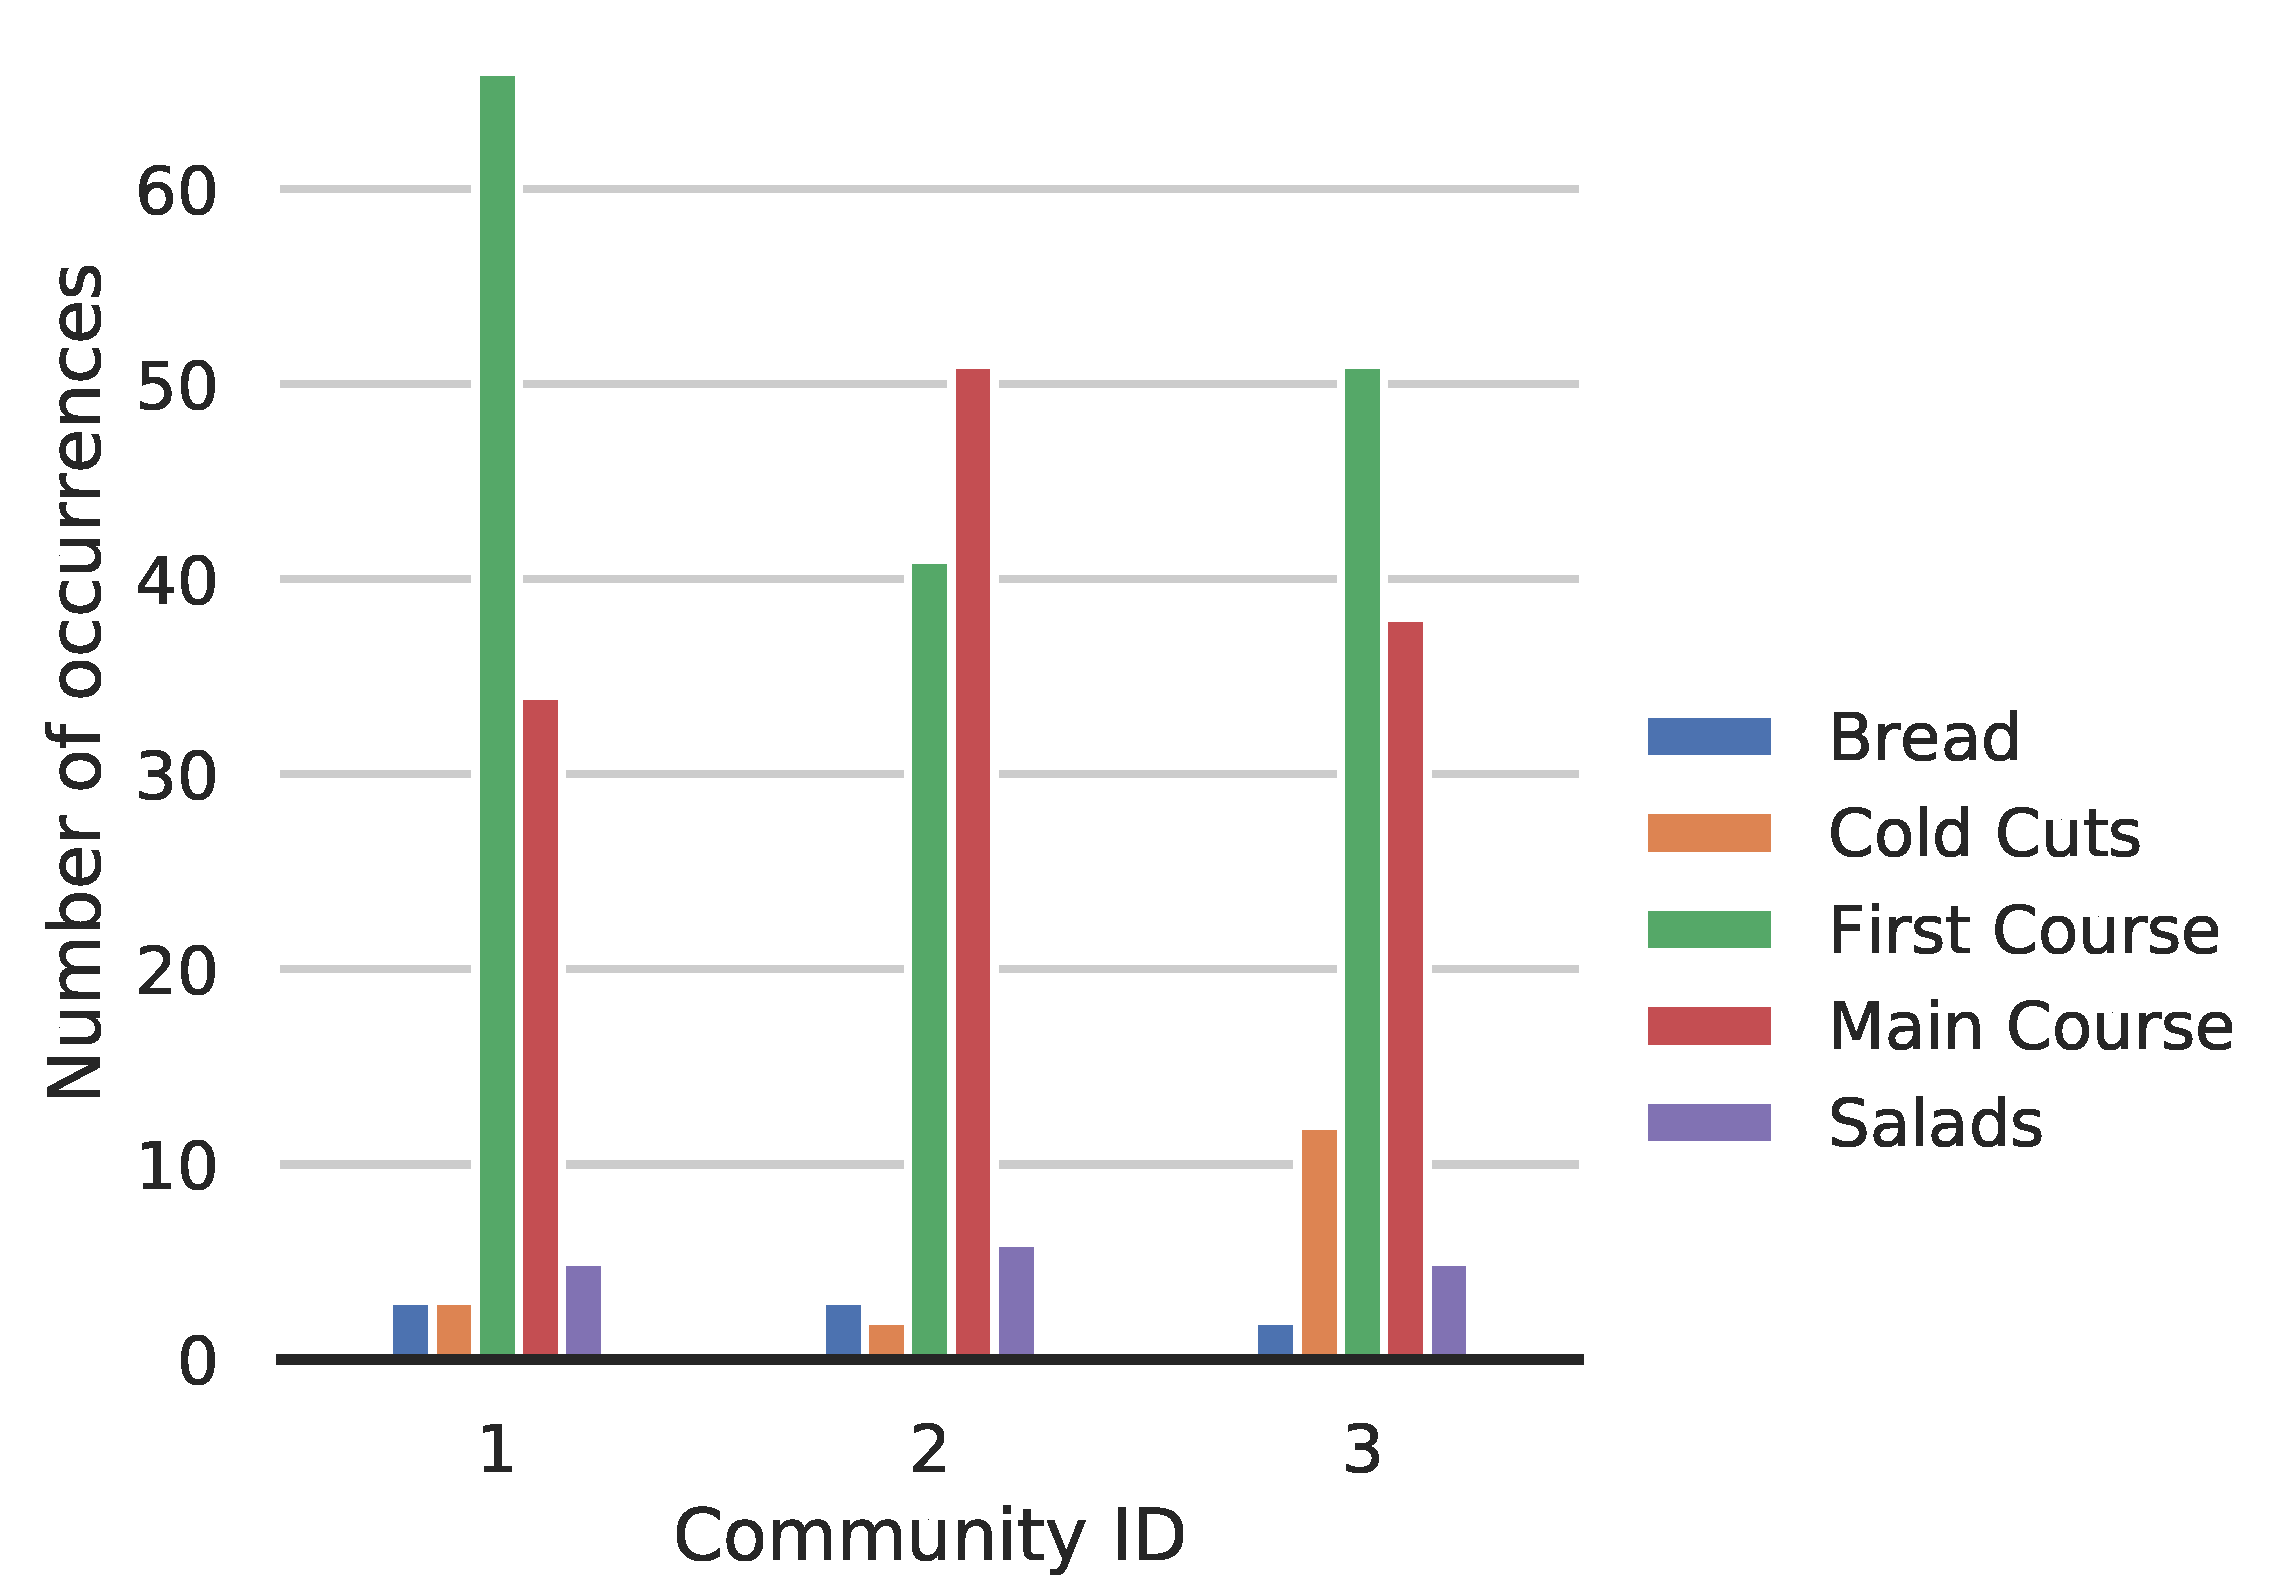
4.3. Understanding the Community Structure of the Canteen Network

We begin this analysis by extracting the bipartite network of the people and the dishes chosen (i.e., People - Dishes modes) from our tripartite dataset. The next step is to build People and Dishes projections of the bipartite networks. In particular, the People network projection is a network where nodes are people and a weighted link between a couple of people represents the number of dishes they have in common. On the other hand, the Dishes network projection is a weighted network of dishes where a link between a couple of dishes takes into account the number of people that have chosen both dishes. We aim at studying the community (or group/cluster) structure of both projections to gain a deeper understanding of the dataset under analysis. A community can be informally defined as a set of densely connected nodes/vertices of the network ([]). For a more detailed introduction to the topic of community in networks, we refer the reader to [].
To uncover the community structure of our networks, we employ the Louvain algorithm [,] variant implemented in Pajek []. Basically, this algorithm performs a greedy optimization of the modularity function [], a measure of the quality of a network partition into communities. Figure 13 reports the communities of people we found with this algorithm. In particular, there are three communities of people, which we indicate by using a numeric identifier in the right side of Figure 13. On the left side of the same figure, we also report the Company (once again identified by a numerical label) people belong to. We can notice that people tend to form cross-company groups. For example, employees of the company with i d = 0 are distributed across the three communities showing that there is not a single common pattern among people of company 0, at least for what concerns their diet. Curiously, employees of the company 19 seem to belong to only two of the three communities, exhibiting a slightly different behavior with respect to the employee of the other companies (this deserves further investigations in future works).
Figure 13. Communities of people. Three communities (identified by a numeric id on the right) were discovered with the Louvain algorithm variant implemented in Pajek [].
In Figure 14 the community structure of the dishes network projection is shown. Also, in this case, we found three communities more or less of the same size. To better understand how dishes are distributed in each community, all dishes are classified in five categories (see Figure 1) and further analysis is performed, whose result is reported in Figure 15. In this figure, communities are analyzed in terms of dish type. It is evident that we can observe a different pattern in each community. For example, in the community 1 “First Course” is the prevalent kind of dishes, while in the community 2 it is “Main Course”. Moreover, the majority of “Cold Cuts” dishes are concentrated in the community 3 which suggests some sort of similarity between them and the other dishes in the same community that is stronger than in the other two communities. Please note that such a kind of similarity is the result of the pattern the employees of the different companies follow in choosing the dishes to eat. It is a sort of “similarity” induced by the people’s choices and not by the similarity among dishes’ ingredients.
Figure 14. Communities of dishes. Three communities (identified by a numeric id on the right) were discovered with the Louvain algorithm variant implemented in Pajek [].
Figure 15. Different category of dishes inside each community.

5. Conclusions

In this work, we presented and discussed a dataset of a multi-company canteen service. We illustrated its main features and relevant results emerged from a first analysis using network-based approach. We believe that several cues come from this analysis and will be considered as future works:
  • to leverage personal information about people eating at the canteen (in addition to those used here), such as sex, age, preferences, medical-health, socio-economic and others, in order to perform more comprehensive analysis;
  • similarly, to exploit detailed nutritional facts about food provided would also enrich the dataset and the knowledge we can extract from it;
  • a temporal analysis would allow predicting users behaviors, assisting in canteen planning and management as well as to establish more sustainable food practices [];
  • the use of machine learning techniques will endorse food recommender systems, for instance for advancing a healthy behavior programme [];
  • to use a system that collects information about people movement causing crowd [,] at the canteen, integrated with data already present, that could influence habits, for instance reducing available time could push easy to take meals.

Author Contributions

The authors contributed equally to this work. All authors have read and agreed to the published version of the manuscript.

Funding

This work has been partially supported by the project of University of Catania PIACERI, PIAno di inCEntivi per la Ricerca di Ateneo.

Institutional Review Board Statement

Not applicable.

Data Availability Statement

The data presented in this study are available on request (by e-mail) from the corresponding author. The data are not publicly available due to corporate internal guidelines.

Acknowledgments

The authors wish to thank the Free Mind Foundry for the dataset.

Conflicts of Interest

The authors declare no conflict of interest.

References

  1. Ni Mhurchu, C.; Aston, L.M.; Jebb, S.A. Effects of worksite health promotion interventions on employee diets: A systematic review. BMC Public Health 2010, 10, 62. [Google Scholar] [CrossRef]
  2. Pridgeon, A.; Whitehead, K. A qualitative study to investigate the drivers and barriers to healthy eating in two public sector workplaces. J. Hum. Nutr. Diet. Off. J. Br. Diet. Assoc. 2012, 26, 85–95. [Google Scholar] [CrossRef]
  3. Ikhioya, G. The workplace: An ideal priority setting for health promotion and disease prevention. Int. J. Innov. Educ. Res. 2018, 6, 108–115. [Google Scholar] [CrossRef]
  4. Jensen, J. Can worksite nutritional interventions improve productivity and firm profitability? A literature review. Perspect. Public Health 2011, 131, 184–192. [Google Scholar] [CrossRef] [PubMed]
  5. Zwetsloot, G.I.; van Scheppingen, A.R.; Dijkman, A.J.; Heinrich, J.; den Besten, H. The organizational benefits of investing in workplace health. Int. J. Workplace Health Manag. 2010, 3, 143–159. [Google Scholar] [CrossRef]
  6. O’Halloran, S.; Eksteen, G.; Gebremariam, M.; Alston, L. Measurement Methods Used to Assess the School Food Environment: A Systematic Review. Int. J. Environ. Res. Public Health 2020, 17, 1623. [Google Scholar] [CrossRef] [PubMed]
  7. Canterberry, M.; Francois, S.; Hattum, T.; Rudov, L.; Carton, T. School Lunch Consumption Among 3 Food Service Providers in New Orleans. J. Sch. Health 2018, 88, 93–100. [Google Scholar] [CrossRef]
  8. Vo, T.; Le, N.; Le, A.T.N.; Tran Minh, N.N.; Nuorti, J.P. Knowledge, attitudes, practices and training needs of food-handlers in large canteens in Southern Vietnam. Food Control 2015, 57, 190–194. [Google Scholar] [CrossRef]
  9. Bonaccio, M.; Di Castelnuovo, A.; Bonanni, A.; Costanzo, S.; De Lucia, F.; Persichillo, M.; Zito, F.; Donati, M.; de Gaetano, G.; Iacoviello, L. Decline of the Mediterranean diet at a time of economic crisis. Results from the Moli-sani study. Nutr. Metab. Cardiovasc. Dis. 2014, 24, 853–860. [Google Scholar] [CrossRef] [PubMed]
  10. Jaworowska, A.; Blackham, T.; Davies, I.; Stevenson, L. Nutritional challenges and health implications of takeaway and fast food. Nutr. Rev. 2013, 71, 310–318. [Google Scholar] [CrossRef]
  11. Vasiljevic, M.; Cartwright, E.; Pechey, R.; Hollands, G.J.; Couturier, D.L.; Jebb, S.A.; Marteau, T.M. Physical micro-environment interventions for healthier eating in the workplace: Protocol for a stepped wedge randomised controlled pilot trial. Pilot Feasibility Stud. 2017, 3, 27. [Google Scholar] [CrossRef]
  12. Hyseni, L.; Atkinson, M.; Bromley, H.; Orton, L.; Lloyd-Williams, F.; Mcgill, R.; Capewell, S. The effects of policy actions to improve population dietary patterns and prevent diet-related non-communicable diseases: Scoping review. Eur. J. Clin. Nutr. 2016, 71, 694–711. [Google Scholar] [CrossRef]
  13. Lassen, A.D.; Ernst, L.; Poulsen, S.; Andersen, K.K.; Hansen, G.L.; Biltoft-Jensen, A.; Tetens, I. Effectiveness of a Canteen Take Away concept in promoting healthy eating patterns among employees. Public Health Nutr. 2012, 15, 452–458. [Google Scholar] [CrossRef]
  14. Orfanos, P.; Naska, A.; Trichopoulos, D.; Slimani, N.; Ferrari, P.; Van Bakel, M.; Deharveng, G.; Overvad, K.; Tjønnel, A.; Halkjær, J.; et al. Eating out of home and its correlates in 10 European countries. The European Prospective Investigation into Cancer and Nutrition (EPIC) study. Public Health Nutr. 2007, 10, 1515–1525. [Google Scholar] [CrossRef]
  15. Kraak, V.; Rincon-Gallardo Patino, S.; Renukuntla, D.; Kim, E. Progress Evaluation for Transnational Restaurant Chains to Reformulate Products and Standardize Portions to Meet Healthy Dietary Guidelines and Reduce Obesity and Non-Communicable Disease Risks, 2000-2018: A Scoping and Systematic Review to Inform Policy. Int. J. Environ. Res. Public Health 2019, 16, 2732. [Google Scholar] [CrossRef] [PubMed]
  16. Filimonau, V.; Krivcova, M.; Pettit, F. An exploratory study of managerial approaches to food waste mitigation in coffee shops. Int. J. Hosp. Manag. 2019, 76, 48–57. [Google Scholar] [CrossRef]
  17. Berkowitz, S.; Marquart, L.; Mykerezi, E.; Degeneffe, D.; Reicks, M. Reduced-portion entrees in a worksite and restaurant setting: Impact on food consumption and waste. Public Health Nutr. 2016, 19, 3048–3054. [Google Scholar] [CrossRef] [PubMed]
  18. Lorenz-Walther, B.A.S.; Langen, N. Sustainable changes in a worksite canteen: An exploratory study on the acceptance of guests. J. Clean. Prod. 2020, 259, 120737. [Google Scholar] [CrossRef]
  19. Keys, A.; Mienotti, A.; Karvonen, M.; Aravanis, C.; Blackburn, H.; Buzina, R.; Djordjevic, B.; Dontas, A.; Fidanza, F.; Keys, M.; et al. The diet and 15-year death rate in the seven countries study. Am. J. Epidemiol. 1986, 124, 903–915. [Google Scholar] [CrossRef] [PubMed]
  20. Lachat, C.; Huybregts, L.; Roberfroid, D.; Camp, J.; Winter, A.M.; Debruyne, P.; Kolsteren, P. Nutritional profile of foods offered and consumed in a Belgian university canteen. Public Health Nutr. 2008, 12, 122–128. [Google Scholar] [CrossRef] [PubMed]
  21. Lassen, A.D.; Knuthsen, P.; Bysted, A.; Andersen, E.W. The Nutritional Quality of Lunch Meals Eaten at Danish Worksites. Nutrients 2018, 10, 1518. [Google Scholar] [CrossRef]
  22. Alves, L.G.; Mangioni, G.; Cingolani, I.; Rodrigues, F.A.; Panzarasa, P.; Moreno, Y. The nested structural organization of the worldwide trade multi-layer network. Sci. Rep. 2019, 9, 1–14. [Google Scholar] [CrossRef]
  23. Alves, L.G.; Mangioni, G.; Rodrigues, F.A.; Panzarasa, P.; Moreno, Y. Unfolding the complexity of the global value chain: Strength and entropy in the single-layer, multiplex, and multi-layer international trade networks. Entropy 2018, 20, 909. [Google Scholar] [CrossRef]
  24. Mangioni, G.; Jurman, G.; DeDomenico, M. Multilayer flows in molecular networks identify biological modules in the human proteome. IEEE Trans. Netw. Sci. Eng. 2018, 7, 411–420. [Google Scholar] [CrossRef]
  25. Fagiolo, G.; Mastrorillo, M. International migration network: Topology and modeling. Phys. Rev. E 2013, 88, 012812. [Google Scholar] [CrossRef] [PubMed]
  26. Min, W.; Jiang, S.; Liu, L.; Rui, Y.; Jain, R. A Survey on Food Computing. ACM Comput. Surv. 2019, 52, 1–36. [Google Scholar] [CrossRef]
  27. Czarniecka-Skubina, E.; Górska-Warsewicz, H.; Trafiałek, J. Attitudes and Consumer Behavior toward Foods Offered in Staff Canteens. Int. J. Environ. Res. Public Health 2020, 17, 6239. [Google Scholar] [CrossRef]
  28. Bandoni, D.H.; Sarno, F.; Jaime, P.C. Impact of an intervention on the availability and consumption of fruits and vegetables in the workplace. Public Health Nutr. 2011, 14, 975–981. [Google Scholar] [CrossRef]
  29. Steyn, N.; Parker, W.; Lambert, E.; Mchiza, Z. Nutrition interventions in the workplace: Evidence of best practice. S. Afr. J. Clin. Nutr. 2009, 22, 111–117. [Google Scholar] [CrossRef]
  30. Thorsen, A.V.; Lassen, A.D.; Andersen, J.S.; Mikkelsen, B.E. Workforce gender, company size and corporate financial support are predictors of availability of healthy meals in Danish worksite canteens. Public Health Nutr. 2009, 12, 2068–2073. [Google Scholar] [CrossRef]
  31. Price, S.; Hartwell, H.; Hemingway, A.; Chapleo, C. Workplace foodservice; perception of quality and trust. Appetite 2016, 97, 169–175. [Google Scholar] [CrossRef]
  32. Lytle, L.A.; Sokol, R.L. Measures of the food environment: A systematic review of the field, 2007–2015. Health Place 2017, 44, 18–34. [Google Scholar] [CrossRef]
  33. Breathnach, S.; Llewellyn, C.H.; Koutoukidis, D.A.; van Rugge, C.R.; Sutherland, A.; Lally, P. Experience of Using an Online Pre-Ordering System for A Workplace Canteen That Offers Lower-Energy Swaps: A Think-Aloud Study. Nutrients 2020, 12, 3878. [Google Scholar] [CrossRef]
  34. Kim, W.G.; Choi, I.; Yoon, J. Nutritional quality of lunches consumed by Korean workers: Comparison between institutional and commercial lunches. Nutr. Res. Pract. 2016, 10, 606. [Google Scholar] [CrossRef]
  35. Jarlenski, M.; Wolfson, J.; Bleich, S. Macronutrient Composition of Menu Offerings in Fast Food Restaurants in the U.S. Am. J. Prev. Med. 2016, 51, e91–e97. [Google Scholar] [CrossRef]
  36. Vitale, M.; Bianchi, M.; Rapetti, V.; Pepe, J.; Giacco, A.; Giacco, R.; Riccardi, G. A nutritional intervention programme at a worksite canteen to promote a healthful inspired by the traditional Mediterranean diet. Int. J. Food Sci. Nutr. 2017, 69, 1–8. [Google Scholar] [CrossRef] [PubMed]
  37. Antonelli, M.; Dembska, K.; Fattibene, D.; Principato, L.; Recanati, F. Italy and Food; Technical Report; Barilla Foundation: Parma, Italy, 2019. [Google Scholar]
  38. Crockett, R.; King, S.; Marteau, T.; Prevost, A.; Bignardi, G.; Roberts, N.; Stubbs, B.; Hollands, G.; Jebb, S. Nutritional labelling for healthier food or non-alcoholic drink purchasing and consumption. Cochrane Database Syst. Rev. 2018, 2018. [Google Scholar] [CrossRef] [PubMed]
  39. González-GarcÃa, S.; Esteve-Llorens, X.; Moreira, M.; Feijoo, G. Carbon footprint and nutritional quality of different human dietary choices. Sci. Total Environ. 2018, 644, 77–94. [Google Scholar] [CrossRef]
  40. Carchiolo, V.; Longheu, A.; Barbera, S.; Di Tommaso, P. Personalized wellness in smart offices. In Proceedings of the IADIS International Conference Applied Computing 2019, Cagliari, Italy, 28 June 2019; pp. 97–104. [Google Scholar]
  41. Wikipedia. Italian Meal Structure. 2021. Available online: https://en.wikipedia.org/wiki/Italian_meal_structure (accessed on 30 January 2021).
  42. Whitney, E.N.; Rolfes, S.R. Understanding Nutrition; Wadsworth, Cengage Learning: North Ryde, Australia, 2013. [Google Scholar]
  43. Wikipedia. Fundamentals of Human Nutrition/Average Macronutrient Distribution Range. 2020. Available online: https://en.wikibooks.org/wiki/Fundamentals_of_Human_Nutrition/Average_Macronutrient_Distribution_Range (accessed on 30 January 2021).
  44. Nicosia, V.; Mangioni, G.; Carchiolo, V.; Malgeri, M. Extending the definition of modularity to directed graphs with overlapping communities. J. Stat. Mech. Theory Exp. 2009, 2009, P03024. [Google Scholar] [CrossRef]
  45. Fortunato, S.; Castellano, C. Community Structure in Graphs. arXiv 2007, arXiv:0712.2716. [Google Scholar]
  46. Blondel, V.D.; Guillaume, J.L.; Lambiotte, R.; Lefebvre, E. Fast unfolding of communities in large networks. J. Stat. Mech. Theory Exp. 2008, 2008, 10008. [Google Scholar] [CrossRef]
  47. Carchiolo, V.; Longheu, A.; Malgeri, M.; Mangioni, G. Communities unfolding in multislice networks. In Complex Networks; Springer: Berlin/Heidelberg, Germany, 2011; pp. 187–195. [Google Scholar]
  48. Batagelj, V.; Mrvar, A. Pajek-program for large Network analysis. Connect 1998, 21, 47–57. [Google Scholar]
  49. Newman, M.E.J. Modularity and community structure in networks. Proc. Natl. Acad. Sci. USA 2006, 103, 8577. [Google Scholar] [CrossRef] [PubMed]
  50. Reisch, L.; Eberle, U.; Lorek, S. Sustainable Food Consumption: An Overview of Contemporary Issues and Policies. Sustain. Sci. Pract. Policy 2013, 9, 7–25. [Google Scholar] [CrossRef]
  51. Kahn-Marshall, J.L.; Gallant, M.P. Making Healthy Behaviors the Easy Choice for Employees: A Review of the Literature on Environmental and Policy Changes in Worksite Health Promotion. Health Educ. Behav. 2012, 39, 752–776. [Google Scholar] [CrossRef] [PubMed]
  52. Casadei, R.; Fortino, G.; Pianini, D.; Russo, W.; Savaglio, C.; Viroli, M. Modelling and simulation of Opportunistic IoT Services with Aggregate Computing. Future Gener. Comput. Syst. 2019, 91, 252–262. [Google Scholar] [CrossRef]
  53. Loria, M.P.; Toja, M.; Carchiolo, V.; Malgeri, M. An efficient real-time architecture for collecting IoT data. In Proceedings of the 2017 Federated Conference on Computer Science and Information Systems (FedCSIS), Prague, Czech Republic, 3–6 September 2017; pp. 1157–1166. [Google Scholar] [CrossRef]
Publisher’s Note: MDPI stays neutral with regard to jurisdictional claims in published maps and institutional affiliations.

Article Metrics

Citations

Article Access Statistics

Multiple requests from the same IP address are counted as one view.