Abstract
The EN 1793-5 and EN 1793-6 standards have been in use for many years as a method for measuring the intrinsic characteristics of noise barriers installed along highways and railways. They require a sound source and a grid of microphones, to be placed near the barrier and in free field conditions, according to predetermined distances. In principle, small errors in positioning the sound source and microphone grid may affect the results obtained. An international round-robin test was carried out in 2012 to evaluate the repeatability and reproducibility of the method, but until now no studies have been carried out to evaluate and compare the repeatability of laboratory versus in-place measurements performed with the same equipment and its variance when an imperfect positioning of sound source and microphones is taken into account. In the present work, multiple series of sound reflection index and sound insulation index measurements performed on noise barriers of the same kind installed in the laboratory or along a highway are presented. The measurements were repeated in different ways: (1) in the laboratory, leaving the source and microphones unmoved to assess the repeatability of the results and of the measurement system under controlled conditions; (2) in the laboratory, repositioning for each measurement the source and microphone grid to assess the robustness of the method under real conditions but in a controlled environment; (3) in situ, along a highway open to traffic, repositioning for each measurement the source and microphone grid to assess the repeatability of the method under real conditions in a critical environment. In both reflection index and sound insulation index measurements, the standard deviation on single-number ratings in all cases examined is well below the value presented in EN 1793-5 and EN 1793-6, which was obtained from statistical analysis of the international round-robin test performed a dozen years ago, suggesting that expert operators with state-of-the art equipment can achieve much better results now.
1. Introduction
Noise is one of the most pervasive pollution factors affecting the environment and quality of life. It can also have adverse effects on human health [1,2]. In order to mitigate these effects, noise barriers are often built along roads and railways. In recent years, measurement of the intrinsic insulation and reflection characteristics of noise barriers installed along highways and railways has become a common practice. In the European Union, this measurement is conducted using the European standards EN 1793-5 [3] and EN 1793-6 [4], also known as the Adrienne method. This type of measurement provides an evaluation of the installed product in use and is therefore very advantageous compared to laboratory methods requiring one to place the barrier being tested in reverberation rooms. In principle, it could also be applied to innovative barriers, such as sonic crystals [5], even though some care may be required, as explained in [6]. The incident sound field on installed barriers is generated by vehicular or rail traffic and is stronger at a shorter distance (i.e., near normal incidence). The Adrienne method also involves measuring at normal incidence. Before the advent of this methodology, the absorbing and insulating materials used in noise barriers were tested in reverberation rooms under a diffuse sound field, thus obtaining results that were not fully comparable to the real use case (unless the noise reducing device is placed inside a tunnel or a deep trench). In situ measurement also makes it possible to assess any degradation in the sound performance of the barrier by taking repeated measurements over time. It is also possible to detect installation defects or material inhomogeneities by measuring at different points of the barrier.
The Adrienne measurement system is innovative in several aspects. It is described in more detail in Section 2.3, but it is useful to note here that it requires the use of an artificial sound source (amplified loudspeaker box), a square grid of nine microphones, and instrumentation for the generation and acquisition of impulse responses, reflected and transmitted by the barrier (i.e., computer, multi-channel audio interface, and microphone preamplifiers; see Figure 1 and Figure 2 below). The post-processing requires intensive operations on impulse responses and on their Fourier-transforms, so it is implemented in specific software, assuming a perfect positioning of the sound source and microphone grid. Therefore, the repeatability and reproducibility of the whole procedure needed to be assessed. To provide a first answer, an international round-robin test was carried out in 2012 [7], from which the basic statistical information regarding the method was obtained and then included in EN 1793-5 and EN 1793-6. However, until now no studies have been carried out to evaluate and compare the repeatability of laboratory versus in situ measurements performed with the same equipment (software included) and its variance when an imperfect positioning of sound source and microphones is taken into account. The aim of the present research is to provide a clear answer to this question and thus increase the confidence in the method and promote its wider use, including its use outside of Europe.
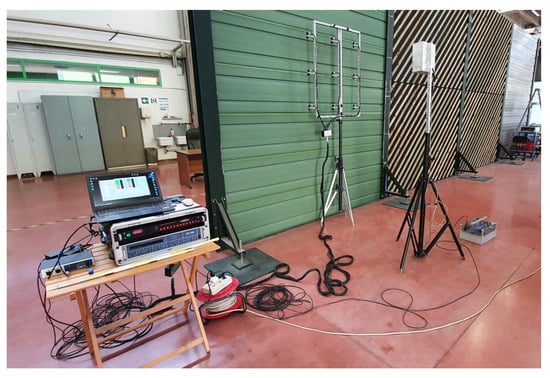
Figure 1.
Laboratory measurement of sound reflection index according to the EN 1793-5 standard.
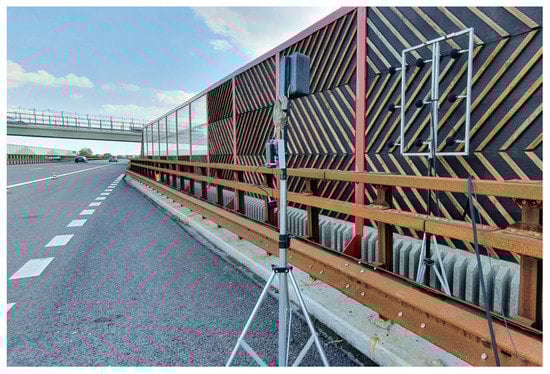
Figure 2.
In situ measurement of sound reflection index according to the EN 1793-5 standard.
This article is organized as follows. In Section 2, the measurement methods for sound absorption and sound insulation are described (Section 2.1 and Section 2.2). It should be noted that the measurement system tested in this study was included in the international round-robin test [7] and therefore fully meets the specifications of the method; it is presented in Section 2.3. In Section 3, the measurements performed are presented. For both sound reflection index and sound insulation index measurements, the same scheme is applied: (i) repeated measurements in the laboratory on the same acoustic barrier, leaving the sound source and microphone grid in place; (ii) repeated measurements in the laboratory on the same acoustic barriers, repositioning the movable components (i.e., loudspeaker and microphone grid) for each measurement; (iii) repeated measurements along a highway under real-world conditions on the same acoustic barriers, repositioning the movable components (i.e., loudspeaker and microphone grid) for each measurement. Section 4 presents a discussion on the obtained results, with comparison plots and tables, and finally, Section 5 summarizes the main conclusions.
2. Materials and Methods
In this section, the Adrienne measurement method for measuring the sound absorption and sound insulation of a noise barrier and the equipment used for measurement are described.
Figure 1 and Figure 2 show the used Adrienne measurement system, inside the laboratory and along a highway, respectively.
This study has the purpose of evaluating the following:
- the repeatability of the measurement system in the laboratory, applied to a full-scale barrier, obtained by comparing repeated measurements on the same acoustic barrier under the same boundary conditions, leaving the sound source and microphone grid in place;
- the repeatability of the measurement method in the laboratory, comparing repeated measurements on the same noise barriers and repositioning the movable components (i.e., loudspeaker and microphone grid) for each measurement;
- the repeatability of the measurement method applied on a barrier mounted along a highway under real-world conditions, repositioning the movable components for each measurement.
2.1. Sound Absorption Measurement
The standard EN 1793-5 [3] prescribes the measurement of sound reflected by the noise barrier (sound reflection index, RI). The sound absorption characteristics of the barrier can be obtained in a complementary way from the previous parameter.
Two separate measurements are conducted, maintaining the same geometric configuration between the sound source and microphone grid: the first is a free-field measurement, as shown in Figure 3a and Figure 4, in which the sound source and microphone grid are placed in an obstacle-free area, at a relative distance of 1.25 m; in the second measurement, the microphone grid is placed in front of the barrier, as shown in Figure 3b or Figure 1 and Figure 2, in which the distance between the sound source and microphone grid is the same as in the previous case and the distance between the microphone grid and the barrier reference surface is 0.25 m. The height of the speaker and the center of the microphone grid were at a height of 2 m (half the height of the barrier) for all measurements. For both positions, nine impulse responses, measured from each grid microphone, are acquired. The impulse responses from the free-field measurement are appropriately windowed and used to obtain the power spectra of the system in the absence of the barrier. The impulse responses from the measurement in front of the barrier are windowed to obtain the power spectra of the reflected sound from the barrier only. Prior to the computation on the reflected responses, a time domain subtraction is performed between the two sets of impulse responses to remove the tail of the direct responses from the reflected responses [8].
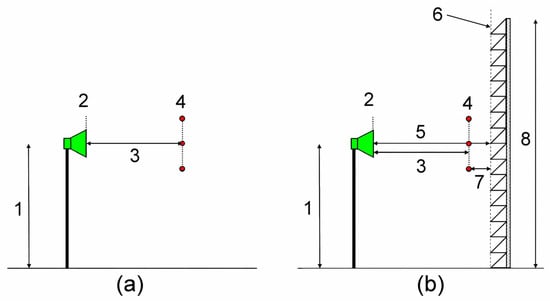
Figure 3.
Schematic diagram of the positioning of sound source (in green) and microphone grid (in red) for the measurement of sound reflection index according to EN 1793-5: (a) free-field measurement; (b) measurement in front of barrier; 1: height of source hS = hB/2; 2: front surface of sound source; 3: distance between sound source and microphone grid, dSM = 1.25 m; 4: microphone grid; 5: distance between sound source and barrier reference surface dS = 1.5 m; 6: barrier reference surface; 7: microphone grid-reference surface distance dM = 0.25 m; 8: barrier height hB.
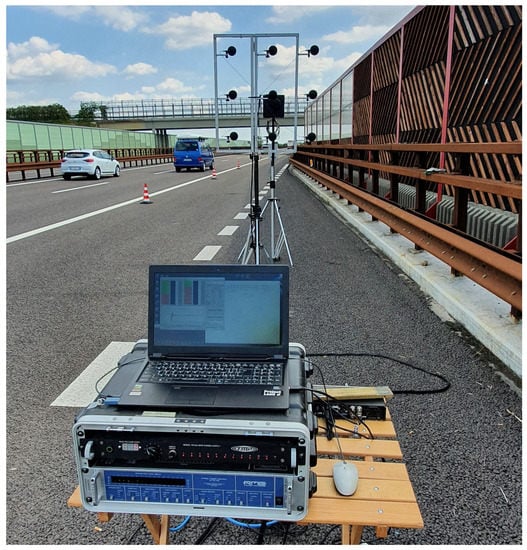
Figure 4.
In situ measurement of sound reflection index according to the EN 1793-5 standard: free-field measurement (front view) and measurement system.
The reflection index is calculated according to Equation (1), in 1/3 octave bands:
where:
- hi,k(t) is the incoming free-field reference impulse response component from the k-th microphone;
- hr,k(t) is the reflected impulse response component, at the k-th microphone;
- wi,k(t) is the Adrienne time window [3] for the incident reference component of the free-field impulse response, at the k-th microphone;
- wr,k(t) is the Adrienne time window for the reflected component, at the k-th microphone;
- F is the symbol for the FFT operator;
- j is the index of the 1/3 octave frequency bands, from 100 Hz to 5 kHz;
- Δfj is the width of the j-th 1/3 octave frequency band;
- k is the number of the microphone, from 1 to 9;
- nj is the number of microphone positions on which to average;
- Cgeo,k is a geometrical divergence correction factor, to compensate the direct and reflected waves path difference, at the k-th microphone;
- Cdir,k (Δfj) is a loudspeaker directivity correction factor, at the k-th microphone;
- Cgain,k (Δfj) is a gain mismatch correction factor, used to correct errors in amplification settings between the free-field and barrier measurements, if required, at the k-th microphone.
From the reflection index, represented in 1/3-octave bands, it is then possible to calculate a single number in dB called the single-number rating of sound reflection DLRI, computed by weighing the individual bands of the reflection index according to the traffic-normalized spectrum defined in EN 1793-3, to get an overall indication of the performance of the barrier [3]. A more detailed description of the measurement procedure and calculations can be found in [3,7], or references [9,10,11,12].
2.2. Sound Insulation Measurement
The measurement of the sound insulation characteristics of the barrier (sound insulation index, SI), described in EN 1793-6 [4], is carried out in a similar way to the previous case, with a free-field measurement and a measurement across the barrier (i.e., placing the sound source on the street side), at a distance of 1.0 m from the active surface of the barrier, and the microphone grid on the opposite side, 0.25 m from the rear active surface, as shown in Figure 5 and Figure 6. In this case, when making the free-field measurement, the thickness of the barrier must also be added to the distance of 1.0 + 0.25 m to maintain the same distances between the sound source and microphone grid in the two measurements. The height of the speaker and the center of the microphone grid were at the height of 2 m (half the height of the barrier) for all measurements.
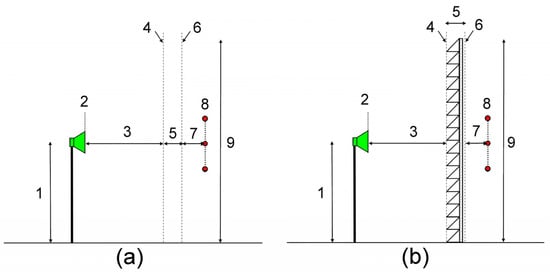
Figure 5.
Schematic diagram of sound source placement (in green) and microphone grid (in red) for sound insulation index measurement according to EN 1793-6 standard: (a) free-field measurement; (b) measurement on the barrier; 1: sound source height hS = hB/2; 2: sound source front; 3: sound source-reference surface distance dS = 1 m; 4: barrier reference surface; 5: barrier thickness; 6: backside barrier reference surface; 7: microphone grid—backside reference surface distance dM = 0.25 m; 8: microphone grid; 9: barrier height hB.
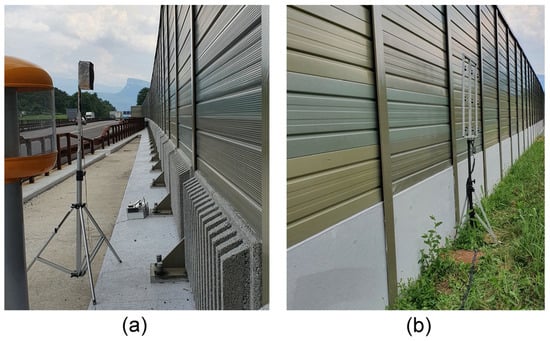
Figure 6.
In situ measurement of sound insulation index according to the EN 1793-6 standard: (a) sound source placed on the road side of the barrier; (b) microphone grid placed at the rear of the barrier, matching the source.
The sound insulation index is calculated according to Equation (2), in 1/3 octave bands:
where:
- ht,k(t) is the transmitted impulse response component, at the k-th microphone;
- wt,k(t) is the Adrienne time window for the transmitted component, at the k-th microphone;
- n = the number of microphones on the grid.
In addition, for this measurement, from the sound insulation index, represented in 1/3-octave bands, it is possible to calculate a dB single-number rating, DLSI, calculated by weighing the individual bands of the reflection index according to the normalized traffic spectrum defined in EN 1793-3, to get an overall indication of the sound insulation performance of the barrier, if necessary differentiating measurements on posts from those on barrier elements [4]. A more detailed description of the measurement procedure and calculations can be found in [4,7,10,12].
2.3. Measuring System
The measurement system used for this study, shown in Figure 1 and Figure 4, consists of the following components:
- sound source based on Sica Z002601 loudspeaker (120 W, 8 Ω), amplified by an ST CCA044V1 class-D amplifier, as described in detail in [8], connected to the output of the sound card by an Andoer MX5 2.4G wireless system (uncompressed digital audio data transmission, sampled at 48 kHz), to make it easier to measure the sound insulation behind the barrier without cable problems;
- microphones model PCB 130F20 and IEPE/ICP preamplifier TMP PS12A;
- RME M-16 AD multichannel ADC converter, connected by MADI protocol (over a single coaxial cable) to a MADI digital audio interface RME MADIface XT;
- Projectlead Traveller Pro 2.0 computer;
- MCIRMS measurement software, designed and programmed specifically for this type of measurement.
The impulse responses measured at the nine microphones are obtained using the MLS (maximum length sequence) method (see references from [13,14,15,16,17,18,19,20,21,22,23]), implemented in the MCIRMS measurement and computation software. The MLS signal was chosen and preferred, over other signal types such as ESS (exponential swept-sine), because of its robustness to impulsive and traffic noise, typical of the measurement environment along highways or railways [21]. Signals sampled at a frequency of 44.1 kHz of length 256K and four averages were used for each measurement, so as to obtain an excellent signal-to-noise ratio [17,19,20]. More details on the signal-to-noise ratio of the measurement system can be found in [12]. It should be noted that the mathematical cyclicity properties of the MLS signal allow for perfect software compensation of latencies due to the sound card, software drivers, and digital signal transmission system to the loudspeaker.
3. Repeatability Tests
Tests of measurement repeatability were performed in laboratory and in situ. In particular, the following tests, performed over 10 repeated measurements, are presented:
- sound reflection index and sound insulation index measurements in the laboratory on a non-flat wooden barrier, visible in Figure 1, leaving sound source and microphone grid in place (i.e., without moving them from one measurement to the other; test of measurement system repeatability), with a single free-field measurement being used for all measurements on the barrier;
- measurements of sound reflection index and sound insulation index in the laboratory on the same non-flat wooden barrier as in the previous case, visible in Figure 1, repositioning the movable components (i.e., sound source and microphone grid) randomly within ±50 mm from the nominal position (marked on the floor) for each measurement (test of repeatability of measurement method on non-flat barrier);
- measurements of sound reflection index and sound insulation index in laboratory on a perforated flat-surface metal barrier, visible in Figure 1 (colored green), repositioning the movable components (i.e., sound source and microphone grid) randomly within ±50 mm from the nominal position (marked on the floor) for each measurement (test of repeatability of measurement method on flat barrier);
- measurements of sound reflection index and sound insulation index in situ, along the A22 Brennero highway near Verona (Italy), on a wooden barrier with a non-flat surface and concrete base, visible in Figure 2, repositioning the movable components (i.e., sound source and microphone grid) for each measurement (test of repeatability of the measurement method on a non-flat barrier and in real conditions). The main reasons for the in situ positioning problems are uneven ground, presence of obstacles on the ground, guardrails, uneven asphalt, ground with plants, and ground that is not flat. Note that this barrier has different acoustic characteristics from the wooden one tested in laboratory.
All measurements of sound reflection index and sound insulation index as well as single-number ratings are analyzed from 200 Hz to 5000 Hz, because according to [3,4] the available active surface area allows reliable results to be obtained starting from the 200 Hz 1/3 frequency band. Keeping the instrumentation in place, the measurement sessions lasted about 1 h for each type of measurement and barrier. Repositioning the instrumentation, the measurement sessions, both in the laboratory and in situ, lasted about 1.5 h for each type of measurement.
3.1. Sound Reflection Measurements
Figure 7a shows the results of 10 repeated laboratory measurements of reflection index on the non-flat wooden barrier visible in Figure 1, made while keeping the sound source and microphone grid in place. This assessed the repeatability of the measurement system itself. Figure 7b shows the DLRI 200–5000 Hz values of the 10 measurements. The standard deviation values of these measurements are shown in Figure 15 (blue line). It is observed that the highest standard deviation occurs at the lower and upper extremes of the analyzed frequency range, although they are very low values. The DLRI 200–5000 Hz values of the 10 measurements are almost identical as well, with differences of fractions of a dB: the mean value of the DLRI 200–5000 Hz values is 5.51 dB with a standard deviation of 0.01 dB.
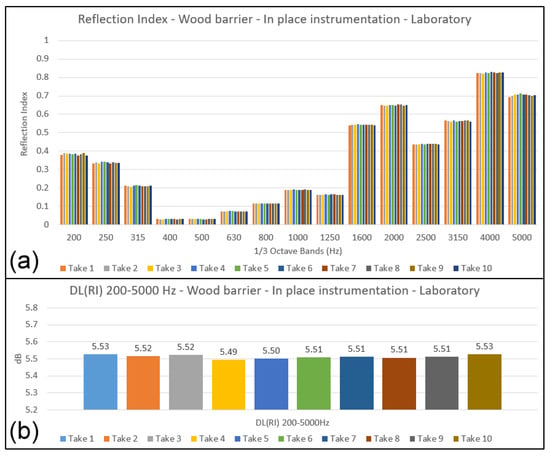
Figure 7.
Sound reflection index—repeated laboratory measurements on non-flat wooden barrier, keeping the sound source and microphone grid in place: (a) sound reflection index; (b) DLRI 200–5000 Hz from the 10 measurements.
Figure 8a shows the results of 10 repeated laboratory measurements of sound reflection index on the non-flat wooden barrier visible in Figure 1, made by moving and repositioning the sound source and microphone grid at each measurement. Figure 8b shows the DLRI 200–5000 Hz values of the 10 measurements. The standard deviation values of these measurements are shown in Figure 15 (orange line). It can be seen in Figure 8a that the sound reflection index results have some differences between them, due to the small positioning errors of the instrumentation. The standard deviation, shown in Figure 15, is clearly larger than in the case of Figure 7, and larger values are observed in the high-frequency bands, probably accentuated by the non-flat surface of the barrier. The DLRI 200–5000 Hz values of the 10 measurements show greater variations than in the previous case, although they are small: the average value of the DLRI 200–5000 Hz values is 5.55 dB, with a standard deviation of 0.12 dB.
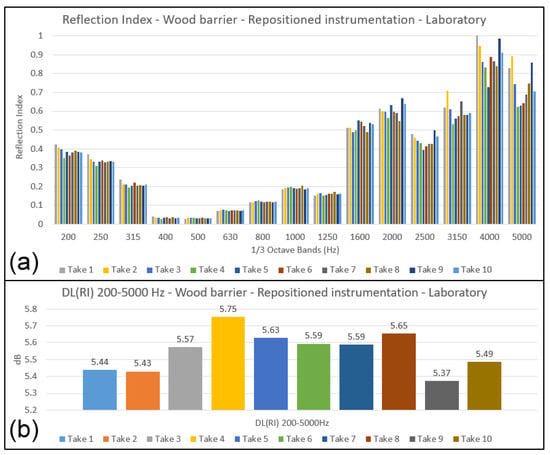
Figure 8.
Sound reflection index—repeated laboratory measurements on non-flat wooden barrier, repositioning the sound source and microphone grid for each measurement: (a) sound reflection index; (b) DLRI 200–5000 Hz from the 10 measurements.
Figure 9a shows the results of 10 repeated measurements of sound reflection index in the laboratory on the flat metal barrier visible in Figure 1, colored green, made by moving and repositioning the sound source and microphone grid at each measurement. Figure 9b shows the DLRI 200–5000 Hz values of the 10 measurements. In Figure 15, the standard deviation values of these measurements are shown (gray line). It can be observed that the standard deviation values, at the mid and high frequencies, are lower than in the case of the non-flat barrier, confirming that these are due to the diffraction of sound waves on the non-flat surface, which are highly dependent on the position of the microphone grid. The mean value of DLRI 200–5000 Hz values is 8.29 dB, with a standard deviation of 0.12 dB.
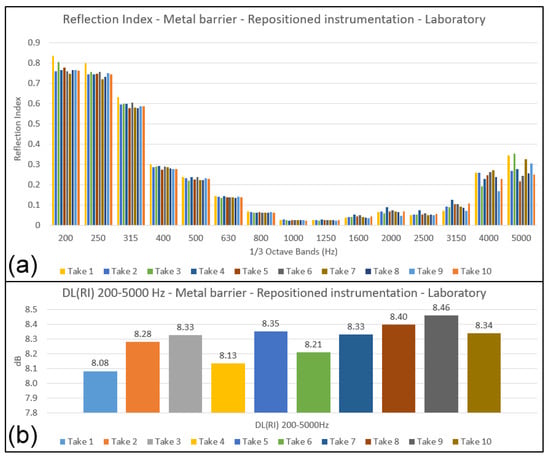
Figure 9.
Sound reflection index—repeated measurements in laboratory on flat metal barrier, repositioning the sound source and microphone grid for each measurement: (a) sound reflection index; (b) DLRI 200–5000 Hz from the 10 measurements.
Figure 10a shows the results of 10 in situ repeated sound reflection index measurements on the non-flat wooden barrier visible in Figure 2 and Figure 4, made along the A22 Brennero highway, moving and repositioning the sound source and microphone grid at each measurement. In Figure 15, the standard deviation values of these measurements are shown (yellow line); it can be seen that the values are significantly higher than in previous cases. This is due to the greater difficulties in positioning the equipment in situ compared to laboratory measurements due to possible uneven ground conditions, the presence of background noise from vehicular traffic, and aerodynamic wind noise on the microphones caused by the fast passage of vehicles along the highway. In this case, the average of DLRI 200–5000 Hz values, shown in Figure 10b, is 5.44 dB, with a standard deviation of 0.20 dB.
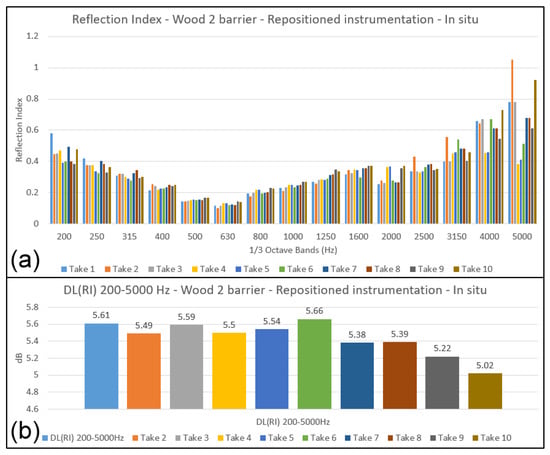
Figure 10.
Sound reflection index—repeated in situ measurements on non-flat wooden barrier and concrete base, repositioning the sound source and microphone grid for each measurement: (a) sound reflection index; (b) DLRI 200–5000 Hz from the 10 measurements.
3.2. Sound Insulation Measurements
Figure 11a shows the results of 10 repeated measurements of sound insulation index in the laboratory on the non-flat wooden barrier visible in Figure 1, made while keeping the sound source and microphone grid in place. Figure 11b shows the DLSI 200–5000 Hz values of the 10 measurements. In Figure 16, the standard deviation values of these measurements are shown (blue line). It should be noted that in the case of SI measurements, the results are expressed in dB, and this should be taken into account when analyzing these results, which are not directly comparable with RI measurements. In this series of measurements, it can be noticed that the higher standard deviation values among the results are in the low-frequency bands. The mean of DLSI 200–5000 Hz values, shown in Figure 11b, is 29.21 dB, with a standard deviation of 0.27 dB.
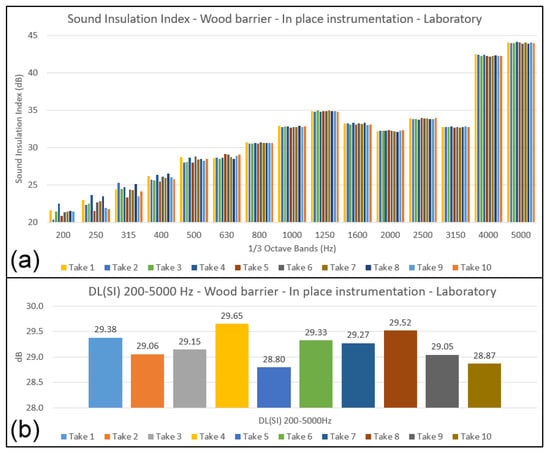
Figure 11.
Sound insulation index—repeated measurements in laboratory on non-flat wooden barrier, keeping sound source and microphone grid in place: (a) sound insulation index; (b) DLSI 200–5000 Hz from the 10 measurements.
Figure 12a shows the results of 10 repeated measurements of sound insulation index in the laboratory on the non-flat wooden barrier visible in Figure 1, made by repositioning the sound source and microphone grid at each measurement. Figure 12b shows the DLSI 200–5000 Hz values of these 10 measurements. In Figure 16, the standard deviation values of the measurements are shown (orange line). An increased standard deviation can be seen in mid- and high-frequency bands. The average value of the DLSI 200–5000 Hz, shown in Figure 12b, is 28.95 dB, with a standard deviation of 0.25 dB, almost like in the previous case. It could be inferred that the sound insulation measurements are less affected by small inaccuracies in instrumentation placement.
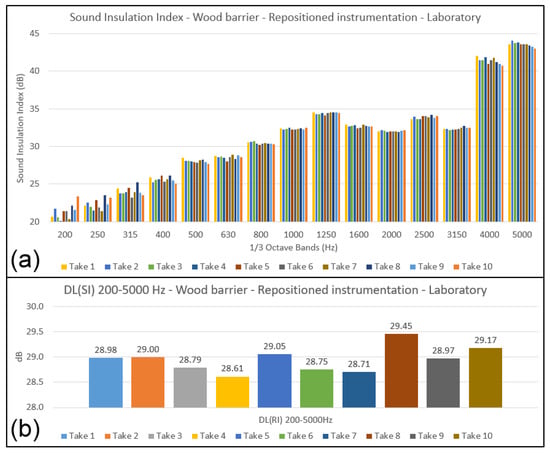
Figure 12.
Sound insulation index—repeated laboratory measurements on non-flat wooden barrier, repositioning the sound source and microphone grid for each measurement: (a) sound insulation index; (b) DLSI 200–5000 Hz from the 10 measurements.
Figure 13a shows the results of 10 repeated measurements of sound insulation index in the laboratory on the flat metal barrier visible in Figure 1, performed by repositioning the sound source and microphone grid at each measurement. In Figure 16, the standard deviation values of these measurements are shown (gray line). The average of DLSI 200–5000 Hz values, shown in Figure 13b, is 26.72 dB, with a standard deviation of 0.19 dB.
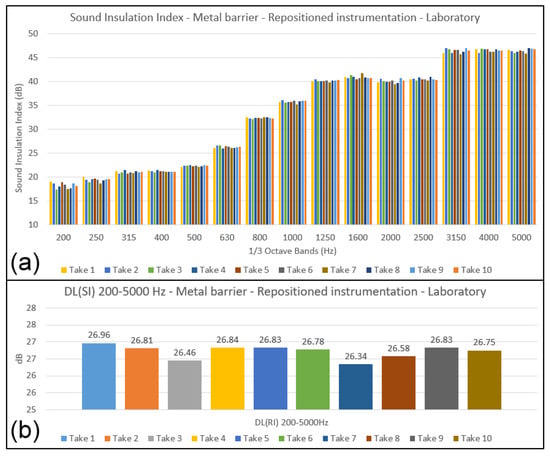
Figure 13.
Sound insulation index—repeated measurements in laboratory on flat metal barrier, repositioning the sound source and microphone grid for each measurement: (a) sound insulation index; (b) DLSI 200–5000 Hz from the 10 measurements.
Figure 14a shows the results of 10 sound insulation index measurements repeated in situ on the non-flat wooden barrier visible in Figure 2 and Figure 4, made along the A22 Brennero highway, near Verona (Italy), moving and repositioning the sound source and microphone grid at each measurement. In Figure 16, the standard deviation values of these measurements are shown (gray line). It can be seen that, despite the more difficult measurement conditions, the values are relatively low and similar to previous cases. The average of DLSI 200–5000 Hz values, shown in Figure 14b, is 13.29 dB, with a standard deviation of 0.06 dB. This rather low value may be due to a particularly homogeneous barrier and the weak dependence of SI measurement on perfect instrumentation positioning (within certain limits).
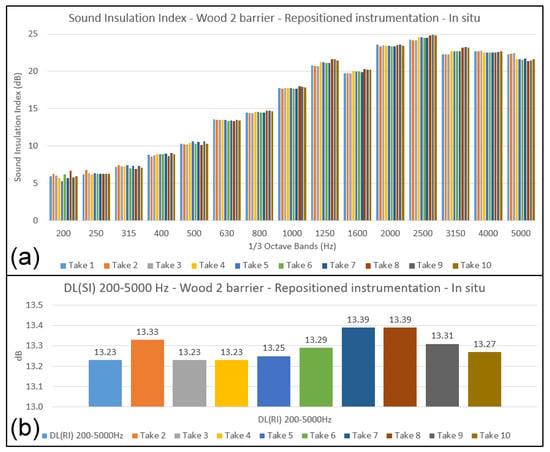
Figure 14.
Sound insulation index—repeated in situ measurements on non-flat wooden barrier and concrete base, repositioning the sound source and microphone grid for each measurement: (a) sound insulation index; (b) DLSI 200–5000 Hz from the 10 measurements.
4. Discussion
Figure 15 and Table 1 show a comparison of the standard deviation values between the sound reflection index measurements in the four cases described above. The same graph shows the values of standard deviation of repeatability obtained in the round-robin test [7] and reported in EN 1793-5 [3] (green line). The data are shown in logarithmic scale given the difference of several orders of magnitude between the different results.
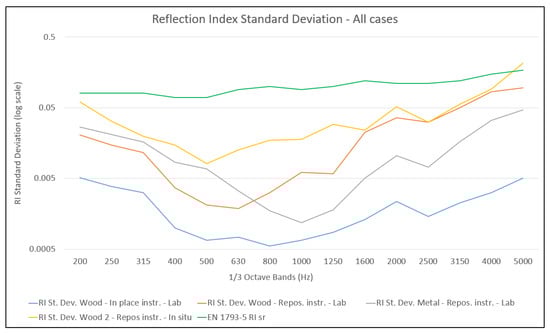
Figure 15.
Summary graph of the standard deviations of sound reflection index in the presented cases and median standard deviation of repeatability sr from EN 1793-5 [3].

Table 1.
Standard deviations of sound reflection index in the presented cases and median standard deviation of repeatability sr from EN 1793-5.
The lowest standard deviation values (blue line in the graph) are obtained in the case reported in Figure 7, where the sound source and microphone grid in the laboratory are left in place, which represents the highest achievable accuracy of the instrumentation used.
The laboratory measurements with repositioning, described in Figure 8 and Figure 9, plotted in the gray and orange lines, follow similar and higher trends than the previous case.
The in situ measurement, reported in Figure 10 with the yellow line, shows significantly higher values than the previous cases. It can be observed that all standard deviation values obtained from the presented measurements are lower than those obtained from the round-robin test [7] (green line), with the single exception of the value at 5000 Hz from the in situ measurement, which is slightly higher. Moreover, it should be noted that in the in situ measurement, the standard deviation on the DLRI 200–5000 Hz of 0.20 dB is far less than the median value prescribed in the EN 1793-5 standard of 0.53 dB, which resulted from the international round-robin test [7]. In all cases, higher values of standard deviation values are noticed at high frequencies, due to the sound wave interference reasons described above, and at low frequencies, probably due to the lower energy emitted by the sound source, and the consequent lower signal-to-noise ratio.
Figure 16 and Table 2 show the standard deviation values of sound insulation index measurements in the four cases described above. The standard deviation values of repeatability obtained in the round-robin test [7] and reported in EN 1793-6 [4] are shown (green line). Data are shown on a logarithmic scale.
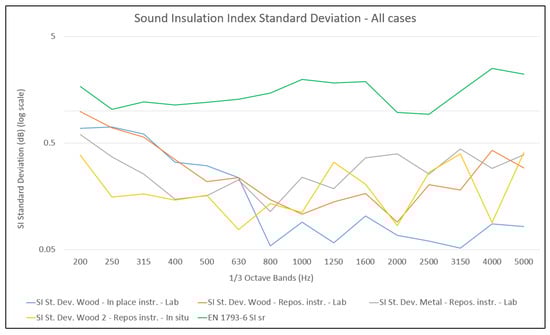
Figure 16.
Summary graph of the standard deviations of sound insulation index in the presented cases and median standard deviation of repeatability sr from standard EN 1793-6.
Table 2.
Standard deviations of sound insulation index in the presented cases and median standard deviation of repeatability sr from EN 1793-6 [4].
In the case of the insulation measurements, looking at the various curves in Figure 16, smaller differences can be seen among the cases presented. Particularly at low frequencies, the curves tend to converge toward similar, higher values, probably due to the lower energy emitted by the sound source, which increases measurement errors in these frequency bands and makes the data difficult to interpret. On the mid-high frequencies, it is apparent that the case in which the instrumentation remains in place (blue line) results in the lowest values, as logically expected. The other cases show oscillating values and fluctuate quite randomly, highlighting the low (but not negligible) dependence of SI measurements on instrumentation placement. All standard deviation values obtained from the presented measurements are lower than the curve obtained from the round-robin test [7] (green line).
In the in situ measurement, the standard deviation on the DLSI 200–5000 Hz of 0.06 dB is well below the median value presented in EN 1793-6, which was found from the data of the international round-robin test [7] as 1.03 dB for measurements across the acoustic element.
5. Conclusions
In this work, multiple series of repeated measurements of the sound reflection index and sound insulation index, performed in laboratory and in situ along a highway, with different boundary conditions, were presented to derive information on the repeatability of the measurement system and of the method. Measurements without moving the instrumentation were used as a benchmark value of the measurement system. The results obtained indicate that the measurement of sound reflection index is more sensitive to instrumentation placement than the measurement of sound insulation index. In particular, the non-flat surface barriers show more variability in the results at high frequencies, depending on the placement of the microphone grid, due to the diffraction of sound on the surface irregularities, but this variability has little effect on the single-number rating because the normalized spectrum of traffic noise weights the mid frequencies more heavily. Repeated measurements of sound insulation index showed little, but not negligible, dependence of this parameter on sound source and microphone grid placements. In both sound reflection index and sound insulation index measurements, and for all cases examined, the standard deviation of the single-number rating is well below the value presented in the current European standards ([3,4], obtained from the statistical analysis of an international round-robin test [7] performed a dozen years ago. It is hoped that this striking result will highlight the need for a new inter-laboratory test to find more up to date figures for the repeatability and reproducibility of the Adrienne method. The authors will continue to test the potentialities of the method, checking the influence of other parameters, such as the sound signal spectrum (pre-emphasized noise), or using a larger set of measurements taken in the same day along the same noise barrier to calculate more elaborate statistics (e.g., on the variance of the workmanship along nominally identical barrier fields).
Author Contributions
Conceptualization, P.G. and M.G.; methodology, P.G.; software, P.G.; validation, P.G. and M.G.; formal analysis, P.G.; investigation, P.G. and M.G.; resources, P.G. and M.G.; data curation, P.G.; writing—original draft preparation, P.G.; writing—review and editing, P.G. and M.G.; supervision, M.G.; project administration, M.G.; funding acquisition, M.G. All authors have read and agreed to the published version of the manuscript.
Funding
This work was partly performed in the frame of the SOPRANOISE project, funded by CEDR (Conference of European Directors of Roads) as a part of their Transnational Road Research Program, Call 2018, Noise and Nuisance.
Data Availability Statement
The data measured and presented in this study are available upon request to the authors.
Conflicts of Interest
The authors declare no conflict of interest.
References
- Khosravipour, M.; Khanlari, P. The association between road traffic noise and myocardial infarction: A systematic review and meta-analysis. Sci. Total Environ. 2014, 731, 139226. [Google Scholar] [CrossRef]
- Stansfeld, S.; Clark, C.; Smuk, M.; Gallacher, J.; Babisch, W. Road traffic noise, noise sensitivity, noise annoyance, psychological and physical health and mortality. Environ. Health 2021, 20, 1–15. [Google Scholar] [CrossRef]
- EN 1793-5:2016/AC:2018; Road Traffic Noise Reducing Devices—Test Method for Determining the Acoustic Performance—Part 5: Intrinsic Characteristics—In Situ Values of Sound Reflection under Direct Sound Field Conditions. European Committee for Standardization: Brussels, Belgium, 2018.
- EN 1793-6:2018/A1:2021; Road Traffic Noise Reducing Devices—Test Method for Determining the Acoustic Performance—Part 6: Intrinsic Characteristics—In Situ Values of Airborne Sound Insulation under Direct Sound Field Conditions. European Committee for Standardization: Brussels, Belgium, 2021.
- Radosz, J. Acoustic performance of noise barrier based on sonic crystals with resonant elements. Appl. Acoust. 2019, 155, 492–499. [Google Scholar] [CrossRef]
- Morandi, F.; Miniaci, M.; Marzani, A.; Barbaresi, L.; Garai, M. Standardised acoustic characterisation of sonic crystals noise barriers: Sound insulation and reflection properties. Appl. Acoust. 2016, 114, 294–306. [Google Scholar] [CrossRef]
- Garai, M.; Schoen, E.; Behler, G.; Bragado, B.; Chudalla, M.; Conter, M.; Defrance, J.; Demizieux, P.; Glorieux, C.; Guidorzi, P. Repeatability and reproducibility of in situ measurements of sound reflection and airborne sound insulation index of noise barriers. Acta Acust. United Acust. 2014, 100, 1186–1201. [Google Scholar] [CrossRef]
- Robinson, P.; Xiang, N. On the subtraction method for in situ reflection and diffusion coefficient measurements. J. Acoust. Soc. Am. 2010, 127, EL99-104. [Google Scholar] [CrossRef] [PubMed]
- Garai, M.; Guidorzi, P. Sound reflection measurements on noise barriers in critical conditions. Build. Environ. 2015, 94, 752–763. [Google Scholar] [CrossRef]
- Garai, M.; Guidorzi, P.; Osele, A.; Costa, C. On-site check of the intrinsic acoustic characteristics of noise barriers: Preliminary results on the Italian A22 highway. In Proceedings of the Forum Acusticum, Lyon, France, 20–24 April 2020; pp. 431–437. [Google Scholar] [CrossRef]
- Morandi, F.; Miniaci, M.; Guidorzi, P.; Marzani, A.; Garai, M. Acoustic Measurements on a Sonic Crystals Barrier. Energy Procedia 2015, 78, 134–139. [Google Scholar] [CrossRef]
- Guidorzi, P.; Garai, M. A Low-Cost System for Quick Measurements on Noise Barriers in Situ. IEEE Trans. Instrum. Meas. 2022, 71, 6503714. [Google Scholar] [CrossRef]
- Borish, J.; Angell, J.B. An Efficient Algorithm for Measuring the Impulse Response Using Pseudorandom Noise. J. Audio Eng. Soc. 1983, 31, 478–488. [Google Scholar]
- Rife, D.D.; Vanderkooy, J. Transfer-function measurement with maximum-length sequences. J. Audio Eng. Soc. 1989, 37, 419–444. [Google Scholar]
- Rife, D.D. Modulation Transfer Function Measurement with Maximum Length Sequences. J. Audio Eng. Soc. 1992, 40, 779–790. [Google Scholar]
- Vanderkooy, J. Aspects of MLS measuring systems. J. Audio Eng. Soc. 1994, 42, 219–231. [Google Scholar]
- Mommertz, E. Angle-dependent in situ measurements of reflection coefficients using a subtraction technique. Applied Acoustics 1995, 46, 251–263. [Google Scholar] [CrossRef]
- Vorländer, M.; Kob, M. Practical aspects of MLS measurements in building acoustics. Applied Acoustics 1997, 52, 239–258. [Google Scholar] [CrossRef]
- Nielsen, J.L. Improvement of Signal-to-Noise Ratio in Long-Term MLS Measurements with High-Level Nonstationary Disturbances. J. Audio Eng. Soc. 1997, 45, 1063–1066. [Google Scholar]
- Vorländer, M.; Mommertz, E. Guidelines for the application of the MLS technique in building acoustics and in outdoor measurements. In Proceedings of the 1997 International Congress on Noise Control Engineering, Budapest, Hungary, 25–27 August 1997; pp. 1457–1462. [Google Scholar]
- Stan, G.; Embrechts, J.J.; Archambeau, D. Comparison of Different Impulse Response Measurement Techniques. J. Audio Eng. Soc. 2002, 50, 249–262. [Google Scholar]
- Ćirić, D. Comparison of influence of distortion in MLS and Sine Sweep technique. In Proceedings of the 19th International Congress on Acoustics, Madrid, Spain, 2–7 September 2007. paper RBA-07-020. [Google Scholar]
- Papadakis, N.M.; Antoniadou, S.; Stavroulakis, G.E. Effects of Varying Levels of Background Noise on Room Acoustic Parameters, Measured with ESS and MLS Methods. Acoustics 2023, 5, 563–574. [Google Scholar] [CrossRef]
Disclaimer/Publisher’s Note: The statements, opinions and data contained in all publications are solely those of the individual author(s) and contributor(s) and not of MDPI and/or the editor(s). MDPI and/or the editor(s) disclaim responsibility for any injury to people or property resulting from any ideas, methods, instructions or products referred to in the content. |
© 2023 by the authors. Licensee MDPI, Basel, Switzerland. This article is an open access article distributed under the terms and conditions of the Creative Commons Attribution (CC BY) license (https://creativecommons.org/licenses/by/4.0/).