Article

Factors Influencing Ammonia Concentrations above Corn Fields after Dairy Manure Application

Institute for Environmentally Integrated Dairy Management, USDA-ARS, Marshfield, WI 54449, USA
*
Author to whom correspondence should be addressed.
Retired.
Environments 2023, 10(8), 140; https://doi.org/10.3390/environments10080140
Submission received: 28 June 2023 / Revised: 31 July 2023 / Accepted: 4 August 2023 / Published: 8 August 2023
(This article belongs to the Special Issue Deployment of Green Technologies for Sustainable Environment II)

Abstract

:
Ammonia-nitrogen (NH3-N) loss from agriculture decreases crop yield potential and environmental quality. Incorporating animal manures by chisel plowing (CP) can reduce NH3 loss but may increase crop residue loss compared to lower disturbance incorporation methods and vertical tillage (VT). Few studies have evaluated VT efficacy for incorporating manure and reducing NH3 concentrations compared to traditional tillage tools, such as CP. Six trials during 2013 to 2016 were conducted to evaluate the impacts of manure incorporation method (CP, VT, or broadcast) and weather conditions at the time of application on NH3-N concentrations at a dairy research farm in central Wisconsin, USA. Passive samplers measured NH3-N concentrations at 30-cm above the ground during the first 0 to 24 and 24 to 48 h post-manure application/incorporation. Average NH3-N concentrations for CP and VT were 44 to 86% of broadcast and similar for most trials, while crop residue coverage for VT was greater than CP (39 and 22% of control plots, respectively). Concentrations of NH3-N were correlated with the amount of plot area covered by manure for the first (r = 0.56, p < 0.0001) and second measurement periods (r = 0.85, p < 0.0001). Results show that VT had comparable NH3-N concentration reductions to CP while conserving more crop residue.

1. Introduction

Dairy manure is a common farm nitrogen (N) source, but large quantities of ammonia (NH3) are easily lost during surface application if not mechanically incorporated into the soil [1,2,3,4]. Volatilization of NH3-N from manure and fertilizers represents a lost source of potentially available crop N, and can contribute to deleterious impacts on the air and nearby surface water quality [1,2,3]. In reviewing nitrous oxide and NH3 emission studies, Webb et al. [4] reported that immediate manure incorporation by moldboard plowing was the most effective method (≥90%) to reduce NH3 losses.
Other studies indicate that NH3 loss associated with manure application can vary widely (40 to 95%) depending on specific tillage implements and other factors (manure type, soils, weather) [5,6,7,8,9,10]. Low-disturbance methods, including shallow disc injection and band application/aeration, may also be effective, with shallow disc injection generally more effective for reducing soluble N and phosphorus concentrations in surface runoff [6,7,11,12,13]. Huijsmans et al. [6] summarized studies from the Netherlands and determined that surface incorporation by various tillage methods and injection reduced NH3 volatilization compared to surface application by 75 and 95% on average, respectively. The time between manure application and incorporation is critical, since 24–39% of NH3 volatilization can occur within the first 60 min of application [14,15]. Huijsmans et al. [16] measured a 70% loss of NH4-N applied in the first 3 h after manure application. A potential drawback of conventional tillage manure incorporation is enhanced erosion potential and less crop residue compared to lower disturbance methods or surface application [17,18,19].
Cropping system factors, including crop type/stage of growth along with quantity and type of crop residue, can also impact NH3 loss after manure application. Surface manure application on bare ground without any incorporation tends to result in lower NH3 volatilization compared to losses on fields with a standing crop, stubble, or substantial residues. Crop residues expose manure to more air flow, which can exacerbate NH3 emission, particularly with drier manure (lower dry matter solids) as less infiltrates into the soil [14,20]. Soil conditions (moisture content, microtopography, porosity, and density) also impact NH3 losses via interactions on turbulent diffusion of NH3 from the manure surface and lateral transport, in addition to impacts on manure infiltration rates and surface roughness, which affect NH3 losses [21]. Weather conditions also affect NH3 loss [22,23,24,25]. Wind speed aids in the upward and sideways transport of NH3 [14,15,24], although the effect of wind speed may not be a factor if manure incorporation occurs [26].
A main goal of reduced tillage is to decrease soil erosion and maintain crop residue for soil quality benefits, but reduced fuel and labor costs may also be realized [26,27,28,29,30,31,32,33]. In 2008, over 46 million ha (41.5% of cropland) in the US used some form of reduced/conservation tillage [26]. Vertical tillage (VT) is a reduced tillage method by which coulters/tines enter the soil on a vertical plane, minimizing shear force and surface disturbance. Implements for VT encompass a wide range of designs with various settings for soil and residue incorporation levels [26,33] and are operated at shallow depths (7.5 to 10 cm) and higher speeds than traditional tillage implements [26]. While some VT research has addressed residue levels [34], there is a lack of published research on using VT to incorporate manure and reduce the risk of NH3 loss compared to more traditional tillage, such as chisel plowing (CP).
In this study, we evaluated the impact of CP and VT on average NH3 concentrations immediately above the soil compared to no manure controls and surface application/broadcast (without any incorporation). Our main objective was to quantify field-scale differences in NH3 concentrations and crop residue coverage for surface applied and incorporated manure (CP or VT) across a range of field and weather conditions typical of upper Midwest corn production systems.

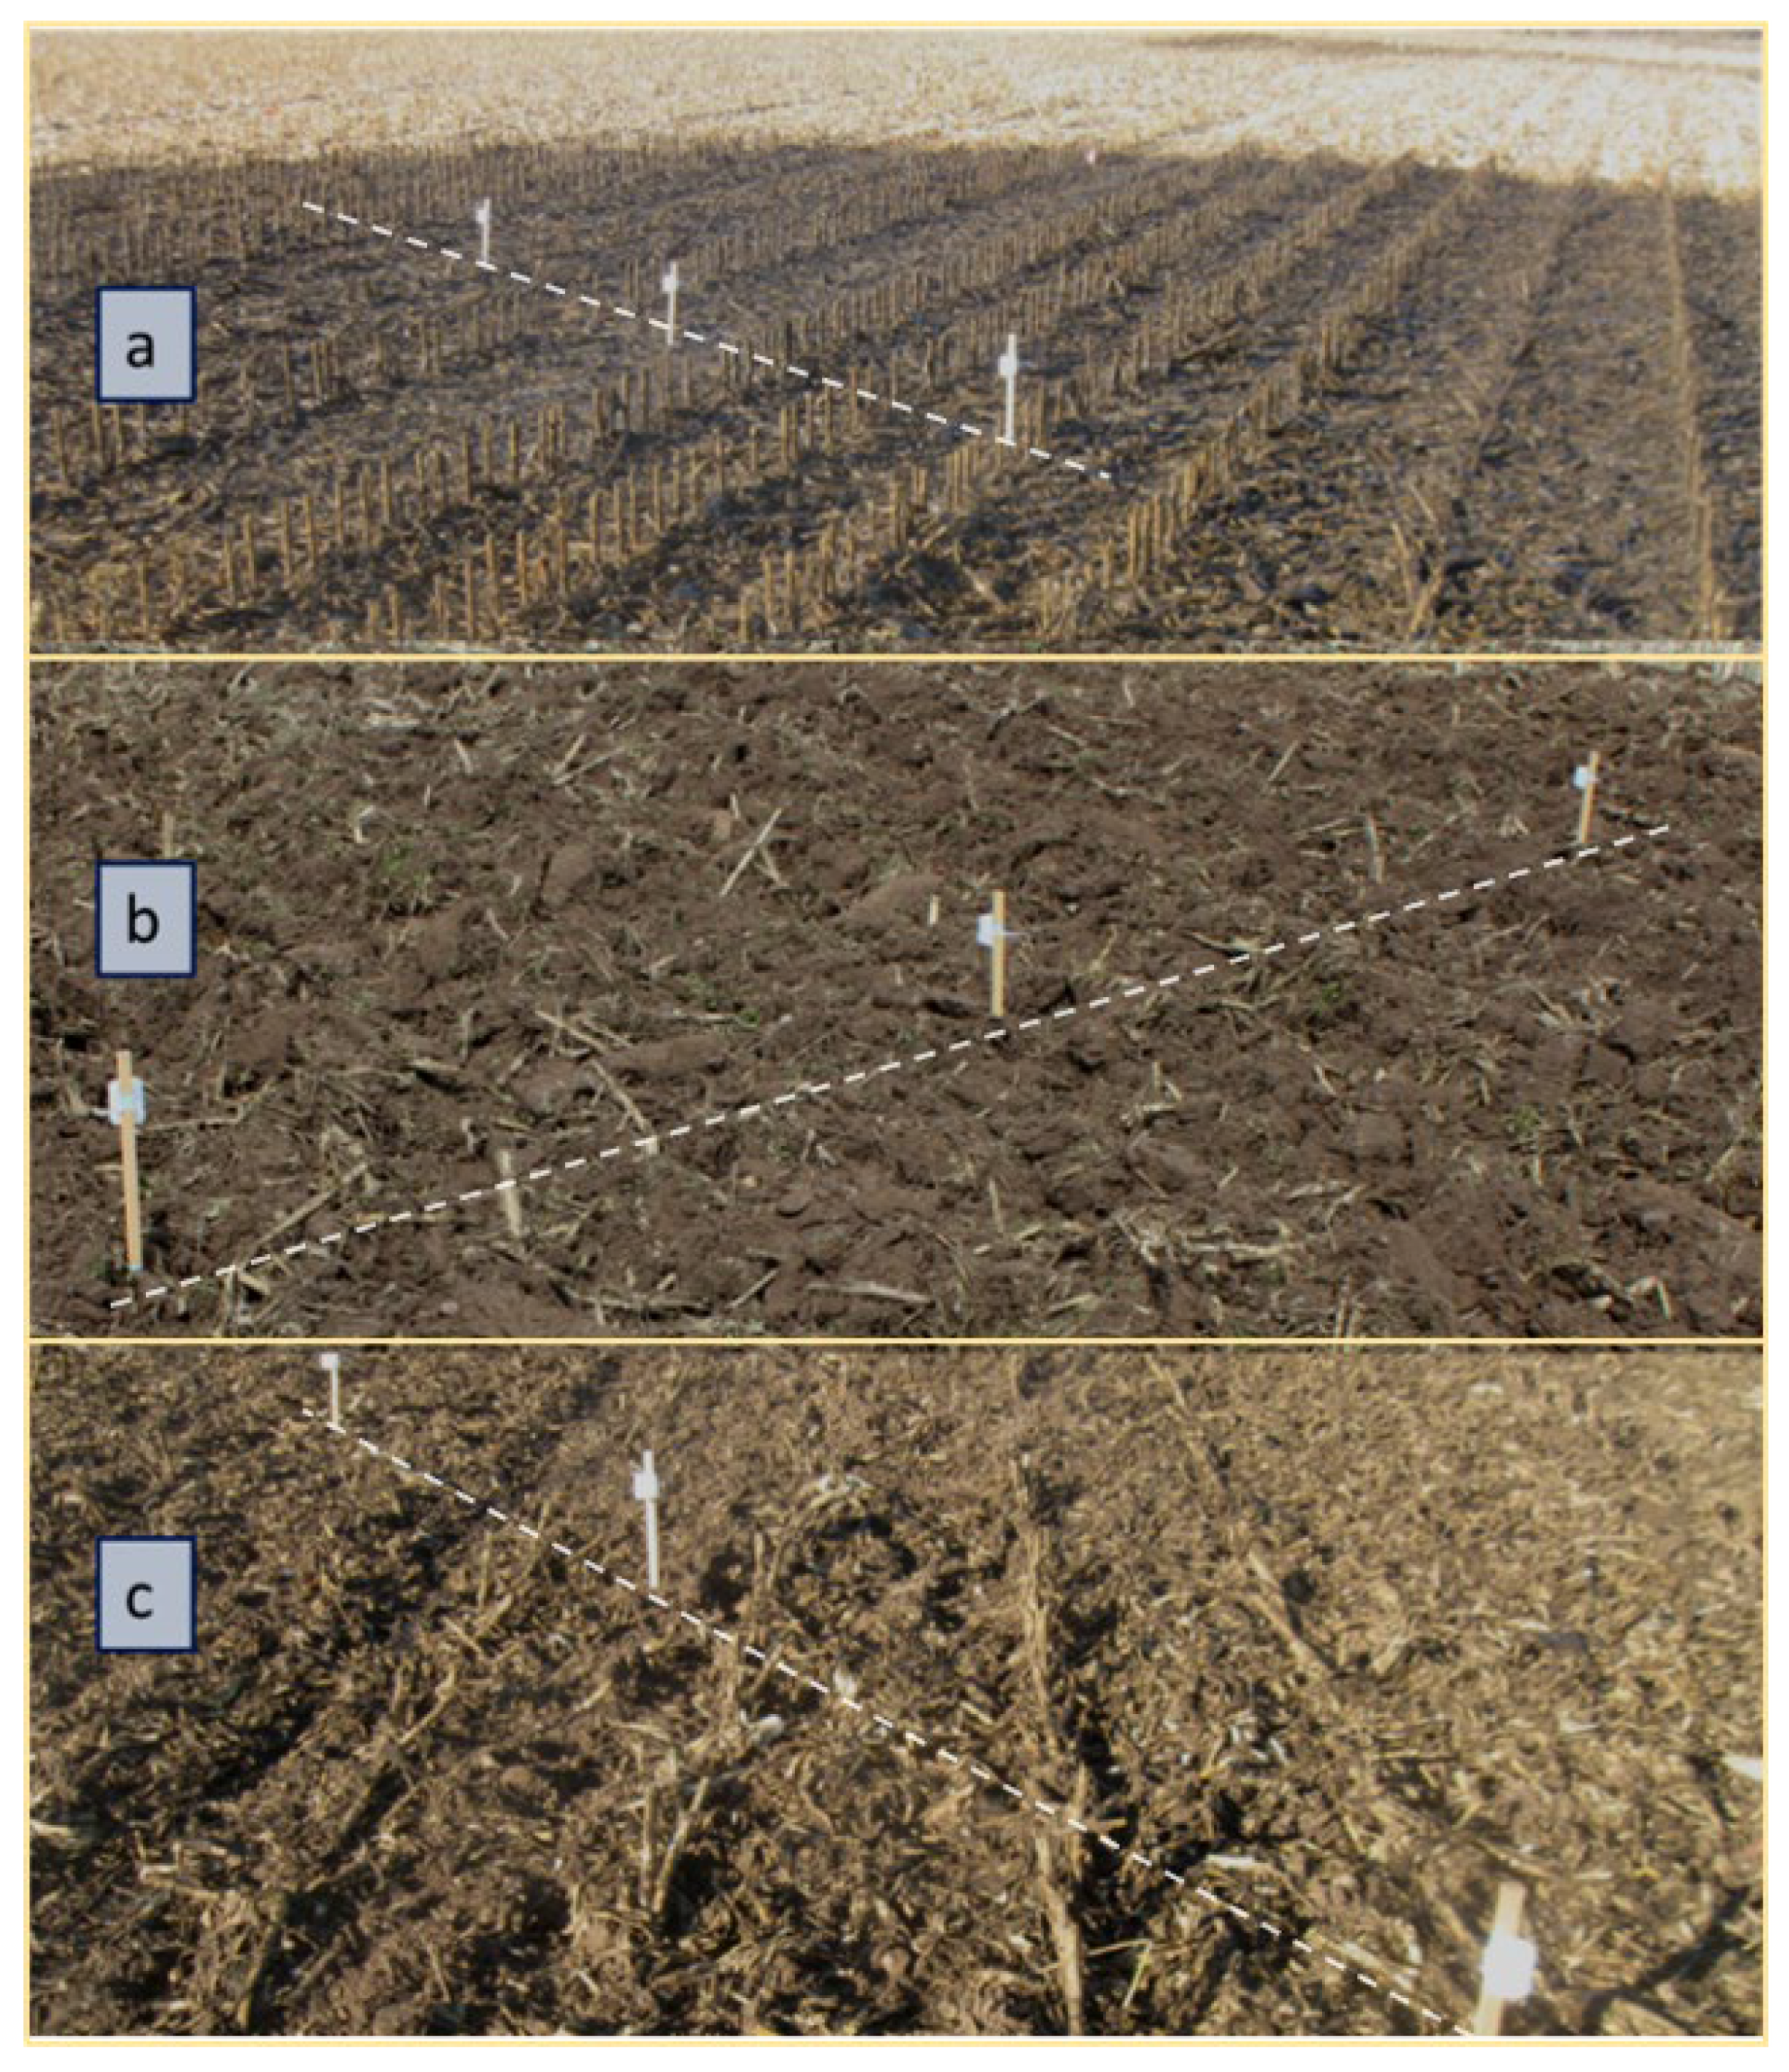
2. Materials and Methods

Six separate field experiments were conducted during 2013 to 2016 and included a range of crop residue and manure characteristics (Table 1). All trials were performed at the University of Wisconsin (WI)/USDA-ARS Marshfield Agricultural Research Station in Stratford, WI, USA on a somewhat poorly drained Withee silt loam soil (fine-loamy, mixed, superactive, frigid Aquic Glossudalfs; 0–2% slope). Plots were established on active crop production fields used for forage production, including corn (Zea mays L.) harvested for silage, corn harvested for grain, or small grain (Avena sativa L.). Each of the six trials was arranged in a randomized complete block design with 3 blocks and 4 treatments consisting of manure incorporated via CP or VT, surface broadcast application (no incorporation), and a no manure control. Plots were approximately 9 by 24 m for Trial 1 and 2 and 15.3 by 15.3 m for Trials 3–6 to accommodate tillage and manure application equipment (3 to 7.5 m in between plots within a block depending on field size with ≥30.5 m between blocks). Blocks were set up perpendicular to the prevailing wind direction to reduce NH3 transport among plots. Four of the VT trials were performed with one VT implement (Case IH 330, Turbo, Racine, WI, USA) while a different tool (Great Plains Turbo-Till 1800, Aberdeen, WI, USA) was used for the last two trials (Table 1). VT implements were set to run between 5 and 8 cm deep. Chisel plow tillage (Case IH, Brillion, WI, USA) was performed at 15 cm deep and moved more soil compared to VT. All tillage incorporation occurred within 5 min of dairy manure application. Manure was applied using either a box type spreader for semi-solid manure (H&S HP425, Marshfield, WI, USA) or a discharge spreader for liquid manure (Calumet 5000, Indianapolis, IN, USA). Manure application target rates were 84,000 L ha−1 for liquid and 90 Mg ha−1 for solid manure, and these were based on agronomic application rates that consider all N sources for the subsequent corn crop. Manure was sampled directly from spreaders (3 per block/trial) and analyzed for dry matter/solids content, total nitrogen (TN), total phosphorus, and ammonium-N contents (NH4-N) by the University of Wisconsin Soil and Forage Laboratory (Marshfield, WI, USA) [34]. Spreaders were calibrated by applying manure over plastic sheets or weighing manure spreaders empty and full to compute applied dry matter manure mass (Table 2).
Soil samples were collected from the control plots for each individual trial to provide a general evaluation of soil fertility across blocks prior to manure application. Soil samples were not taken from manured plots. Five individual sample cores (2.5 cm diameter auger taken from 0 to 20 cm depth) per plot were composited. Air dried, ground (2 mm) samples were analyzed for organic matter contents by loss on ignition [34,35], pH by an electrometric method 1:1 soil: water [35], and NH4-N by flow injection analysis of a 2 M KCl extract [36] by the University of Wisconsin Soil and Forage Lab (Marshfield, WI, USA). Soil moisture measurements were also performed (Delta-T Devices Theta Probe, Burwell/Cambridge, UK) by averaging 3 to 5 individual measurements per control plot.
A portable weather station (Spectrum Watchdog 2000 series, Aurora, IL USA) was positioned at the field edge to determine temperature, humidity, wind speed, and rainfall (accuracy ± 2 °C, ±2% RH, ±0.8 m s−1, ±2% at <5 cm h−1, respectively) during each trial. For trials in 2015 and 2016 (n = 4), the plot area covered by either manure or crop residue was estimated (at 1.5 m above plot surface, 2.25 m2/plot) using digital plot images (SamplePoint software, version 1.60) [37].
Ammonia concentrations were measured using passive samplers (Ogawa USA Inc., Pompano Beach, FL, USA) and consisted of a Teflon cylinder with separate ends containing an acidified filter paper (NH3 sink) behind a metal screen and a diffusion barrier. These samplers can accurately measure NH3 concentrations over a wide range (1 µg NH3-N m−3 to 10 mg NH3-N m−3). The reported sampler NH3 diffusion coefficient is 0.232 cm2 s−1 with a detection limit of 3.7 µg NH3-N m−3 for a 24-h period (uncertainty of ±5%) [38]. Roadman et al. [38] provide additional background and validation data for the samplers. Immediately after manure application and incorporation via VT or CP, three stakes per plot were secured in the ground on a diagonal line across each plot centered within the 6 m by 6 m center area (9 m from plot edges for trial 1 and 2 in the direction of prevailing winds; 4.5 m from plot edges for trial 3–6). Sampling units were then attached to stakes positioned at 30.5 cm above the ground surface (Figure 1). Samplers were attached to the stakes on mounts below PVC shelter caps. An average NH3 concentration of the three samplers per plot was used for data analysis for each of the six trials. Additional samplers were positioned upwind to measure background NH3. Samplers were deployed immediately after manure application, and were retrieved for analysis at 24 h. Samplers collected at 24 h were then replaced with new samplers and collected again after 24 h (48 h after manure application). Field blanks were individual samplers kept in air-tight containers in the field during sampler deployment, transport, and analysis (laboratory blanks were kept in air-tight containers in the lab during sampler preparation and analysis). All blanks were below the method detection limit (0.005 mg N L−1 as NH3), except the first 24-h field blank for 17 May 2016 (0.006 mg N L−1 as NH3). The NH3 traps inside samplers were taken back to the laboratory and extracted with 8 mL of deionized water, and NH3-N was determined by flow injection analysis [39]. Average ambient concentration of NH3-N for the 24 h deployment period was determined after Roadman et al. [38].
Average NH3-N concentrations for each treatment for both sampling periods were subjected to analysis of variance using the general linear modeling procedure (proc glm) of the Statistical Analysis System [40] under the assumption that the variability among application/incorporation treatment samplers would far exceed minor differences in soil properties (Table 3). Trials were analyzed as individual experiments and data were transformed as necessary (log10 or square root) to achieve normality and homogeneity of variance. Treatment means were separated by Fisher’s protected LSD (p ≤ 0.10). Pearson correlation coefficients (proc corr) were also computed between NH3 concentrations, select weather conditions for the day of the trials, and percent residue/manure coverage from the plot image analysis data.

3. Results and Discussion

3.1. Manure and Soil Properties

Manure dry matter solids content, total N, total P, and NH4-N inputs varied among individual experiments (Table 2), and they therefore influenced how close to the target application rate manure was applied. Manure for Trials 1 and 4 had higher dry matter solids content compared to other trials, resulting in correspondingly larger total N and NH4-N application (Table 2). Background soil fertility in control plots was similar among plots, with pH and organic matter contents averaging 6.7 ± 0.5 and 31 ± 5 g kg−1 (Table 3). Average soil moisture contents at the time of each experiment were similar and close to field capacity for Trials 2, 3, 4, and 6; Trial 1 was conducted under drier soil conditions, and Trial 5 was in conducted in wetter conditions (Table 3).

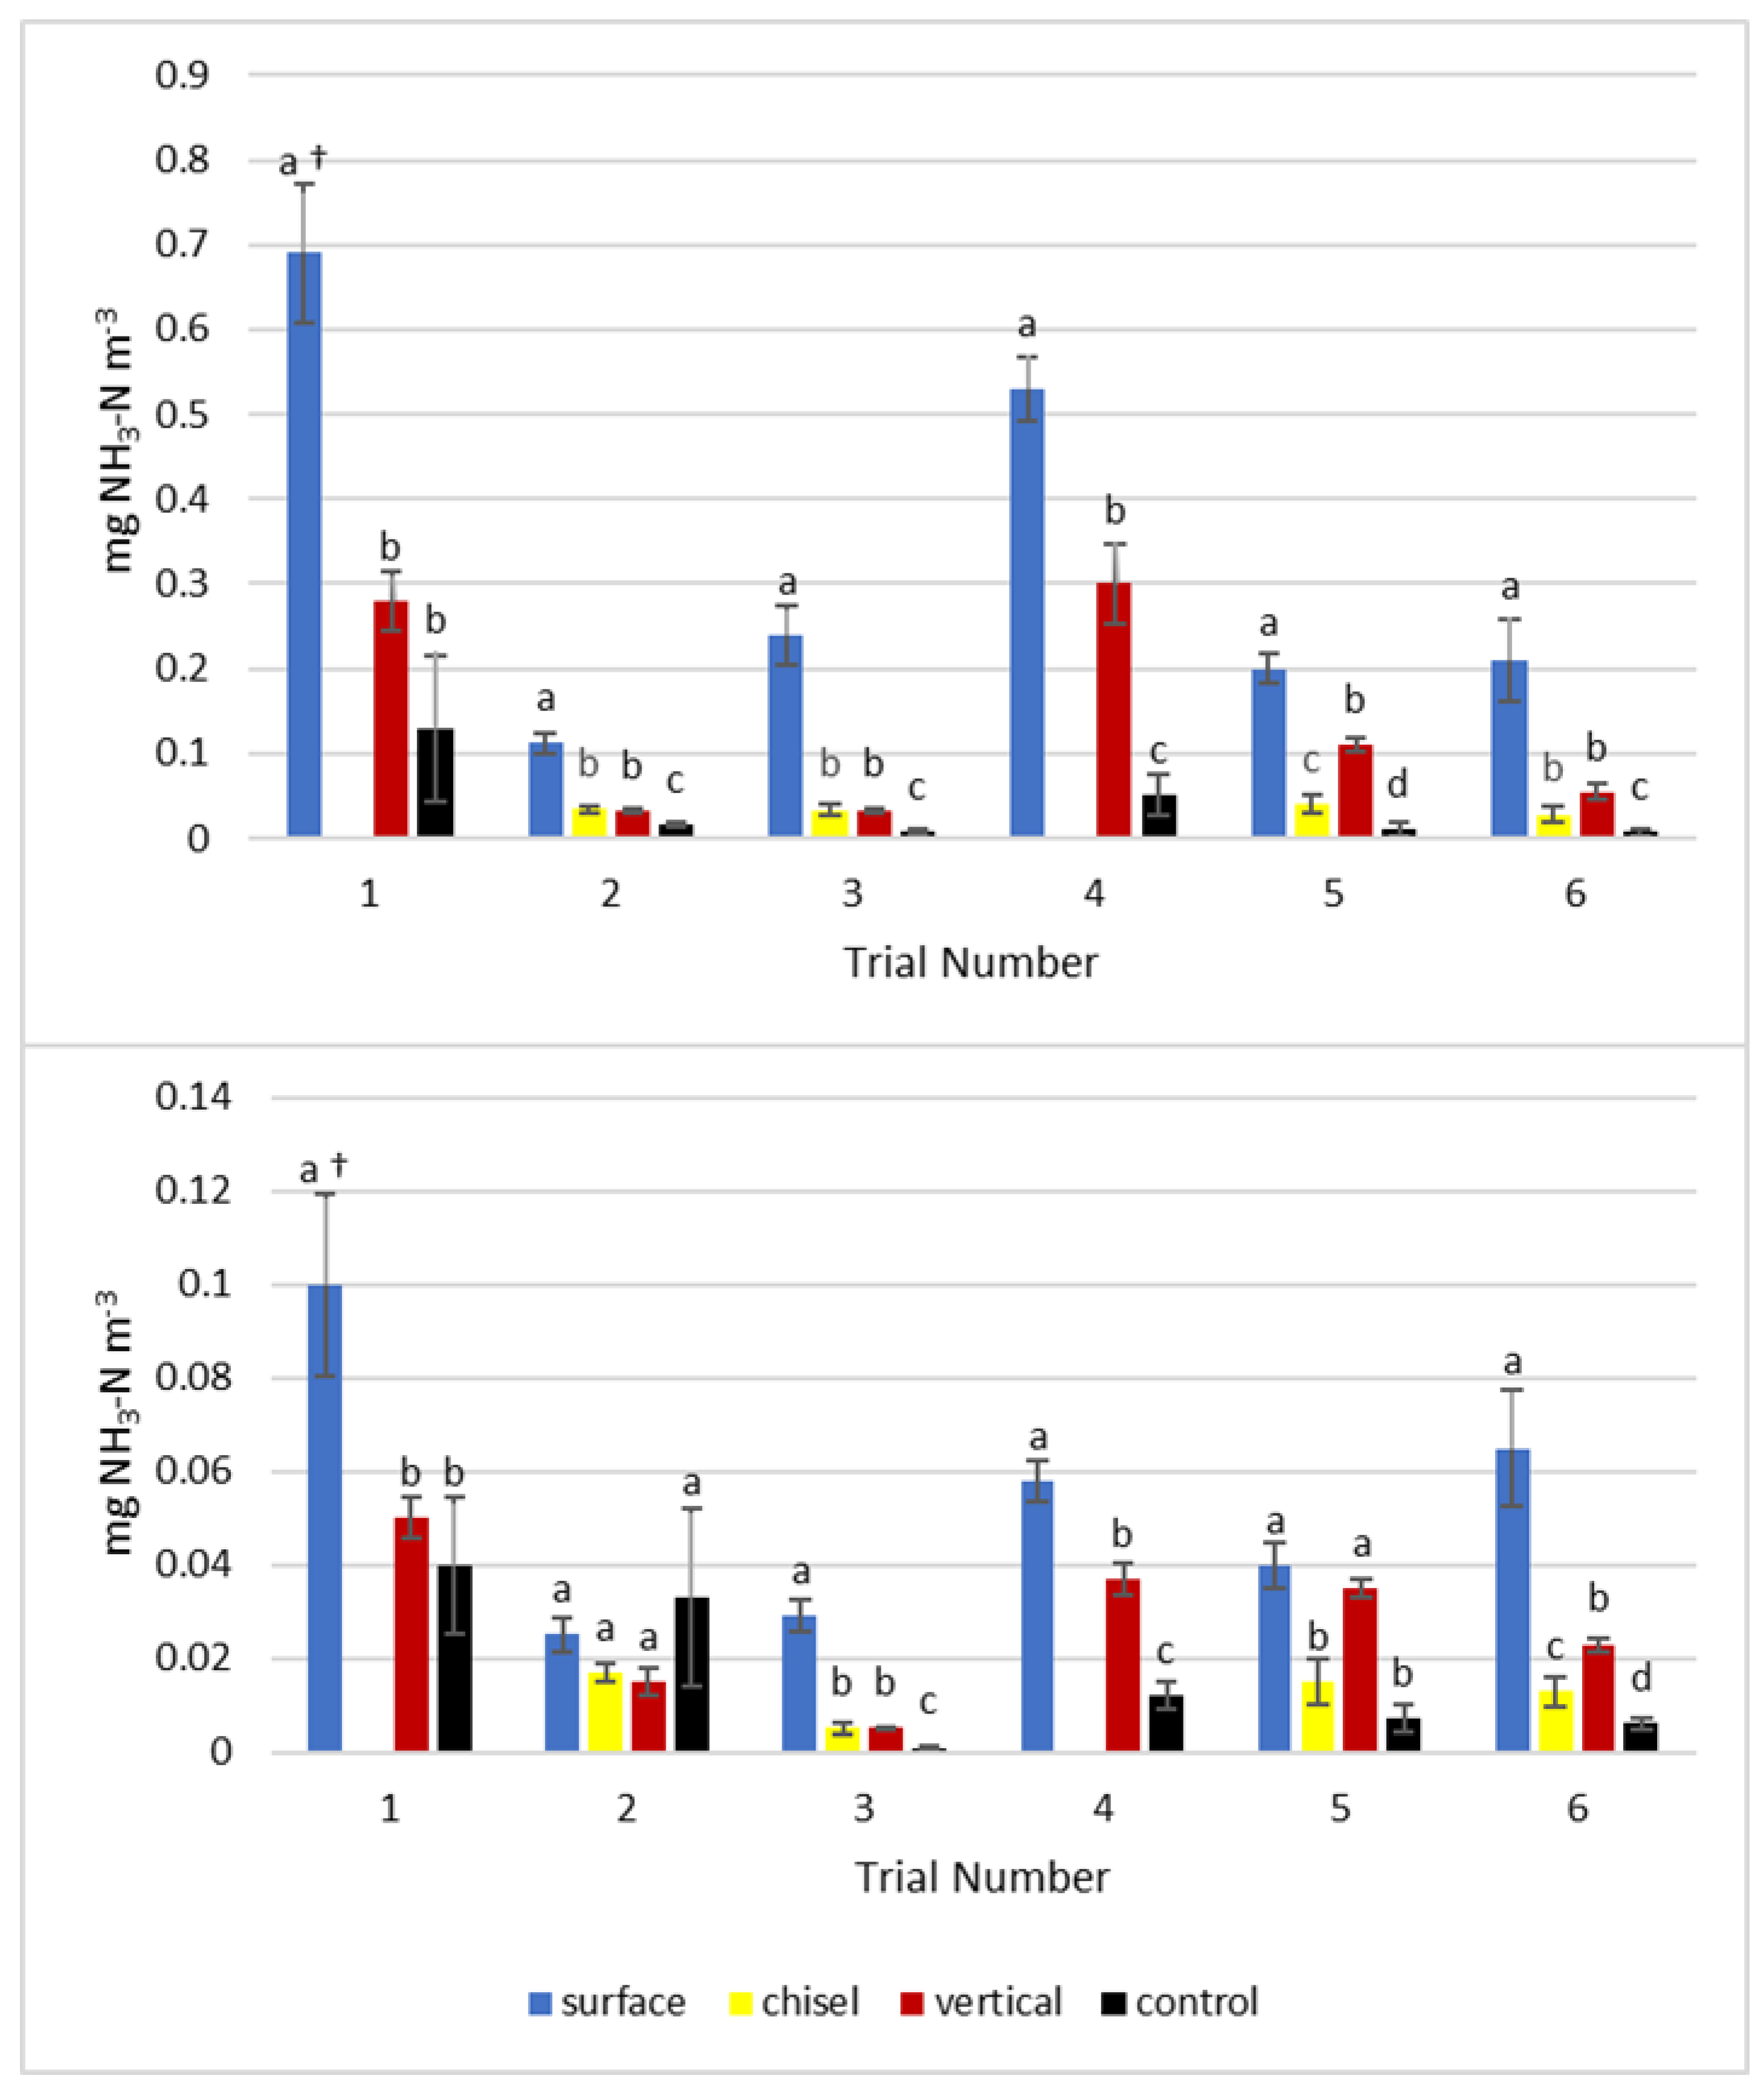
3.2. Influence of Manure Incorporation on NH3-N Concentrations

Mean NH3 concentrations ranged from <0.7 mg NH3-N m−3 (7 µg NH3-N m−3) to < 0.1 mg NH3-N m−3 in surface applied manure plots for the first 24-h monitoring period across trials (Figure 2). Compared to the first 24-h monitoring period, NH3-N concentrations consistently and substantially decreased, as expected (by up to an order of magnitude), for the 24 to 48 h period across treatments (Figure 2). Maximum NH3-N concentrations for the surface applied manure treatment were well below European guidelines for occupational health exposure (≤22 mg NH3-N m−3 for 10 min or ≤16 mg NH3-N m−3 for 8 h) [41,42]. Background NH3-N concentrations in agricultural areas have been reported in the range of <0.1 to 1.5 mg NH3-N m−3 [41,42,43] and are in the range of control plot NH3-N concentrations measured in our trials (Figure 2).
Our results support previous studies that indicated the importance of using some type of manure incorporation method to retain more NH3 in the form of soil NH4+-N. Manure incorporation consistently and significantly reduced NH3 concentrations from surface application levels during the first 24 h after application and in five of the six trials for the second 24-h period. Mean NH3-N concentrations for VT only differed significantly from CP for one trial in the first 24 h (Figure 2). In a four-year study from South Central WI, Powell et al. [8] demonstrated that liquid dairy manure injected into the soil of corn production systems was much less vulnerable to NH3 volatilization losses compared to surface broadcast application. They showed surface applied manure had 1.9- and 4.3-fold greater NH3-N concentrations compared to incorporation (soil aeration or injection). In a recent low-disturbance manure study, Sherman et al. [12] showed that 35.5% of manure applied NH4-N for a corn silage system was lost as NH3 emissions compared to 0.11 and 4.5% with strip-till injection or shallow disc injection, respectively. These studies demonstrate the importance of adequate incorporation and manure-to-soil contact for capturing more NH4+ and reducing NH3 emissions.

3.3. Impact of Weather Conditions and Manure on NH3-N Concentrations

Control plots in our trials generally had lower NH3-N concentrations, but they were not always significantly lower than manure treatments. For example, mean control plot NH3-N concentrations for Trial l (both sampling periods) and Trial 2 (24 to 48 h only) did not differ (p ≥ 0.10) from VT concentrations (Figure 2). It is possible that some amount of volatilized NH3-N from manure plots in our trials was transported to down-wind samplers, including controls, thus confounding treatment effects. Transport of NH3 from manure plots downwind to other plots is more likely with weather conditions favoring NH3 emission (Trial 1 and on the second day of Trial 2 in our study) as warmer, windier conditions increase NH3 emission [42,43,44]. While no manure was applied within the 30 m between the blocks to reduce NH3 transport, this was likely insufficient in preventing all NH3 transfer under all weather conditions. Consistent patterns of significantly lower NH3 concentrations for control plots in all other trials suggest that upwind plots were not affected by manure application in other blocks for most trials.
Adequately controlling NH3 emissions with management is difficult, since NH3 is easily transported and depends dynamically on several interrelated soil-ambient air exchange processes and related equilibria [42,43]. In our study, weather conditions for Trial 1 were more conducive to NH3 volatilization due to the higher wind speeds and gusts compared to other trial dates (Table 4), and this may help to explain the higher NH3-N concentration measured for the control plots for Trial 1. Moreover, NH3-N concentrations were significantly correlated with relative humidity (first 24 h), wind speed, and wind gusts (both time periods) across the trials (Table 4). Other studies have likewise reported significant correlations between NH3 emission and meteorological variables (wind speed, gust speed, humidity, and solar radiation) for agricultural sectors [14,15,22,24]. While relationships among NH3-N concentrations and weather factors captured by our study were not particularly strong, their significance indicates that they were important covariates affecting NH3-N concentrations for our study conditions.
Another limitation of our study was the relatively large time windows over which samplers were deployed, yielding an average NH3 concentration over that period. Due to sampler detection limits and the relatively low NH3 concentrations in our setting, longer deployment times were required [38]). In addition, parameters needed for emission estimates were not measured as part of the trials, primarily due to time constraints, which may have limited our ability to discriminate among treatments. Miola et al. [45] cautioned that passive sampling tends to underestimate NH3 concentrations compared to dynamic chamber and other methods, but deploying passive samplers immediately after manure application can help offset underestimation of NH3-N [38,45].

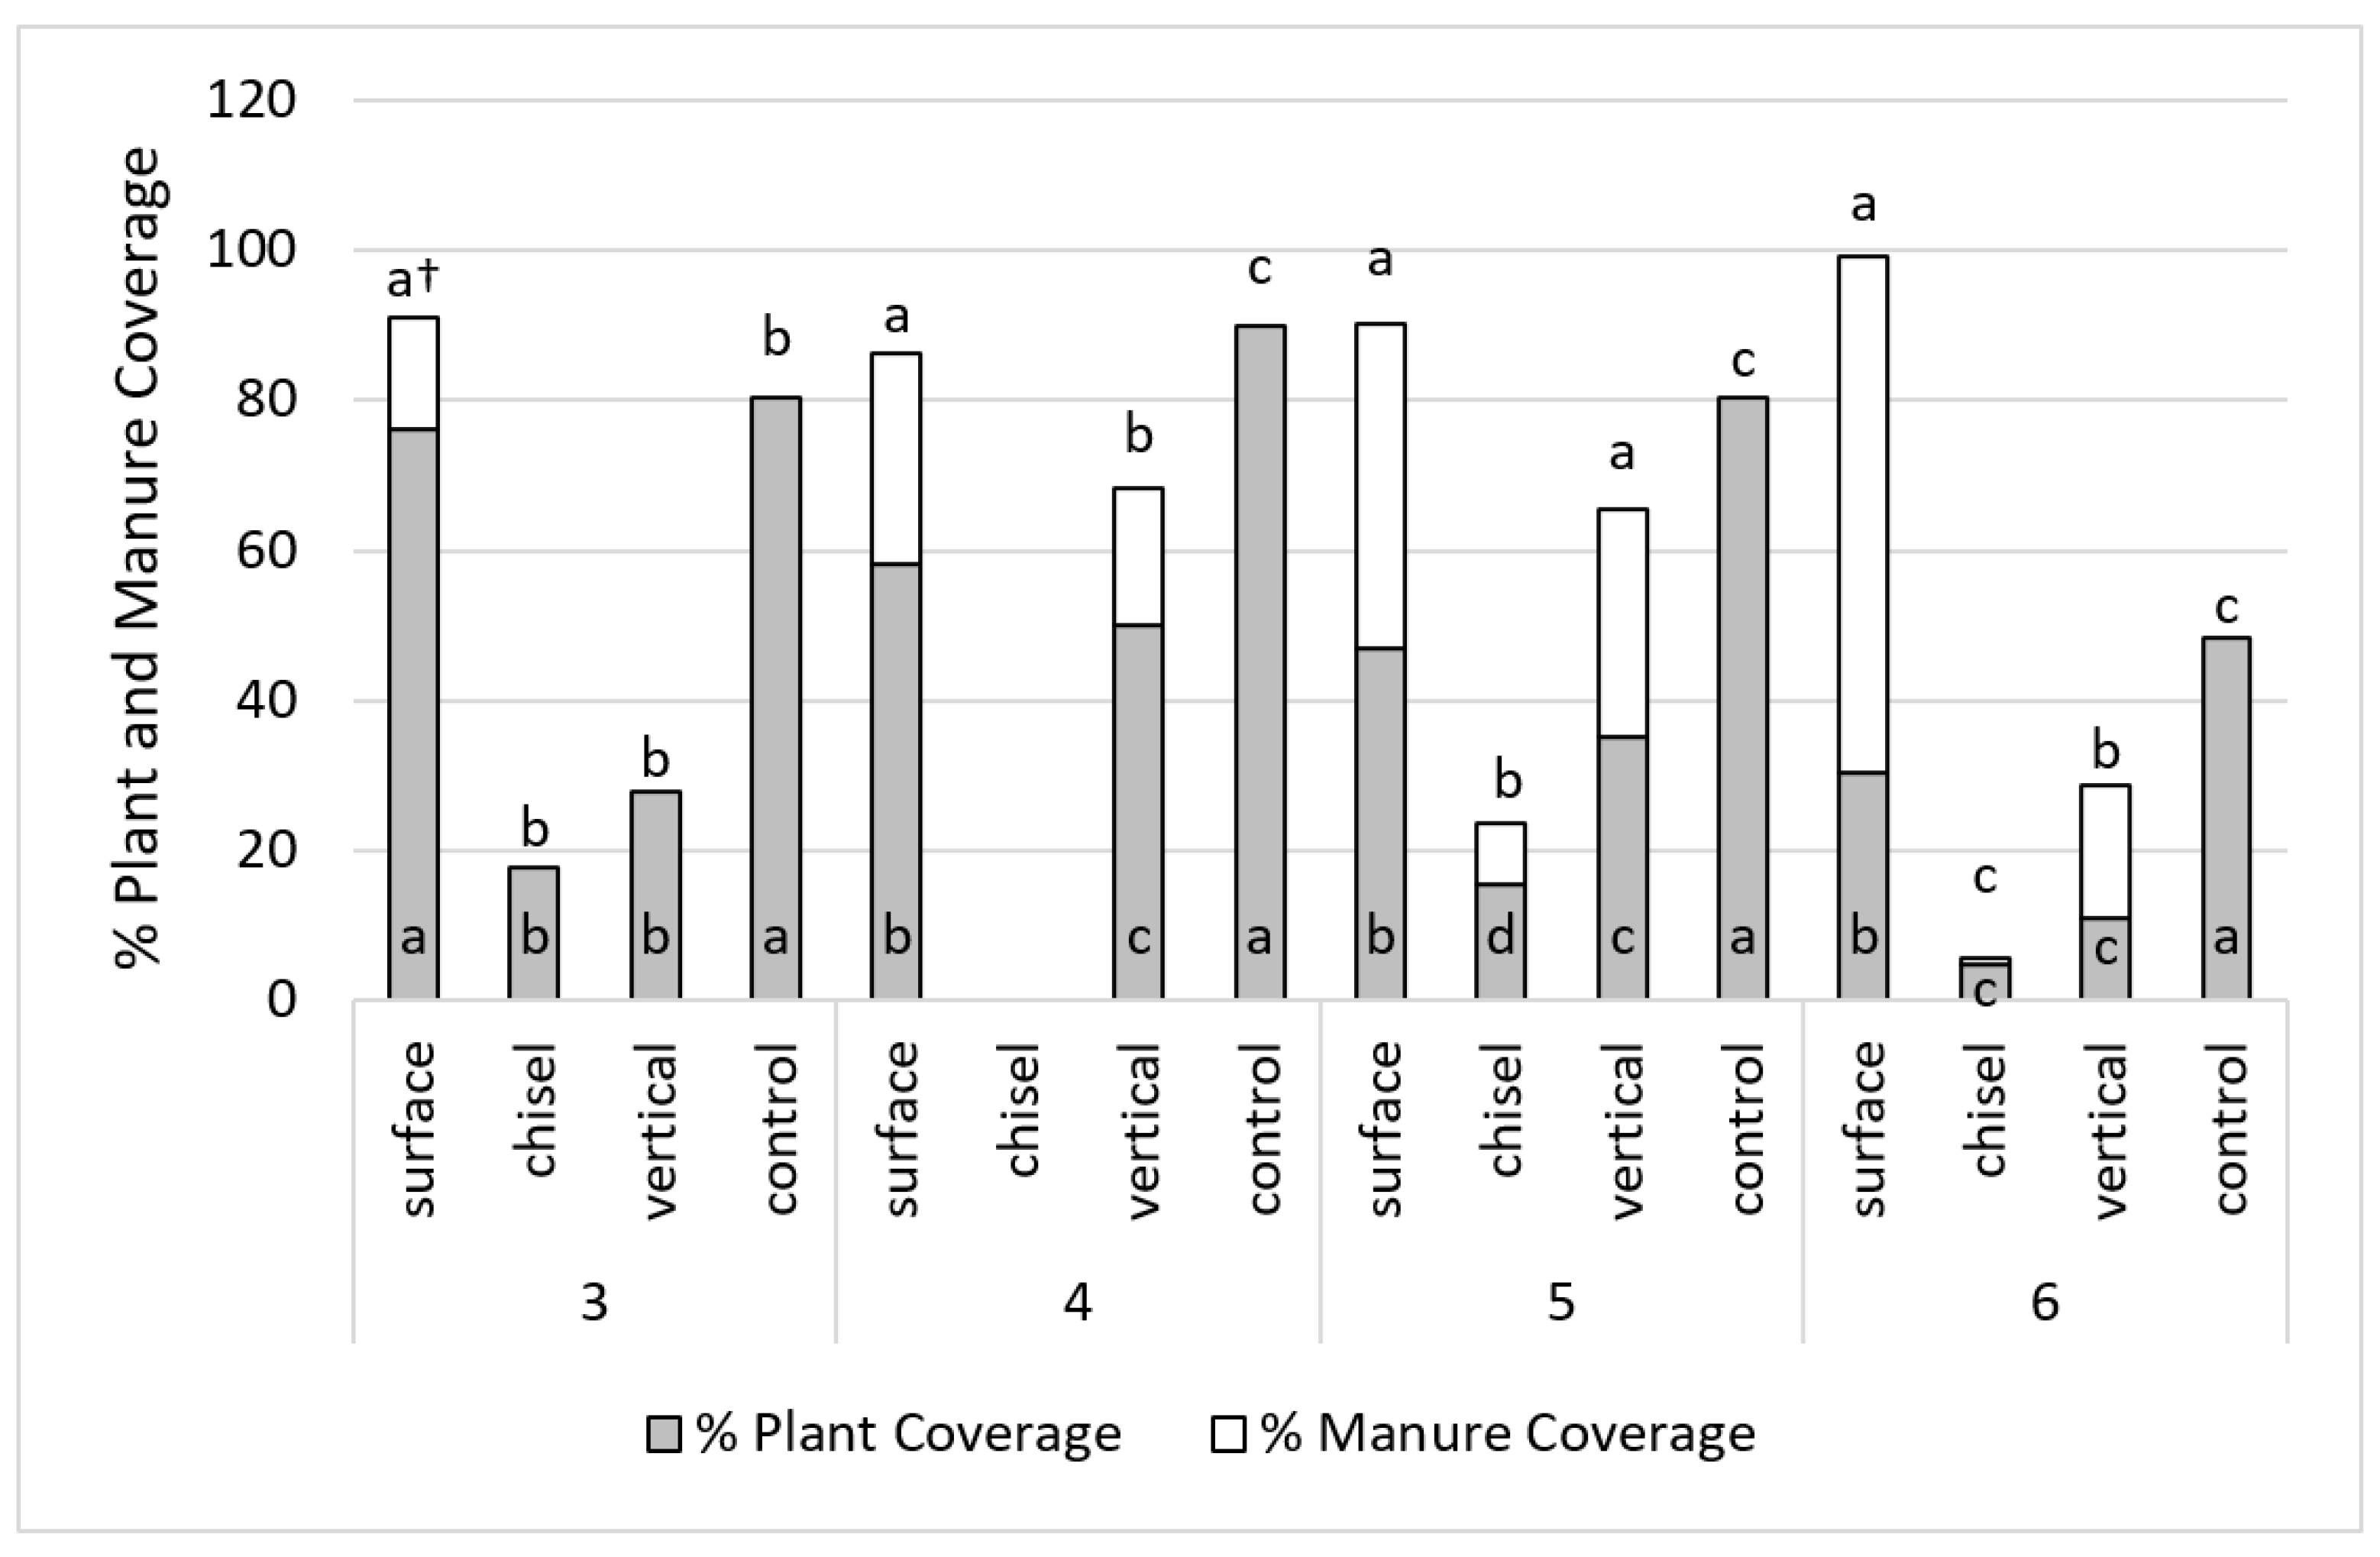
3.4. Impact of Crop Residue and Manure Coverage on NH3-N Concentrations

The incorporation of manure and manure-coated residues can both be important factors in limiting NH3 loss as residue may increase surface area available for volatilization and keep liquid manure from moving into soils. Estimated crop residue coverage for VT and CP as a percentage of control plot residue coverage was 39 and 22% averaged across the trials, respectively (Figure 3). The VT implement used for Trials 5 and 6 was slightly less aggressive at moving soil and left a higher percentage of manure on the surface, but VT still maintained approximately twice the residue coverage compared to CP in those trials (Figure 3). Other studies in Midwestern corn production systems show that VT depth and soil type can affect residue amounts remaining on the surface after tillage [26,33,44]. The lower starting residue coverage in our trials compared to some other studies is likely related to the fact that fields were used for silage as well as grain production and were field cultivated at least once per year.
While consistently applied across trials, we caution that our residue and manure coverage approach classified residues coated with manure as manure, since it could contribute to NH3-N concentrations measured immediately above the soil, which may have underestimated total residue coverage. While residue coverage was not significantly correlated with NH3-N concentrations, manure coverage was significantly correlated with NH3-N concentrations for 0 to 24 h (r = 0.56, p < 0.0001) and 24 to 48 h (r = 0.85, p < 0.0001) sampling periods, indicating the importance of adequately incorporating manure into the soil to substantially decrease NH3 concentrations.
Additionally, differences in manure types and dry matter solids affect manure’s movement into the soil and its propensity to remain on crop residue, and, therefore, for NH3 volatilization losses [20,44,46]. Our results support the idea of a minimum threshold of soil-manure interaction that must be met to substantially reduce NH3 concentrations from manure applications. The proper combination of tillage and residue levels for a given field to reduce NH3 concentrations and increase soil-bound NH4+ depends on multiple considerations and the proper selection and setup of manure application and tillage implements. In addition to detailed crop history and N input records for manure and fertilizer, manure N contents should be routinely measured to estimate total and ammonium-N inputs for agronomic and environmental NH3 assessments. Future studies that combine field-scale NH3 measurements with process-based models and/or tools capable of better accounting for the multiple processes impacting NH3 loss (manure application method/timing, soil properties, and meteorological factors) will assist farm sustainability efforts by improving prediction capability in multiple environments and creating big datasets to guide farm management for optimizing N use efficiency [42,44,47].

4. Conclusions

Results from our trials indicate that incorporating manure in corn fields with vertical tillage or chisel plowing resulted in similar NH3-N concentrations measured in the air immediately above soil during the first 24 h after application, despite differences in manure composition and weather conditions. Vertical tillage maintained greater surface coverage of crop residue than chisel plowing. Our research highlights the importance of incorporating dairy manure to reduce airborne NH3-N concentrations as part of an overall strategy to mitigate NH3-N loss from manured agricultural soils. Using vertical tillage tools to incorporate manure shows promise for mitigating NH3-N concentrations, while conserving more crop residue and causing less soil disturbance compared to chisel plowing and more traditional forms of tillage. A wide range of vertical tillage tools are available on the market today to agricultural producers, offering an array of customized features and settings to control the level of incorporation and crop residue remaining on the surface. Our findings also highlight the importance of incorporating manure to reduce NH3 concentrations and the impact of weather conditions on background NH3-N concentrations as well as the overall effectiveness of incorporation to mitigate NH3 concentrations. Moreover, the results stress the need for additional research and the development of prediction tools to better manage NH3 in agricultural soils and aid producers in the calculation of N availability and loss on a field scale.

Author Contributions

Conceptualization, W.E.J. and J.F.S. methodology, W.E.J. and J.F.S.; software, J.F.S.; validation, E.O.Y. and J.F.S.; formal analysis, J.F.S. and E.O.Y.; investigation, J.F.S.; data curation, J.F.S. and W.E.J.; writing—original draft preparation, J.F.S. and E.O.Y.; writing—review and editing, E.O.Y. and J.F.S.; visualization, J.F.S.; project administration, W.E.J. and E.O.Y. All authors have read and agreed to the published version of the manuscript.

Funding

This research received no external funding.

Data Availability Statement

No new data were created or analyzed in this study. Data sharing is not applicable to this article.

Acknowledgments

We appreciate the cooperation and assistance from the Marshfield Agricultural Research Station staff in Stratford, WI, USA.

Conflicts of Interest

The authors declare no conflict of interest.

References

  1. Apsimon, H.M.; Kruse, M.; Bell, J.N.B. Ammonia emissions and their role in acid deposition. Atmos. Environ. 1987, 21, 1939–1946. [Google Scholar] [CrossRef]
  2. IPCC. Guidelines for National Greenhouse Gas Inventories; Agriculture, Forestry and Other Land Use; Intergovernmental Panel on Climate Change: Geneva, Switzerland, 2006; Volume 4. [Google Scholar]
  3. Renard, J.J.; Calidonna, S.E.; Henley, M.V. Fate of ammonia in the atmosphere—A review for applicability to hazardous he authors declare no conflict of interest releases. J. Hazard. Mater. 2004, 108, 29–60. [Google Scholar] [CrossRef] [PubMed]
  4. Webb, J.; Pain, B.; Bittman, S.; Morgan, J. The impacts of manure application methods on emissions of ammonia, nitrous oxide and on crop response—A review. Agric. Ecosyst. Environ. 2010, 137, 39–46. [Google Scholar] [CrossRef]
  5. Wulf, S.; Maeting, M.; Clemens, J. Application technique and slurry co-fermentation effects on ammonia, nitrous oxide, and methane emissions after spreading: II. Greenhouse gas emissions. J. Environ. Qual. 2002, 31, 1795–1801. [Google Scholar] [CrossRef] [PubMed]
  6. Huijsmans, J.F.M.; Hol, J.M.G.; Vermeulen, G.D. Effect of application method, manure characteristics, weather and field conditions on ammonia volatilization from manure applied to arable land. Atmos. Environ. 2003, 37, 3669–3680. [Google Scholar] [CrossRef]
  7. Leytem, A.B.; Bjorneberg, D.L.; Sheffield, R.E.; de Haro Marti, M.E. Case study: On-farm evaluation of liquid dairy manure application methods to reduce ammonia losses. Prof. Anim. Sci. 2009, 25, 93–98. [Google Scholar] [CrossRef]
  8. Powell, J.M.; Jokela, W.E.; Misselbrook, T.H. Dairy slurry application method impacts ammonia emission and nitrate leaching in no-till corn silage. J. Environ. Qual. 2011, 40, 388–392. [Google Scholar] [CrossRef]
  9. Dell, C.J.; Kleinman, P.J.A.; Schmidt, J.P.; Beegle, D.B. Low-disturbance manure incorporation effects on ammonia and nitrate loss. J. Environ. Qual. 2012, 41, 928–937. [Google Scholar] [CrossRef]
  10. Webb, J.; Thorman, R.E.; Fernanda-Aller, M.; Jackson, D.R. Emission factors for ammonia and nitrous oxide emissions following immediate manure incorporation on two contrasting soil types. Atmos. Environ. 2014, 82, 280–287. [Google Scholar] [CrossRef]
  11. Sherman, J.F.; Young, E.O.; Cavadini, J. Tillage and liquid dairy manure effects on overland flow nitrogen and phosphorus loss potential in an upper Midwest corn silage-winter triticale cropping system. Agronomy 2021, 11, 1775. [Google Scholar] [CrossRef]
  12. Sherman, J.F.; Young, E.O.; Jokela, W.E.; Cavadini, J. Impacts of low-disturbance dairy manure incorporation on ammonia and greenhouse gas fluxes in a corn silage–winter rye cover crop system. J. Environ. Qual. 2021, 50, 836–846. [Google Scholar] [CrossRef] [PubMed]
  13. Sherman, J.; Young, E.O.; Jokela, W.E.; Cavadini, J. Impacts of low disturbance liquid dairy manure incorporation on alfalfa yield and fluxes of ammonia, nitrous oxide, and methane. Agriculture 2021, 11, 750. [Google Scholar] [CrossRef]
  14. Pain, B.F.; Phillips, V.R.; Clarkson, C.R.; Klarenbeek, J.V. Loss of nitrogen through ammonia volatilisation during and following the application of pig or cattle slurry to grassland. J. Sci. Food Agric. 1989, 47, 1–12. [Google Scholar] [CrossRef]
  15. Thompson, R.B.; Pain, B.F.; Rees, Y.J. Ammonia volatilization from cattle slurry following surface application to grassland: II. Influence of application rate, wind speed and applying slurry in narrow bands. Plant Soil 1990, 125, 119–128. [Google Scholar] [CrossRef]
  16. Huijsmans, J.F.M.; Hol, J.M.G.; Hendriks, M.M.W.B. Effect of application technique, manure characteristics, weather and field conditions on ammonia volatilization from manure applied to grassland. Neth. J. Agric. Sci. 2001, 49, 323–342. [Google Scholar] [CrossRef] [Green Version]
  17. Hanna, H.M.; Bundy, D.S.; Lorimor, J.C.; Mickelson, S.K.; Melvin, S.W.; Erbach, D.C. Manure incorporation equipment effects on odor, residue cover, and crop yield. Appl. Eng. Agric. 2000, 16, 621–627. [Google Scholar] [CrossRef]
  18. Shelton, D.P. Crop residue cover and manure incorporation Part I: Reduction of percent cover. Appl. Eng. Agric. 2004, 20, 605–611. [Google Scholar] [CrossRef]
  19. Kovar, J.L.; Moorman, T.B.; Singer, J.W.; Cambardella, C.A.; Tomer, M.D. Swine manure injection with low-disturbance applicator and cover crops reduce phosphorus losses. J. Environ. Qual. 2011, 40, 329–336. [Google Scholar] [CrossRef]
  20. Frost, J.P. Effect of spreading method, application rate and dilution on ammonia volatilization from cattle slurry. Grass Forage Sci. 1994, 49, 391–400. [Google Scholar] [CrossRef]
  21. Sommer, S.G.; Hutchings, N.J. Ammonia emission from field applied manure and its reduction—Invited paper. Eur. J. Agron. 2001, 15, 1–15. [Google Scholar] [CrossRef]
  22. Brunke, R.P.; Schuepp, A.P.; Gordon, R. Effect of meteorological parameters on ammonia loss from manure in the field. J. Environ. Qual. 1988, 17, 431–436. [Google Scholar] [CrossRef]
  23. Sommer, S.G.; Olesen, J.E. Effects of dry matter content and temperature on ammonia loss from surface applied cattle slurry. J. Environ. Qual. 1991, 20, 679–683. [Google Scholar] [CrossRef]
  24. Sommer, S.G.; Olesen, J.E.; Christensen, B.T. Effects of temperature, wind speed and air humidity on ammonia volatilization from surface applied cattle slurry. J. Agric. Sci. 1991, 117, 91–100. [Google Scholar] [CrossRef]
  25. Moal, J.F.; Martinez, J.; Guiziou, F.; Coste, C.M. Ammonia volatilization following surface applied pig and cattle slurry in France. J. Agric. Sci. 1995, 125, 245–252. [Google Scholar] [CrossRef]
  26. CTIC. National Crop Residue Management Survey; Conservation Tillage Information Center: West Lafayette, IN, USA, 2016. [Google Scholar]
  27. Kern, J.S.; Johnson, M.G. Conservation tillage impacts on national soil and atmospheric carbon levels. Soil Sci. Soc. Am. J. 1993, 57, 200–210. [Google Scholar] [CrossRef]
  28. West, T.O.; Post, W.M. Soil organic carbon sequestration rates by tillage and crop rotation: A global data analysis. Soil Sci. Soc. Am. J. 2002, 66, 1930–1946. [Google Scholar] [CrossRef] [Green Version]
  29. Jacobs, A.; Rauber, R.; Ludwig, B. Impact of reduced tillage on carbon and nitrogen storage of two Haplic Luvisols after 40 years. Soil Till. Res. 2009, 102, 158–164. [Google Scholar] [CrossRef]
  30. Kushwaha, C.P.; Tripathi, C.P.; Singh, K.P. Soil organic matter and water-stable aggregates under different tillage and residue conditions in a tropical dryland agroecosystem. Appl. Soil Ecol. 2001, 16, 229–241. [Google Scholar] [CrossRef]
  31. Mueller, D.H.; Klemme, R.M.; Daniel, T.C. Short and long-term cost comparisons of conventional tillage systems in corn production. J. Soil Water Conserv. 1985, 40, 466–470. [Google Scholar]
  32. Schuler, R.T. Residue Management-Horizontal vs. Vertical Tillage. In Wisconsin Fertilizer, Aglime and Pest Management Conference; University of Wisconsin Extension: Madison, WI, USA, 2007; Volume 46, pp. 179–181. [Google Scholar]
  33. Klingsberg, K.; Weisenbeck, C. Shallow vertical tillage: Impact on soil disturbance and crop residue. In Wisconsin Crop Management Conference; University of Wisconsin: Madison, WI, USA, 2011; Volume 50, pp. 46–49. [Google Scholar]
  34. Peters, J. Recommended Methods of Manure Analysis; Extension, Ed.; University of Wisconsin: Madison, WI, USA, 2003. [Google Scholar]
  35. Schulte, E.E.; Hopkins, B.G. Estimation of soil organic matter by weight 3. Organic matter (LOI) loss-on-ignition. In Soil Organic Matter: Analysis and Interpretation; Magdoff, F.R., Tabatabai, M.A., Hanlon, E.A., Jr., Eds.; Soil Science Society of America, Inc.: Madison, WI, USA, 1996; pp. 21–31. [Google Scholar]
  36. Lachat Instruments. Determination of Ammonia (Salicylate) in 2M KCl Soil Extracts by Flow Injection Analysis; QuikChem Method 12-107-06-2-A.; Lachat Instruments: Loveland, CO, USA, 1993. [Google Scholar]
  37. Booth, D.T.; Cox, S.E.; Berryman, R.D. Point sampling digital imagery with SamplePoint. Environ. Monit. Assess. 2006, 123, 97–108. [Google Scholar] [CrossRef]
  38. Roadman, M.J.; Scudlark, J.R.; Meisinger, J.J.; Ullman, W.J. Validation of Ogawa passive samplers for the determinations of gaseous ammonia concentrations in agricultural settings. Atmos. Environ. 2003, 37, 2317–2325. [Google Scholar] [CrossRef]
  39. Lachat Instruments. Determination of Ammonia by Flow Injection Analysis; QuikChem Method 10-107-06-2-A.; Lachat Instruments: Loveland, CO, USA, 2003. [Google Scholar]
  40. SAS Institute Inc. SAS 9.4 Guide to Software Updates; SAS Institute Inc.: Cary, NC, USA, 2013. [Google Scholar]
  41. Scudlark, J.R.; Jennings, J.A.; Roadman, M.J.; Savidge, K.B.; Ullman, W.J. Atmospheric nitrogen inputs to the Delaware inland bays: The role of ammonia. Environ. Pollut. 2005, 135, 433–444. [Google Scholar] [CrossRef] [PubMed]
  42. Pleim, J.E.; Ran, L.; Appel, W.; Shephard, M.W.; Cady-Pereira, K. New bidirectional ammonia flux model in an air quality model coupled with an agricultural model. J. Adv. Model. Earth Syst. 2019, 11, 2934–2957. [Google Scholar] [CrossRef] [Green Version]
  43. Zhang, T.; Liu, H.; Luo, J.; Wang, H.; Zhai, L.; Geng, Y.; Zhang, Y.; Li, J.; Lei, Q.; Bashir, M.A.; et al. Long-term manure application increased greenhouse gas emissions but had no effect on ammonia volatilization in a Northern China upland field. Sci. Total Environ. 2018, 633, 230–239. [Google Scholar] [CrossRef] [PubMed]
  44. Ramanantenasoa, M.M.J.; Génermont, S.; Gilliot, J.-M.; Bedos, C.; Makowski, D. Meta-modeling methods for estimating ammonia volatilization from nitrogen fertilizer and manure applications. J. Environ. Manag. 2019, 236, 195–205. [Google Scholar] [CrossRef]
  45. Miola, E.C.C.; Aita, C.; Rochette, P.; Chantigny, M.H.; Angers, D.A.; Bertrand, N.; Gasser, M.O. Static chamber measurements of ammonia volatilization from manured soils: Impact of deployment duration and manure characteristics. Soil Sci. Soc. Am. J. 2014, 79, 305–313. [Google Scholar] [CrossRef]
  46. Lorimor, J.; Powers, W.; Sutton, A. Manure Characteristics, 2nd ed.; MWPS-18 Section 1; Manure Management System Series; Michigan State University Extension: East Lansing, MI, USA, 2006. [Google Scholar]
  47. Ramanantenasoa, M.M.J.; Gilliot, J.M.; Mignolet, C.; Bedos, C.; Mathias, E.; Eglin, T.; Makowski, D.; Génermont, S. A new framework to estimate spatio-temporal ammonia emissions due to nitrogen fertilization in France. Sci. Total Environ. 2018, 645, 205–219. [Google Scholar] [CrossRef]
Figure 1. Photographs of experimental setup and manure-tillage treatments established in a corn field previously harvested for grain at the research site (Trial 5). Images show the surface/broadcast application without any incorporation (a), manure incorporation by chisel plowing (CP) (b), and manure incorporation by vertical tillage (VT) (c). Dashed white lines show the location of the three samplers directly above the soil surface.
Environments 10 00140 g001
Figure 2. Average ammonia–nitrogen (NH3-N) concentration for each treatment and trial during the first 24 h (top) and second 24 h (bottom, note different y-axis scale) after application. † bars with the same letter within a trial date and time period do not differ at p ≤ 0.1.
Environments 10 00140 g002
Figure 3. Mean plot area (%) covered by crop residue and/or manure for select trials. † bars with the same letter within a trial date are not significantly different at p ≤ 0.1. Differences for within trial plant coverage are shown by letters within the gray bar. Differences for within trial manure coverage are shown by letters above the bar.
Environments 10 00140 g003
Table 1. Trial dates, equipment, residue, and manure type used for the study.
Treatments
TrialDateControlSurfaceChiselCase IH 330Great Plains Turbo Max 1800ResidueManure Type
125 September 2013XX X Silage CornSolid Pack
22 July 2014XXXX OatsSeparated Liquid
311 August 2015XXXX OatsUnagitated Separated Liquid
44 November 2015XX X Grain CornWhole Dairy Slurry
53 May 2016XXX XGrain CornWhole Dairy Slurry
617 May 2016XXX XSilage CornWhole Dairy Slurry
Table 2. Manure composition and nutrients applied for each trial.
TrialDateDM TNTPNH4-NpHRate TNTPNH4-N
% Mg ha−1 kg ha−1
125 September 201329 ± 0.9 †‡1.8 ± 0.060.34 ± 0.040.4 ± 0.18.3 ± 0.1295.34849194
22 July 20141.5 ± 0.056.8 ± 0.201.09 ± 0.004.5 ± 0.27.6 ± 0.0553.6821354
311 August 20155.1 ± 0.13.3 ± 0.050.65 ± 0.031.3 ± 0.08.2 ± 0.0883.91372855
44 November 201522 ± 1.81.6 ± 0.150.30 ± 0.000.7 ± 0.18.1 ± 0.0511041280185
53 May 20168.7 ± 0.603.1 ± 0.250.74 ± 0.001.5 ± 0.17.8 ± 0.1069.61814489
617 May 20166.5 ± 0.13.1 ± 0.080.79 ± 0.011.3 ± 0.057.8 ± 0.2090.91804674
DM = dry matter, TN = total nitrogen, TP = total phosphorus, NH4-N = ammonium-nitrogen. Rate = manure nutrient application rate = nutrient content x manure application rate. †‡ One standard deviation from the mean.
Table 3. Average background soil properties of the control plots for each trial.
TrialDatepHNH4-N MoistureOM
mg kg−1g kg−1
125 September 2013 7.2 ± 0.05 ‡††‡184 ± 2.427 ± 1.7
22 July 20147.0 ± 0.163.7 ± 1.5329 ± 2632 ± 1.4
311 August 20157.0 ± 0.083.2 ± 0.8317 ± 1730 ± 3.4
44 November 20156.3 ± 0.202.6 ± 0.8346 ± 1930 ± 0.5
53 May 20166.8 ± 0.123.4 ± 0.2401 ± 3833 ± 0.8
617 May 20166.7 ± 0.053.7 ± 1.2289 ± 6.235 ± 0.5
Plant-available soil ammonium-nitrogen concentration. Soil organic matter content, ‡† One standard deviation from the mean. †‡ Not measured for the trial.
Table 4. Select meteorological variables for trial dates and Pearson correlation coefficients for relationship to NH3-N concentrations across trials.
TrialDateRelative HumidityTemperatureTotal RainfallWind SpeedWind Gusts
%°Cmmm s−1
125 September 201389140.02.67.4
22 July 201460160.01.33.2
311 August 201573200.00.92.3
44 November 201585148.42.85.2
53 May 20166297.12.04.2
617 May 201652111.30.41.7
Pearson Correlation Coefficients
first 24 h0.55 **−0.510.130.49 *0.56 **
second 24 h0.39−0.270.100.43 *0.55 **
* Significant at p ≤ 0.05. ** Significant at p ≤ 0.01.
Disclaimer/Publisher’s Note: The statements, opinions and data contained in all publications are solely those of the individual author(s) and contributor(s) and not of MDPI and/or the editor(s). MDPI and/or the editor(s) disclaim responsibility for any injury to people or property resulting from any ideas, methods, instructions or products referred to in the content.

