Cartographic Visualization for Indoor Semantic Wayfinding


Abstract
:1. Introduction
2. Related Work
2.1. Landmarks in Routing Instructions
- Process of scoring the suitability of POIs that may serve as landmarks;
- Development of an algorithm for selecting and integrating the suitable landmarks within the routing instruction. This specific approach seemed suitable also in order to be applied on indoor environment
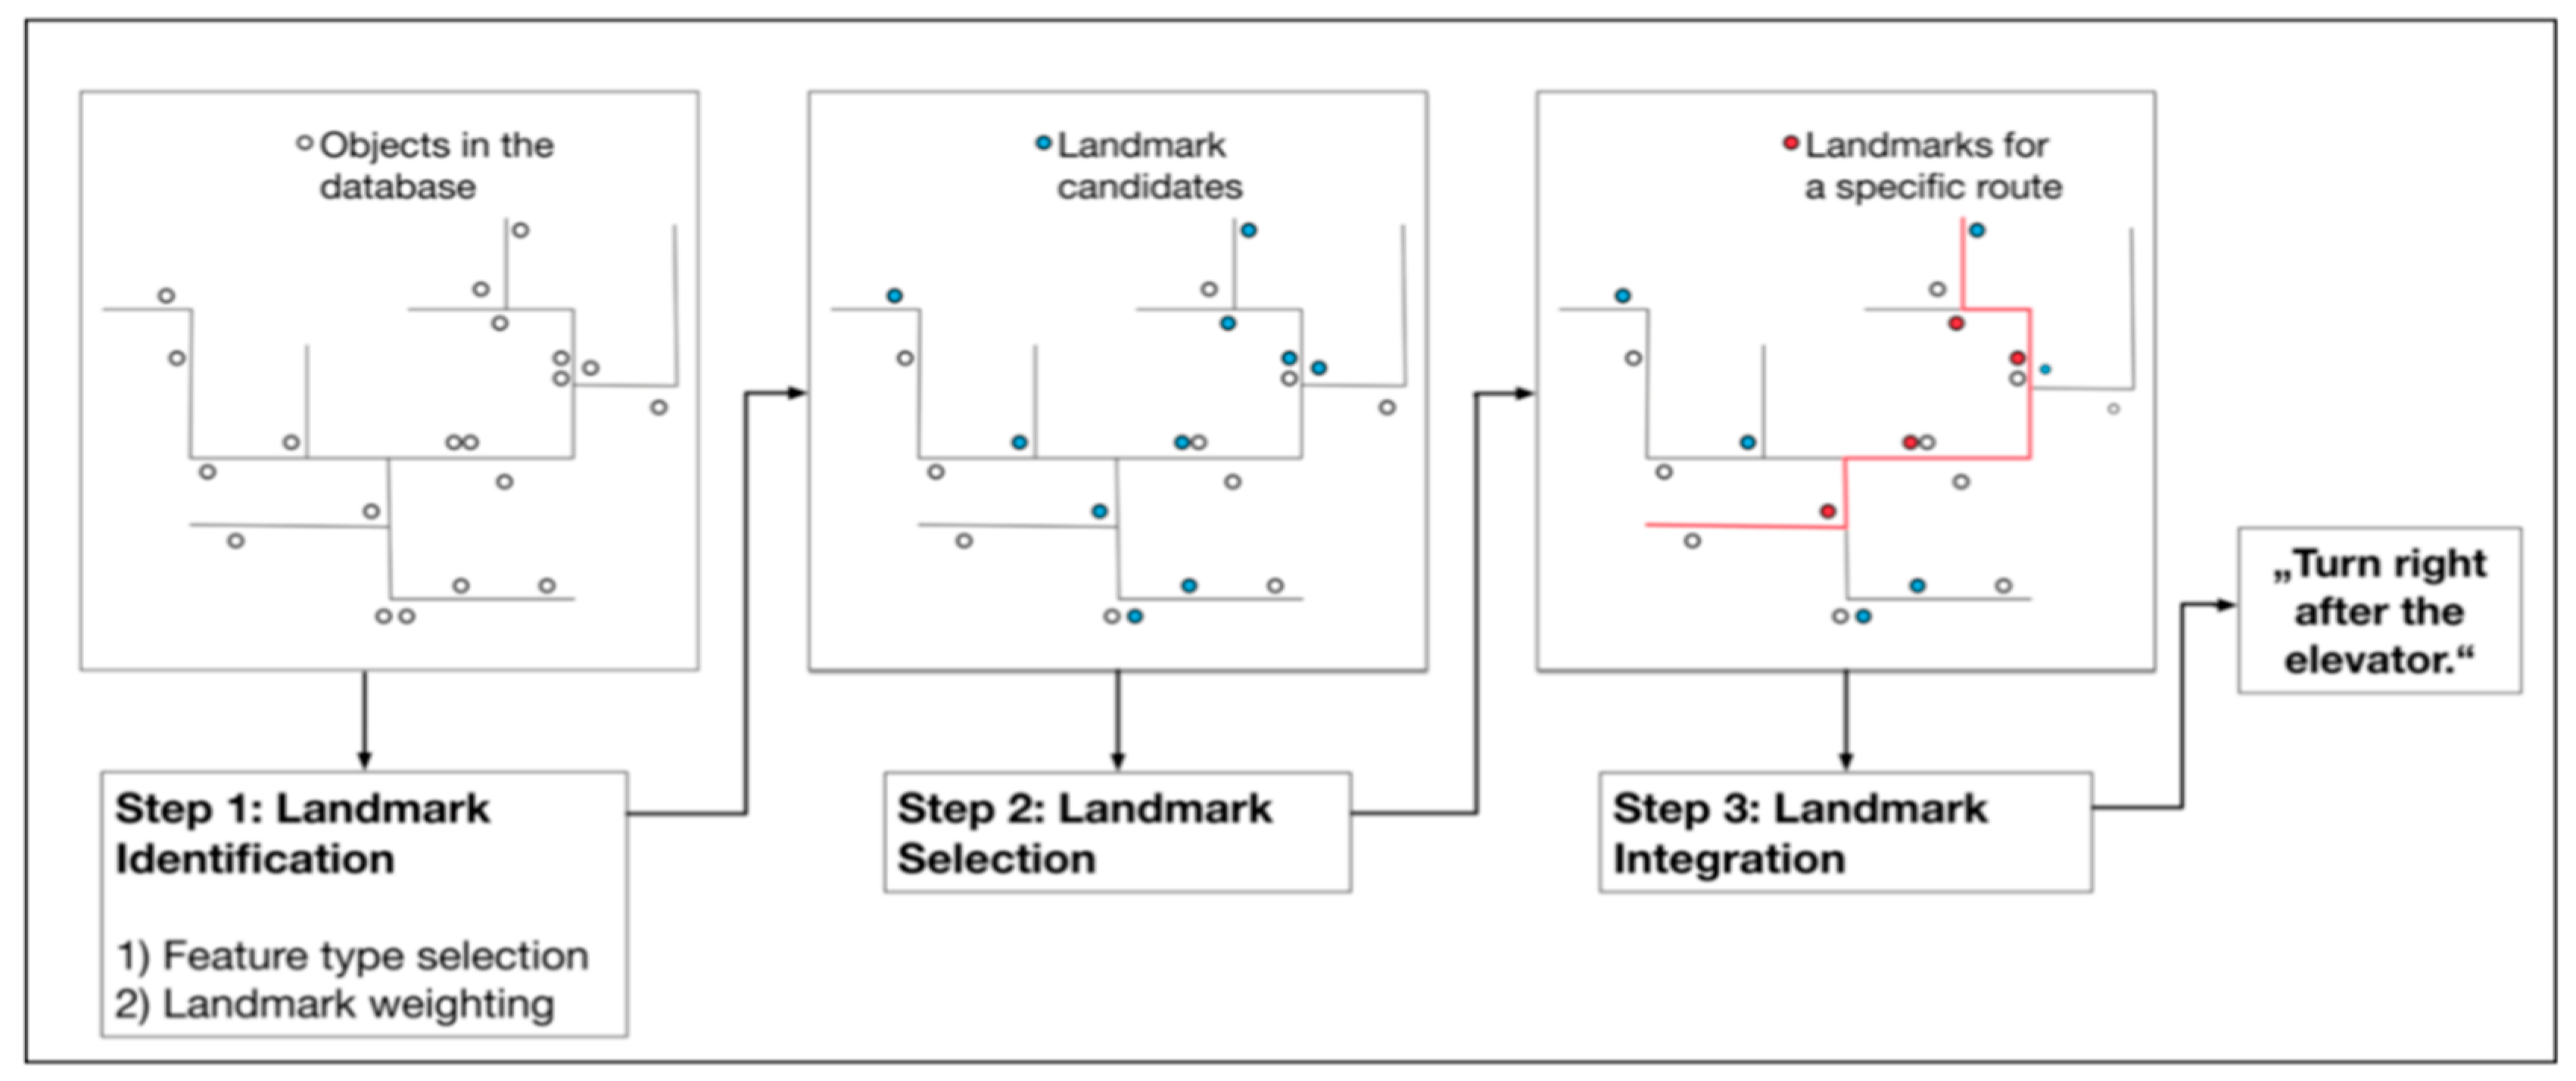
2.2. Indoor Landmark Navigation Model (ILNM)
- Identification of categories of indoor spatial features that may serve as landmarks;
- Landmark selection for a specific path route from a set of candidate landmarks;
- Landmark integration within the route instruction and generation of landmark-based instructions
3. Feasibility Investigation of ILNM (Indoor Landmark Navigation Model)
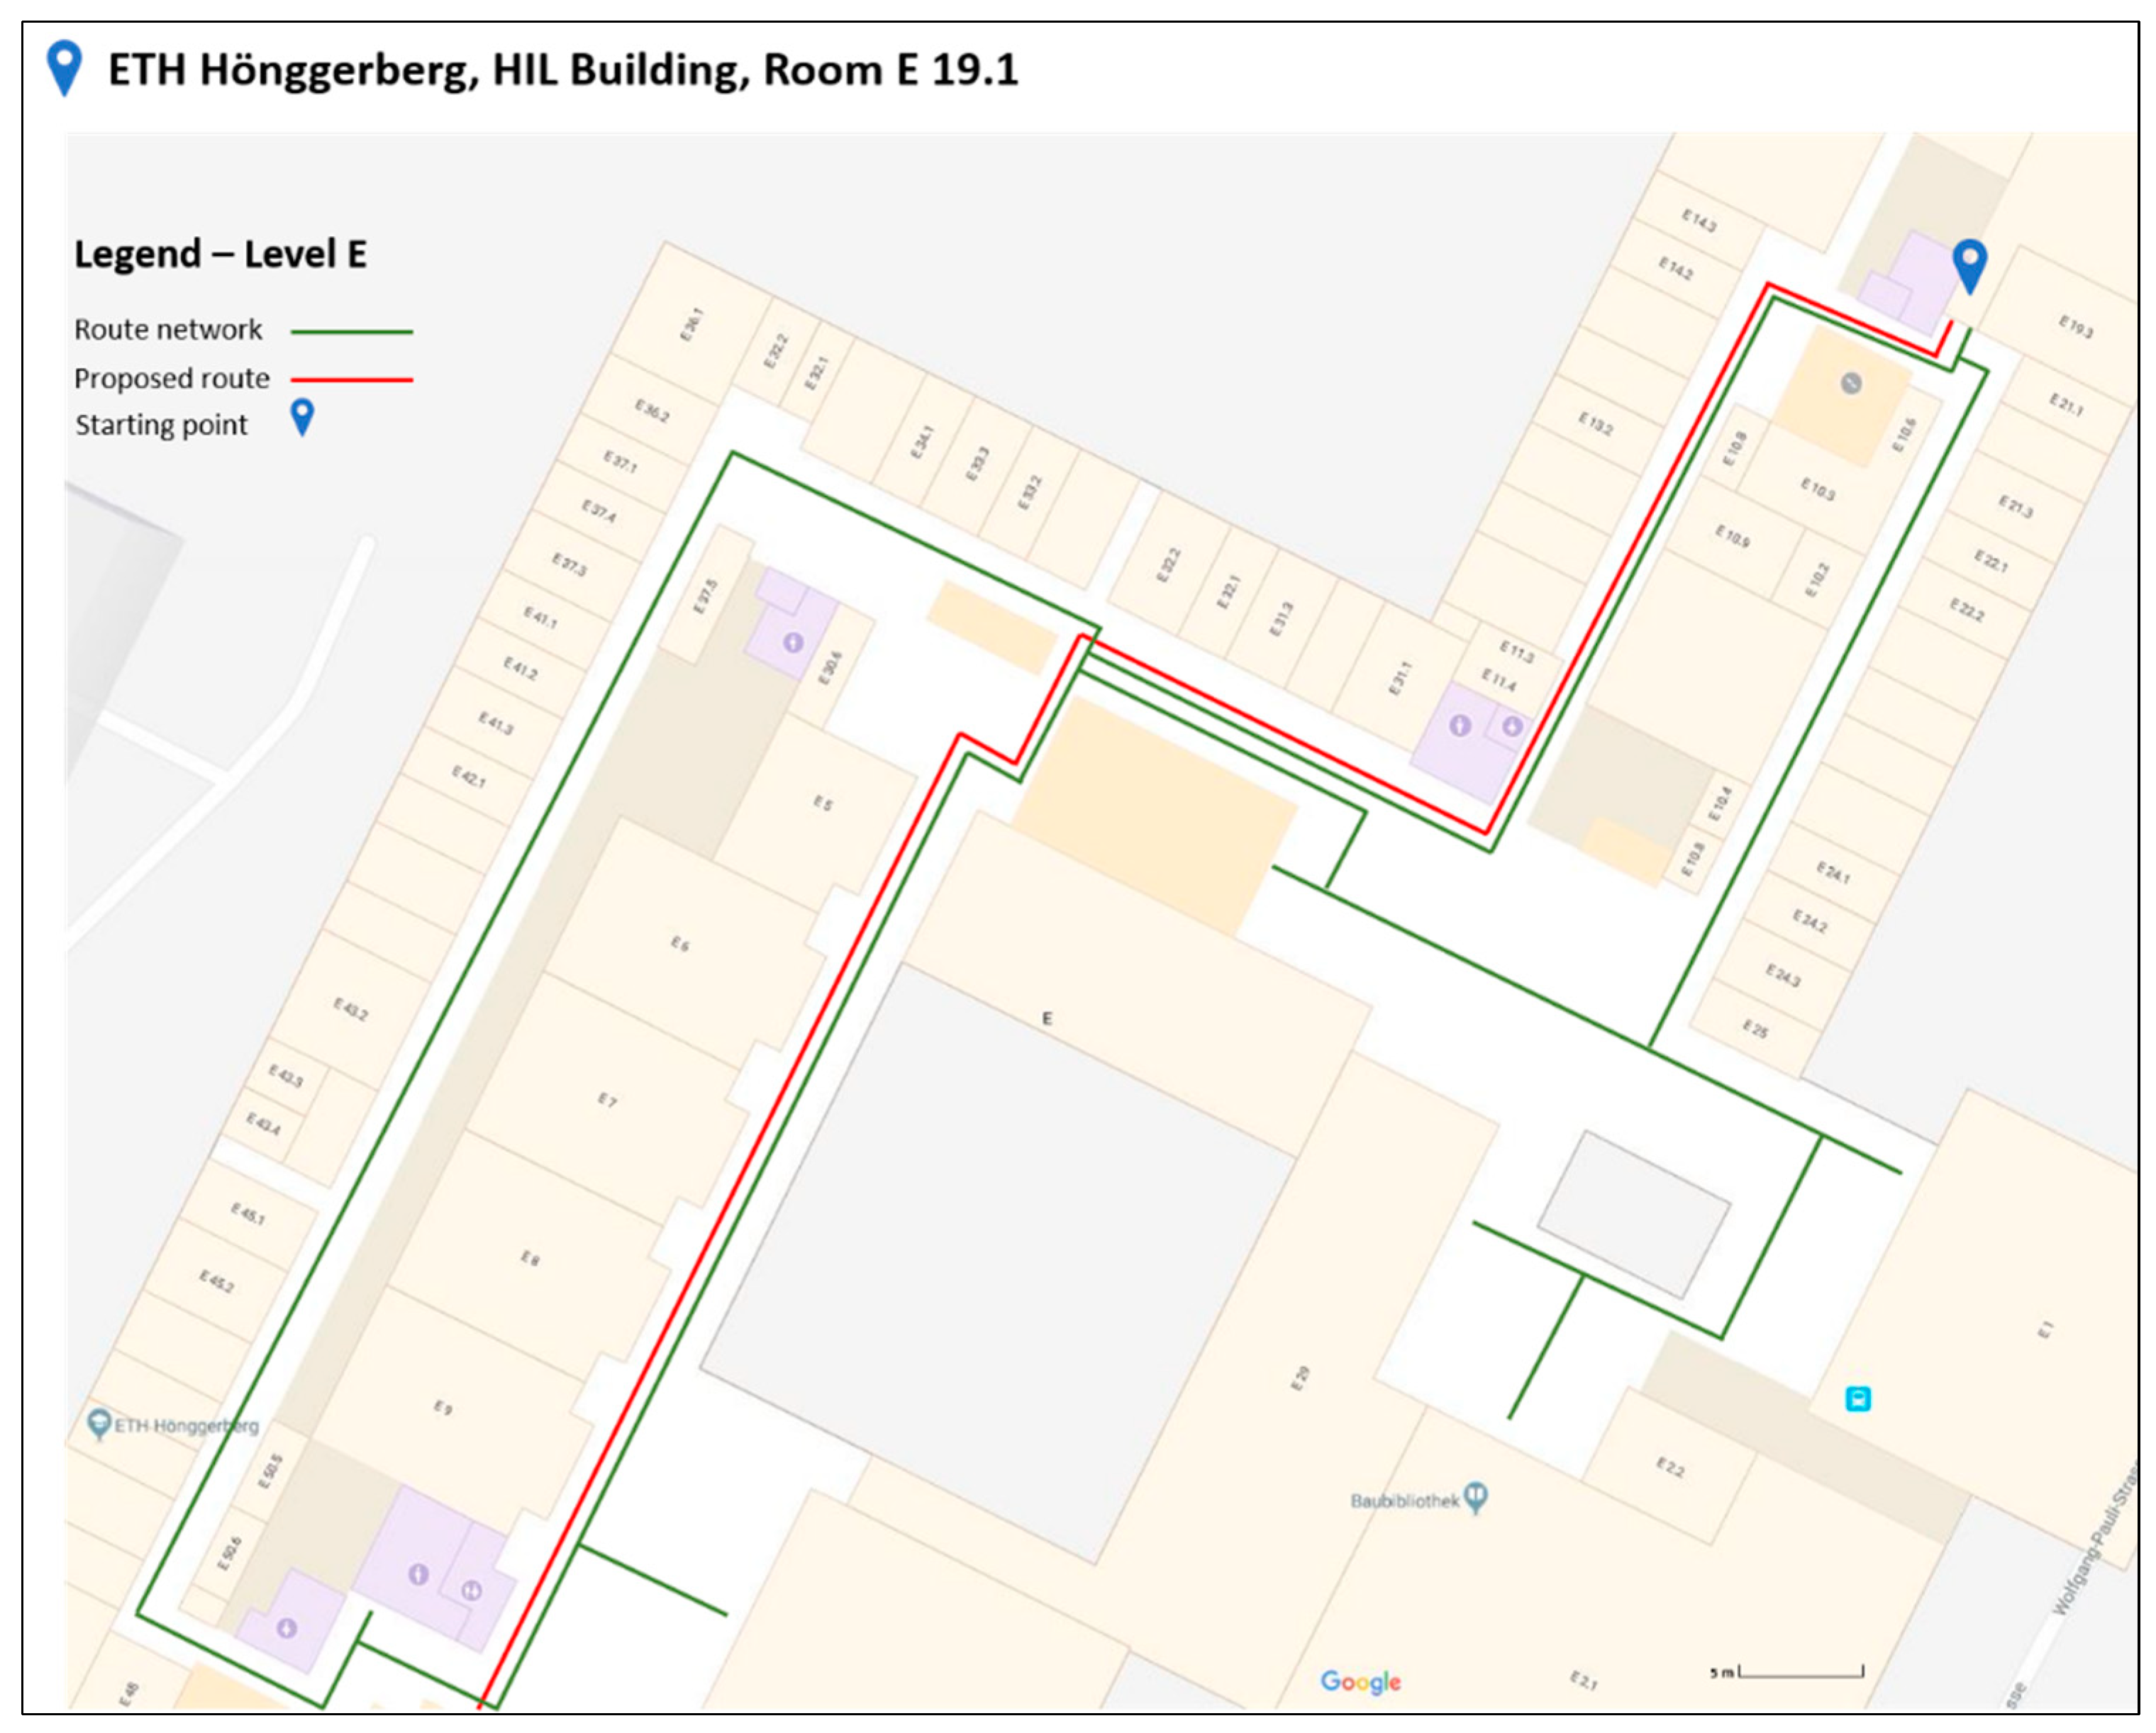
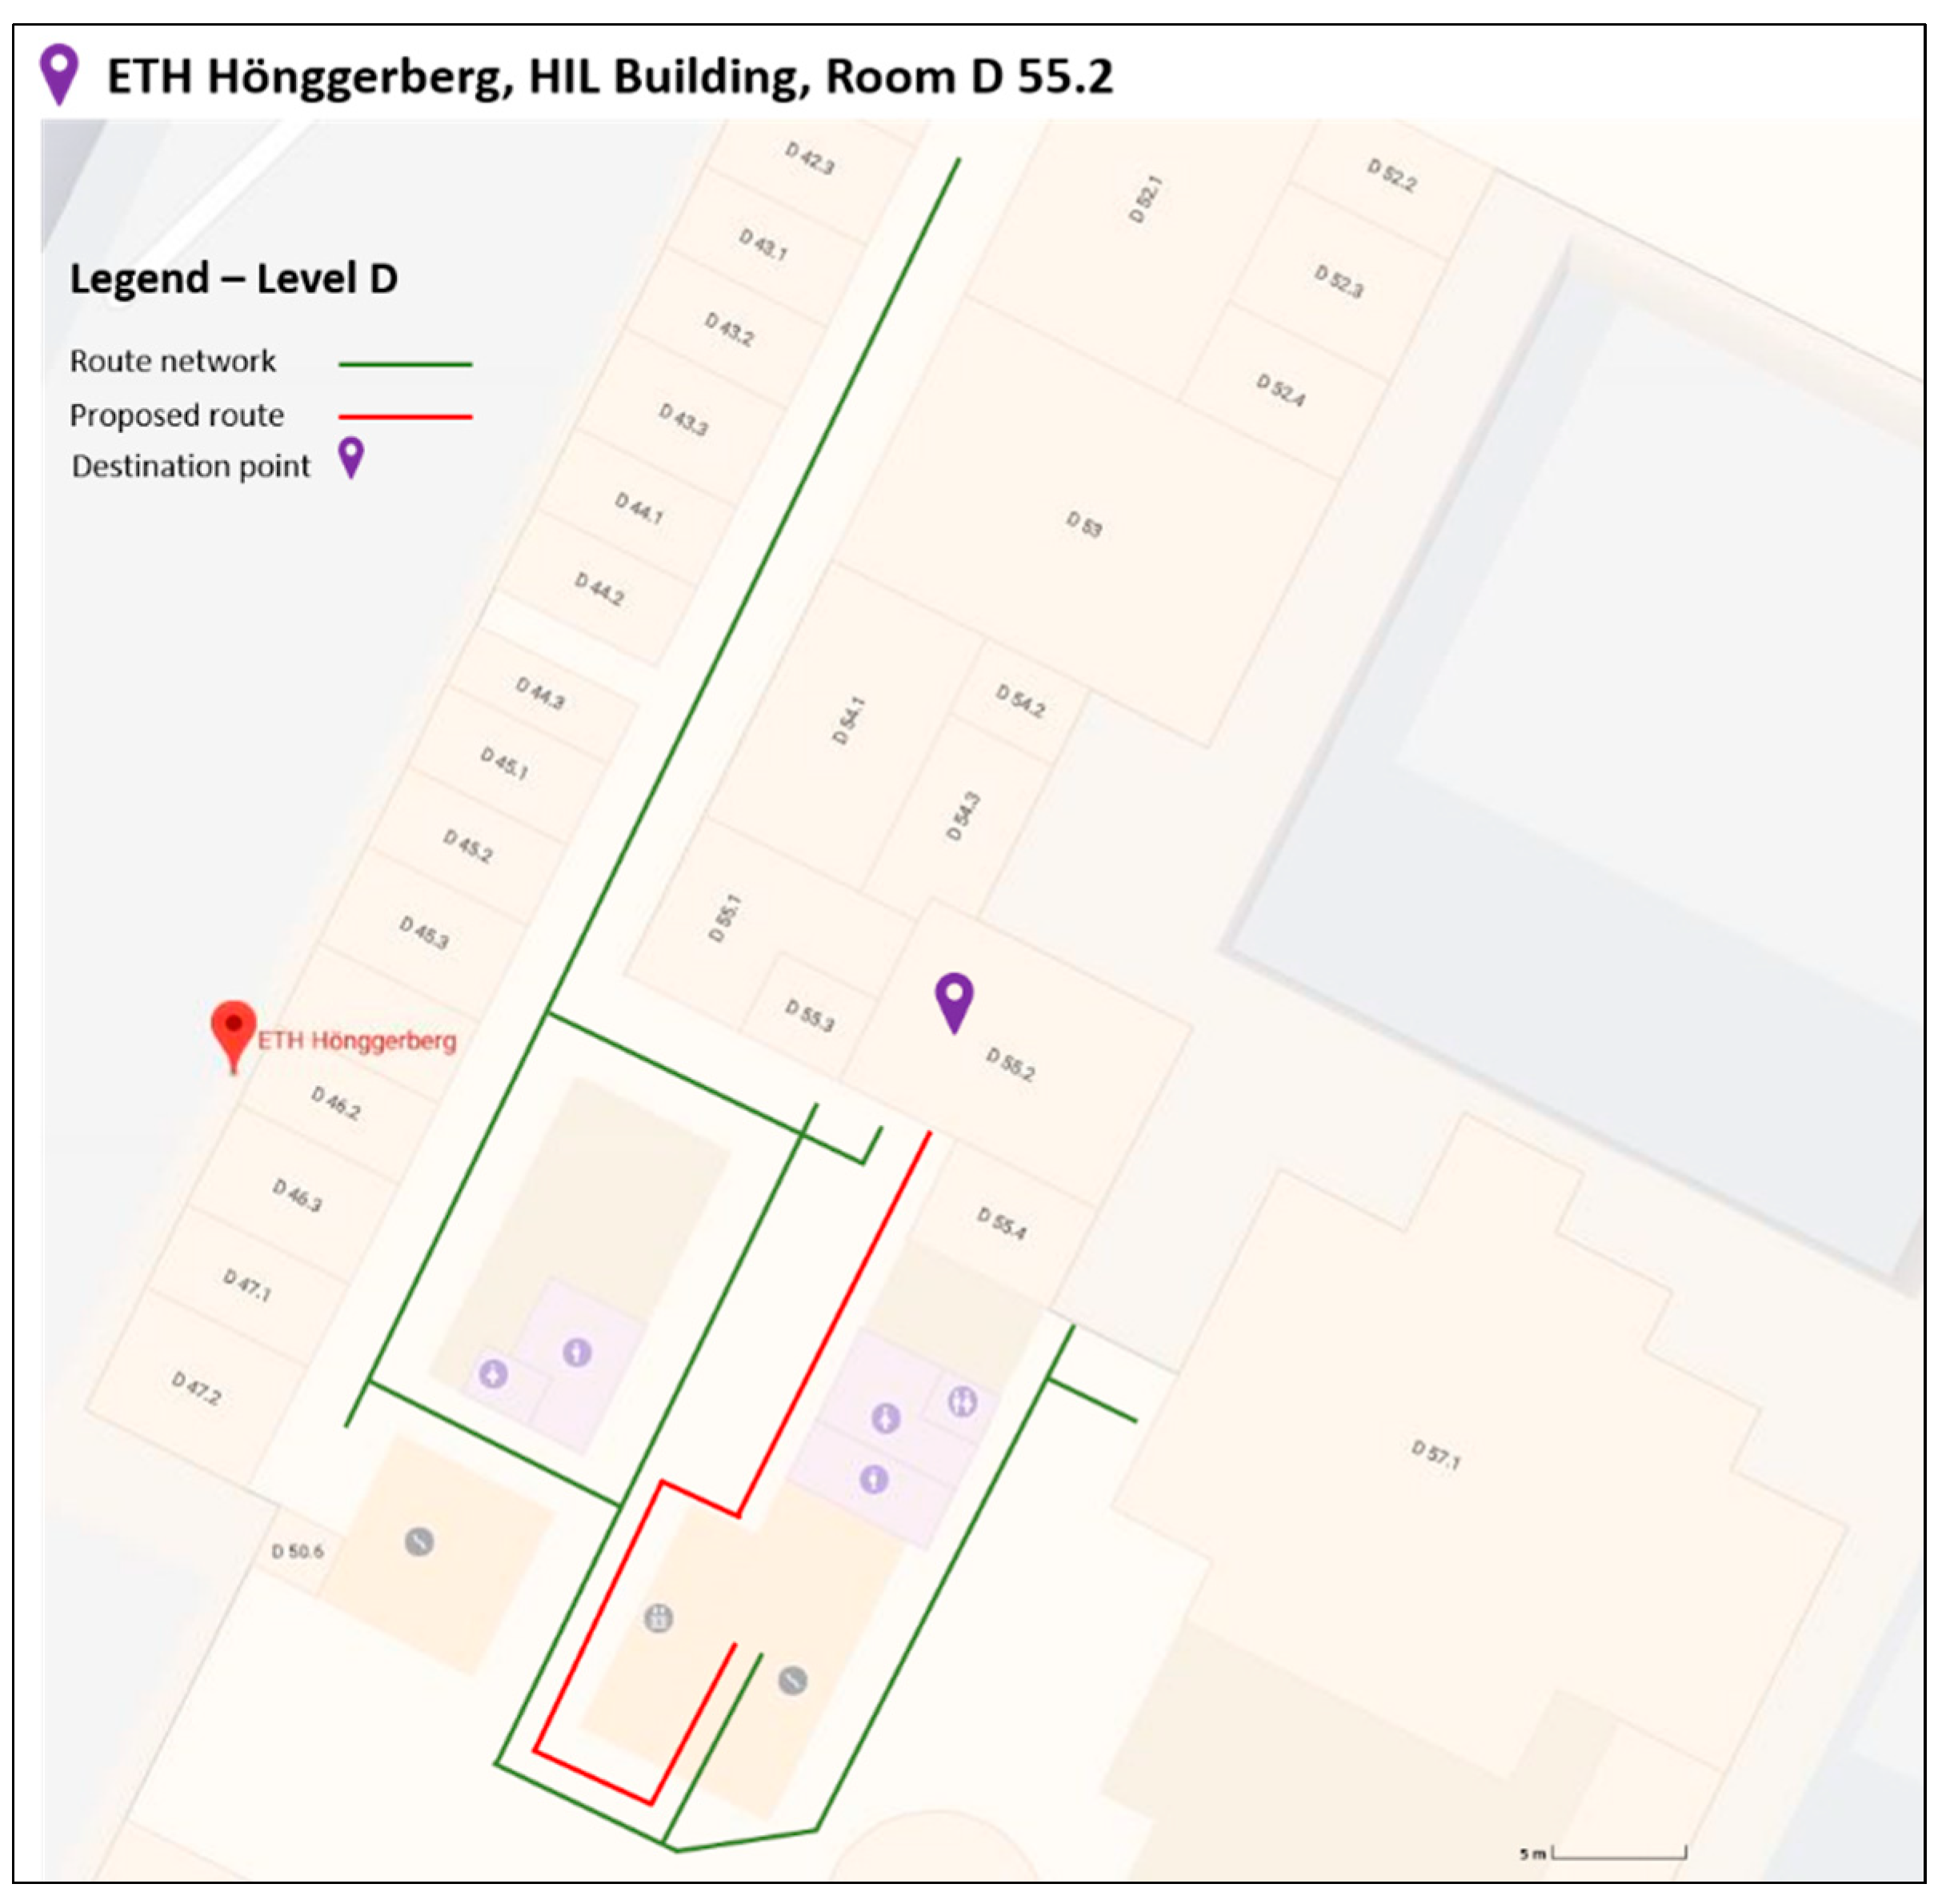
3.1. Selection of Test Area
- Along this route lie many spatial objects that may serve as landmarks. This element was quite crucial in selecting this specific path, since it was quite representative and suitable for applying the proposed algorithm [11].
- Furthermore, the fact of having along the route the element of changing from one level to the one below (from E to D floor), was important in the experiment’s context, to fully investigate the feasibility of the algorithm in a real case scenario.
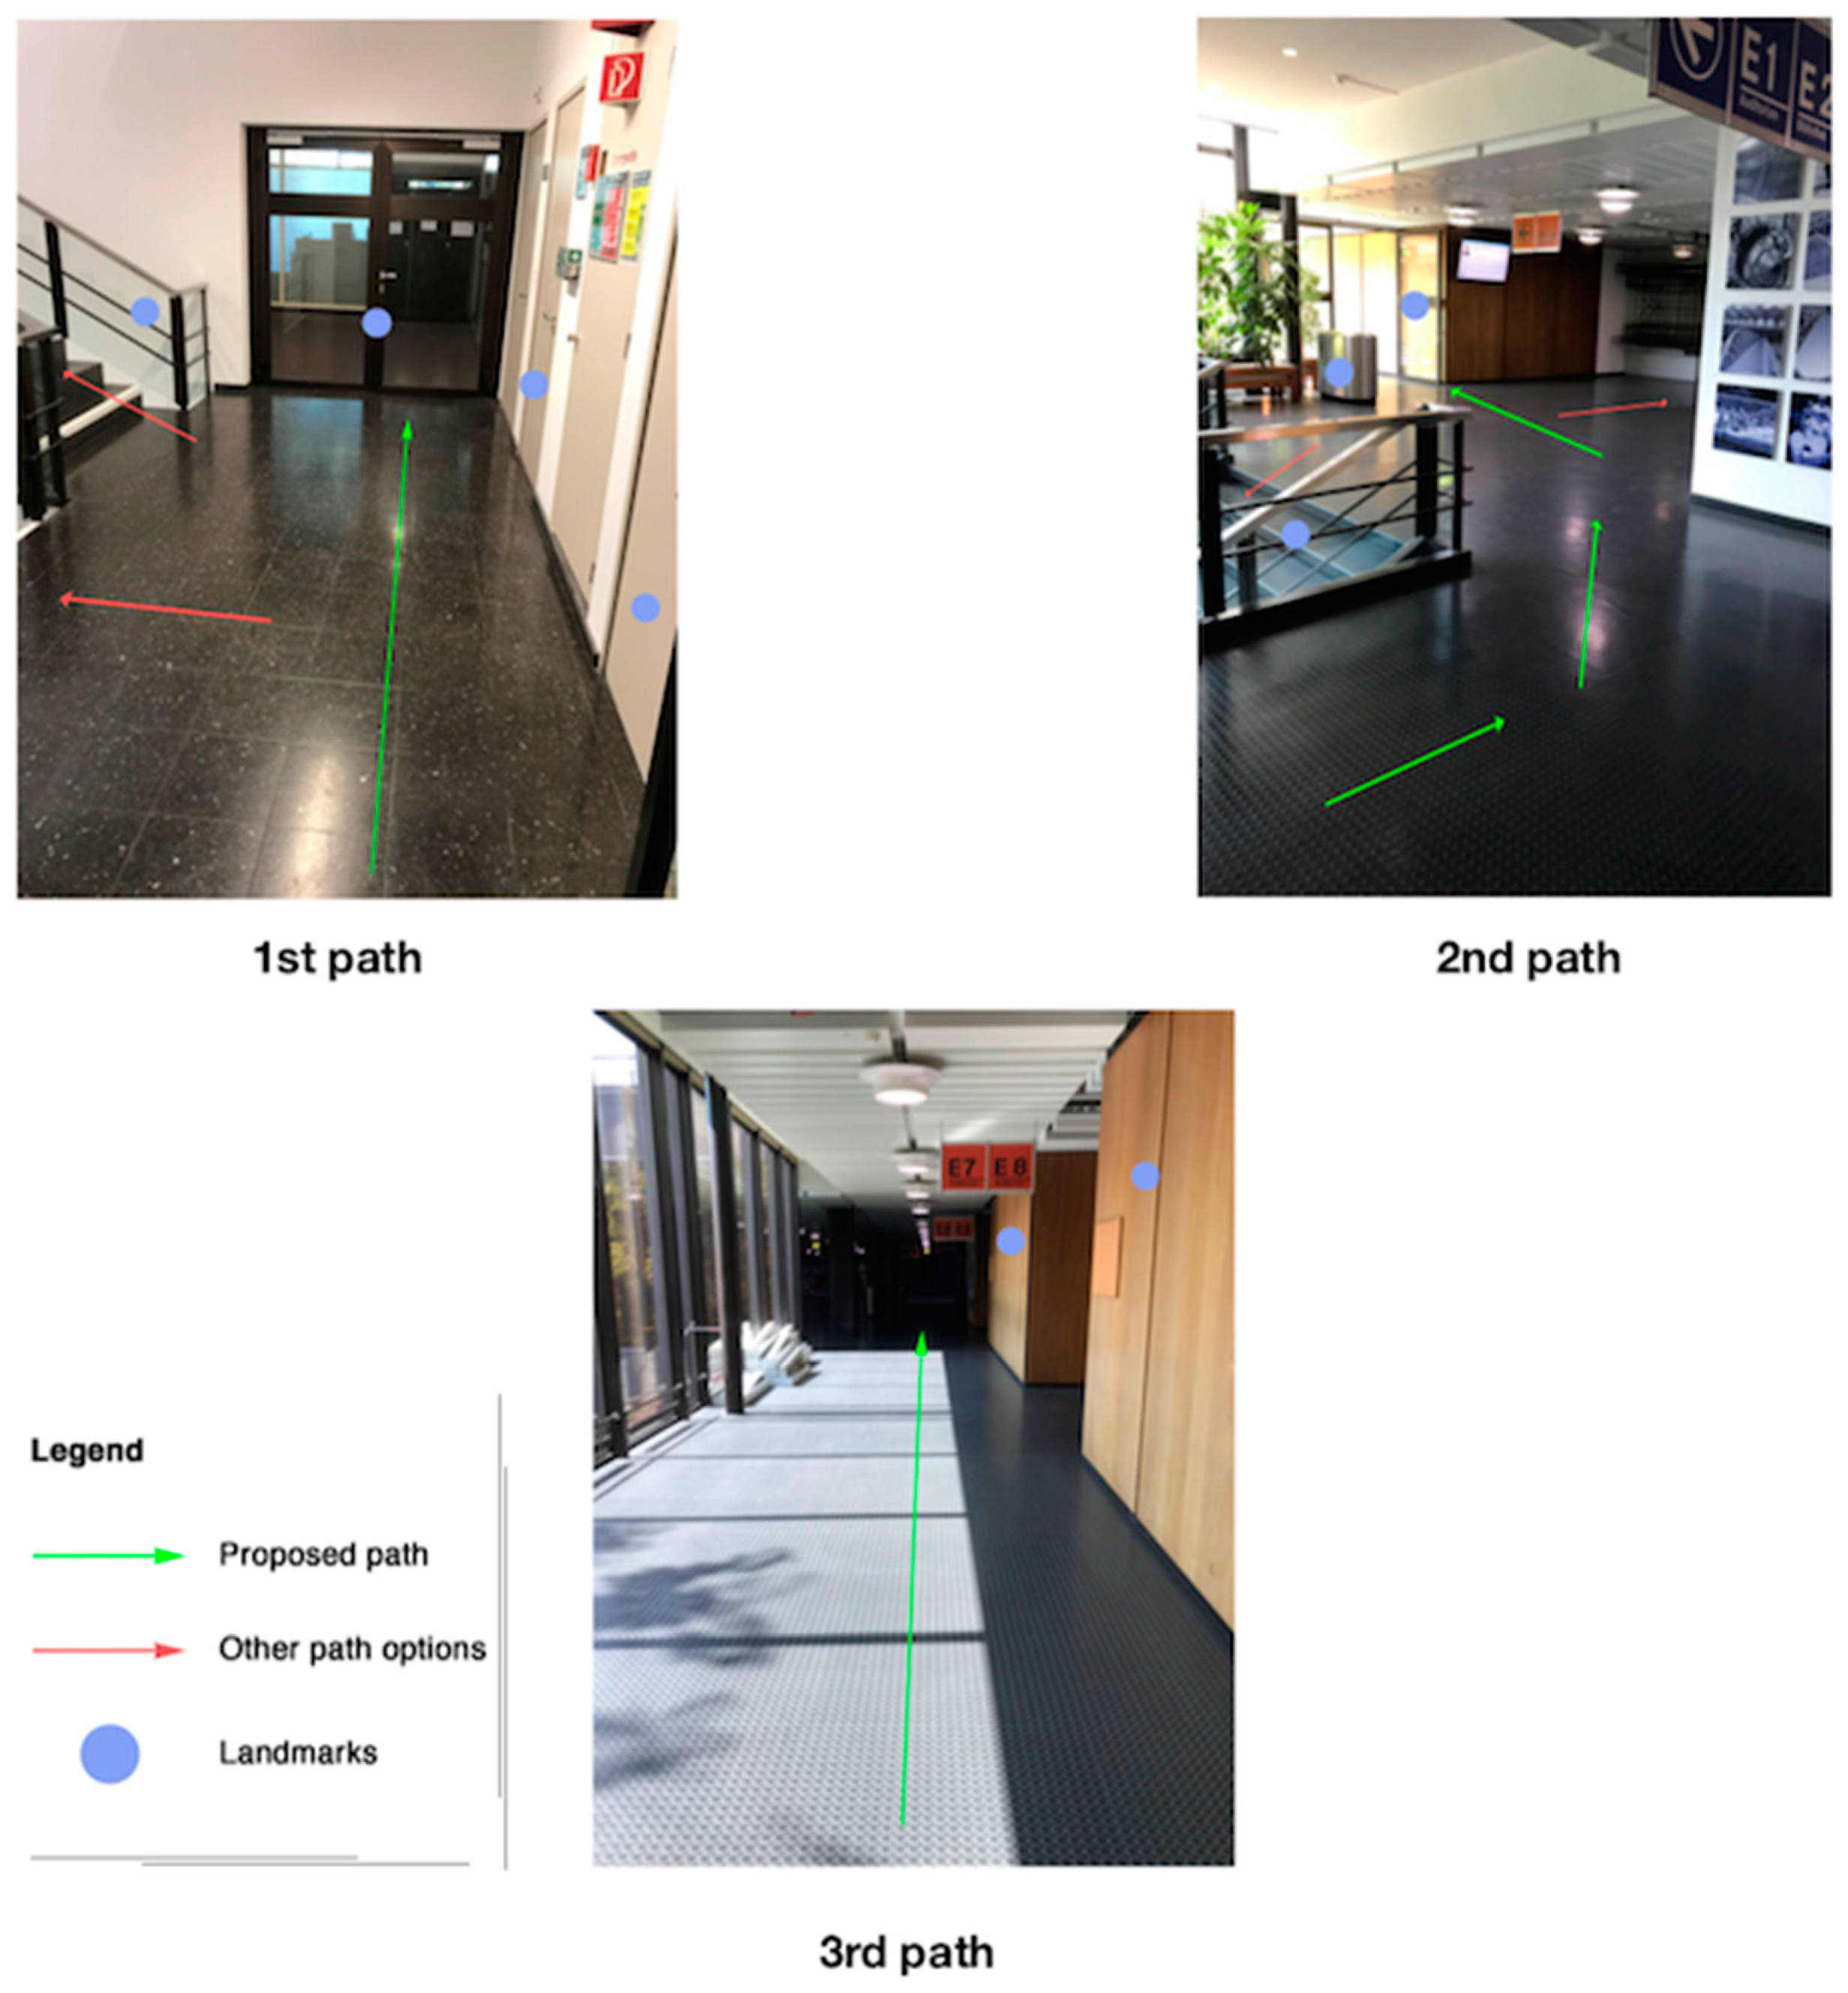
- The route consists of differences in length and in difficulty sub-paths. This element was important for selecting the specific routing path, since it represents a quite realistic scenario. In Figure 4, three different sub-paths of the wayfinding’s routine path are presented. The paths differ in level of difficulty in terms of possible navigation decisions. For instance, in the first two paths, the users have to choose the right path, among other options. On the other hand, in the third path, the options are limited, making users’ navigation decision much easier. In each of the presented cases (Figure 4), the existence of multiple and different types of landmarks can facilitate the whole navigation procedure.
3.2. Materials and Methods
3.2.1. Wizard of Oz Methodology
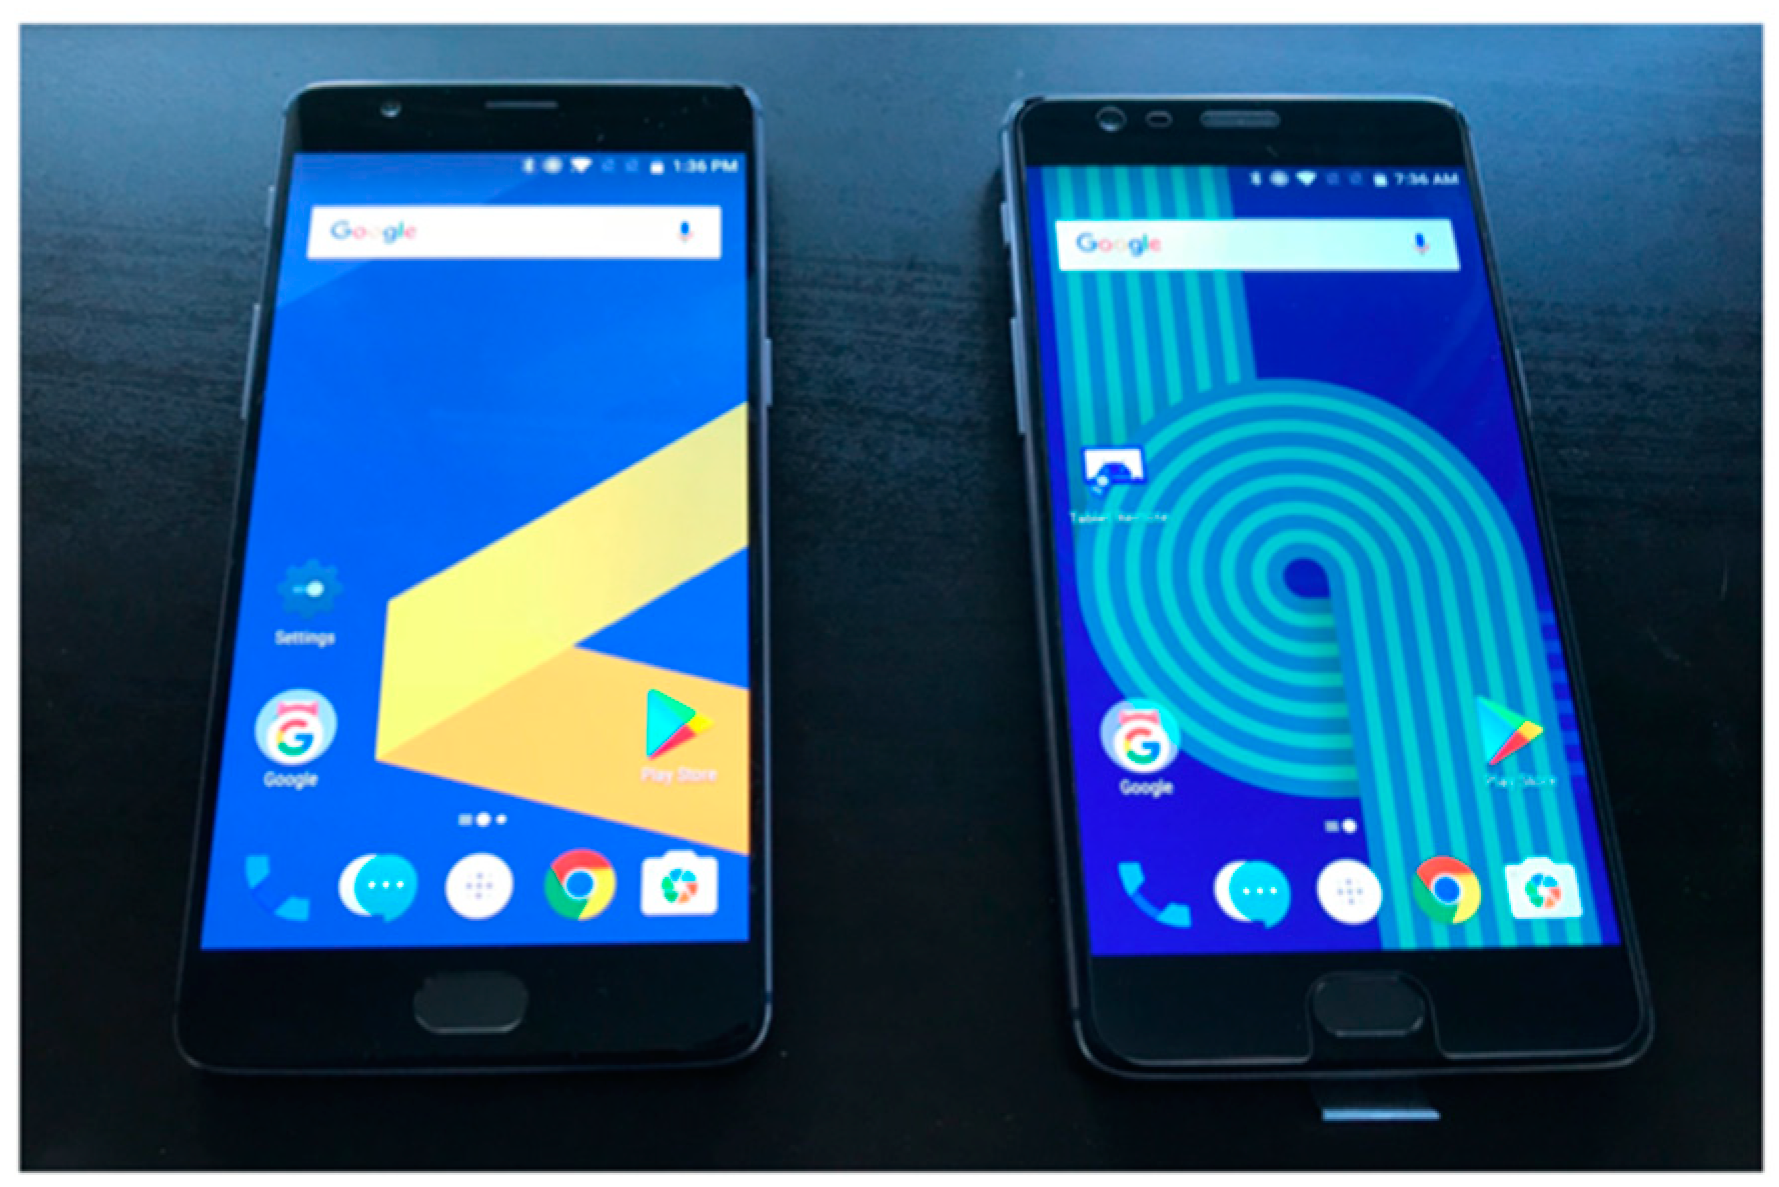
3.2.2. Hardware Used
3.2.3. Software Used
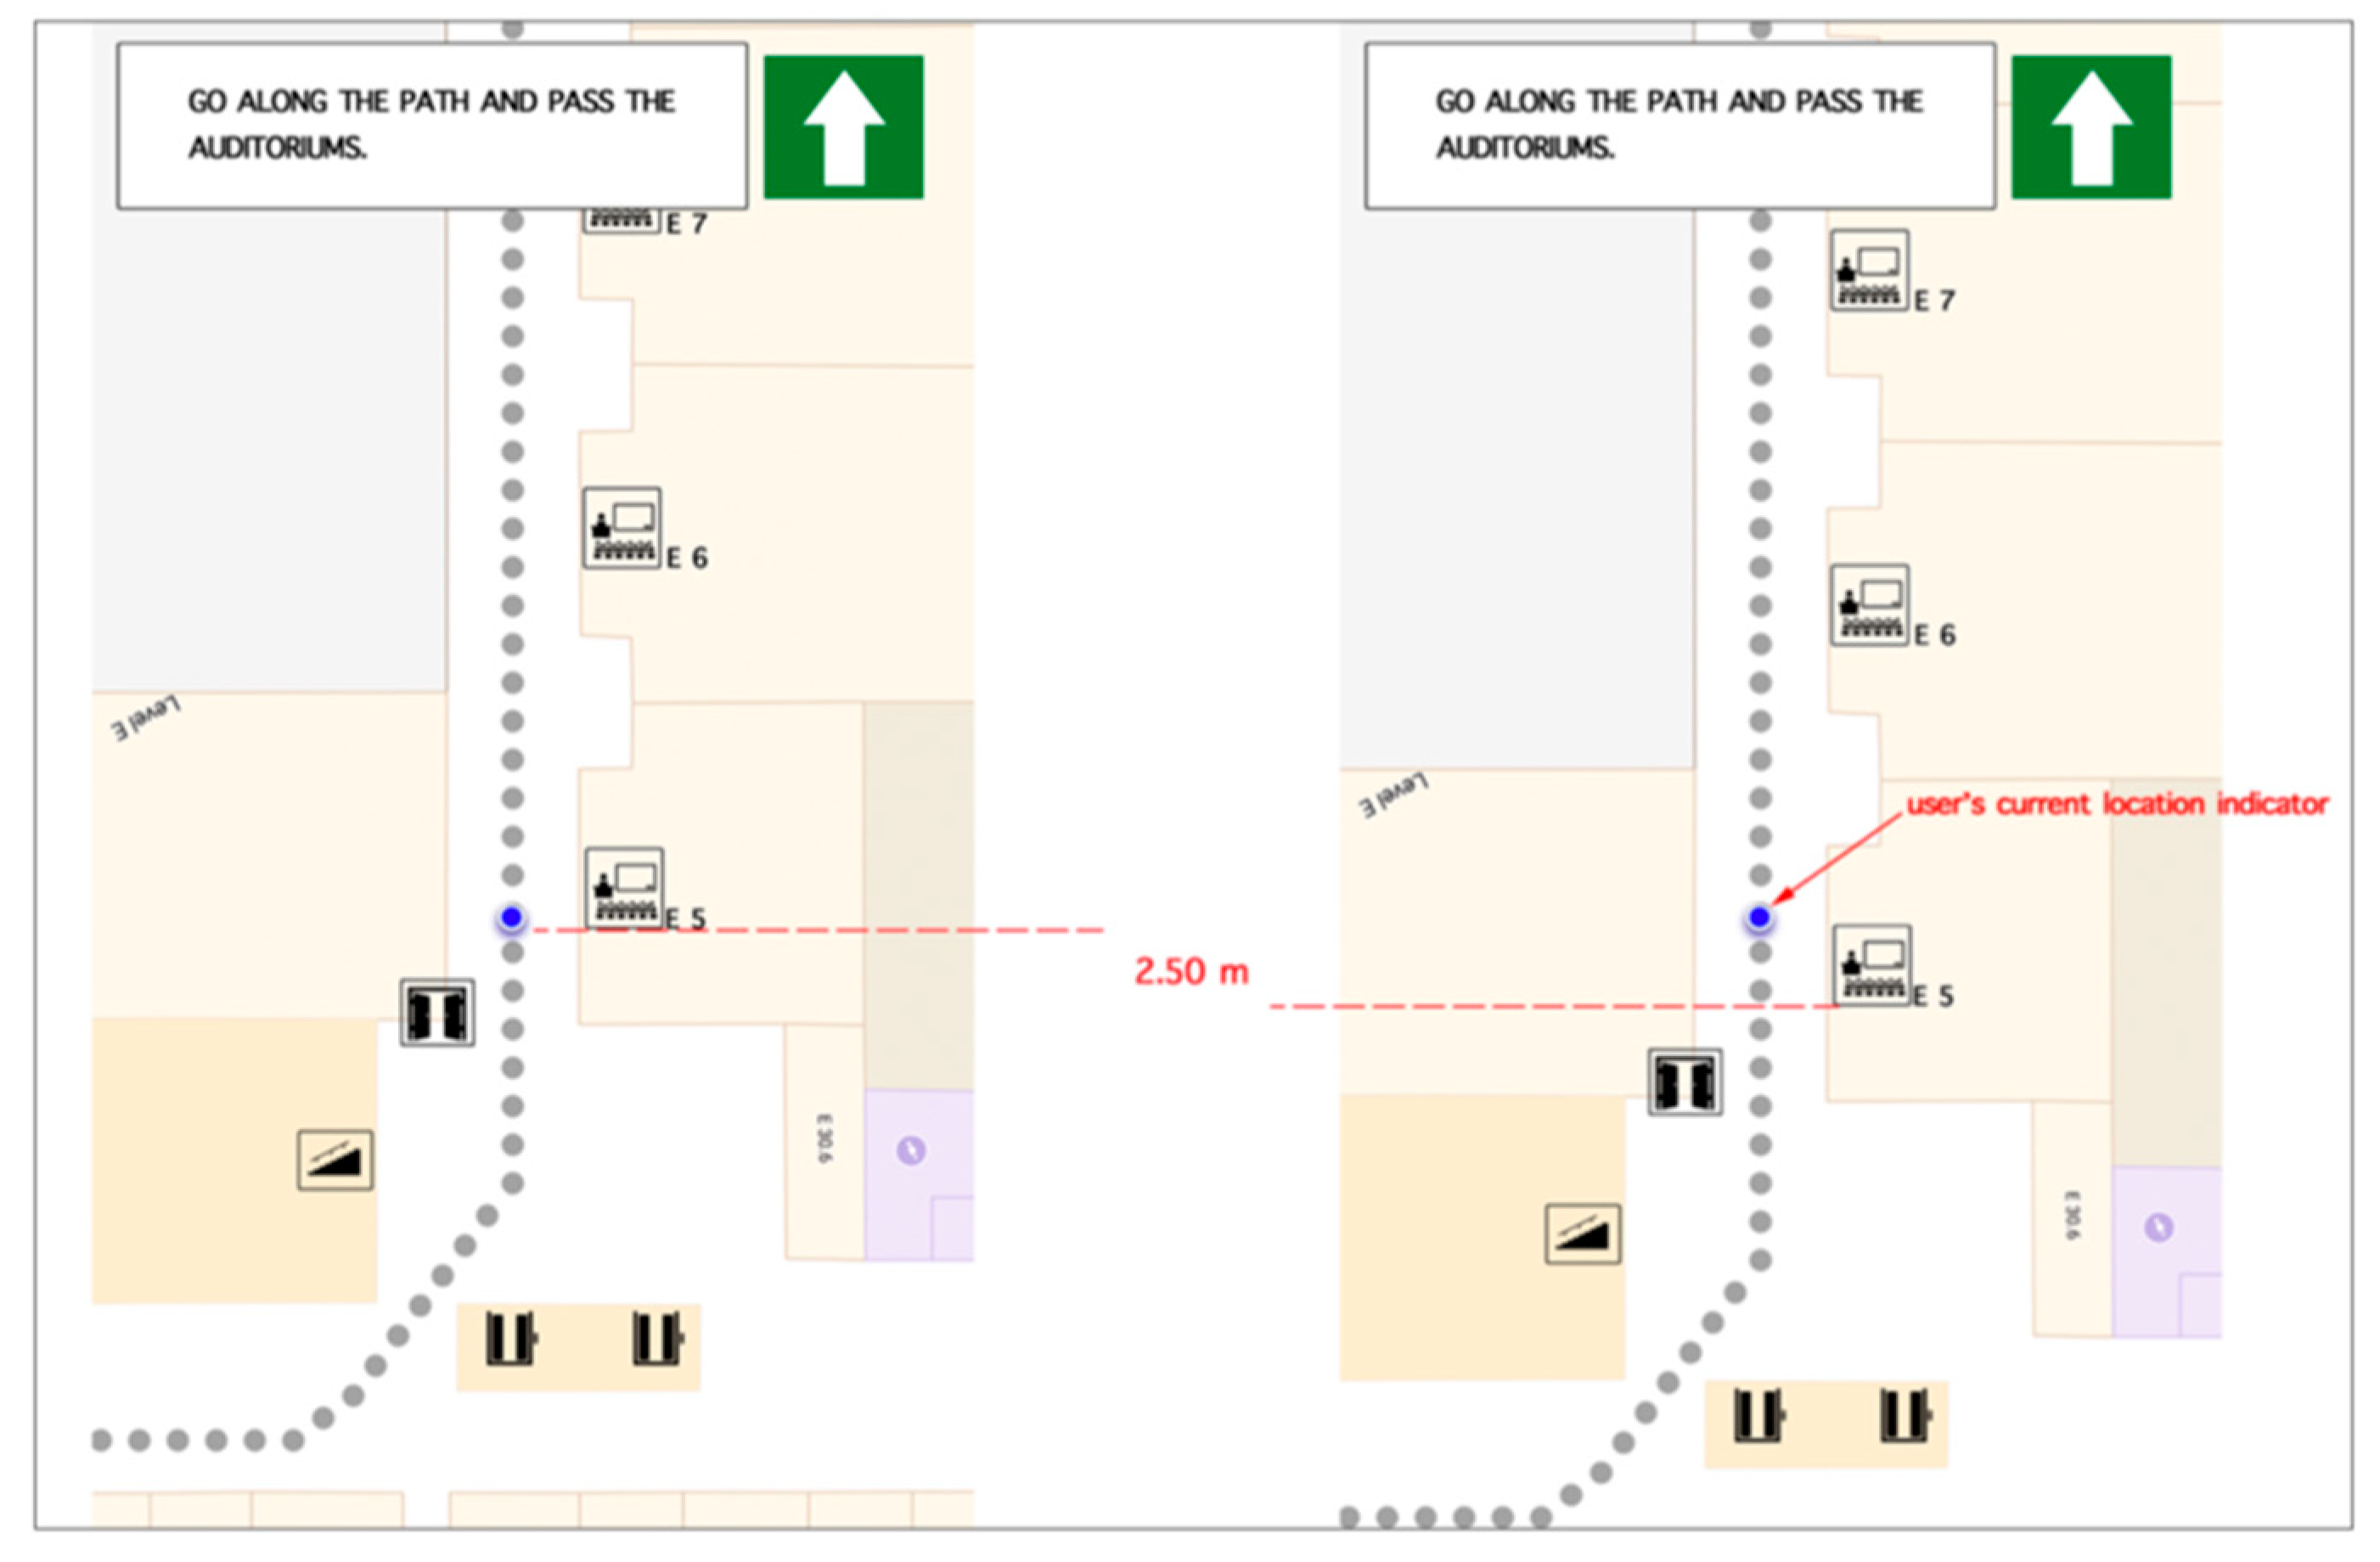
- Base map (based on Google maps): The base map of the test area was designed in Adobe Photoshop. Based on this map, 85 to 87 (depending on each application) high-resolution static images of identical size were created. Each image had 2.5 m difference in the routing path from the next one (Figure 7). This change was vividly visualized by a blue circle, which was used as an indicator of participant’s current location. The aforementioned design procedure was followed, in order to give the participants the impression of having a fully functioning routing application where the base map is dynamically updating based on the current location. Furthermore, within every image, the generated routing instructions were included. At the same time, indicators regarding the routing path (grey dots in Figure 7) as well as the proposed direction the participant had to follow, were designed and included in the final image (Figure 7).
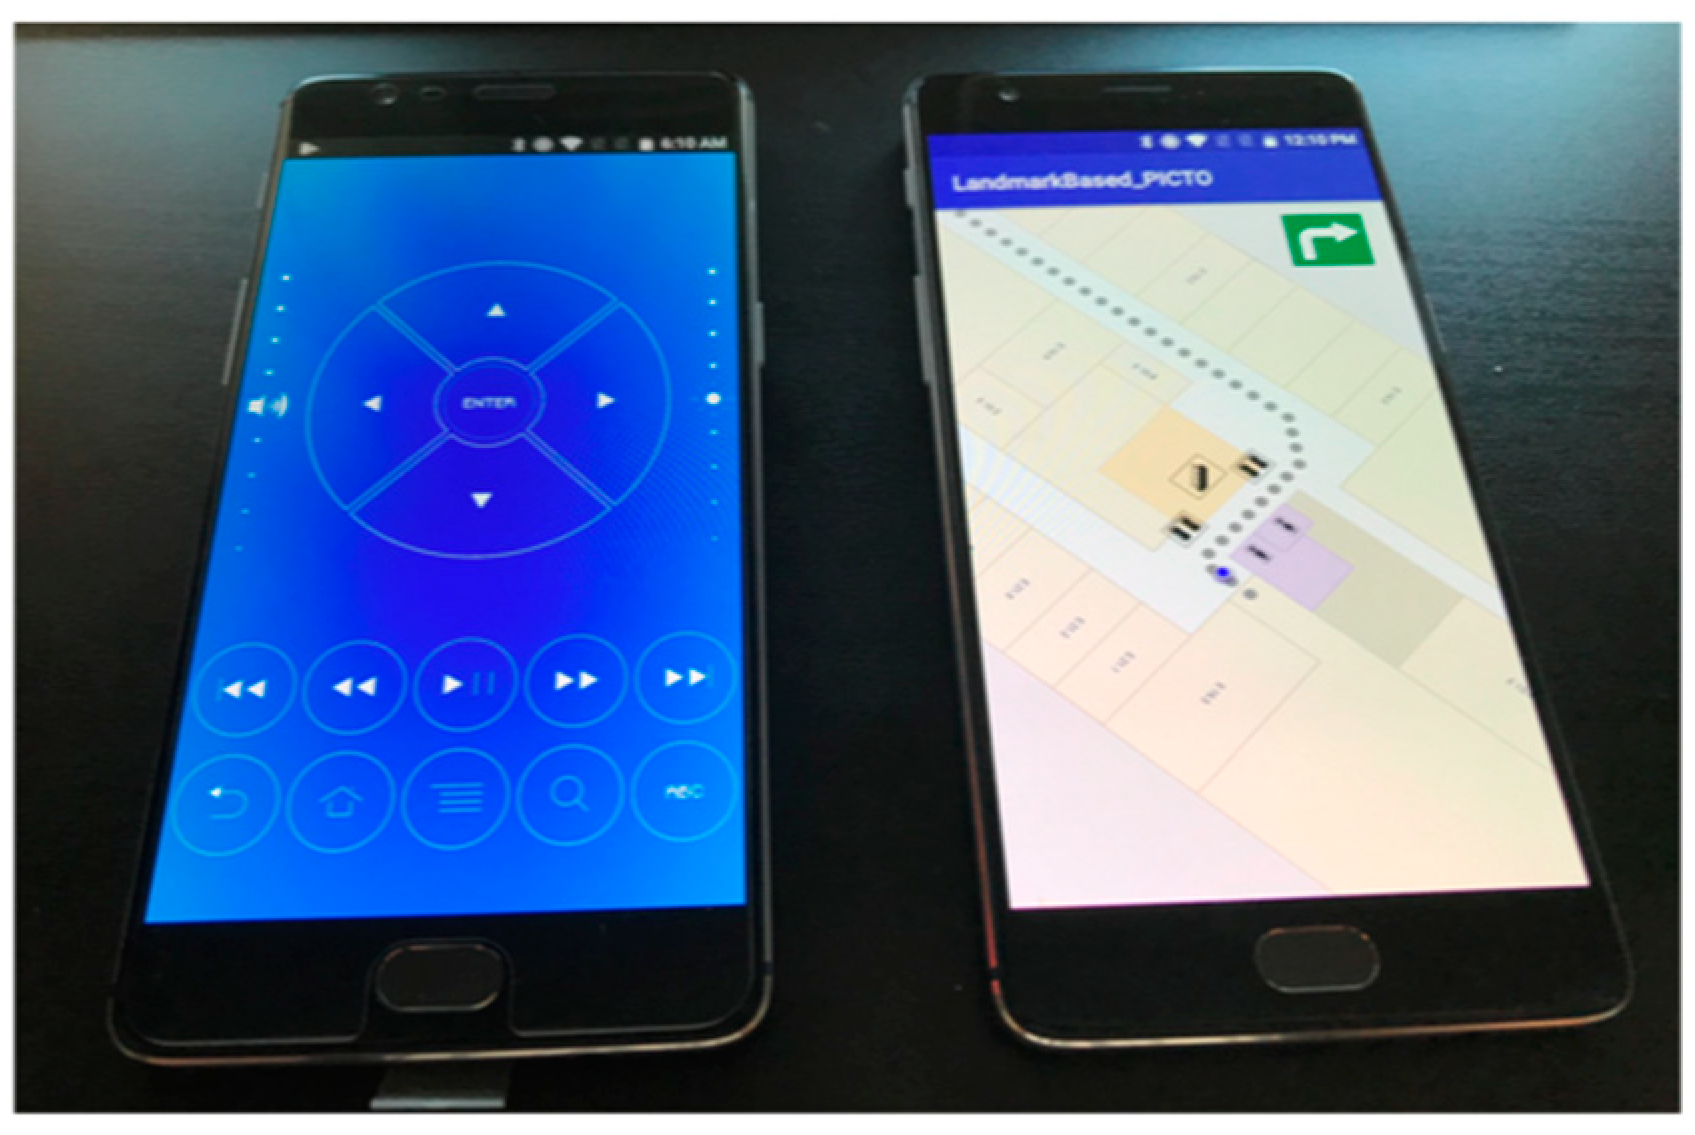
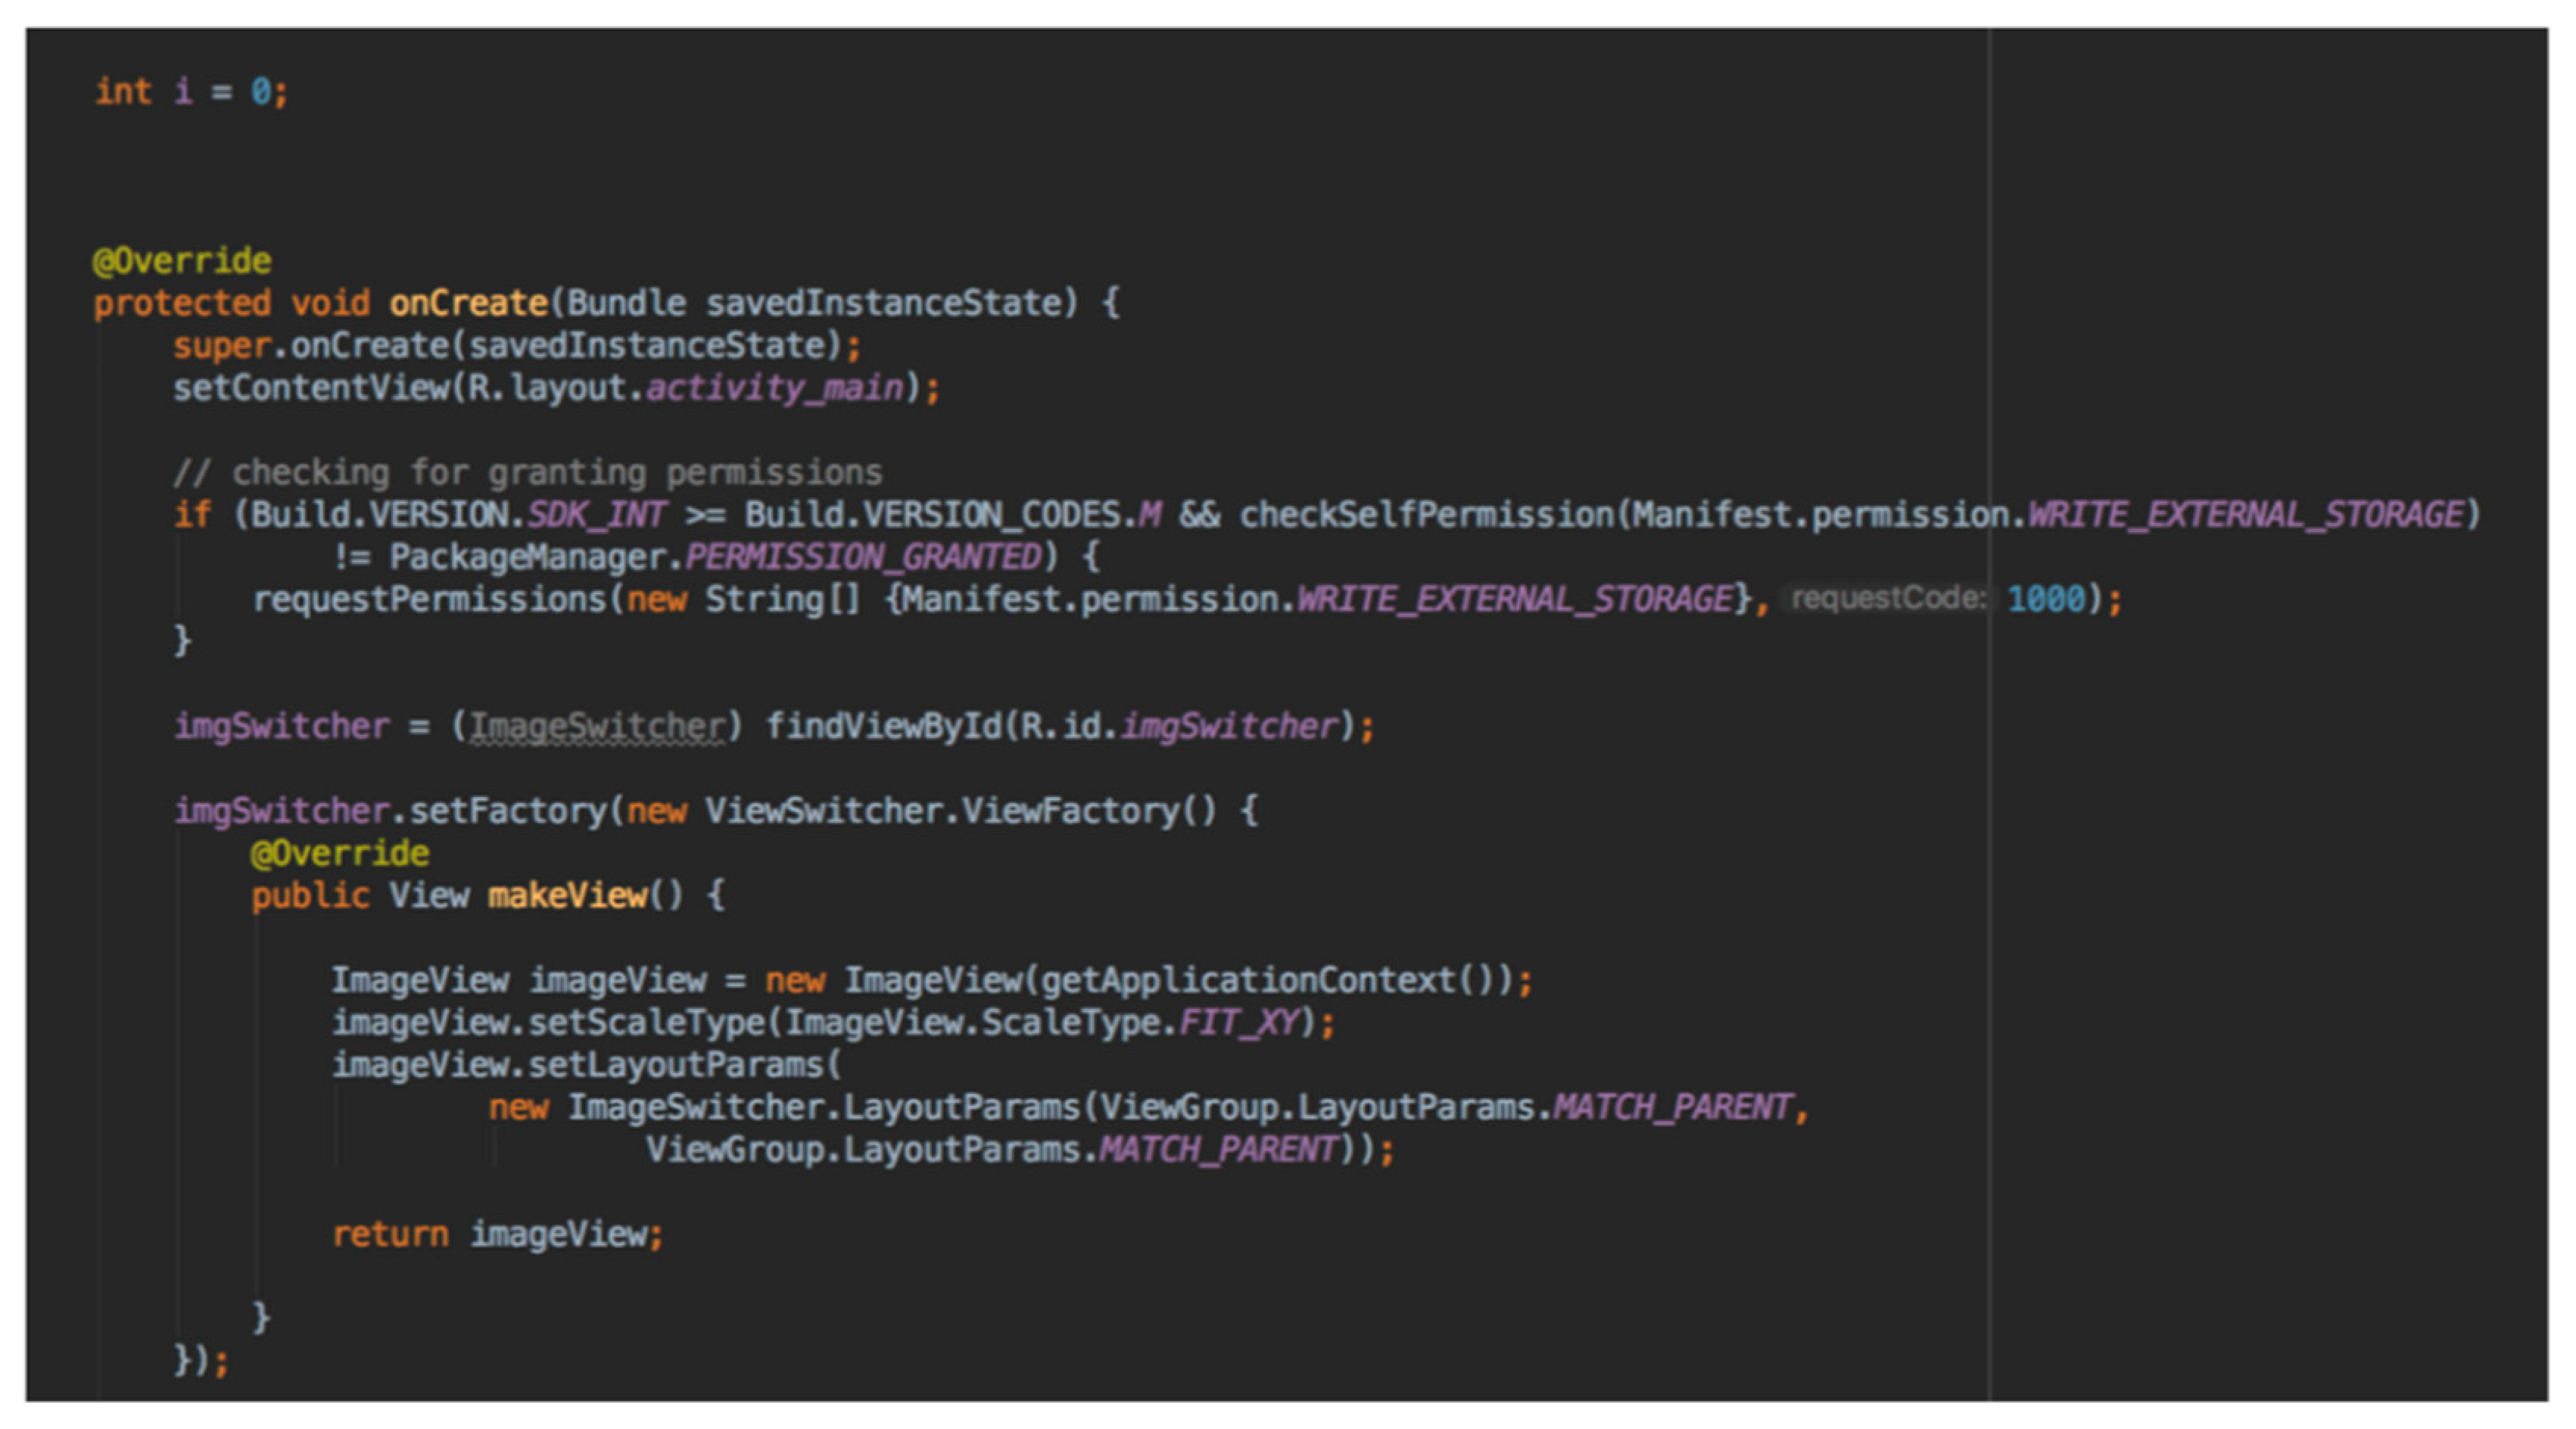
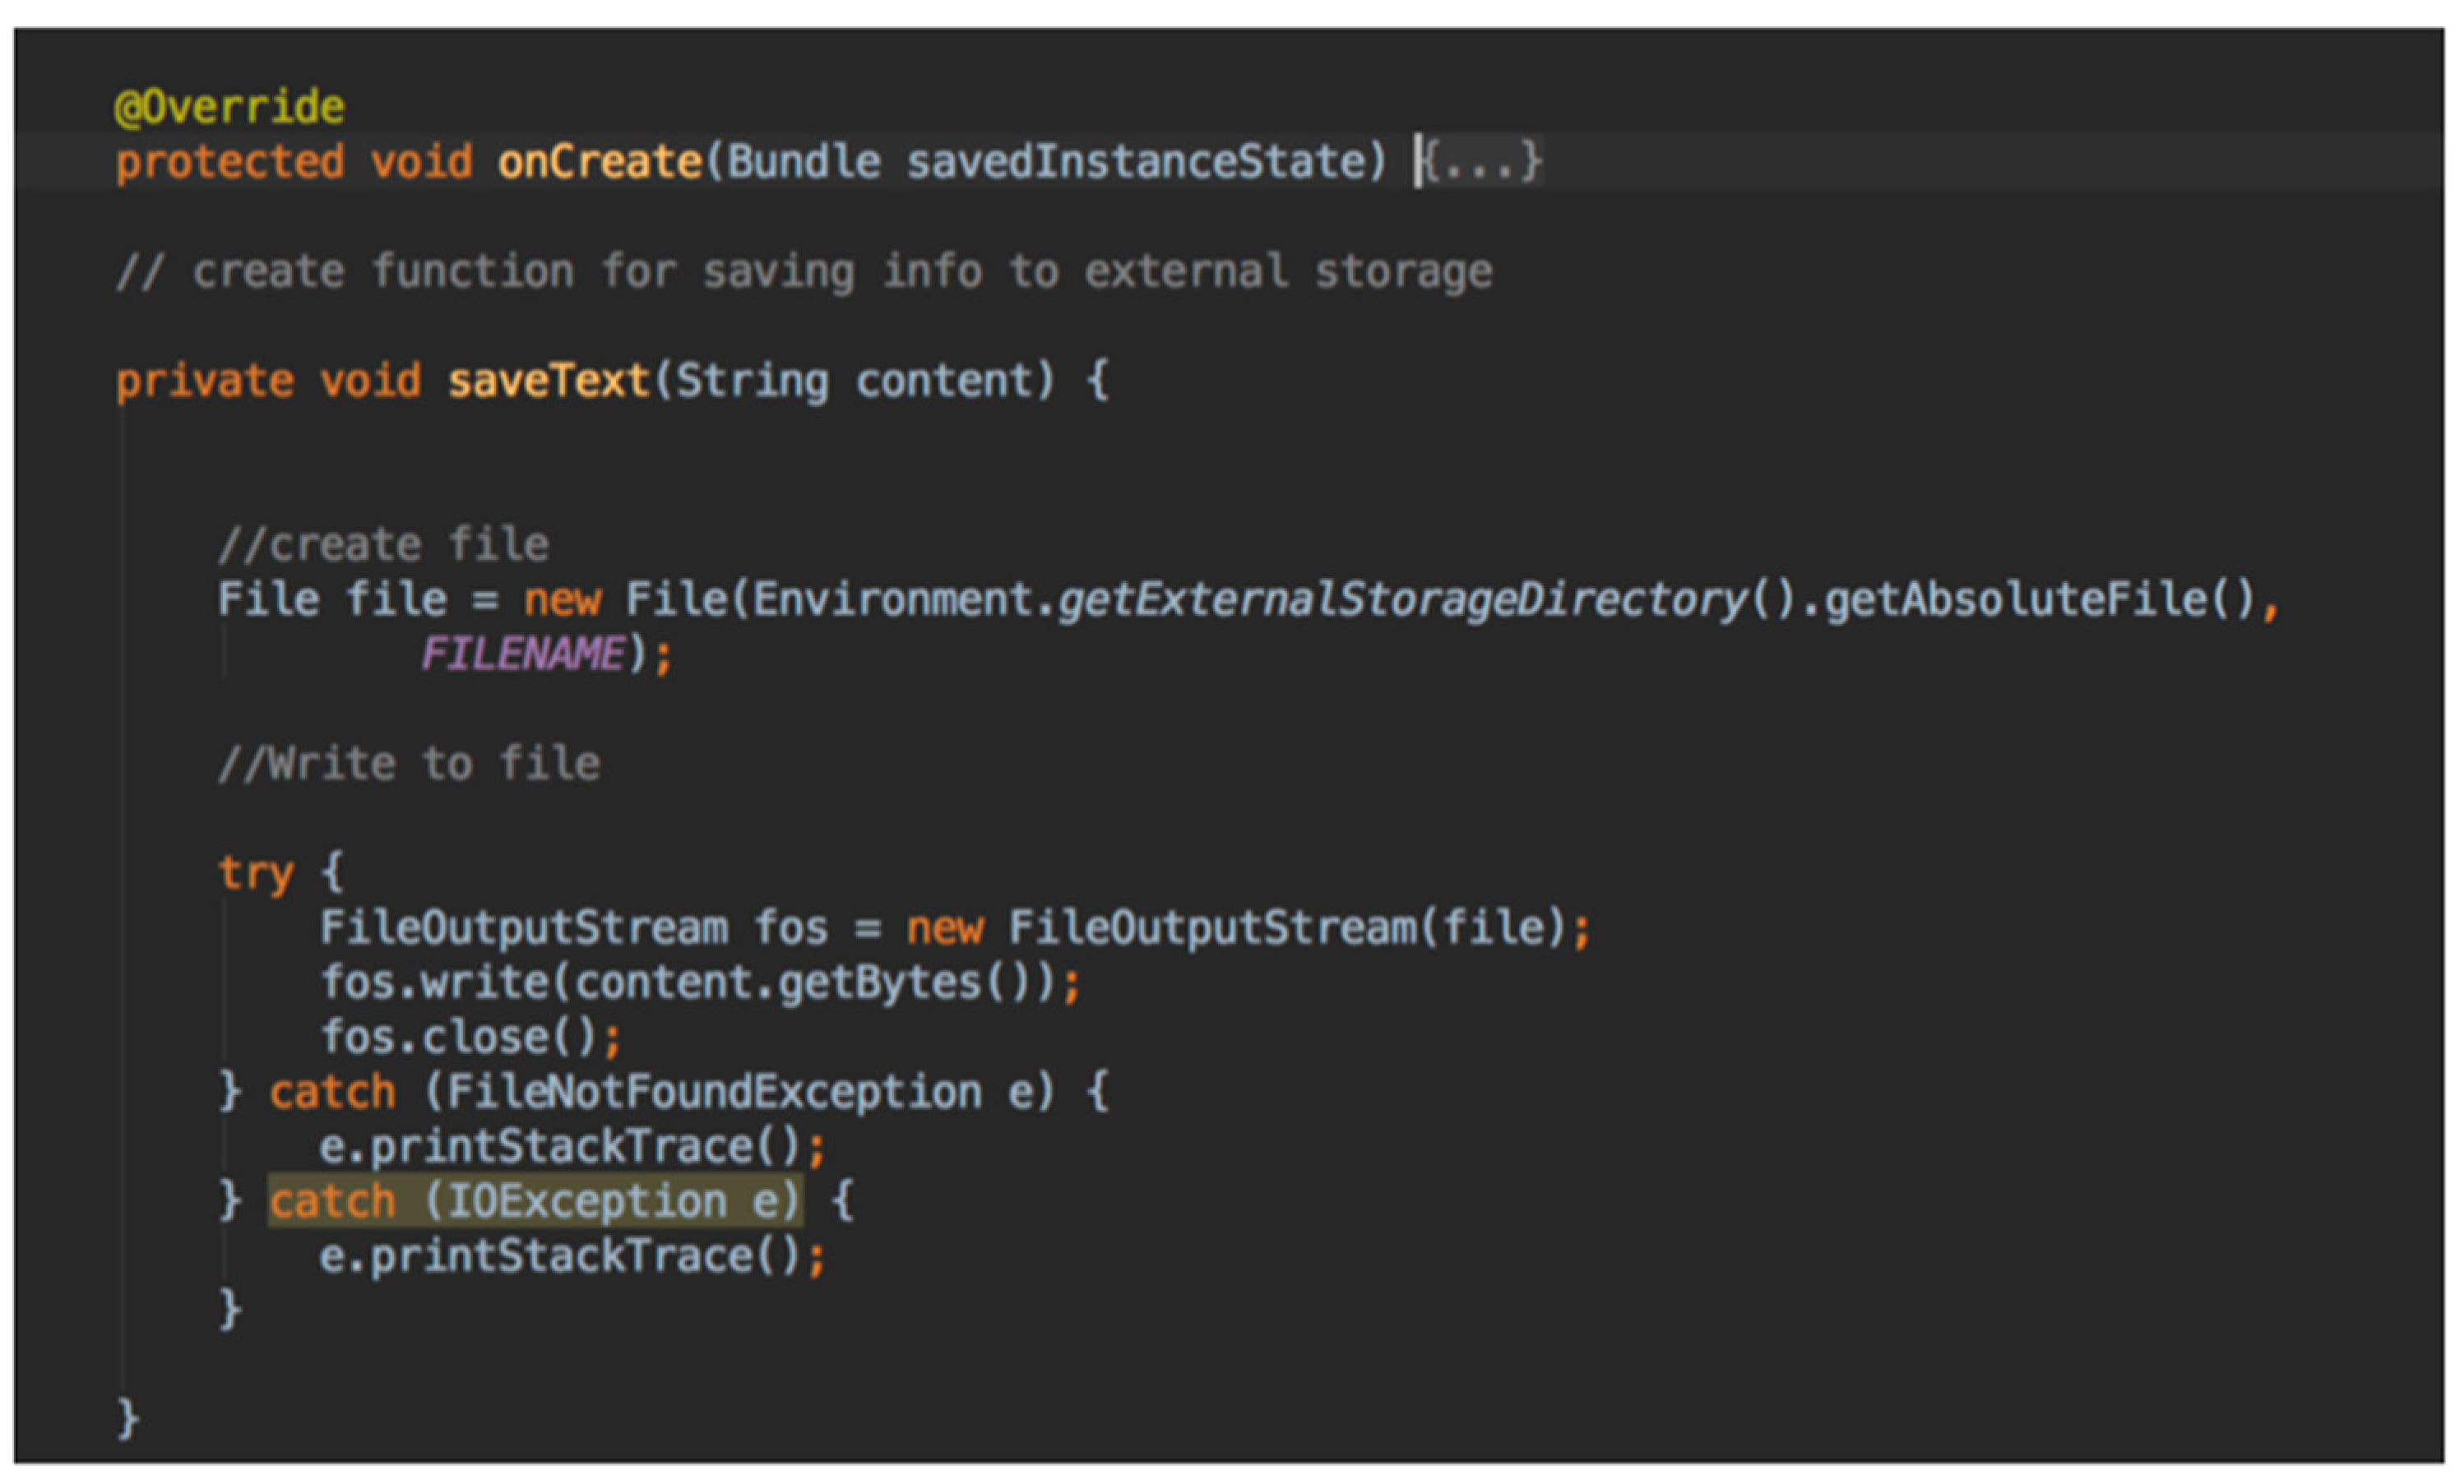
- Java code: The application itself was written in the user interface of the Android Studio software (Figure 8).
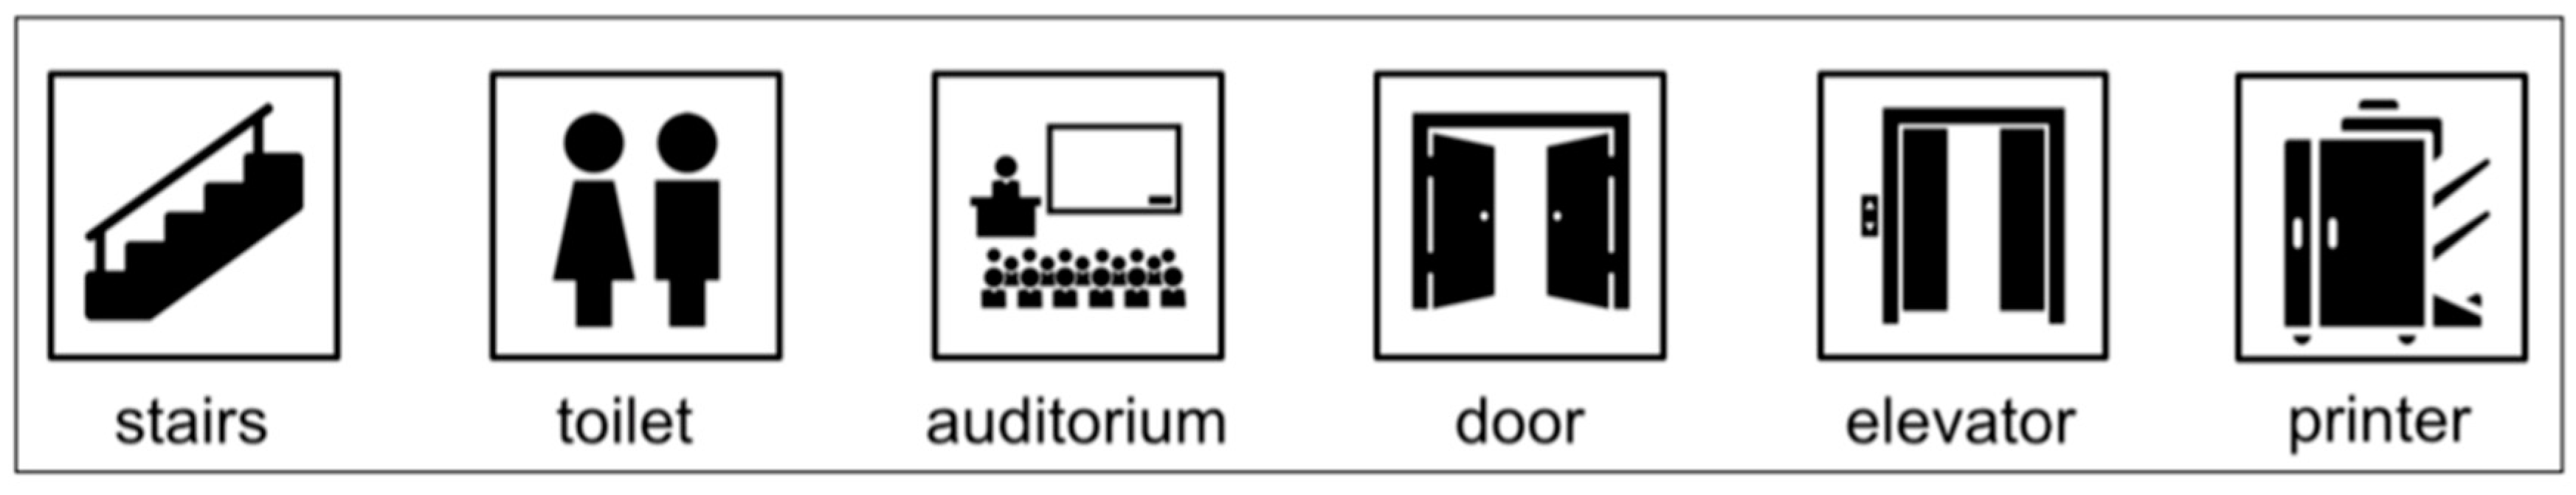
- Landmarks: One of the main aspects of the experiment’s design was the visualization of the selected landmarks in two different forms. For this purpose, two design approaches were selected (pictogram-based and axonometric-based).
- ○
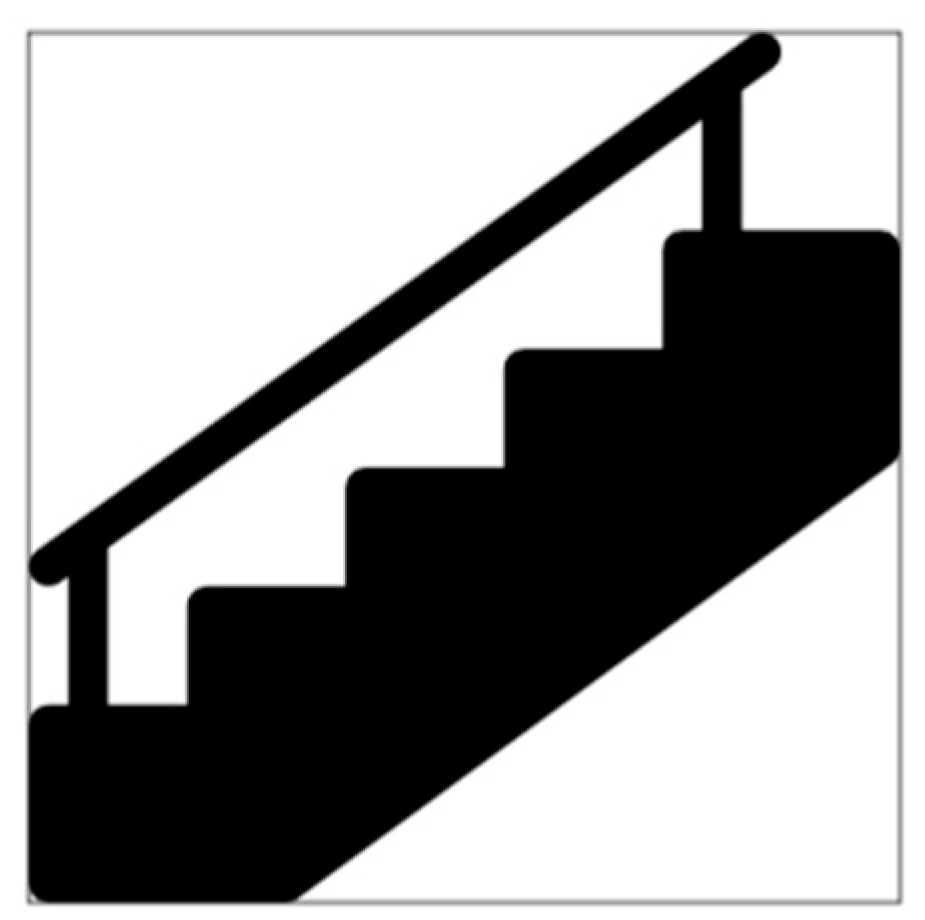
- Landmarks in form of pictograms (Figure 10): In this approach, the design ideas were initially taken from www.flaticon.com. Based on these ideas, the final form of every landmark was further customized in Adobe Illustrator, which is a vector graphics editor developed and marketed by Adobe Systems.
- ○
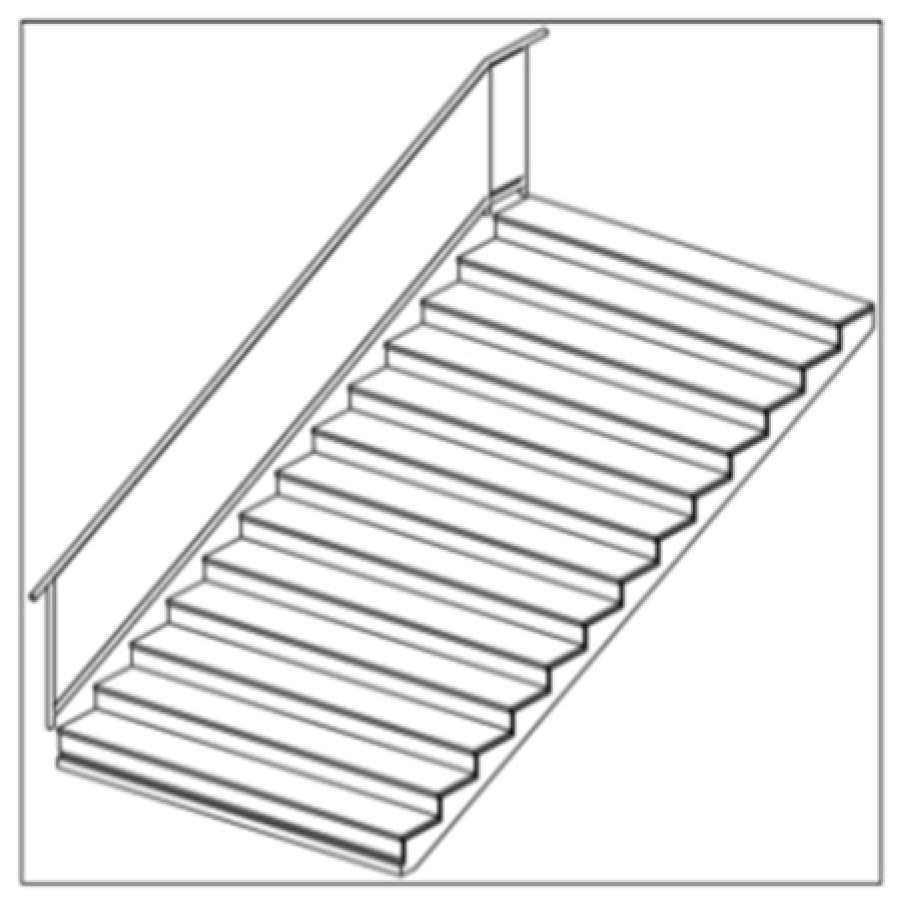
- Axonometric-based landmarks (Figure 11): Based on this design approach, every landmark was designed in ARCHICAD 21 (architectural BIM CAD).
3.3. Applying Indoor Landmark Navigation Model (ILNM)
| Candidate landmarks | ||
| 1. Elevator | 7. Auditorium | 13. Notice board |
| 2. Toilet | 8. Seminar room | 14. Meeting room |
| 3. Door | 9. PC room | 15. Trash and recycling can |
| 4. Scanner/Printer | 10. Lockers | |
| 5. Stairs | 11. Organic waste can | |
| 6. Closets | 12. Uncategorized room | |
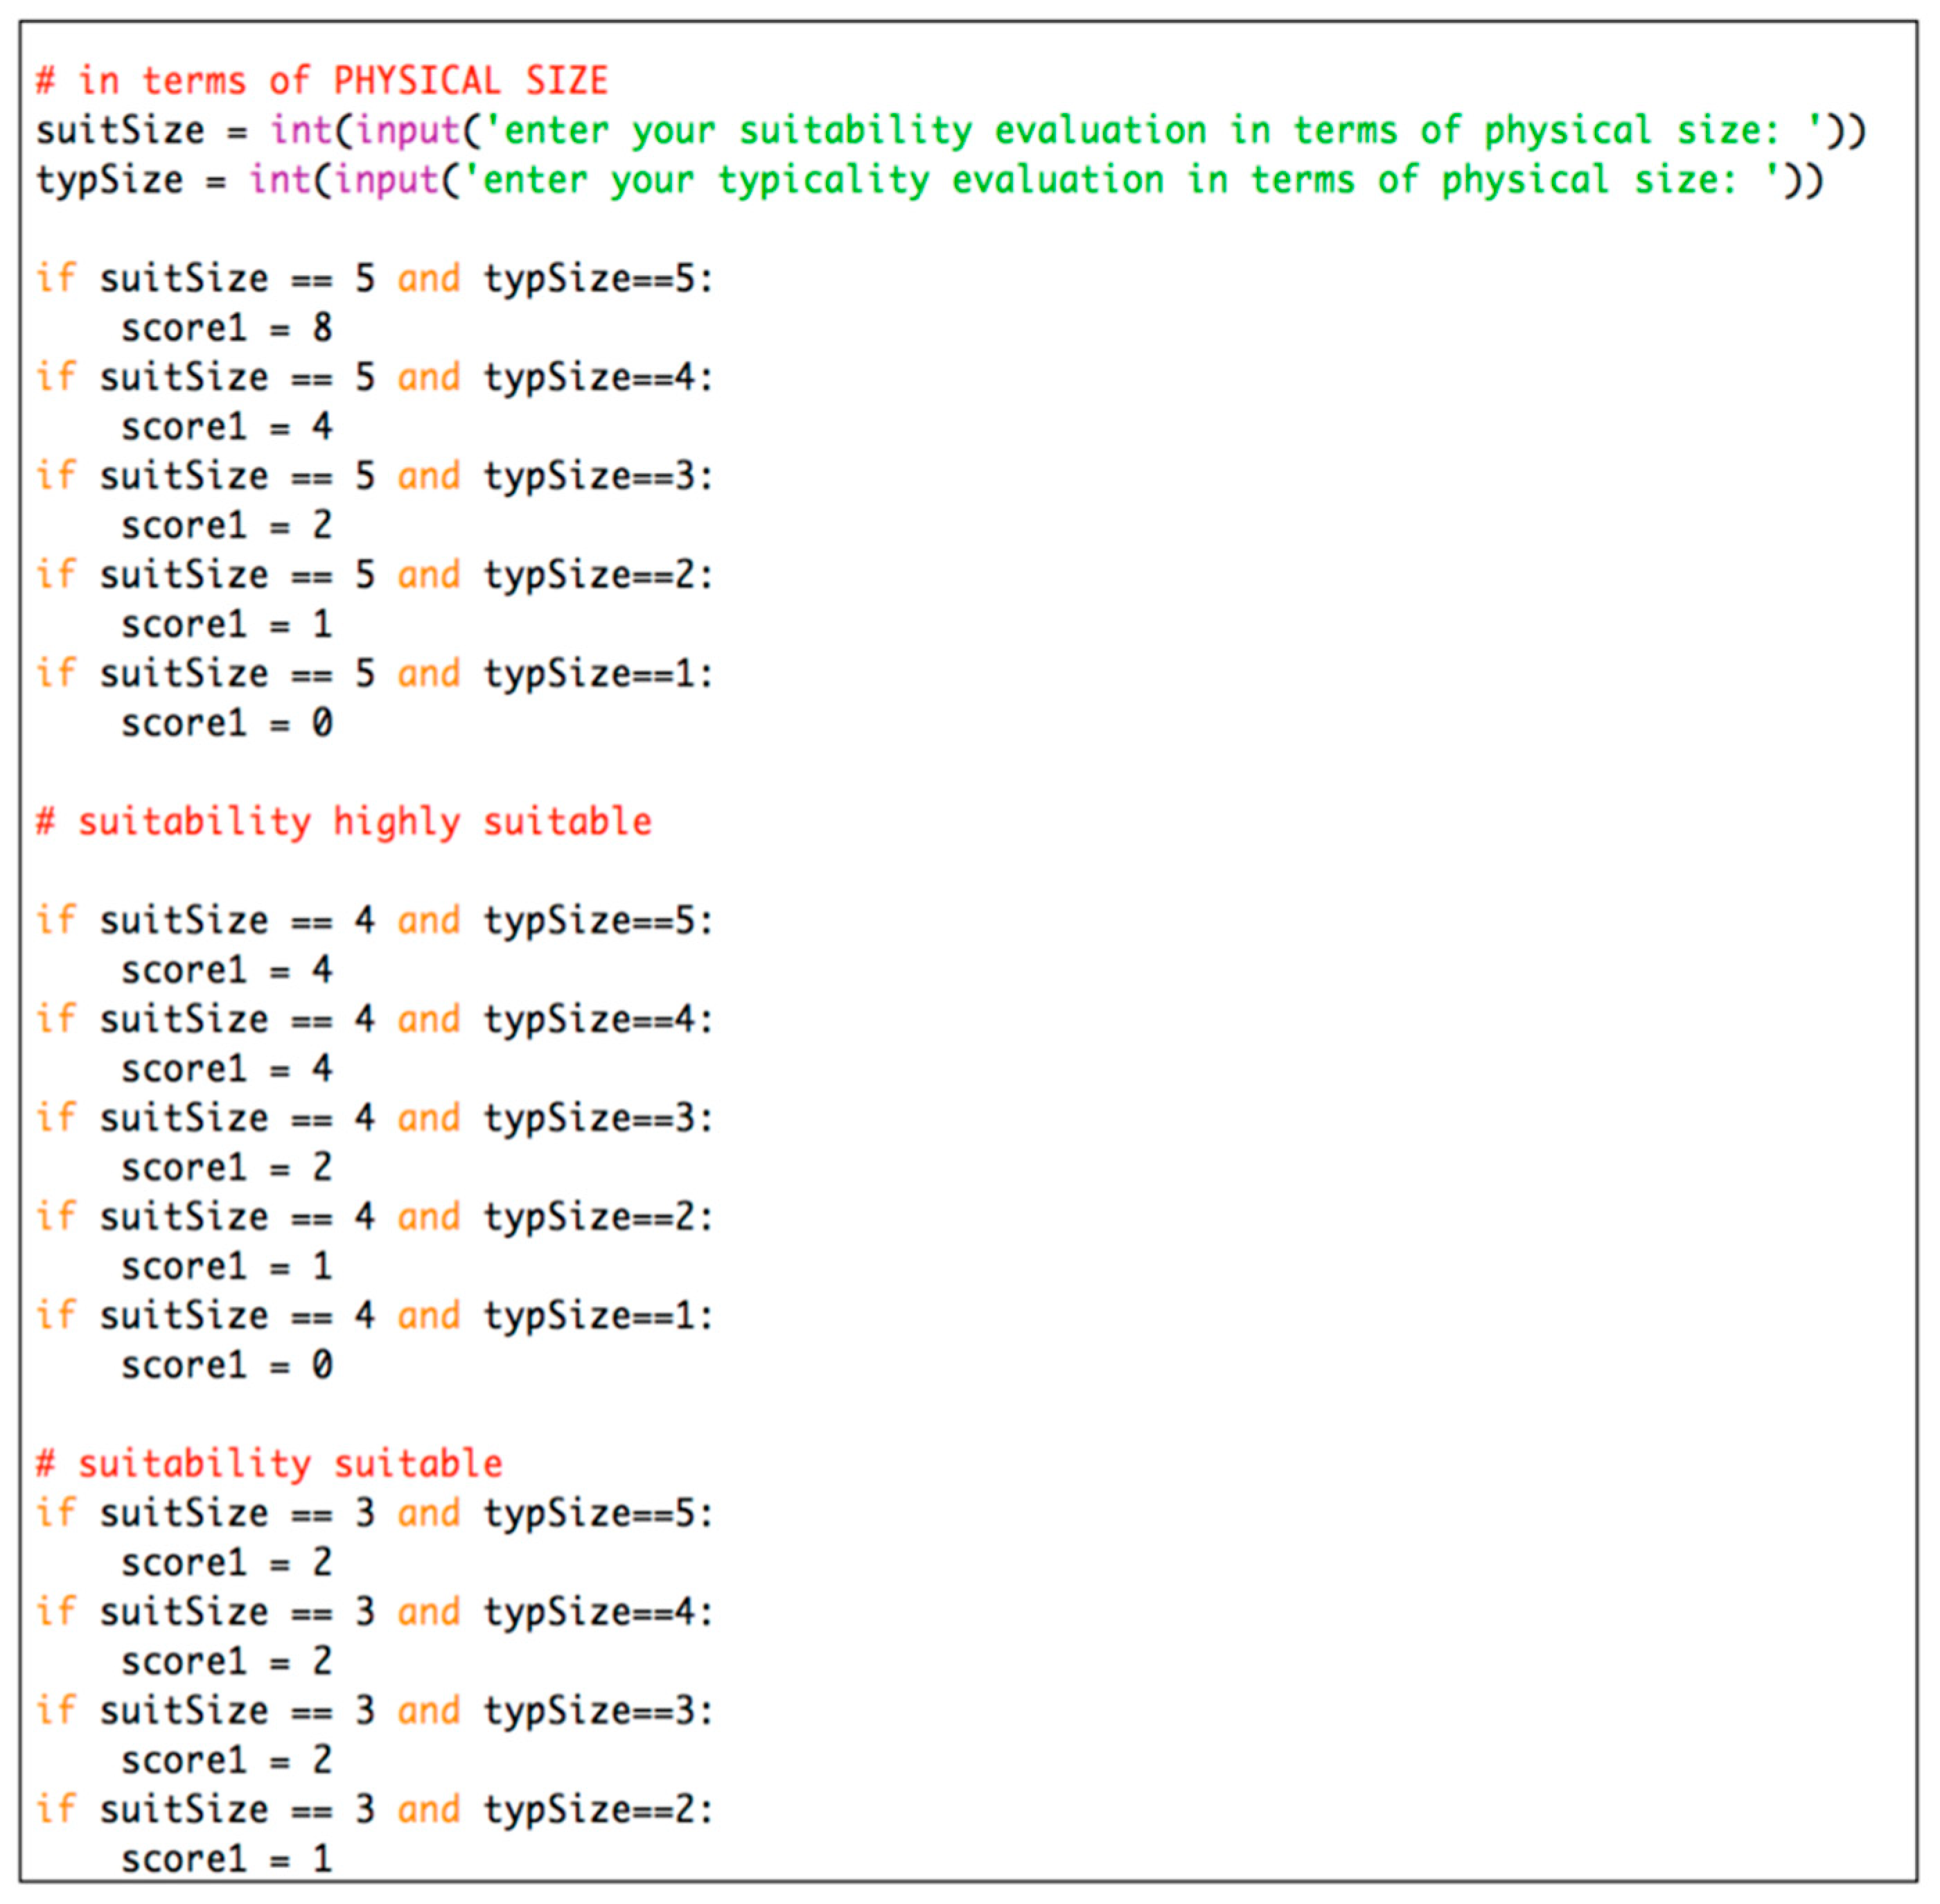
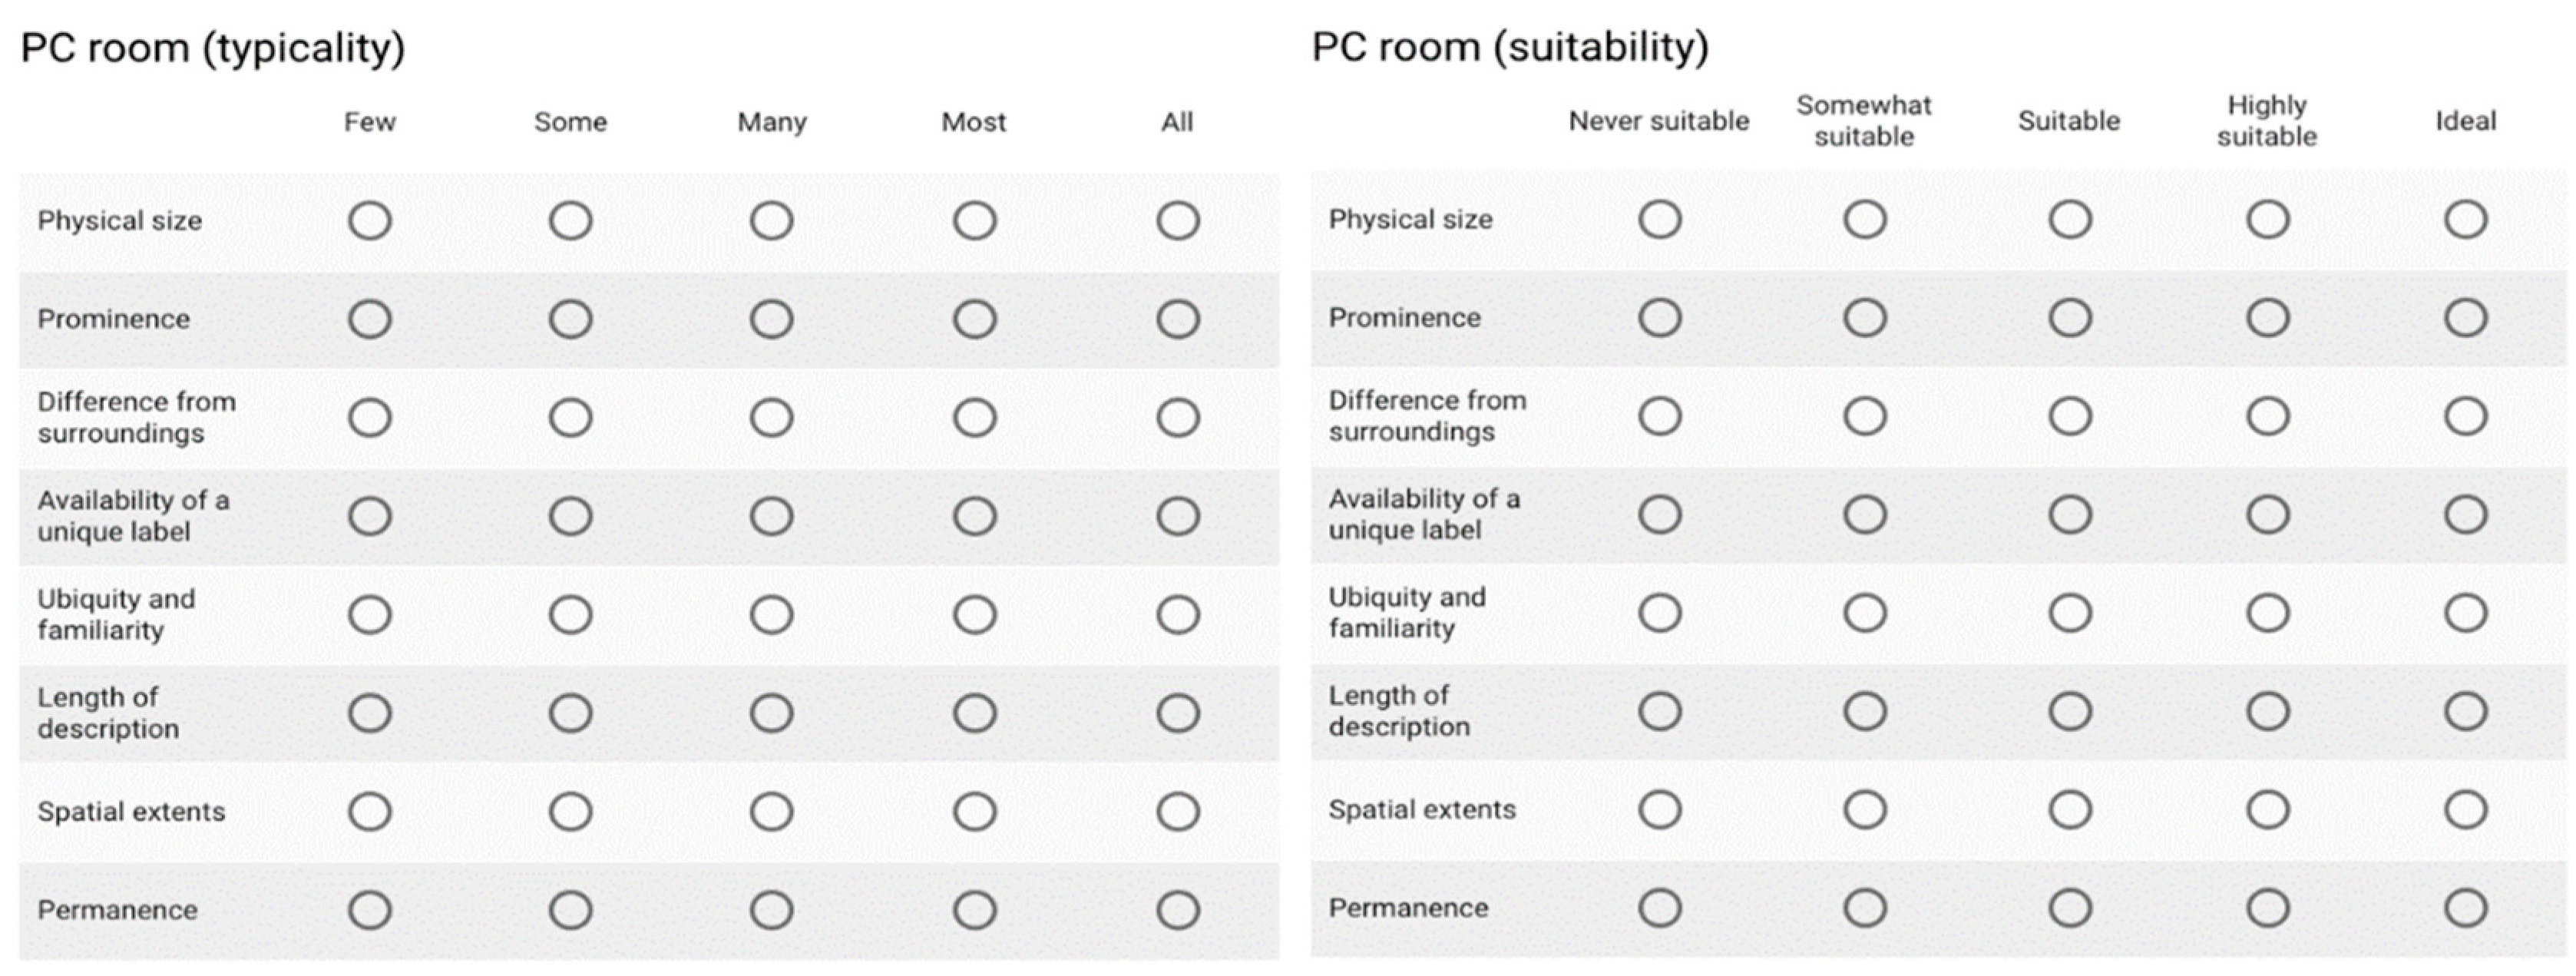
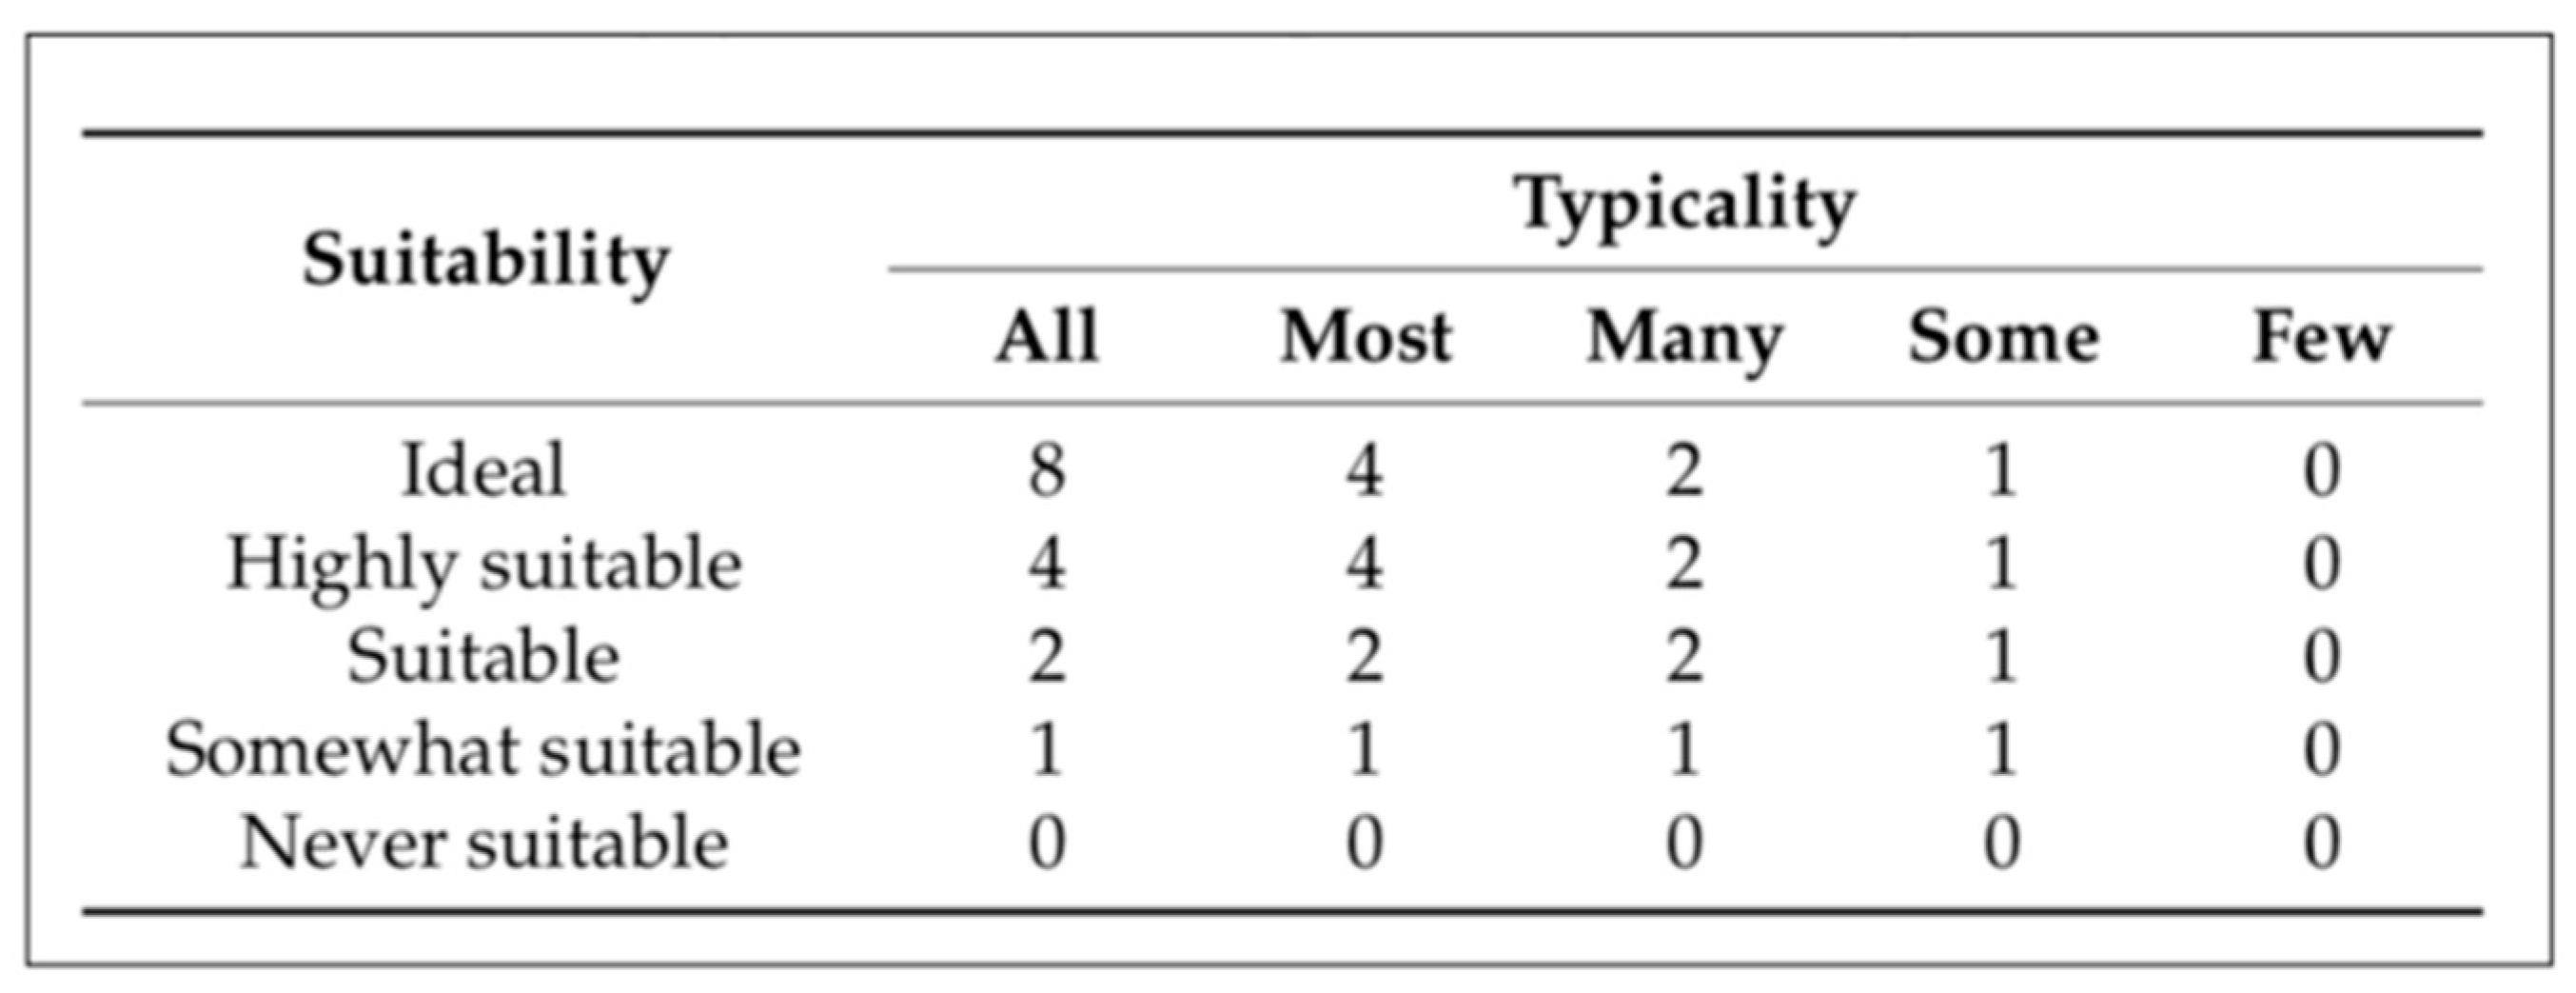
- How suitable a typical instance of this category is as a landmark (from “Ideal” to “Never suitable”).
- How likely it is that a particular instance of this category is typical (from “All” to “Few”).
- -
- “Physical size” = 8, since it is rated as “Ideal” and as “All” in terms of suitability and typicality, respectively;
- -
- “Prominence” = 4, since it is rated as “Highly suitable” and as “Most” in terms of suit- ability and typicality, respectively;
- -
- “Difference from surroundings” = 4, since it is rated as “Highly suitable” and as “Most” in terms of suitability and typicality, respectively;
- -
- “Availability of a unique label” = 0, since it is rated as “Never suitable” and as “All” in terms of suitability and typicality, respectively;
- -
- “Ubiquity and familiarity” = 8, since it is rated as “Ideal” and as “All” in terms of suitability and typicality, respectively;
- -
- “Length of description” = 8, since it is rated as “Ideal” and as “All” in terms of suitability and typicality, respectively;
- -
- “Spatial extents” = 4, since it is rated as “Highly suitable” and as “Most” in terms of suitability and typicality, respectively;
- -
- “Permanence” = 8, since it is rated as “Ideal” and as “All” in terms of suitability and typicality, respectively.
3.3.1. Landmark Selection
3.3.2. Generating Landmark-Based Routing Instructions
- “Turn right and pass through the door”;
- “Go along the path”;
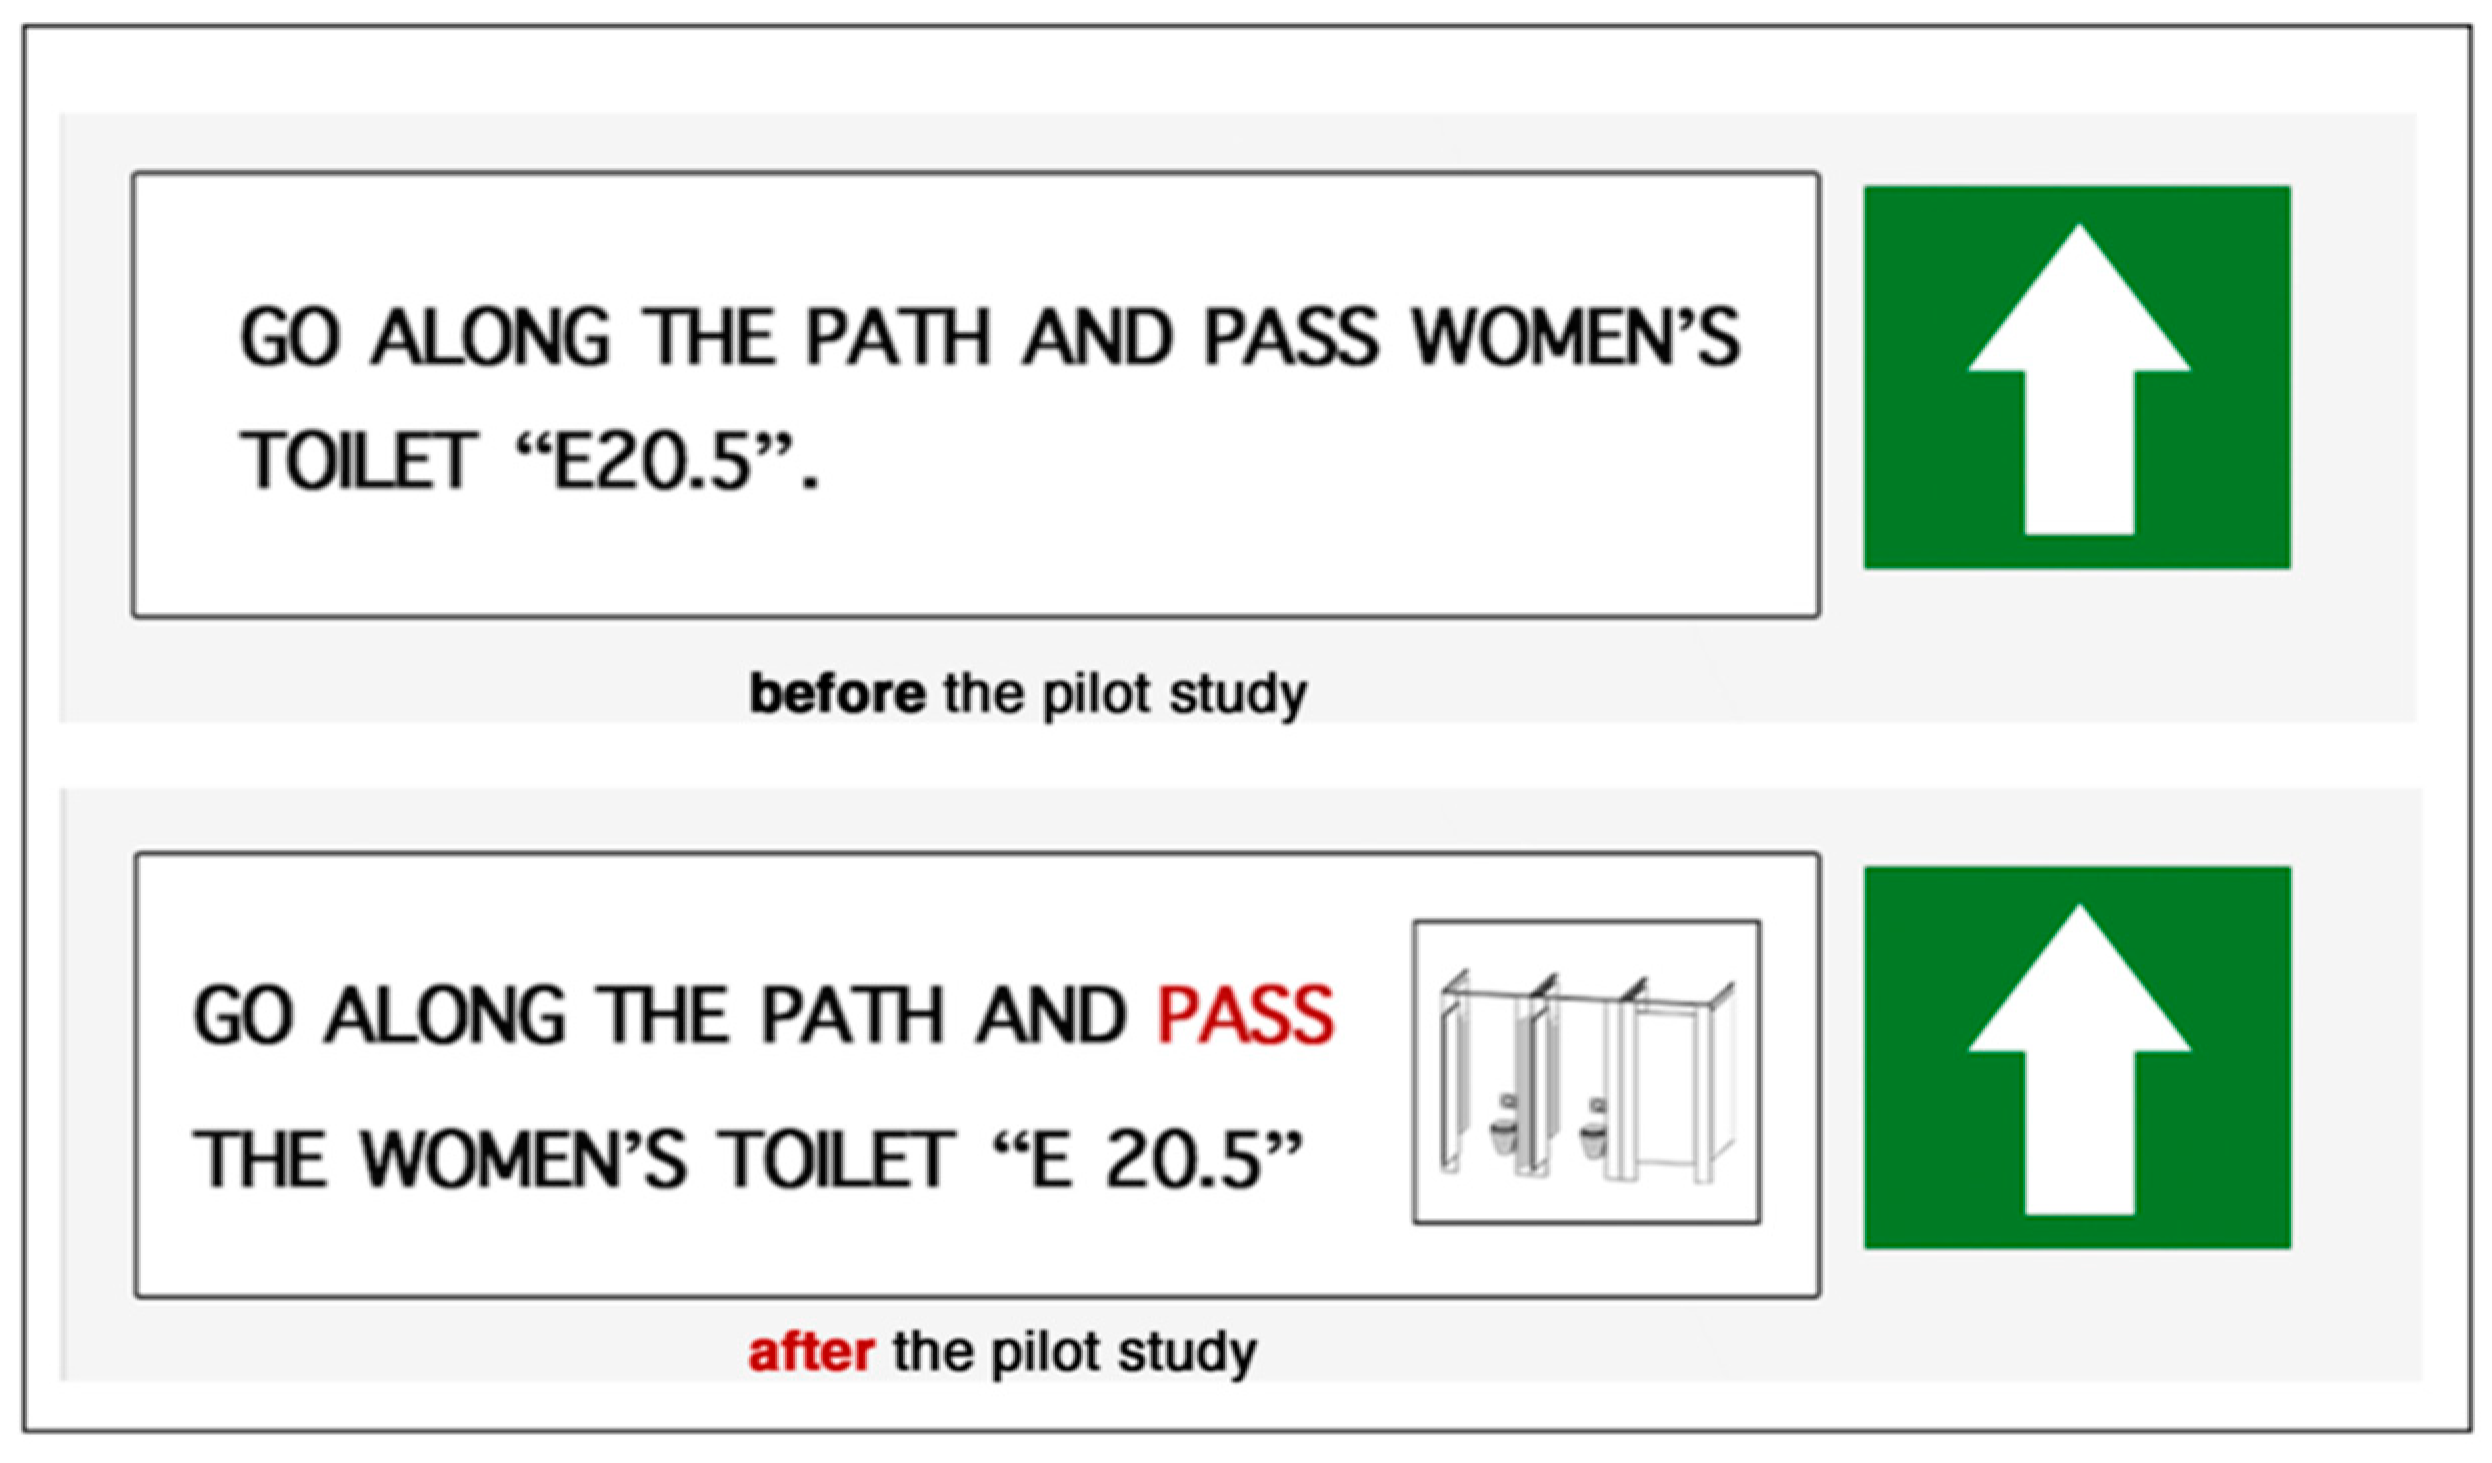
- “Go along the path and pass women’s toilet E 20.5”;
- “Pass through the door and turn left”;
- “Go along the path. You will pass through one door“;
- “After the men’s toilet E 11.2 turn right”;
- “Go along the path. After the scanner/printer, turn slight left“;
- “Go along the path and pass the stairs on your left”;
- “Go along the path and pass the auditoriums”;
- “After the auditorium E9, use the stairs to go to the level below”;
- “Turn right”;
- “Turn right and pass the elevators on your right”;
- “Go along the path. You will pass through one door”;
- “The path leads straight to your destination point”.
- “After 2.5 m turn right”;
- “Go along the path and after 7 m turn left”;
- “Go along the path. After 33 m turn right”;
- “Go along the path. After 25 m turn slight left”;
- “Go along the path for the next 67 m”;
- “Use the stairs to go the level below”;
- “Turn right”;
- “Go along the path and after 7 m turn right”;
- “Go along the path for the next 24 m”;
- “The path leads straight to your destination “room D 55.2””.
3.3.3. Design Procedure of the Selected Landmarks
Pictogram-Based Landmarks
Axonometric-Based Landmarks
4. User Study
- A pilot study;
- Wayfinding experiment with 30 participants;
- Results interpretation.
4.1. Pilot Study
- A pre-test application would be beneficial to improve the quality of the collected data during the final experiment. Participants would have the opportunity to get familiarized with the routing application, thus they could test and give feedback regarding the application in a more efficient and unbiased way.
4.2. Experiment Procedure
- Two pre-study questionnaires. In the first one, the participants were asked to provide their demographic information (age, country of origin, current profession), their level of experience with digital maps and navigation systems, as well as their experience in navigating within the HIL building (test area). The second questionnaire was the Santa Barbara sense of direction scale (SBSODS), a standardized questionnaire for the self-report of participants’ spatial abilities [15].
- Participation in a small pre-test experiment in order the participants to get familiarized with the indoor navigation assistance application.
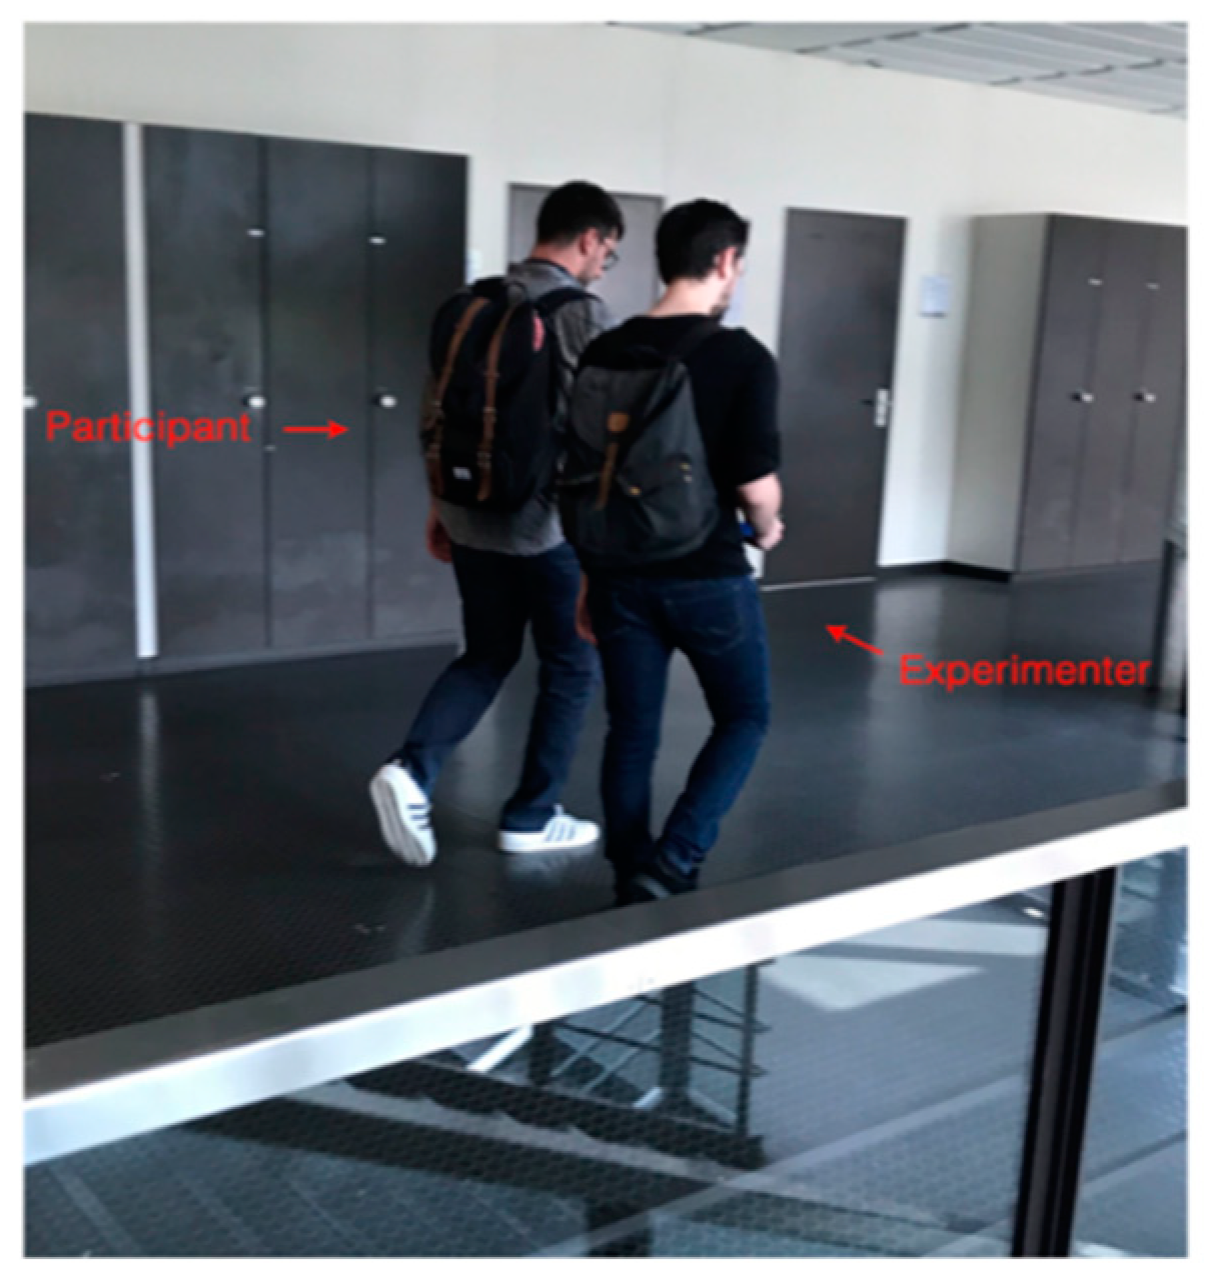
- Participation in the actual experiment (Figure 18).
- Answer to three questionnaires regarding participants’ overall user experience, the cognitive workload of theirs, as well as the evaluation of the design aspects of the application (Figure 19).
4.3. Tracked Data
4.4. Participants
4.5. Hypothesis Statement
- H1: The navigation performance based on the two landmark-based routing applications will be more efficient in terms of number of errors occurred during the navigation task, compared to the benchmark approach (metric-based).
- H2: The navigation performance based on the two landmark-based routing applications will be more efficient in terms of total completion time of experiment’s navigation task, compared to the benchmark approach (metric-based).
- H3: The user experience in terms of attractiveness, of the two landmark-based routing applications (pictogram-based and axonometric-based), will be better, in comparison to the benchmark approach (metric-based).
- H4: The user experience in terms of pragmatic quality aspects (perspicuity, efficiency, and dependability), of the two landmark-based routing applications (pictogram-based and axonometric- based), will be better, in comparison to the benchmark approach (metric-based).
- H5: The overall user experience in terms of hedonic quality aspects, of the two landmark-based routing applications (pictogram-based and axonometric-based), will be better, in comparison to the benchmark approach (metric-based).
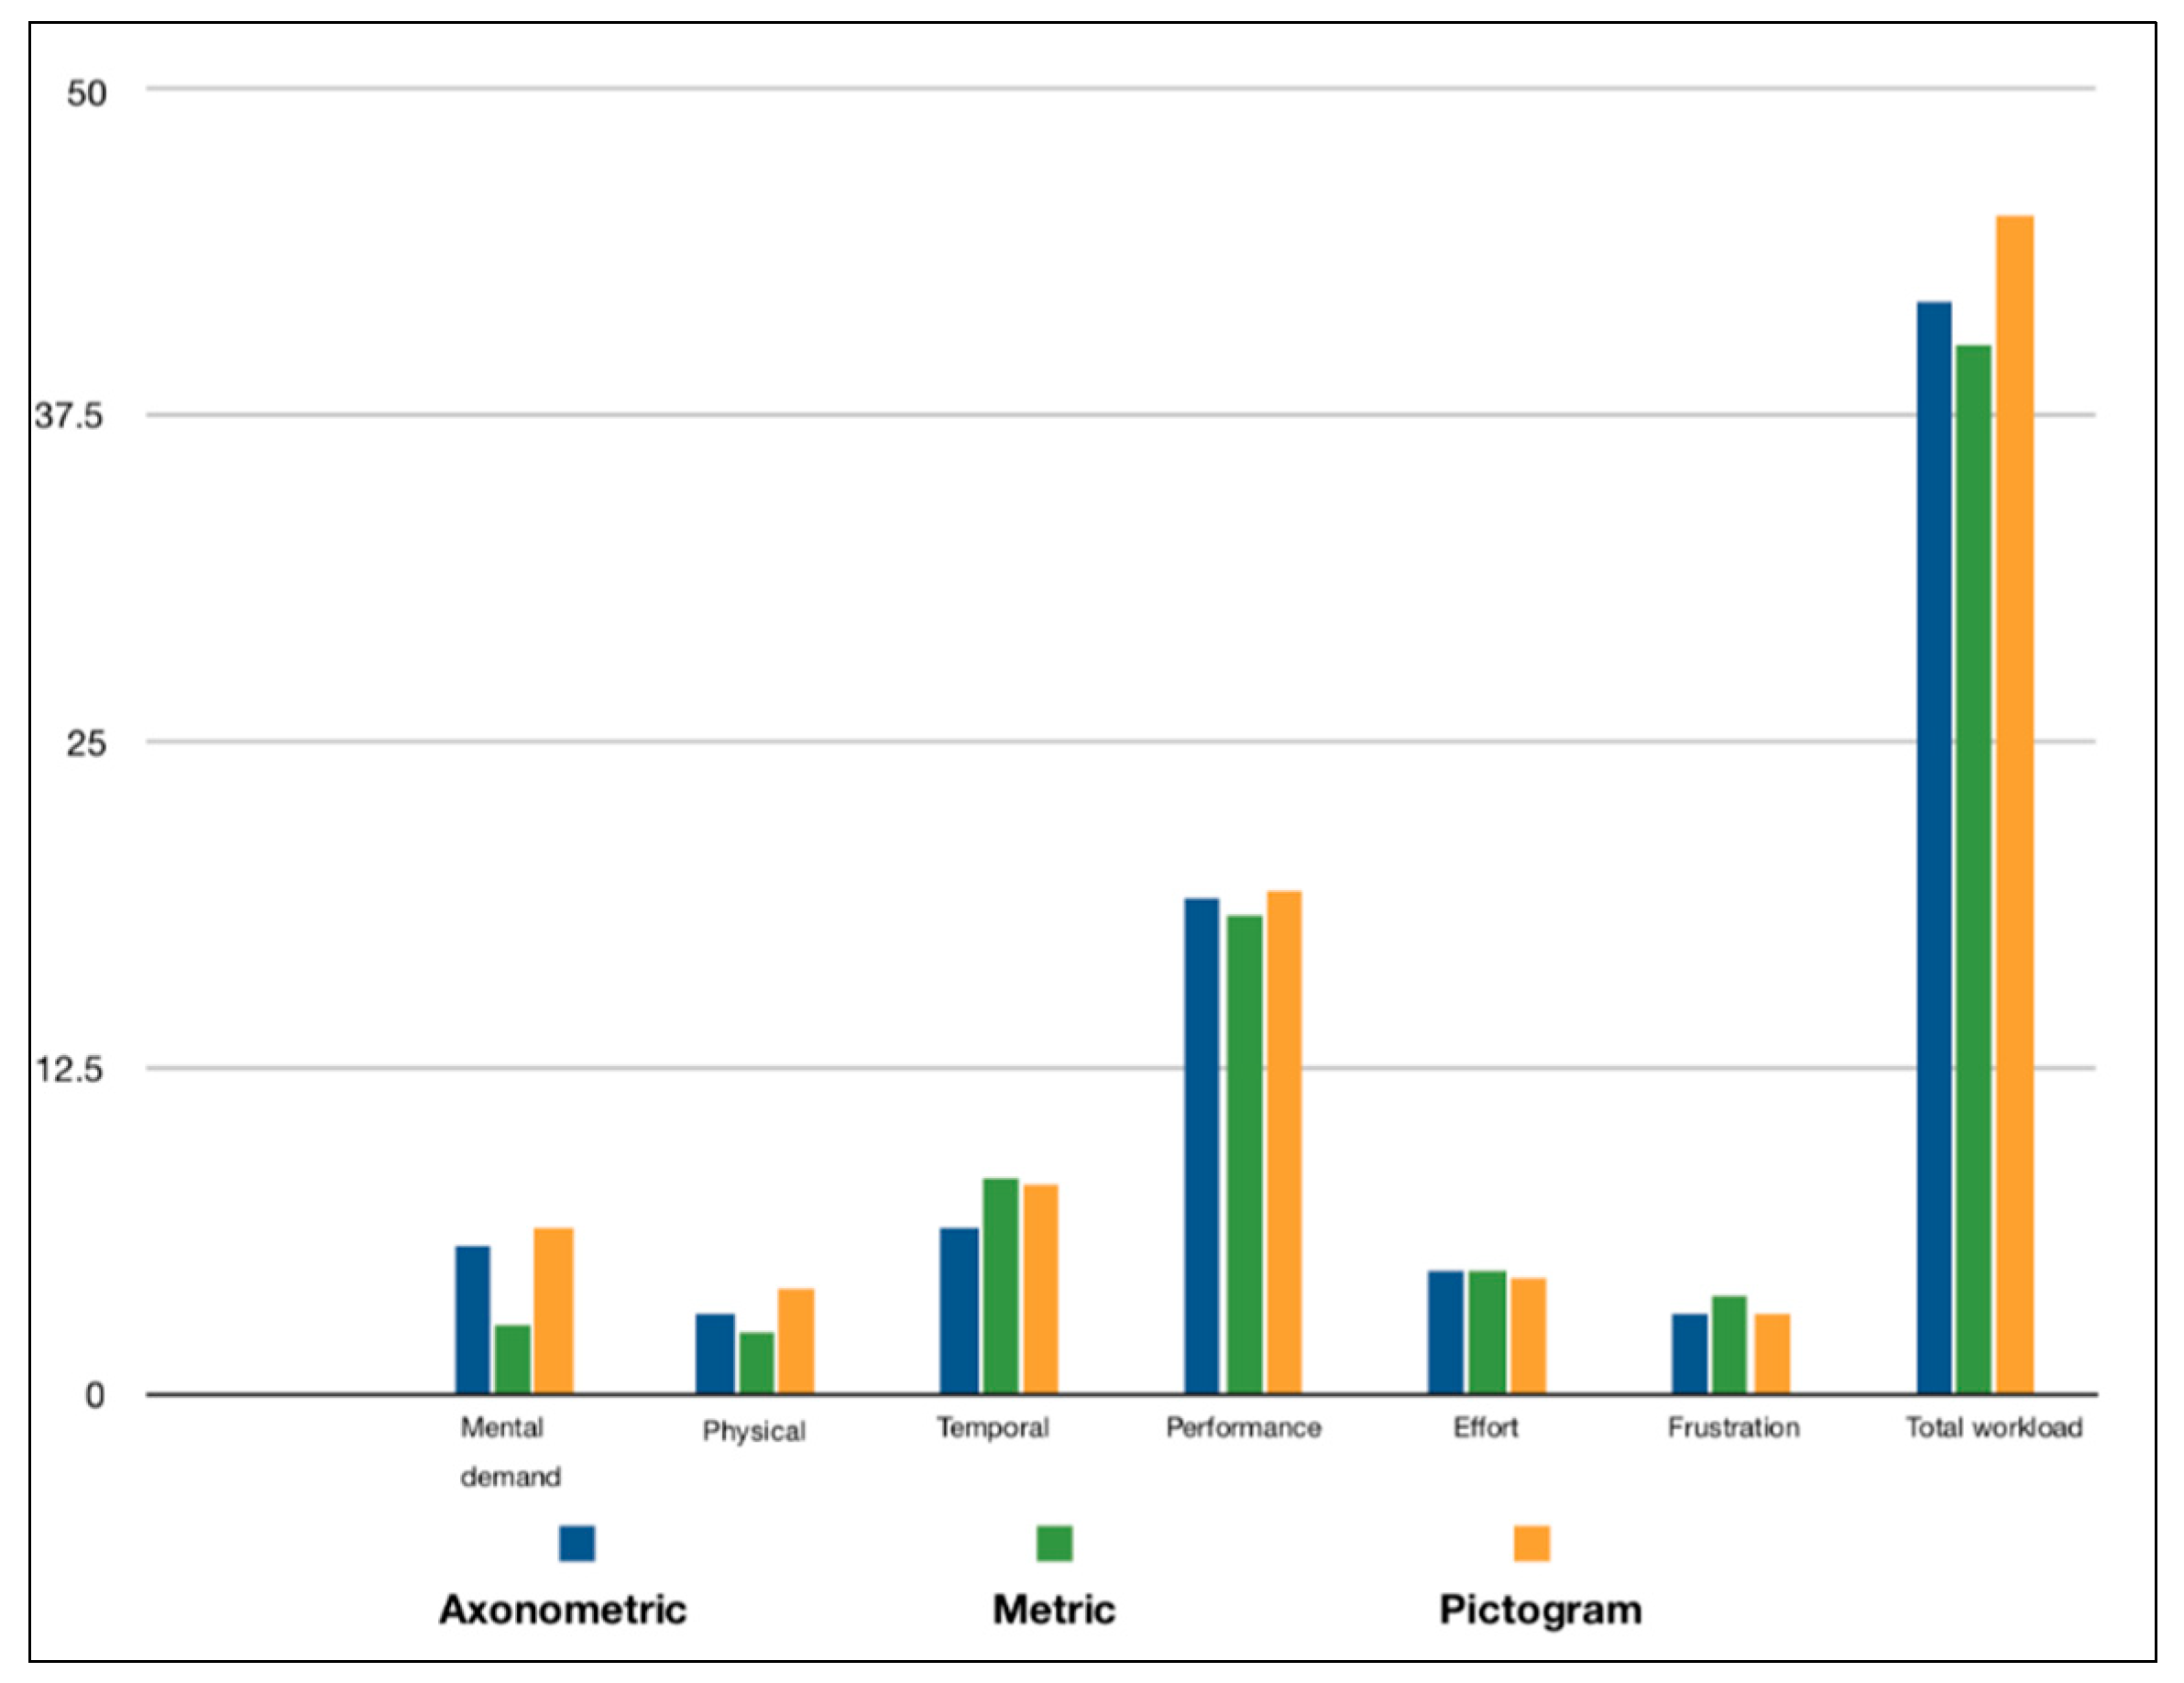
- H6: The perceived cognitive workload in terms of effort and frustration, will be lower during the landmark-based approaches, in comparison to the benchmark approach (metric-based).
- H7: The perceived cognitive workload in terms of performance, will be higher during the land- mark-based approaches, in comparison to the benchmark approach (metric-based).
- H8: The overall perceived cognitive workload will be higher during the benchmark approach (metric-based).
5. Statistical Analysis and Graphs
5.1. Navigation Performance
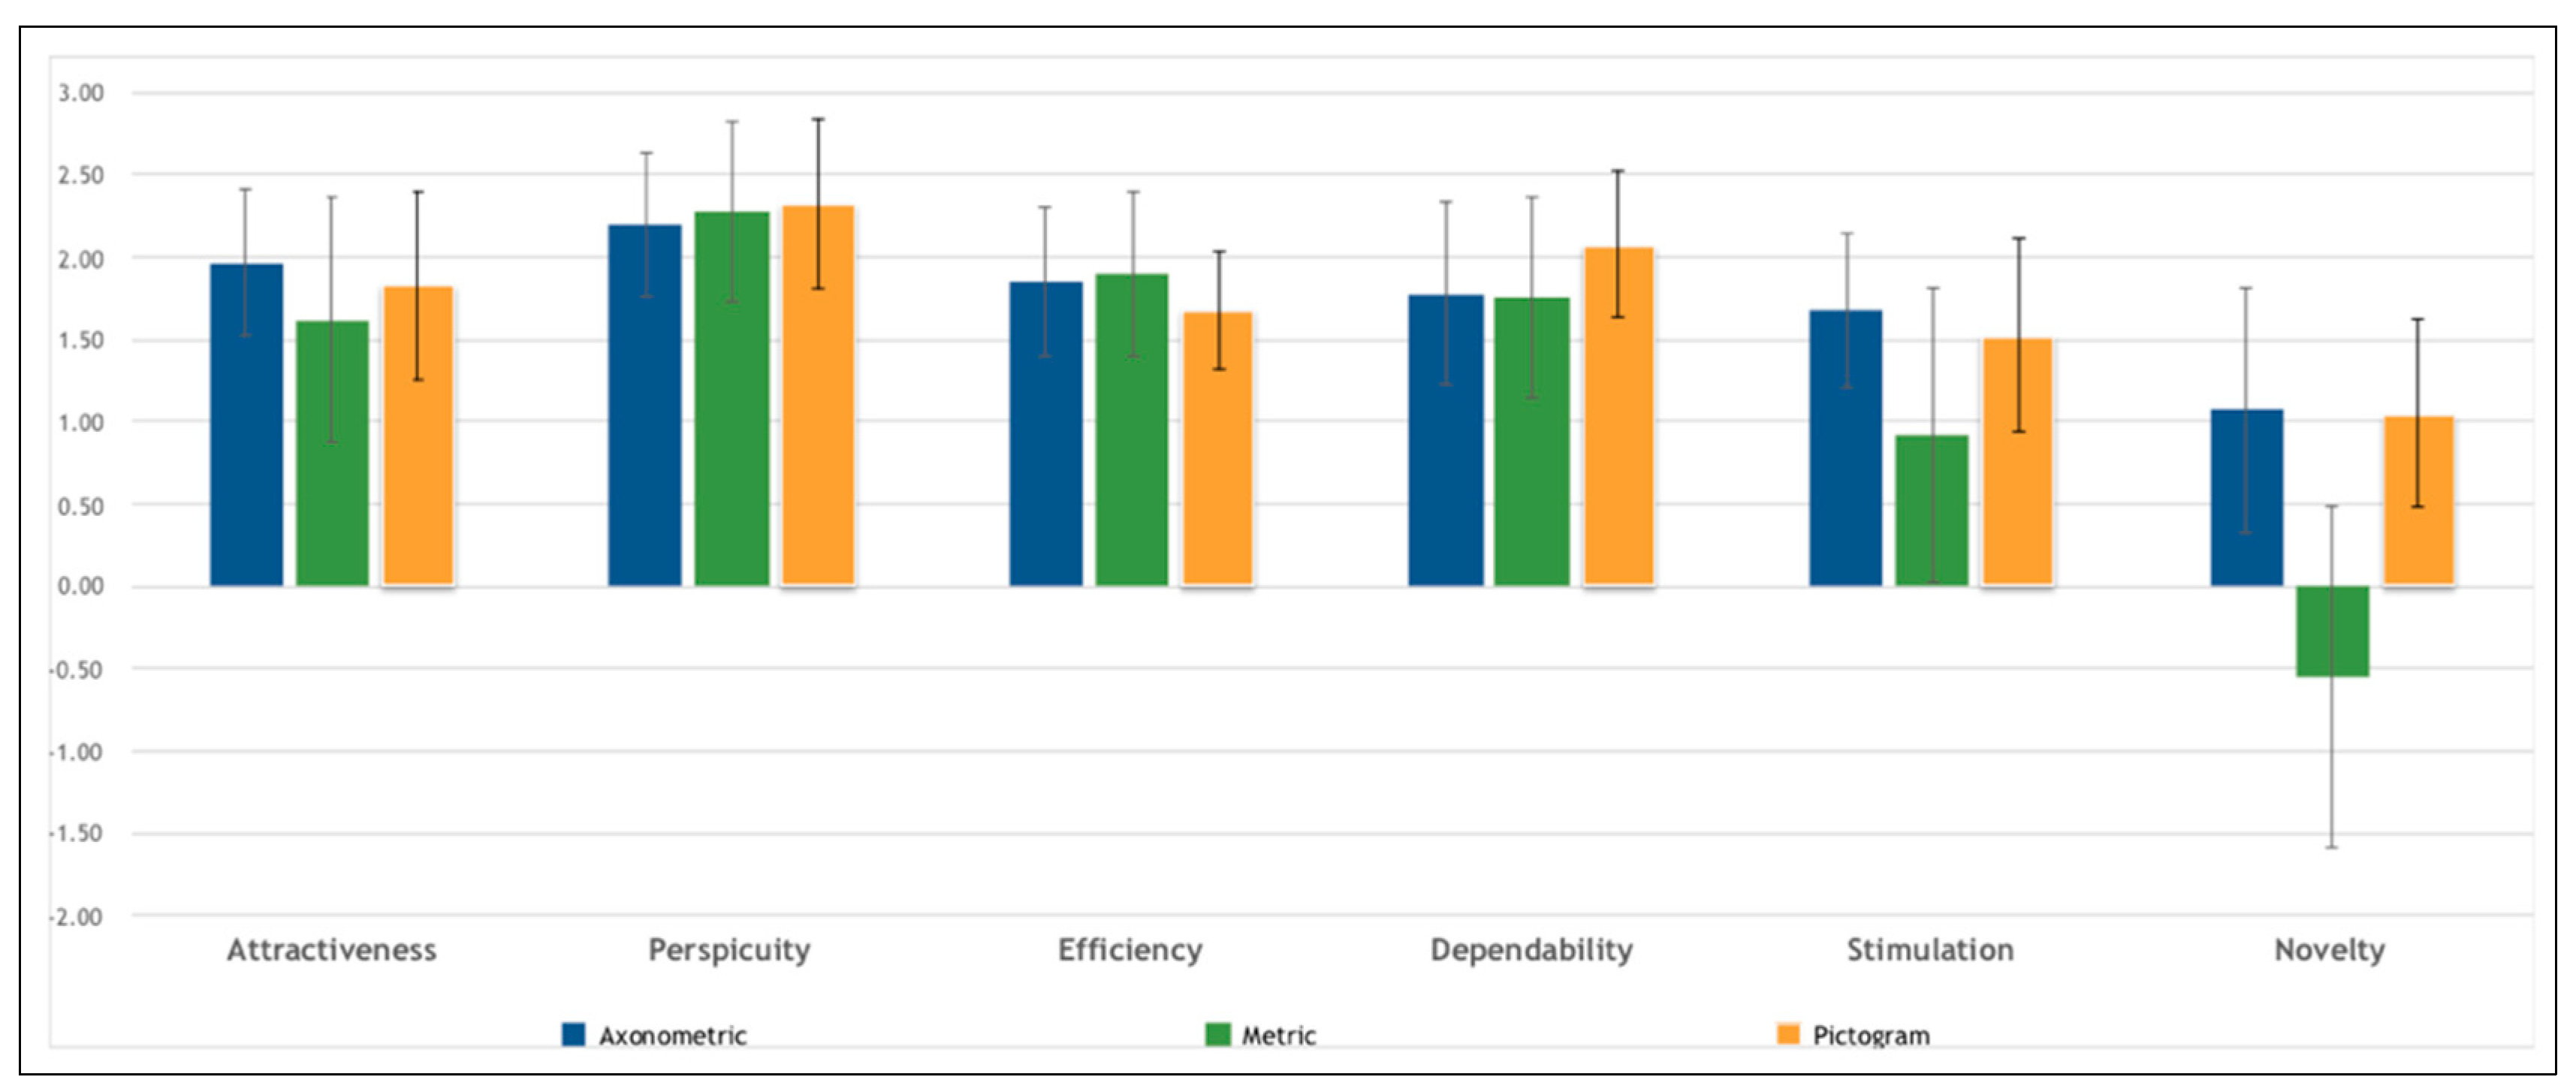
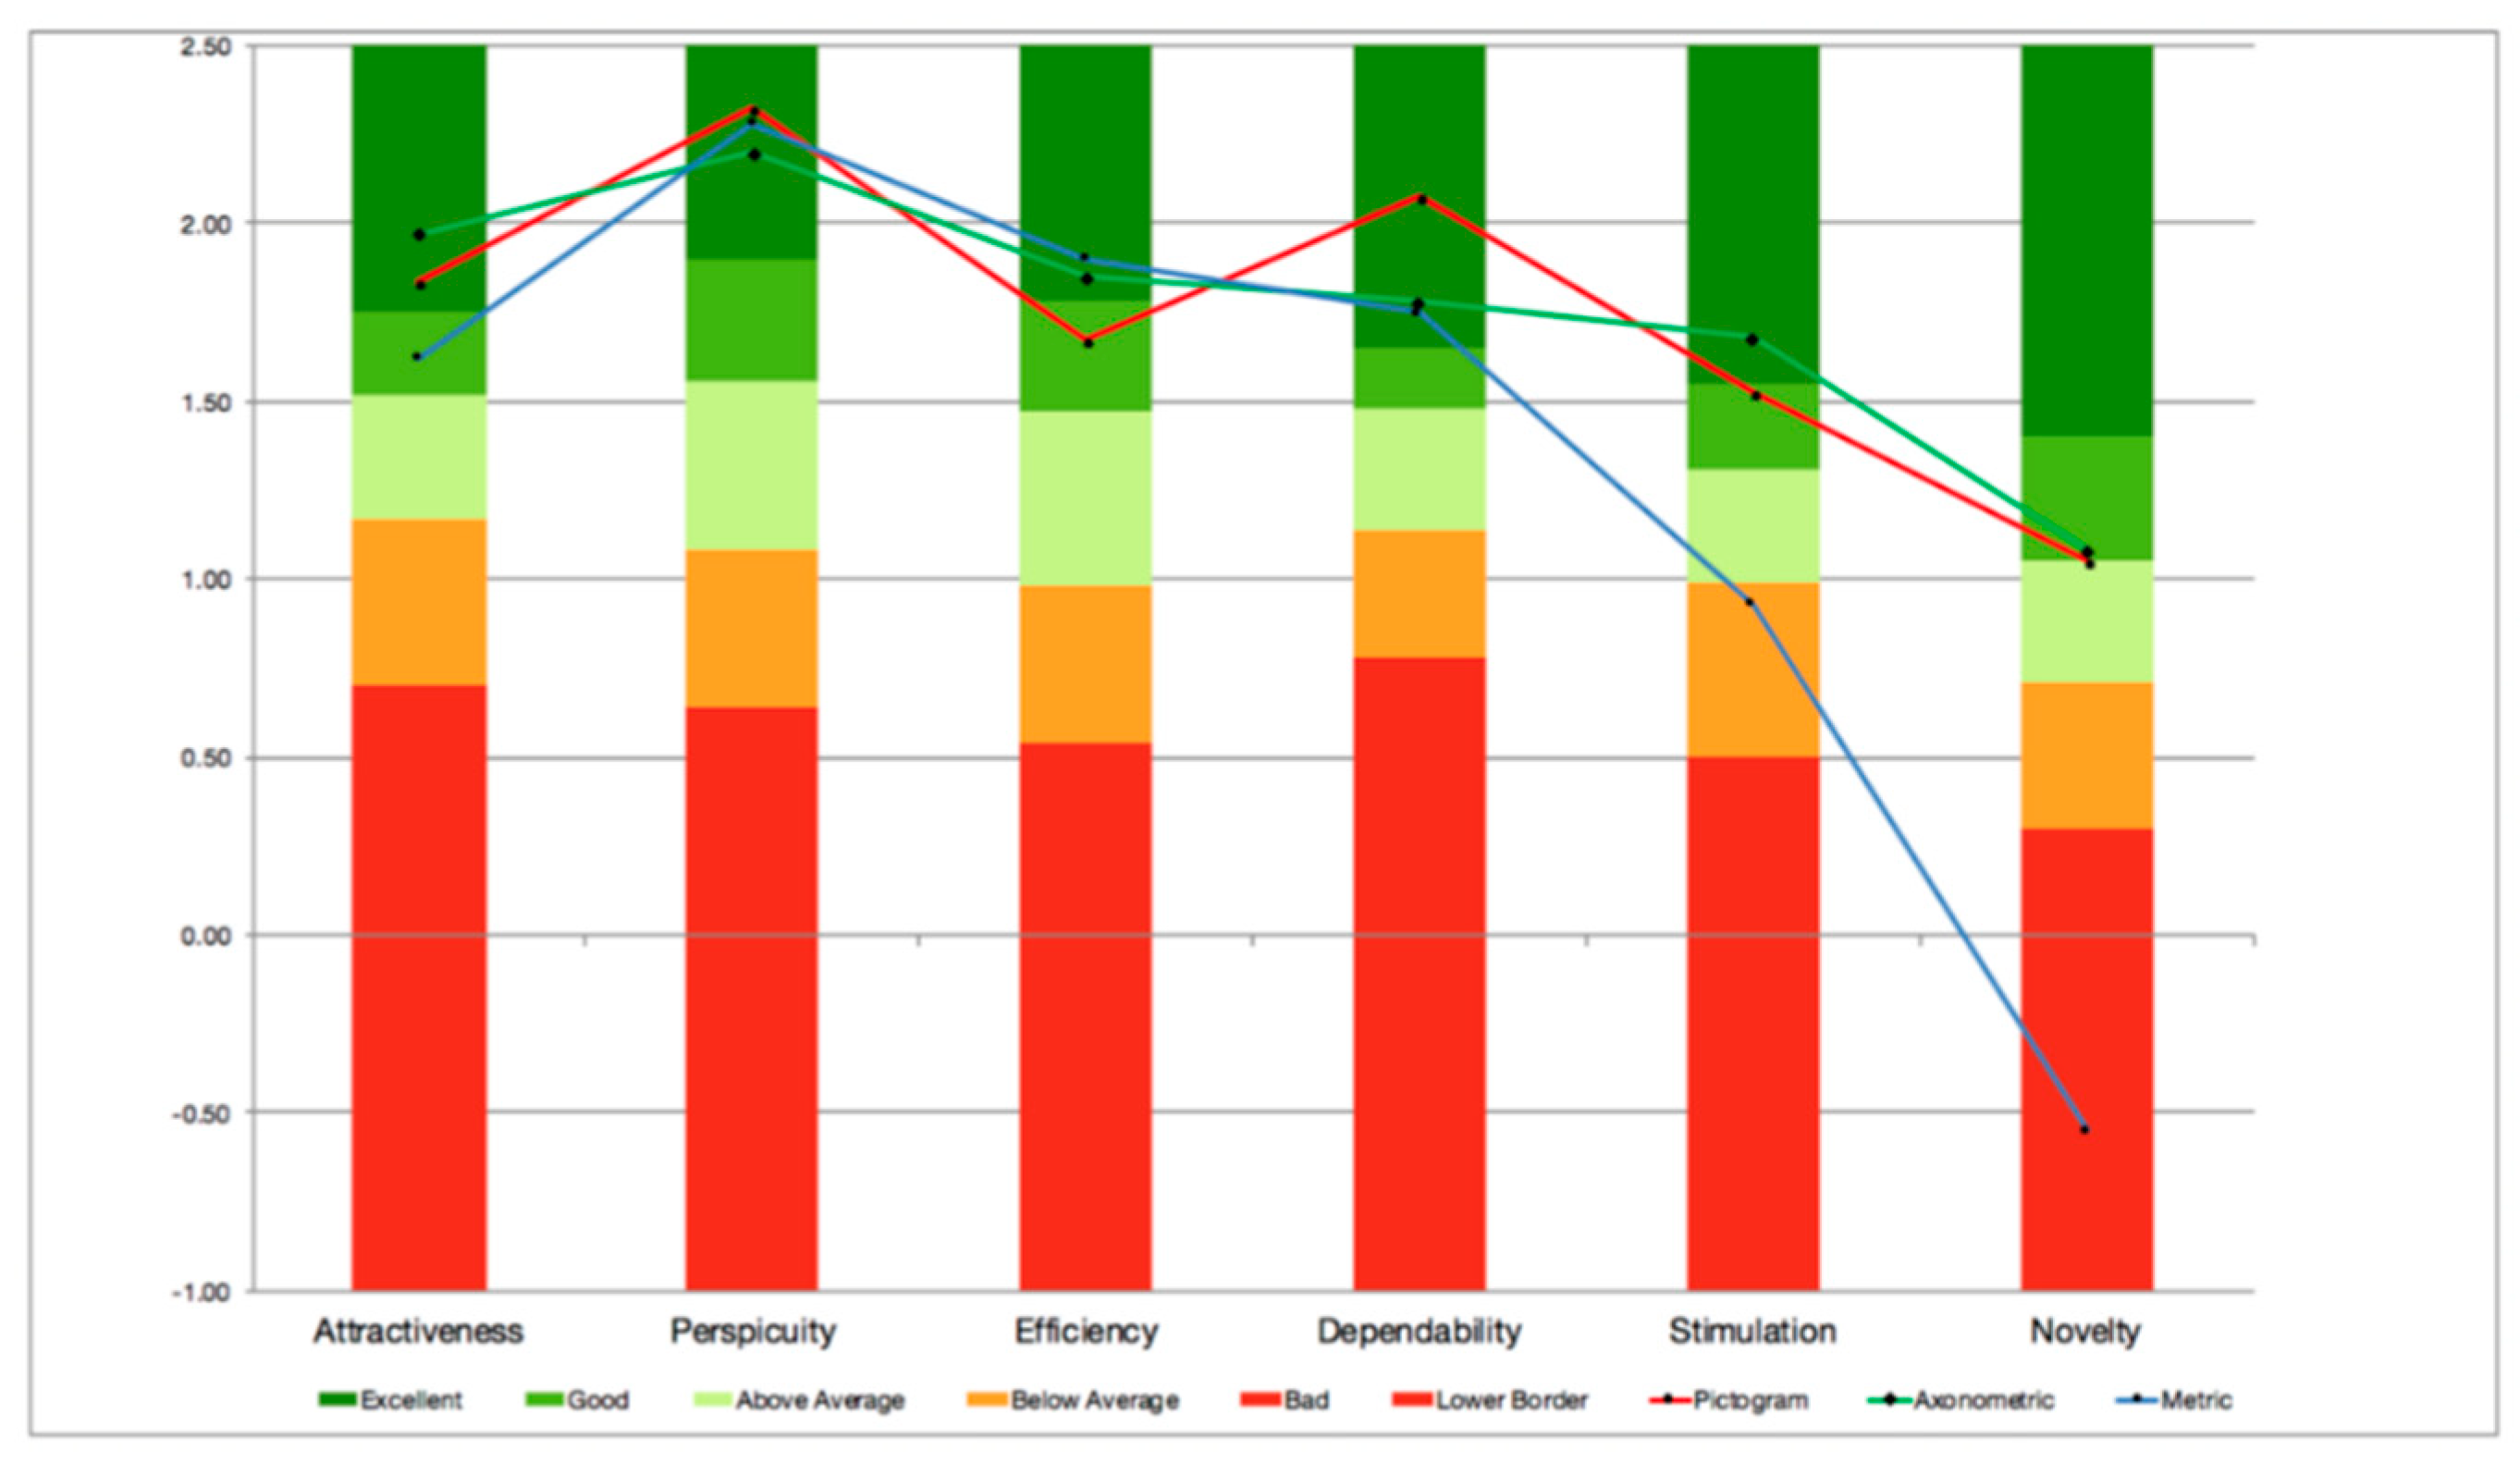
5.2. User Experience
- Attractiveness: Overall impression of the product. Do users like or dislike it? Is it attractive, enjoyable, or pleasing?
- Perspicuity: Is it easy to get familiar with the product? Is it easy to learn? Is the product easy to understand and unambiguous?
- Efficiency: Can users solve their tasks without unnecessary effort? Is the interaction efficient and fast? Does the product react to user input quickly?
- Dependability: Does the user feel in control of the interaction? Can he or she predict the system’s behavior? Does the user feel confident when working with the product?
- Stimulation: Is it exciting and motivating to use the product? Is it enjoyable to use?
- Novelty: Is the product innovative and creative? Does it capture the user’s attention?
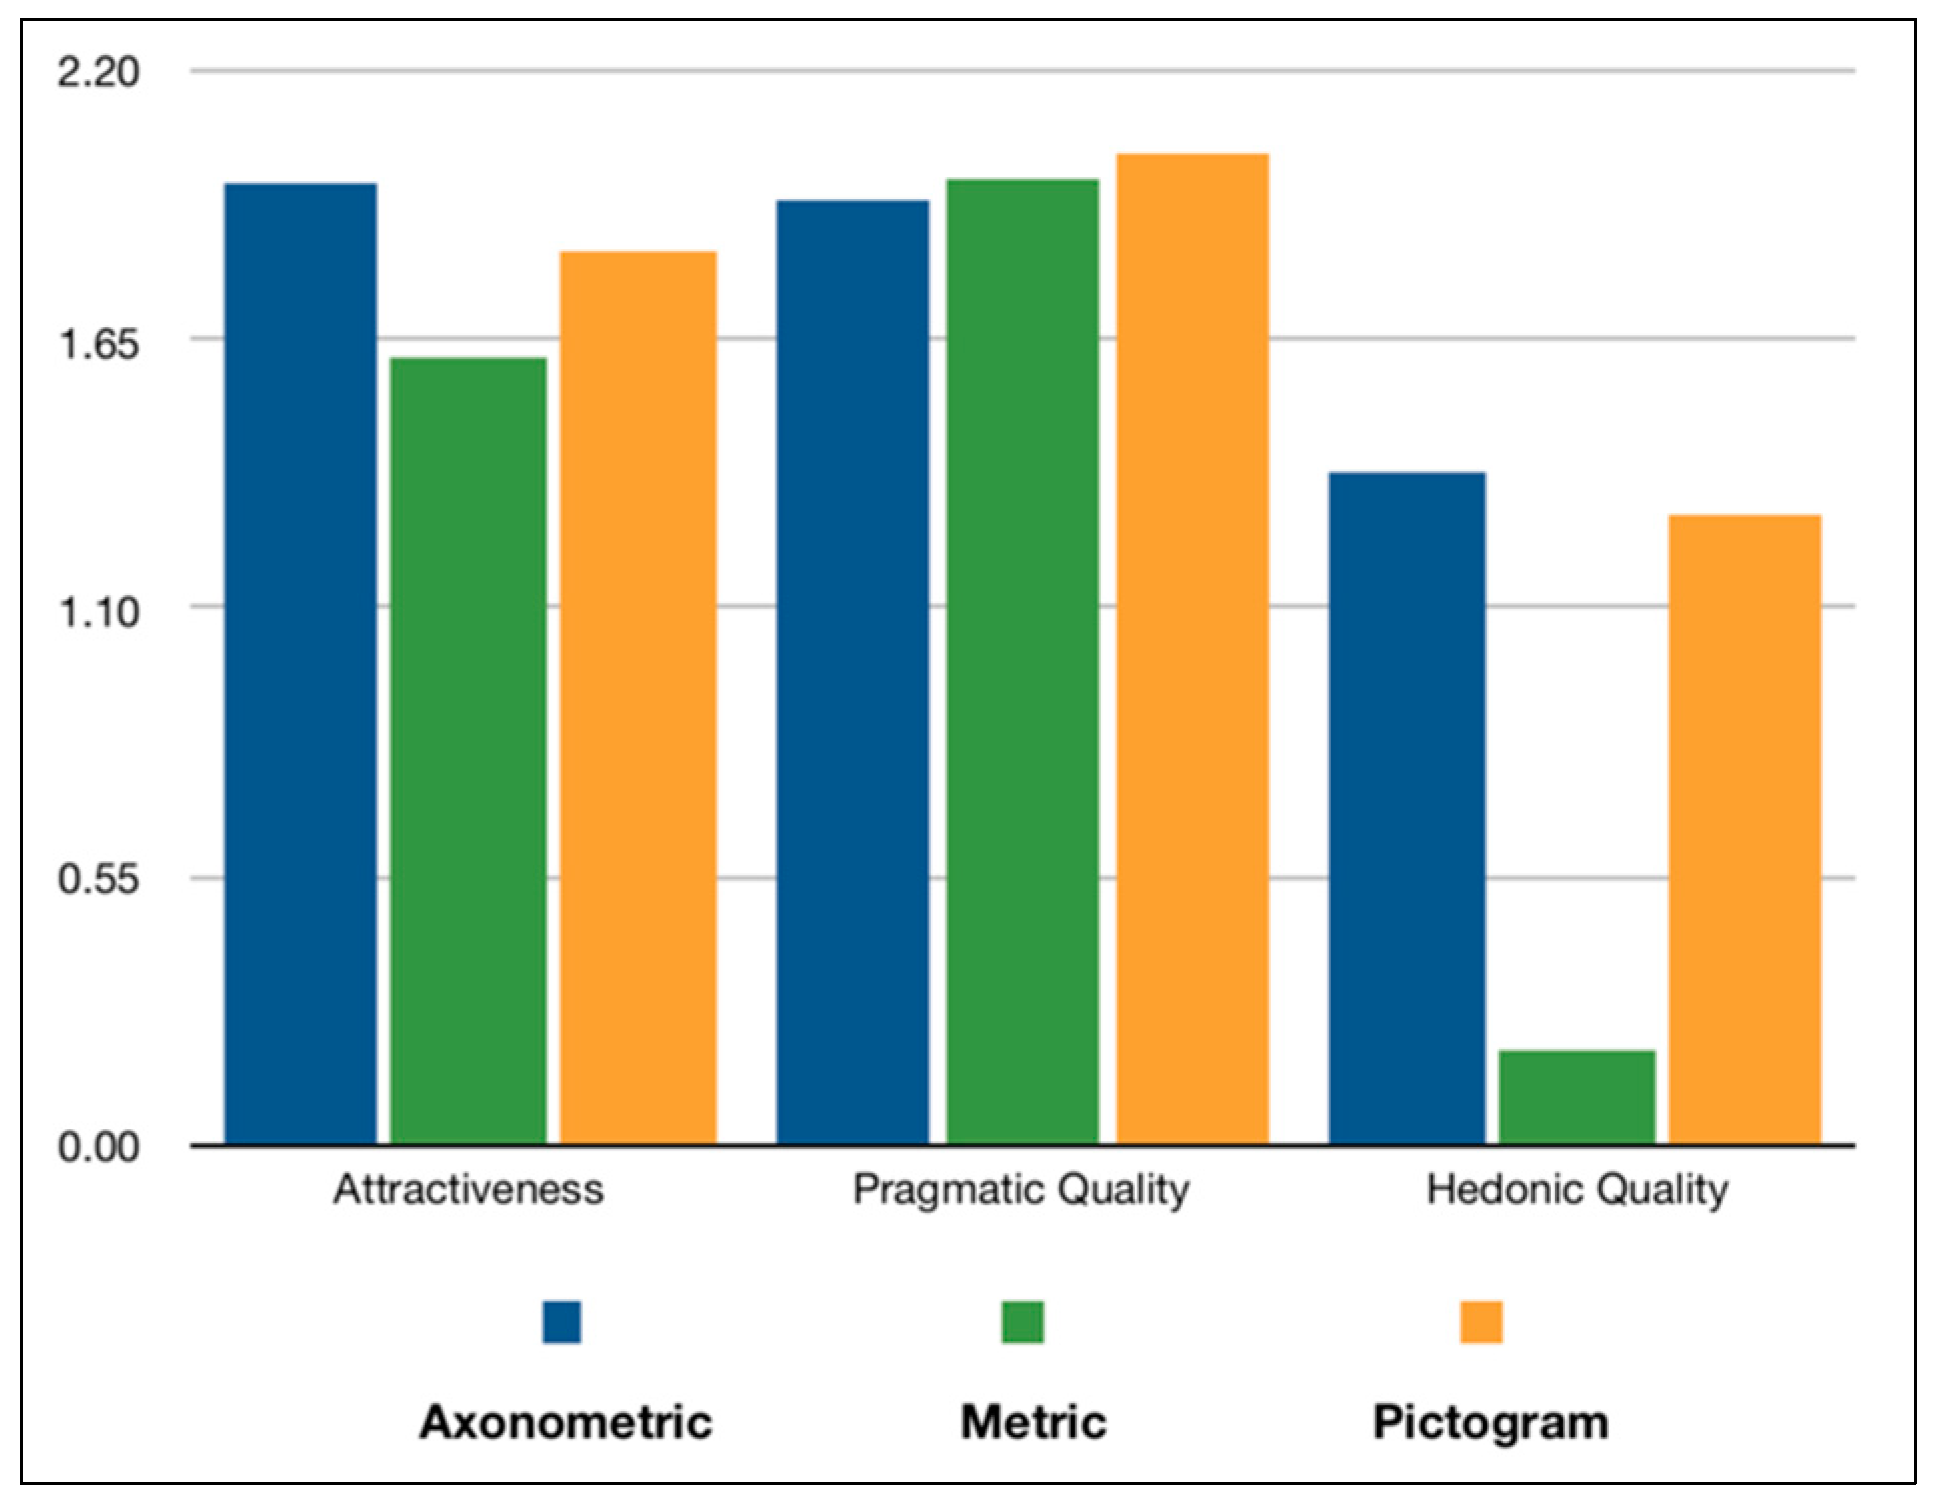
- Attractiveness: Pure dimension that indicates emotional reaction on a pure acceptance/rejection context.
- Pragmatic quality aspect: User experience scales describing interaction qualities, related to tasks or goals the user aims to reach while using the product. In this category belong the scales of perspicuity, efficiency, and dependability.
- Hedonic quality aspect: Scales that are not related to tasks and goals, but with user experience aspects, associated with pleasure and satisfaction. In this category belong the scales of stimulation and novelty.
5.3. Cognitive Workload
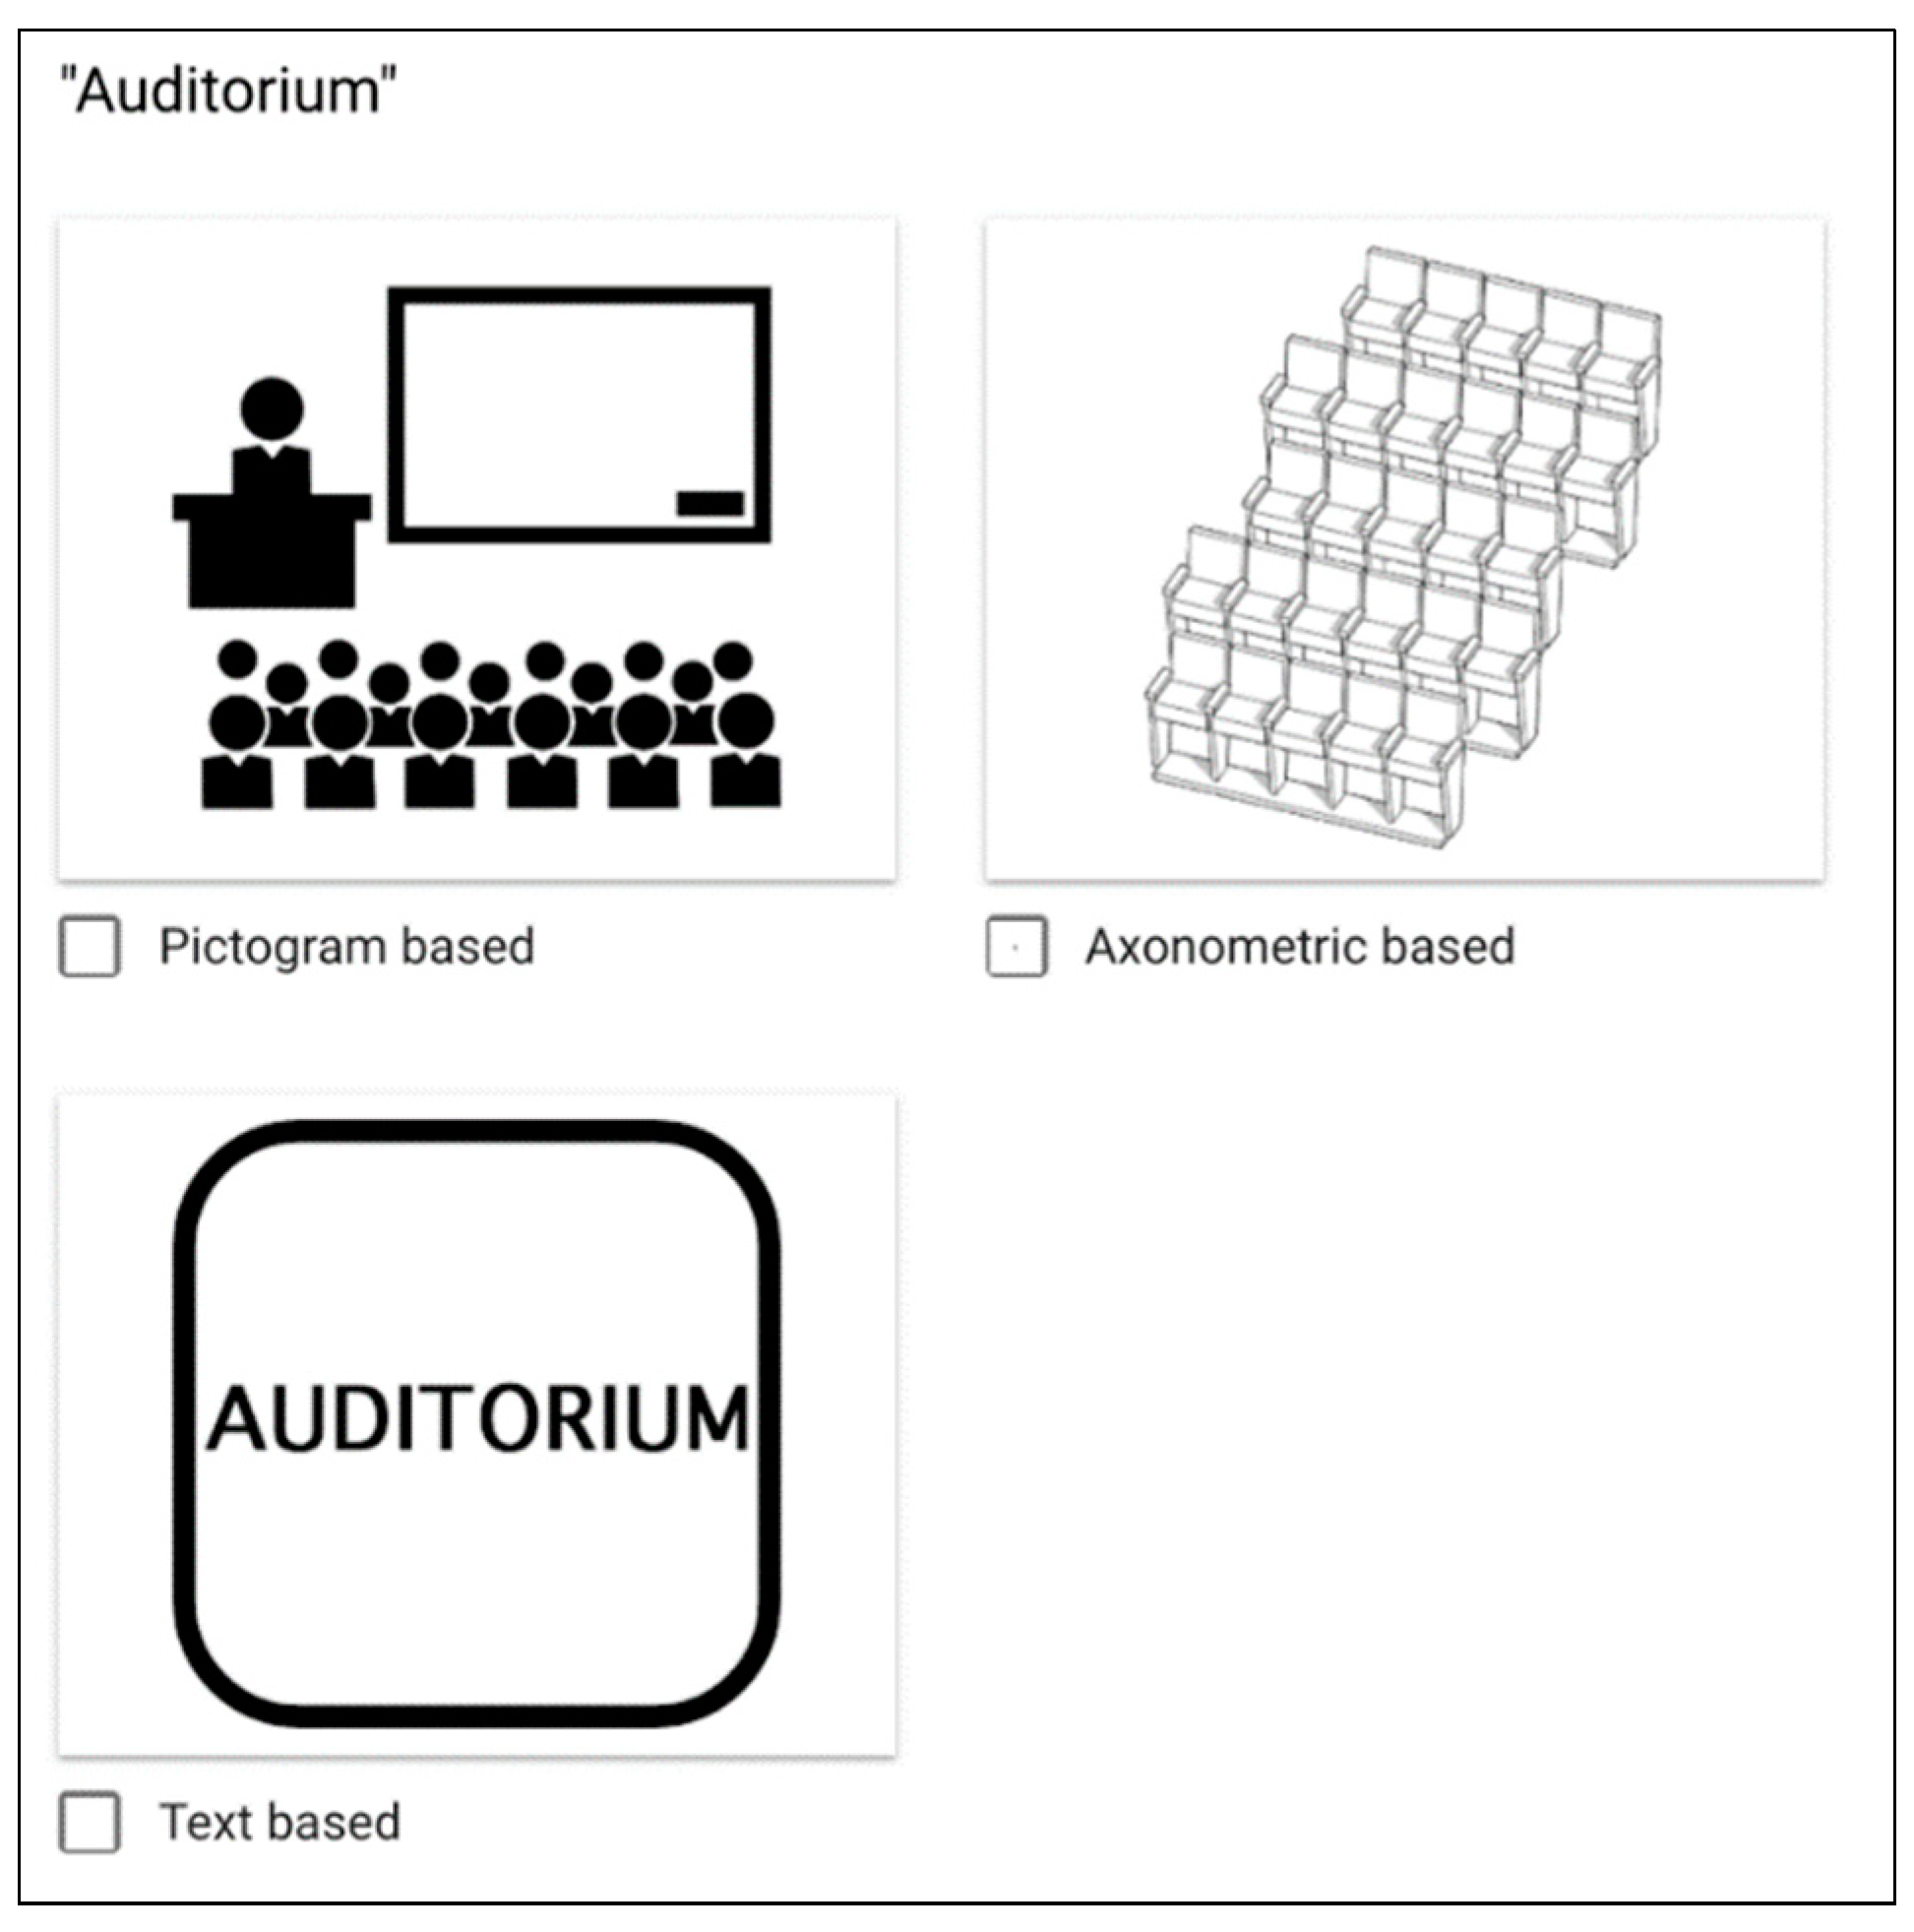
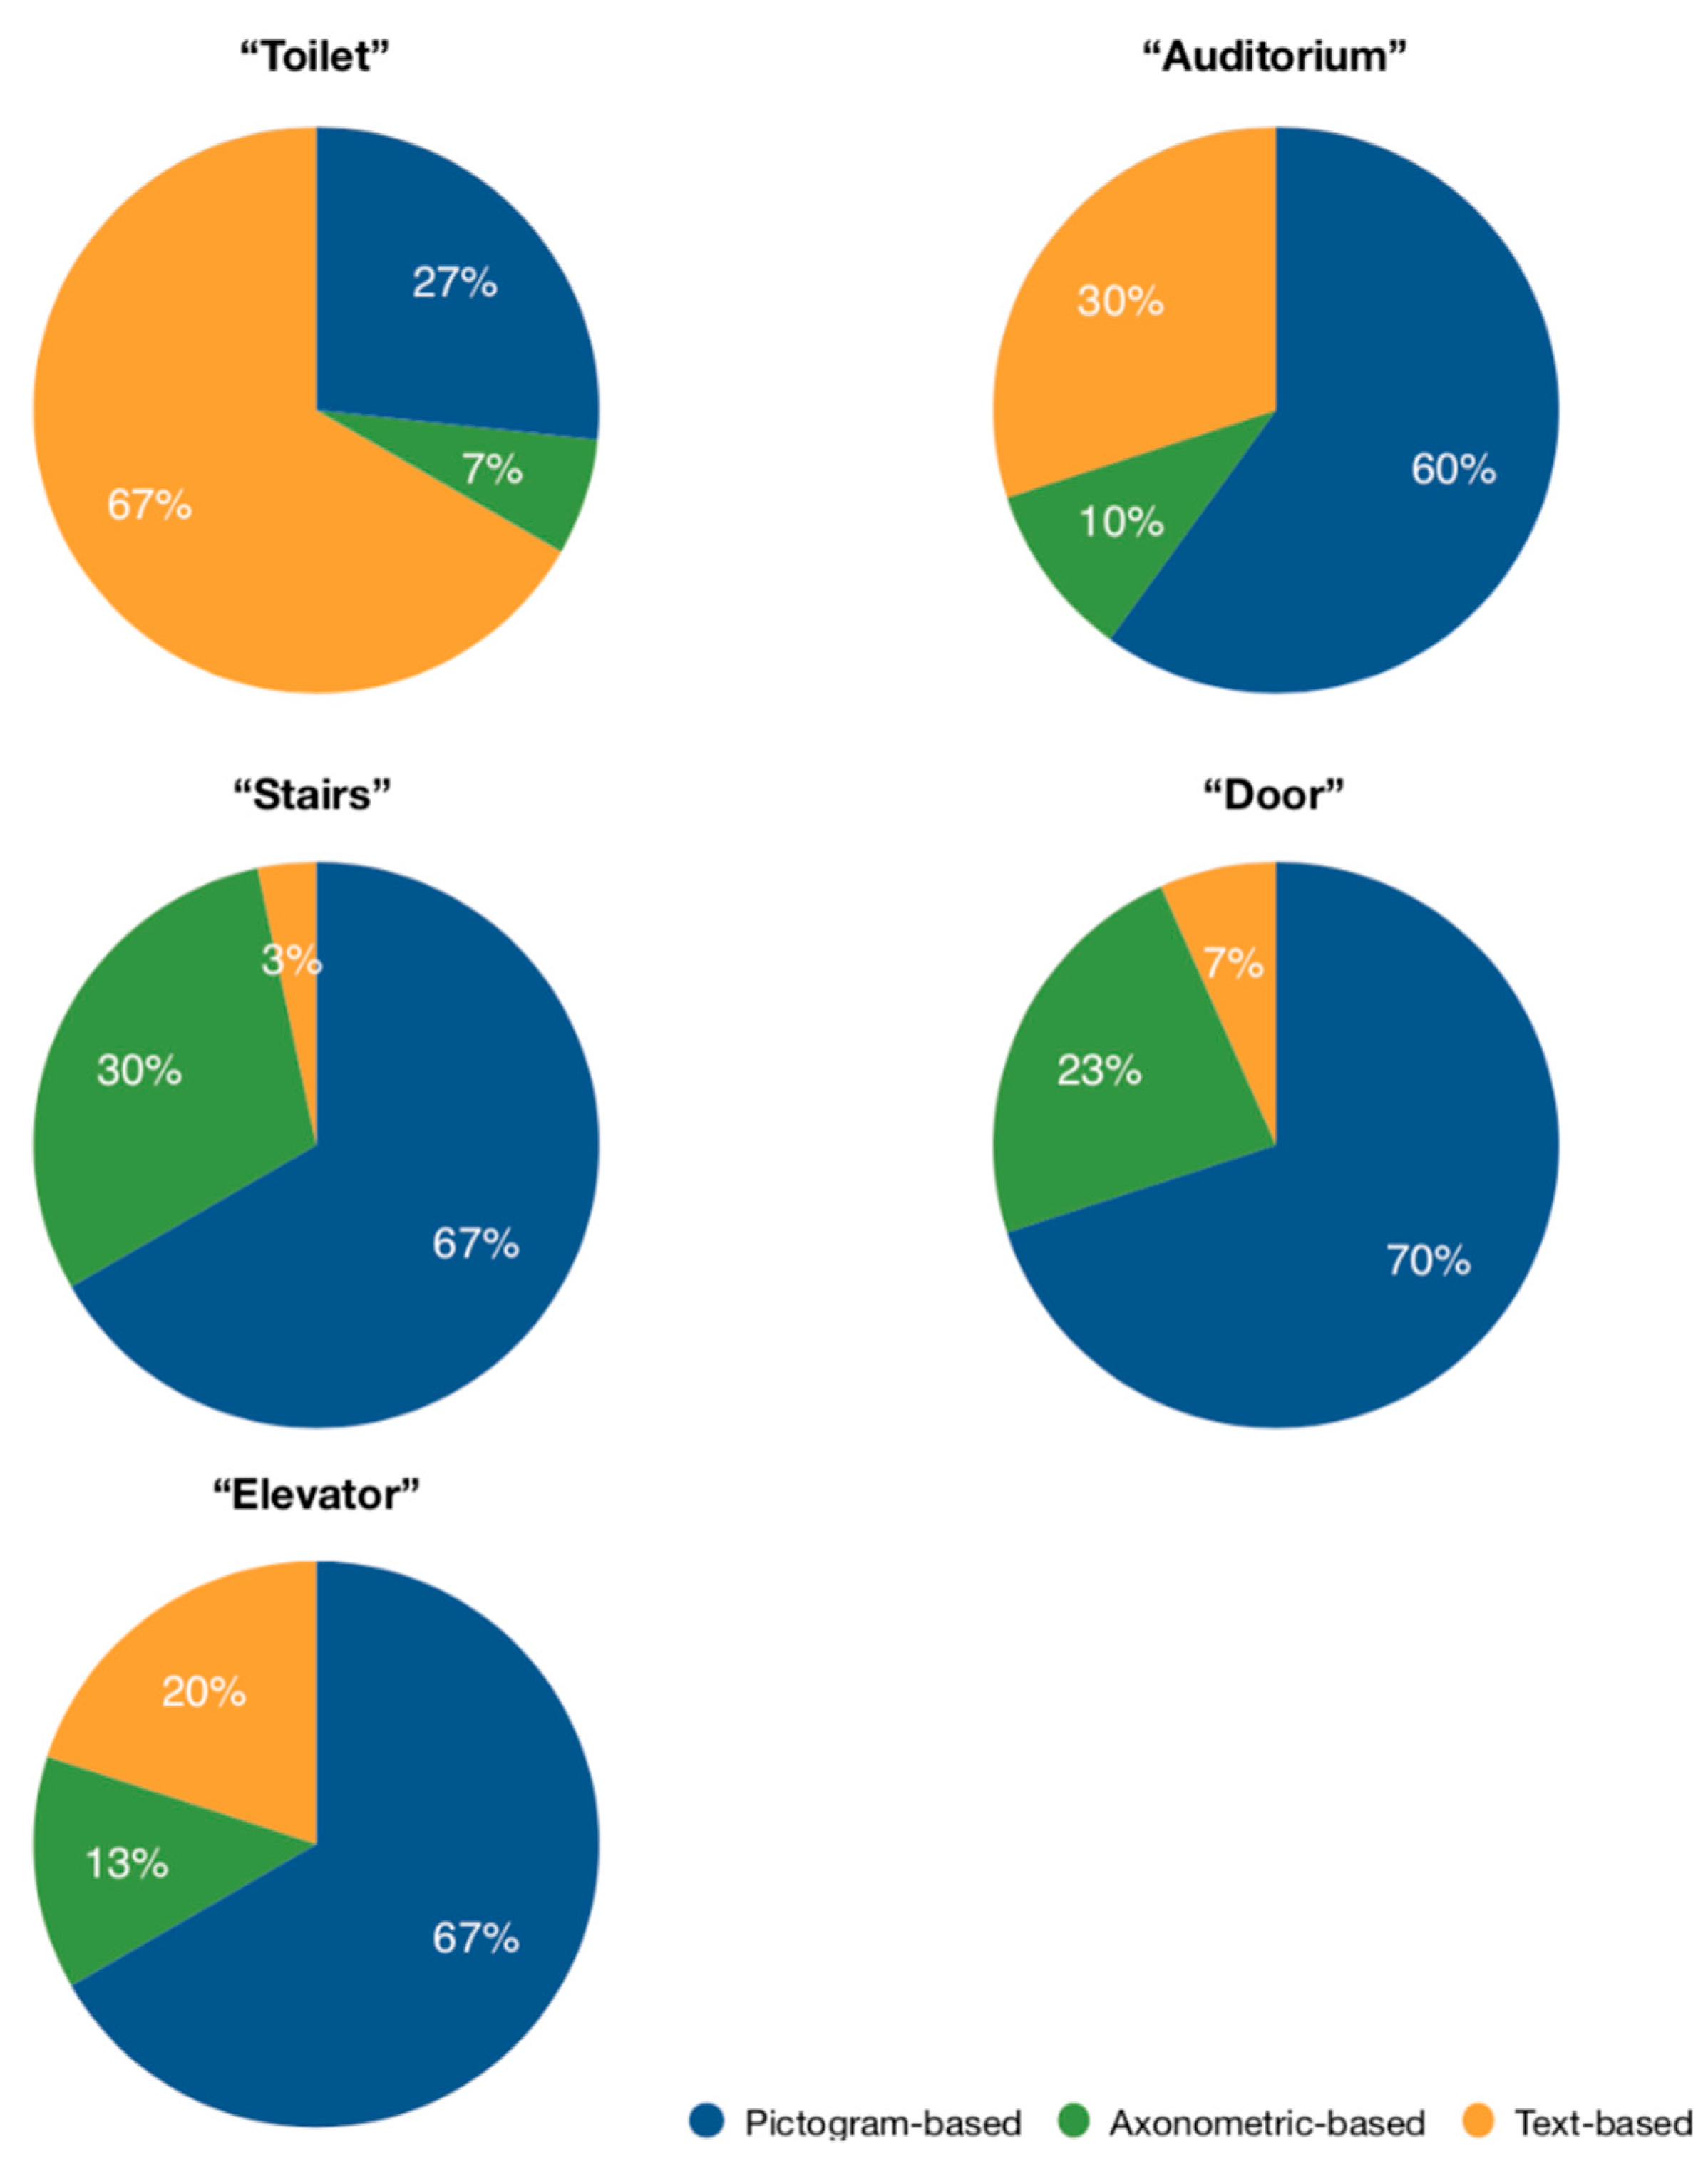
5.4. Landmarks Visualization Design Evaluation
- Pictogram-based;
- Axonometric-based;
- Text-based.
6. Discussion
6.1. Navigation Performance
- Total number of errors occurred during the navigation task;
- Total time each of the participants needed to complete the navigation task.
6.2. User Experience
6.3. Cognitive Workload
6.4. Limitations
7. Conclusions and Outlook
- Conduct of wayfinding experiment on larger scale: The design and conduct of a wayfinding experiment, for which more participants will be recruited. Also important would be the selection of a more diverse group of participants (similar number of male and female participants, different age groups). This will lead to more concrete and substantial results, mainly in terms of participants’ user experience and cognitive workload analysis among the three different cartographic scenarios. Moreover, also beneficial in that context will also be the selection of a larger test area with more diverse sub-paths along the route, in terms of navigation difficulties.
- Design and conduct of a wayfinding experiment, in which experienced and non-experienced participants within the testing area will be included: Investigate possible differences in terms of navigation performance between these two different participants’ categories.
- Examine other possible ways for landmarks visualization: Important in the further improvement of the current work would be the examination of other forms of representing the selected landmarks within the route maps. For instance, interesting would be the design of a cartographic visualization scenario with the inclusion of text-based or even sketch-based landmarks representations. Moreover, an important aspect must be the adoption of design approaches with the same level of detail complexity. This can lead, on the one hand, to landmarks visualizations that are semantically and visually equivalent, and on the other hand, to more solid conclusions regarding the evaluation of the cartographic representations of the landmarks.
- Evaluation of cartographic visualization approaches in different mobile screen sizes: The use of different mobile screen sizes in this experimental framework will help to evaluate in a more unbiased way landmark visualization approaches, which under the current conditions have been characterized as confusing, due to their high level of detail. More specifically, approaches such as those based on axonometric design philosophy, will be better and more objectively assessed.
- Research on formulating general guidelines for describing landmarks, based on the type of the building: One of the main limitations of the ILNM is the need of a group of experts to evaluate the suitability of the indoor spatial feature categories that may serve as landmarks. On the basis that there are similarities among the indoor spatial objects that exist in buildings of the same type (e.g., hospitals, universities), research on formulating general guidelines for objectively assessing these indoor spatial features, based on the type of the building in which they lie, will be beneficial for the further expansion of the algorithm. In that context, the need of candidate landmarks’ assessment by a group of experts, will no longer be necessary.
Author Contributions
Funding
Conflicts of Interest
References
- Hölscher, C.; Meilinger, T.; Vrachliotis, G.; Brösamle, M.; Knauff, M. Up the down staircase: Wayfinding strategies in multi-level buildings. J. Environ. Psychol. 2006, 26, 284–299. [Google Scholar] [CrossRef]
- Raper, J.; Gartner, G.; Karimi, H.; Rizos, C. A critical evaluation of location based services and their potential. J. Location Based Serv. 2007, 1, 5–45. [Google Scholar] [CrossRef]
- Kohtake, N.; Morimoto, S.; Kogure, S.; Manandhar, D. (Eds.) Indoor and outdoor seamless positioning using indoor messaging system and GPS. In Proceedings of the International Conference on Indoor Positioning and Indoor Navigation (IPIN2011), Guimarães, Portugal, 21–23 September 2011. [Google Scholar]
- Liu, J.; Chen, R.; Pei, L.; Guinness, R.; Kuusniemi, H. A hybrid smartphone indoor positioning solution for mobile LBS. Sensors 2012, 12, 17208–17233. [Google Scholar] [CrossRef] [PubMed]
- Mendelson, E. System and Method for Providing Indoor Navigation and Special Local Base Service Application for Malls Stores Shopping Centers and Buildings Utilize RF Beacons. United States Patent US 8,866,673, 21 October 2014. [Google Scholar]
- Rehrl, K.; Häusler, E.; Leitinger, S. (Eds.) Comparing the effectiveness of GPS-enhanced voice guidance for pedestrians with metric-and landmark-based instruction sets. In International Conference on Geographic Information Science; Springer: Berlin/Heidelberg, Germany, 2010. [Google Scholar]
- Gkonos, C.; Giannopoulos, I.; Raubal, M. Maps, vibration or gaze? Comparison of novel navigation assistance in indoor and outdoor environments. J. Loc. Based Serv. 2017, 11, 29–49. [Google Scholar] [CrossRef]
- Hirtle, S.C.; Raubal, M. Many to many mobile maps. In Cognitive and Linguistic Aspects of Geographic Space; Springer: Berlin/Heidelberg, Germany, 2013; pp. 141–157. [Google Scholar]
- Raubal, M.; Winter, S. (Eds.) Enriching wayfinding instructions with local landmarks. In International Conference on Geographic Information Science; Springer: Berlin/Heidelberg, Germany, 2002. [Google Scholar]
- Duckham, M.; Winter, S.; Robinson, M. Including landmarks in routing instructions. J. Loc. Based Serv. 2010, 4, 28–52. [Google Scholar] [CrossRef]
- Fellner, I.; Huang, H.; Gartner, G. “Turn Left after the WC, and Use the Lift to Go to the 2nd Floor”—Generation of Landmark-Based Route Instructions for Indoor Navigation. ISPRS Int. J. Geo-Inf. 2017, 6, 183. [Google Scholar] [CrossRef]
- Epstein, R.A.; Vass, L.K. Neural systems for landmark-based wayfinding in humans. Phil. Trans. R. Soc. B 2014, 369, 20120533. [Google Scholar] [CrossRef] [PubMed]
- Siegel, A.W.; White, S.H. The development of spatial representations of large-scale environments. Advances in child development and behavior. Adv. Child Dev. Behav. 1975, 10, 9–55. [Google Scholar] [PubMed]
- Kelley, J.F. (Ed.) An empirical methodology for writing user-friendly natural language computer applications. In Proceedings of the SIGCHI conference on Human Factors in Computing Systems, Boston, MA, USA, 12–15 December 1983. [Google Scholar]
- Laugwitz, B.; Held, T.; Schrepp, M. (Eds.) Construction and evaluation of a user experience questionnaire. In Symposium of the Austrian HCI and Usability Engineering Group; Springer: Berlin/Heidelberg, Germany, 2008. [Google Scholar]
- Schrepp, M.; Hinderks, A.; Thomaschewski, J. Design and Evaluation of a Short Version of the User Experience Questionnaire (UEQ-S). Int. J. Interact. Multimed. Artif. Intell. 2017, 4, 103–108. [Google Scholar] [CrossRef]
- Schrepp, M.; Olschner, S.; Schubert, U.; User Experience Questionnaire (UEQ) Benchmark. Praxiserfahrungen zur Auswertung und Anwendung von UEQ-Erhebungen im Business-Umfeld. Tagungsband UP13. 2013. Available online: www.ueq-online.org (accessed on 26 March 2019).
- Hegarty, M.; Richardson, A.E.; Montello, D.R.; Lovelace, K.; Subbiah, I. Development of a self-report measure of environmental spatial ability. Intelligence 2002, 30, 425–447. [Google Scholar] [CrossRef]
- Hart, S.G.; Staveland, L.E. Development of NASA-TLX (Task Load Index): Results of empirical and theoretical research. Advances in psychology. Adv. Psychol. 1988, 52, 139–183. [Google Scholar]


| Title | Suitability | Typicality |
|---|---|---|
| Physical size | Ideal | All |
| Prominence | Highly suitable | Most |
| Difference from surroundings | Highly suitable | Most |
| Availability of a unique label | Never suitable | All |
| Ubiquity and familiarity | Ideal | All |
| Length of description | Ideal | All |
| Spatial extents | Highly suitable | Most |
| Permanence | Ideal | All |
| Landmarks | Suitability Score | Normalized Weight |
|---|---|---|
| Elevator | 35 | 1.00 |
| Auditorium | 30 | 0.81 |
| Stairs | 29 | 0.80 |
| Toilet | 26 | 0.67 |
| Seminar Room | 24 | 0.59 |
| Lockers | 23 | 0.56 |
| Door | 22 | 0.55 |
| PC Room | 18 | 0.38 |
| Trash and Recycle Can | 17 | 0.37 |
| Meeting Room | 15 | 0.28 |
| Scanner/printer | 15 | 0.27 |
| Organic waste can | 14 | 0.26 |
| Meeting Room | 15 | 0.28 |
| Notice Board | 13 | 0.22 |
| Uncategorized room | 7 | 0.00 |
| Landmarks | Suitability Score | Initial Weight | Final Weight |
|---|---|---|---|
| Elevator | 35 | 1.00 | 1.00 |
| Toilet | 26 | 0.67(+0.2) | 0.87 |
| Stairs | 29 | 0.80 | 0.80 |
| Door | 22 | 0.55(+0.2) | 0.75 |
| Auditorium | 30 | 0.81−[(5−1)*0.2/4] | 0.61 |
| Scanner/Printer | 15 | 0.27(+0.2) | 0.47 |
| Age | Experience with Digital Maps | Experience with Navigation Systems | How Many Hours did you Sleep Last Night? | How do You Feel? | |
|---|---|---|---|---|---|
| Kruskal-Wallis H | 0.334 | 0.460 | 0.745 | 0.853 | 4.896 |
| df | 2 | 2 | 2 | 2 | 2 |
| Assymp. Sig. | 0.846 | 0.794 | 0.689 | 0.653 | 0.086 |
| Santa Barbara Sense of Direction Scale | |
|---|---|
| Kruskal-Wallis H | 2.313 |
| Df | 2 |
| Assymp. Sig. | 0.315 |
| Number of Errors_Mean | Completion Time (min)_Mean | |
| Pictogram | 0.40 | 2.94 |
| Axonometric | 0.40 | 2.85 |
| Metric | 2.30 | 2.80 |
| Number of Errors_SD | Completion Time (min)_SD | |
| Pictogram | 0.69 | 0.29 |
| Axonometric | 0.84 | 0.48 |
| Metric | 1.34 | 0.41 |
| Scenario | N | Mean Rank | |
|---|---|---|---|
| Completion Time | Pictogram | 10 | 17.55 |
| Axonometric | 10 | 14.95 | |
| Metric | 10 | 14.00 | |
| Total | 30 | ||
| Number of errors | Pictogram | 10 | 13.60 |
| Axonometric | 10 | 12.90 | |
| Metric | 10 | 20.00 | |
| Total | 30 | ||
| Completion Time | Number of Errors | ||
| Kruskal-Wallis H | 0.873 | 5.102 | |
| df | 2 | 2 | |
| p-value | 0.646 | 0.78 |
| Completion Time | Number of Errors | |
|---|---|---|
| Mann–Whitney U (Pictogram vs. Axonometric) | 41.50 | 47.00 |
| Wilcoxon W | 96.50 | 102.00 |
| Z | −0.643 | −0.299 |
| p-value | 0.520 | 0.765 |
| Mann–Whitney U (Axonometric vs. Metric) | 47.00 | 27.00 |
| Wilcoxon W | 102.00 | 82.00 |
| Z | −0.227 | −1.915 |
| p-value | 0.820 | 0.055 |
| Mann–Whitney U (Pictogram vs. Metric) | 34.00 | 20.50 |
| Wilcoxon W | 89.00 | 65.50 |
| Z | −0.899 | −2.203 |
| p-value | 0.369 | 0.028 |
| Attractiveness | Perspicuity | Efficiency | Dependability | Stimulation | Novelty | |
|---|---|---|---|---|---|---|
| Kruskal–Wallis H | 0.332 | 0.411 | 0.555 | 0.570 | 1.614 | 6.846 |
| df | 2 | 2 | 2 | 2 | 2 | 2 |
| p-value | 0.851 | 0.814 | 0.758 | 0.752 | 0.446 | 0.033 |
| Mental Demand | Physical Demand | Temporal Demand | Performance | Effort | Frustration | Total Workload | |
|---|---|---|---|---|---|---|---|
| Mann–Whitney U (Pictogram vs. Axonometric) | 48.00 | 38.50 | 36.00 | 49.50 | 46.00 | 41.50 | 43.50 |
| Wilcoxon W | 103.00 | 93.50 | 91.00 | 104.50 | 101.00 | 96.50 | 98.50 |
| p-value | 0.875 | 0.344 | 0.269 | 0.965 | 0.753 | 0.461 | 0.621 |
| Mann–Whitney U (Pictogram vs. Metric) | 28.50 | 31.00 | 46.00 | 41.50 | 47.50 | 40.50 | 41.00 |
| Wilcoxon W | 83.50 | 86.00 | 101.00 | 96.50 | 102.50 | 95.50 | 96.00 |
| p-value | 0.083 | 0.112 | 0.749 | 0.476 | 0.844 | 0.413 | 0.490 |
| Mann–Whitney U (Axonometric vs. Metric) | 25.00 | 43.00 | 39.50 | 43.00 | 49.50 | 47.00 | 47.00 |
| Wilcoxon W | 80.00 | 98.00 | 94.50 | 98.00 | 104.50 | 102.00 | 102.00 |
| p-value | 0.045 | 0.547 | 0.401 | 0.558 | 0.967 | 0.804 | 0.815 |
© 2019 by the authors. Licensee MDPI, Basel, Switzerland. This article is an open access article distributed under the terms and conditions of the Creative Commons Attribution (CC BY) license (http://creativecommons.org/licenses/by/4.0/).
Share and Cite
Bakogiannis, N.; Gkonos, C.; Hurni, L. Cartographic Visualization for Indoor Semantic Wayfinding. Multimodal Technol. Interact. 2019, 3, 22. https://doi.org/10.3390/mti3010022
Bakogiannis N, Gkonos C, Hurni L. Cartographic Visualization for Indoor Semantic Wayfinding. Multimodal Technologies and Interaction. 2019; 3(1):22. https://doi.org/10.3390/mti3010022
Chicago/Turabian StyleBakogiannis, Nikolaos, Charalampos Gkonos, and Lorenz Hurni. 2019. "Cartographic Visualization for Indoor Semantic Wayfinding" Multimodal Technologies and Interaction 3, no. 1: 22. https://doi.org/10.3390/mti3010022
APA StyleBakogiannis, N., Gkonos, C., & Hurni, L. (2019). Cartographic Visualization for Indoor Semantic Wayfinding. Multimodal Technologies and Interaction, 3(1), 22. https://doi.org/10.3390/mti3010022