Abstract
This study explores the impact of microclimatic variations on thermal perception and walking experience in Béjaïa, Algeria, focusing on two contrasting urban areas: the compact historic medina and the modern lower city. A mixed-method approach combined microclimatic measurements (Ta, Ts, Va, RH) with subjective evaluations from 70 participants. After urban morphological analysis, walking itineraries were designed and studied through accompanied walks. Participants reported their thermal sensations and walking comfort via questionnaires and mental maps, while environmental data were simultaneously collected (21–28 July 2022). Results show that transitions between urban fabrics significantly affect thermal sensation and walking thermal comfort (WTC). Strong correlations were observed between surface temperature (Ts) and sky view factor (SVF), and between ASV and WTC (Kendall’s τᵦ = 0.79, 95% CI [0.70, 0.88]). Beyond physical factors, perceptual variables like vegetation (OR = 1.50), maintenance (OR = 1.40), and views (OR = 1.30) significantly increased WTC, while fatigue (OR = 0.70) and safety concerns (OR = 0.80) reduced it. The findings highlight strong contrasts between the two areas and support planning strategies emphasizing vegetation, spatial optimization, and the integration of perceptual thermal factors in urban design.
1. Introduction
In recent years, encouraging people to walk in cities has represented a major challenge for many cities worldwide, and is one of the key objectives of sustainable development []. Walking is a natural act, accessible to all, and is associated with several environmental benefits, such as road decongestion and reduced air pollution [,]. It also contributes to the promotion of public health by reducing inactivity-related diseases and improving the well-being of residents [,,,,]. Numerous studies have addressed the issue of walking in cities. Researchers have developed concepts such as walkability or pedestrian potential, which refer to the extent to which the built environment is conducive to walking [,,,,]. However, most of the indicators identified to assess walking quality often focus on physical aspects, such as sidewalk width, density, permeability of urban fabrics, or street connectivity [,,,]. Few studies have attempted to cross-reference thermal perceptions with the quality of walking in the city, while considering the diversity of urban morphologies.
A recent in-depth study of the Algerian city of Annaba, Labdaoui et al. [] attempted to combine thermal comfort and walkability. They created a Comfort Walkability Index (CWI) consisting of 21 indicators, including the PET (physiological equivalent temperature) index among the elements evaluated []. However, the subjective perception of pedestrians is not considered, as the study is based mainly on spatial elements and microclimatic measurements. Furthermore, the method used to assess the indicators is totally quantitative, relying in most cases on mathematical calculations and equations.
Outdoor thermal comfort is defined in the scientific literature as a state of mind that reflects satisfaction with the thermal environment [,]. It represents a key factor influencing the decision to walk, the choice of routes to take and even the pace of city walking [,]. A variety of factors influence thermal comfort. Firstly, urban geometry, such as the orientation of streets and public squares, their shape and arrangement in the urban fabric, and the ratio between height and width (H/W), are considered factors influencing microclimatic variations and thermal perceptions [,,]. The sky view factor (SVF) is also an important element to consider. This parameter determines how open a space is to the sky, and varies between 0 and 1: the closer the SVF is to 1, the more open the space is to the sky, and the greater its exposure to solar radiation. Conversely, an SVF close to 0 means that the space is highly obstructed, either due to the narrowness of the street, the presence of vegetation or the height of surrounding buildings [,]. In addition, Nikolopoulou et al. [] assert that air temperature is an essential parameter for assessing thermal comfort []. In a study conducted on a street in Cairo, Egypt, Elnabawi et al. [] investigated the influence of climatic parameters on thermal comfort and the use of outdoor spaces. The study was conducted over two seasons: summer and winter. The results show that air temperature significantly influences physiological equivalent temperatures (PETs). They also concluded that the preferred PET values in summer are 29 °C PET and those in winter are 24.5 °C PET []. Surface temperature is also often included in studies of thermal comfort. It is influenced by the level of exposure of surfaces to solar radiation, the nature of materials, their color as well as their absorption or reflection capacity []. Albedo represents a material’s ability to reflect solar radiation. Surfaces characterized by a high albedo absorb less heat, helping to maintain lower surface temperatures. Color also plays a decisive role in the absorption and reflection of solar radiation. Dark materials (such as asphalt) with low albedo absorb more heat than light materials with high albedo [,].
Wind speed is a non-negligible factor in thermal comfort []. In a study of the central business district of Melbourne, Australia, Shooshtarian et al. [] asserted that urban density and building layout modify wind speed, and that participants’ perception of wind varies by site and season. In addition to air temperature, surface temperature and wind speed, relative humidity is an important variable in the urban microclimate. Most studies on outdoor thermal comfort often include humidity measurement as a non-negligible factor influencing thermal perception [].
Several research studies have focused on the specific impact of vegetation and demonstrated its positive effects on outdoor thermal comfort [,,]. In a study conducted in Phoenix, Arizona, Zhao et al. [] investigated the influence of vegetation, particularly trees, on outdoor comfort and microclimate, using ENVI-met for simulations. The researchers demonstrated that arranging two trees at regular intervals creates ideal microclimatic conditions and improves thermal comfort thanks to shaded areas []. However, this research does not incorporate the study of pedestrians’ subjective perceptions of existing vegetation and the variations in shaded areas it generates. In the current research, we considered it important to collect the different sensations and perceptions of participants, particularly within streets and gardens, which strengthens the validity of the results obtained.
In Algeria, there is growing interest in outdoor thermal comfort studies, and awareness of the challenges associated with this subject is gradually taking hold. Initially, research on thermal aspects was concentrated mainly in the south of the country, notably in Ghardaïa, El Oued, and Biskra regions []. This is due to the more extreme climatic conditions in this region. Among the most in-depth research on traditional fabrics is that of Ali-Toudert et al. [], who studied outdoor thermal comfort in the town of Ghardaïa, located in the Mzab valley in southern Algeria. This study demonstrated that urban morphology, notably street depth and the ratio between height and width (H/W), plays an important role in creating shaded areas, thus improving thermal comfort. This study also demonstrated that traditional materials significantly contribute to improving thermal conditions []. Recently, research on coastal cities in Algeria has emerged. Several researchers have taken an interest in studying thermal comfort, mainly in large northern cities such as Algiers and Annaba. In a recent in-depth study, Arrar et al. [] attempted to understand the effect of sea breezes on thermal comfort in the old town of Casbah in the top of Algiers city, through 14 measurement points. The researchers highlighted the significant effect of sky visibility factor (SVF) and humidity on thermal comfort, while noting very low wind speeds []. The study considered the inhabitants’ opinions on the various variables recorded, such as humidity, wind and air temperature, and demonstrated the significant impact of urban morphology on thermal variations. Moreover, the study by Ali Smail et al. [] conducted at the same site (Casbah of Algiers), demonstrated the significant alliesthetic effect of “Sabats”, which are semi-enclosed spaces located in the alleyways of the old Casbah. These spaces effectively reduce the sensation of fatigue and offer improved walking quality. They are generally regarded as breathing spaces for pedestrians (small shaded or open areas that provide visual and thermal relief along walking routes) allowing them to break up the monotony of pedestrian routes and encourage walking []. In contrast to the previous study (Arrar et al. []), wind speeds measured in summer are not as low in this case. They remain relatively low, but can sometimes reach 1.8 m/s inside certain sabats.
The literature review revealed that many studies dealing with the issue of outdoor thermal comfort focus mainly on urban spaces in isolation, such as public squares and streets, without analyzing the effect of the transition from one space to another. However, when studying the effect of microclimatic variations, which refer to the spatial and temporal fluctuations in climatic parameters such as air temperature, surface temperature, humidity, solar radiation, and wind speed caused by urban morphology and environmental conditions, on walking, it is important to take into account the subtle changes and differences that characterize an urban itinerary. Accordingly, city walking involves crossing several interconnected environments before reaching a final destination. In their study of Rome and London, Vasilikou et al. [] demonstrated that variation in interconnected urban spaces strongly influences pedestrians’ dynamic thermal perception. The originality of this research lies in taking into account variations in thermal comfort from one space to another, by studying dASV (differential thermal sensation) and comparing results with the H/W ratio, SVF, and other microclimatic variables. Researchers also emphasize the importance of observing dynamic thermal sensations in interconnected spaces in order to better understand the influence of urban morphology on pedestrian perception []. In the current study, this aspect (dASV) has also been considered and has enabled us to analyze variations in perception from one focal point to another along walking routes. It gives a significant added value to the study, particularly in the North African context.
In light of this literature review, it is clear that some shortcomings exist. These include methodologies that do not allow for an in-depth study of pedestrians’ emotions and mental representations, a lack of consideration of the perception of vegetation, an analysis of spaces in isolation, and the absence of studies on the effect of transitions between interconnected spaces. In addition, we found that there is a lack of research on coastal areas, particularly in North Africa. Very little research has been carried out on walking in the city of Béjaïa, and this has dealt solely with the physical and spatial component, including syntactic characteristics [] and the impact of the soundscape on pedestrians []. No research on the thermal aspect has been carried out in Béjaïa city. To the best of our knowledge, this is the first study that investigates this region. Thus, an interesting opportunity lies in the renovation operation in the old city of Béjaïa, as part of the city’s safeguarding plan [].
Moreover, this research is one of the few studies that focus on two types of cities (medina and modern city) and analyze various urban fabric configurations (pre-colonial, colonial, planned, unplanned, industrial). It aims to evaluate the impact of microclimatic variations induced by urban morphology on thermal perception and walking experiences in the city of Béjaïa.
2. Methodology and Case Study
2.1. Study Context and Investigation Area
Béjaïa, also known as Bgayet in the Kabyle language (local language), is a key city in the Maghreb region and Algeria (Figure 1a). It is located in the southern basin of the Mediterranean Sea (Figure 1c), occupying the heart of the North African coastline. Situated at latitude 36.751178° N and longitude 5.064369° E, approximately 230 km from the capital Algiers (Figure 1d), Béjaïa holds a strategic position in North Africa. Numerous civilizations have left their mark on the history of Béjaïa, starting with the Phoenicians, followed by the Romans in 33 BC, the Hammadids between 1067 and 1068, the Spanish civilization from 1509 (or 1510) to 1555, then the Turkish occupation in 1555, and finally French colonization from 1830 to 1962 [,,].
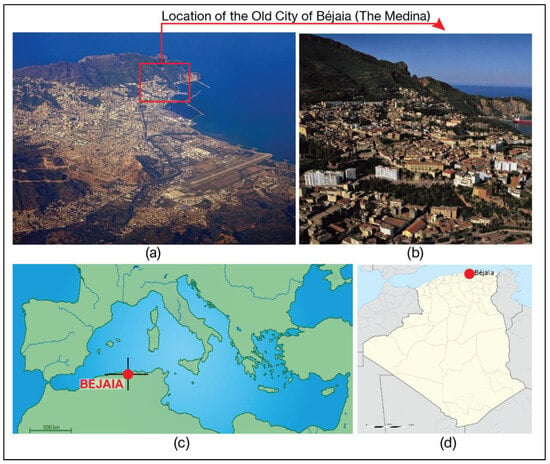
Figure 1.
Geographical location and overview of the city of Béjaïa (Old Town and Lower City). (a) Aerial view of the city of Béjaïa. Source: Béjaia.info (Facebook page). Processed by authors. (b) View of the old city of Béjaïa. Source: planete-dz.centerblog.net (Website). (c) Location of Béjaïa in Mediterranean basin. Source: Huteau, A. (16 October 2013). Base map: Mediterranean basin. Klinai. Retrieved 19 February 2025, from https://doi.org/10.58079/qm22. Processed by authors. (d) Location of Béjaïa in Algeria. Source: www.wikiwand.com. Processed by authors.
Information regarding temperature, vegetation, topography, and the distributions of solar radiation and humidity in the city of Béjaïa is provided in Appendix A.
The city of Béjaïa consists of two main urban parts:
- Lower Béjaïa (Figure 1a): Mainly built after Algeria’s independence in 1962, following a more modern urban planning, creating a contrast with the old city.
2.2. Research Methodology
The methodology adopted to answer the research question combines both qualitative and quantitative approaches. The diversity of factors and characteristics to be studied led us to use various methods adapted to each specific element. Figure 2 provides an overview of the main methodological steps, from data collection and processing to the final step of presenting the obtained results. The sub-steps are detailed in the following sections.
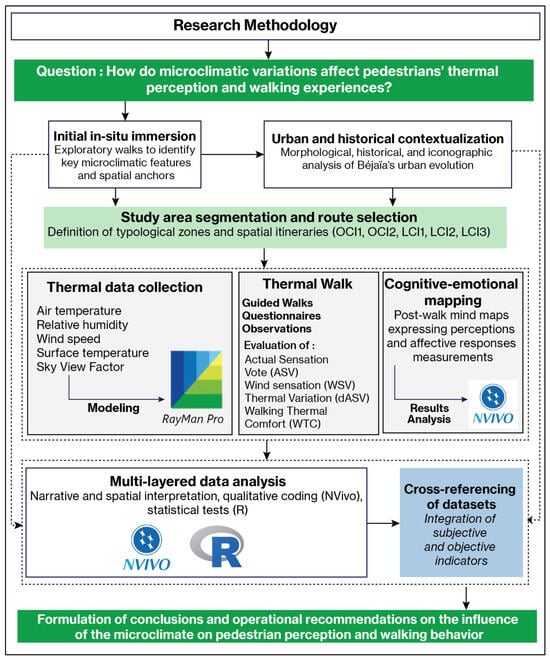
Figure 2.
Methodological framework used in this research.
2.2.1. Morphological, Historical, and Iconographic Study
This step aims to understand the urban evolution of Béjaïa (from the Roman period to the postcolonial era) and to analyze its urban and landscape values. It made it possible to identify key areas for analysis in the two parts of the city (the medina and the lower city). Three methods were used: morphological analysis, semi-structured interviews, and an iconographic analysis (analysis of connotative and denotative content) [,]. The results of this step (morphological and historical study), enabled the transition to the next phase: the selection of areas and itineraries.
2.2.2. Selection of Study Areas and Itineraries
- (A)
- Selection of study areas throughout the Old and Lower Cities (OC and LC)
This step is primarily performed to divide the two parts of the investigated city, the old city (OC) and the lower city (LC), into different areas allowing for a more detailed analysis (Figure 3). This helps in understanding how each type of identified fabric influences pedestrian perception and the quality of walking. The sky view factor (SVF) values are presented in Appendix B.
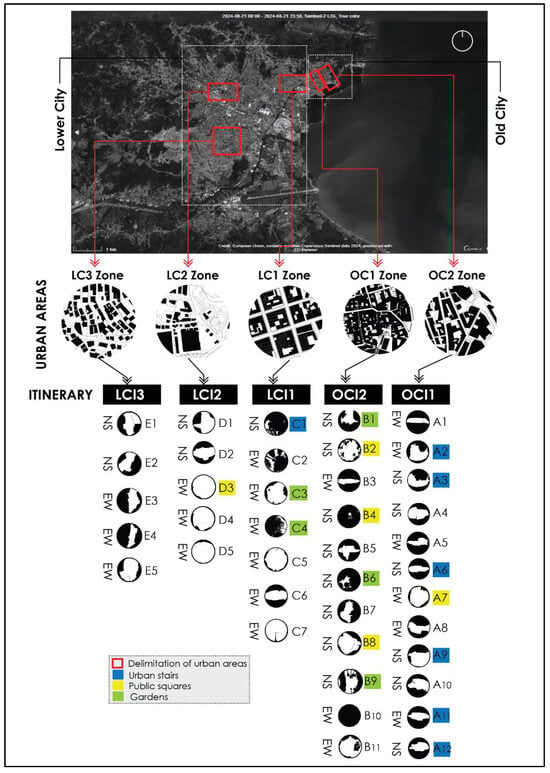
Figure 3.
Diagram summarizing study areas and selected points, including fisheye images processed with RayMan Pro 3.1 Beta, as well as orientation and types of spaces.
- (B)
- Selection of Itineraries
We defined a set of itineraries for the study to be explored on foot with pedestrians (Table 1). As mentioned earlier, we established one itinerary in each zone, and some itineraries across multiple different areas to understand the transition between these spaces. The itineraries include strategic urban spaces selected in advance such as major squares, urban staircases, green spaces (including gardens and parks), streets, and alleys. This allows for the analysis of variations in perception and comfort from one space to another, as well as their impact on walking quality (e.g., changes in walking pace: acceleration or deceleration; desire to change direction or itinerary). The objective of connecting different spaces through an itinerary is also to understand the perceptions and sensations that arise between interconnected spaces, an aspect that is still underexplored in the literature.

Table 1.
Table of predetermined itineraries in each study area.
The predefined itineraries in the old city of Béjaïa (OCI1, OCI2) are presented in Figure 4.
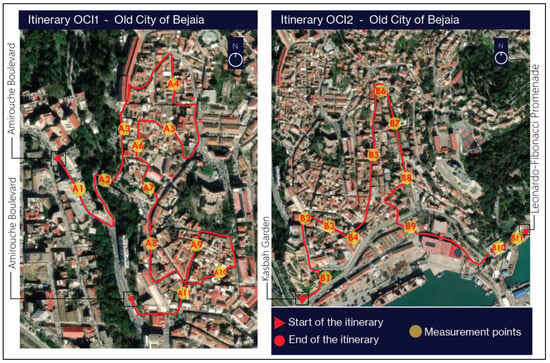
Figure 4.
Predefined itineraries in the old city of Béjaïa (OCI1, OCI2).
The location of the predefined itineraries in the lower city of Béjaïa (LCI1, LCI2, LCI3) (Figure 5):
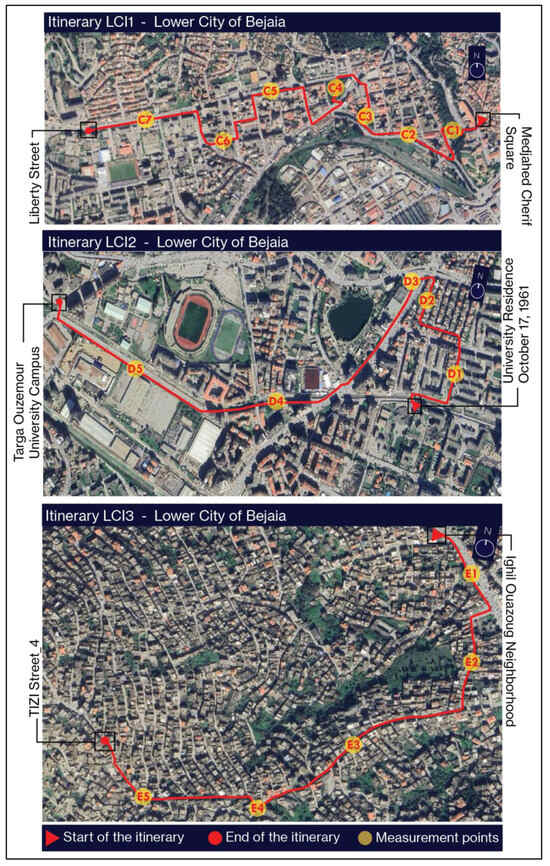
Figure 5.
The predefined itineraries in the lower city of Béjaïa (LCI1, LCI2, LCI3).
2.3. Periods and Methods of Data Collection
2.3.1. Study Period
This field study was conducted in 2022. Field measurements and accompanying walks were carried out during the summer between 21st and 28th July 2022, over five days, three times per day: (1) at 9 a.m. (morning), (2) at 2 p.m. (early afternoon), and (3) at 8 p.m. (evening/sunset time).
2.3.2. Microclimatic Measurements
- (a)
- Microclimatic monitoring
The climatic measurements were taken simultaneously with the accompanying walks and the filling out of questionnaires by pedestrians at each point. This was done to ensure the effectiveness of the results and to show changes in the pedestrians’ subjective perception based on the measured data: air temperature (Ta), relative humidity (Rh), wind speed (Va), surface temperature (Ts), sky view factor (SVF)
The study complies with ISO 7726 standards of 1998 [] and WMO guidelines []. The ISO standard, titled Ergonomics of the Thermal Environment—Instruments for measuring physical quantities, is essential for obtaining accurate and reliable thermal comfort data and measurements. The measurements were taken at the height of 1.75 m above ground to minimize the influence of surface thermal fluxes and to represent the average height of a pedestrian [].
- ▪
- Measurement devices
Table 2 presents the measurement instruments used in this study, along with their characteristics, as well as the tools used for capturing and processing fisheye images. It should be noted that emissivity in Testo 830-T1 is set at ε = 0.95.

Table 2.
Summary table of characteristics of measurement instruments used in this study.
- (b)
- Sky View Factor (SVF) values
To determine the sky view factor (SVF) values, fisheye images were captured at each predefined measurement point along the five selected walking itineraries. A Canon EOS 2000D camera (Table 2) equipped with a fisheye lens was oriented towards the sky to take the photographs. Once collected, the images were processed using GIMP 2.10 (GNU Image Manipulation Program) to ensure a square format and a high resolution (300 dpi). These conditions are crucial to achieving optimal accuracy in the SVF calculation phase [,].
- ▪
- The calculation of SVF using RayMan Pro 3.1 Beta software
Once the fisheye images were processed and classified according to the measurement points and walking itineraries, the sky view factor (SVF) values were calculated using the RayMan calculation model, version 3.1 Beta [,,]. This numerical model is widely used and scientifically recognized by numerous research centers around the world [,,,,].
2.3.3. Collection of Perceptions and Walking Quality
- (a)
- The questionnaire used to collect pedestrians’ thermal perceptions at each focal point
To better understand pedestrians’ perceptions and walking comfort in relation to microclimatic conditions, we designed a questionnaire that allowed for evaluation at each measurement point, as well as an analysis of sensation variations when transitioning between different spaces.
This questionnaire is structured into two main parts:
- The first part collects general information about pedestrians: age, gender, occupation, and clothing.
- The second part (Table 3) is designed to analyze four key parameters. For each parameter, responses are provided in five options, structured according to a five-point Likert scale (Table 3).
 Table 3. Questions and answer options.
- (b)
- Perception and mental maps
At the end of each itinerary (i.e., after passing through all the focal points), participants were invited to share their general perceptions of the itinerary by creating a mental map in which they indicate their overall walking experience (Figure A7). The data from these mental maps were then analyzed and coded using NVIVO software to identify recurring themes and compared with the simultaneously collected measurements (Figure A6). The study of perceptions and emotions developed by pedestrians during their walks through the use of mental maps which are one of the most commonly used methods for achieving in-depth results [,]. Furthermore, processing these results is often a complex task for researchers, which is why NVIVO is considered one of the best tools by many scientists for decoding data effectively []. Adding this method to our research methodology represents a significant added value and enabled us to move beyond traditional studies that are limited to measurements and simulations.
- (c)
- Direct observation
Throughout the walk along the itineraries, non-participant observations were also conducted to record the spontaneous behavior of pedestrians (frequent stops to seek shade, accelerated walking pace, avoidance of certain areas).
- (d)
- Sampling and respondent profile
To achieve representative results, we selected a highly diverse group of participants of different genders and ages, from various professional and social backgrounds, in order to enrich the experience and obtain a broad and representative range of perceptions and feelings within the environments traversed during the walk (Table A3).
- (e)
- Preparation and consent
In accordance with ISO 20252:2019 standards [] and to ensure the methodological rigor of our research, we implemented a meticulous preparation step to obtain informed consent from participants and guarantee the integrity and quality of the research. Before the thermal walks, all participants were fully informed of the objective of this study and the survey details to ensure that their participation was voluntary and that they were aware of the planned activities.
- (f)
- The number and characteristics of the participants:
As part of our study, a number of participants—mainly residents of the old city neighborhoods of Béjaïa—took part in the repeated measures study. We took the initiative to invite certain participants to this experience, particularly those with repetitive daily routes. Additionally, some participants themselves proposed to repeat the experience, which greatly helped in implementing this study.
A total of 70 people participated in the accompanied walks (Table A2), distributed as follows:
- Thirty-one (31) people participated in the old city (16 participants for OCI1 and 15 participants for OCI2).
- Thirty-nine (39) people participated in the lower city (15 participants for LCI1, 13 participants for LCI2, and 11 participants for LCI3).
The details of the participation rates for each itinerary are presented in Appendix D (Table A2 and Table A3).
3. Results
3.1. Microclimatic Measurement Results
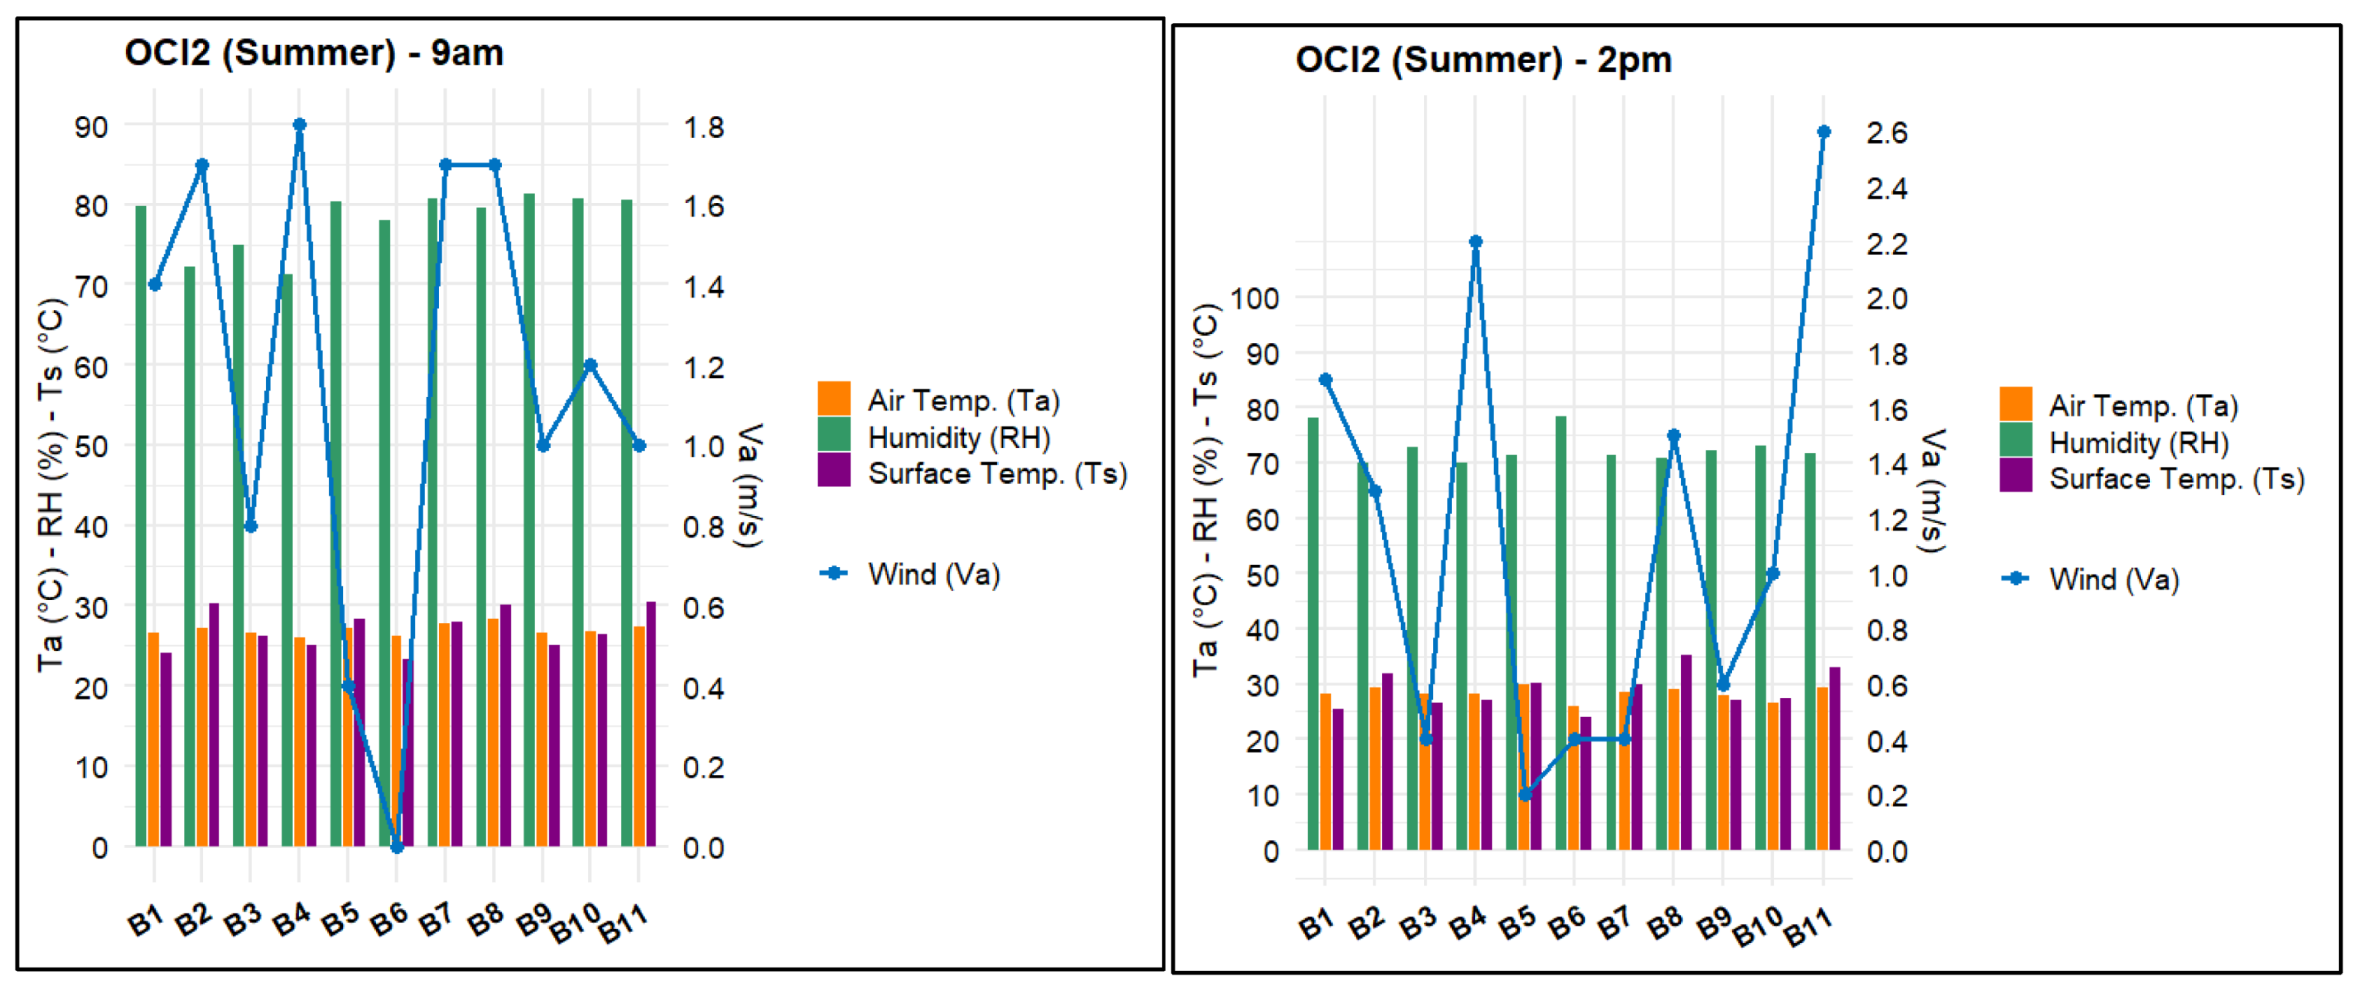
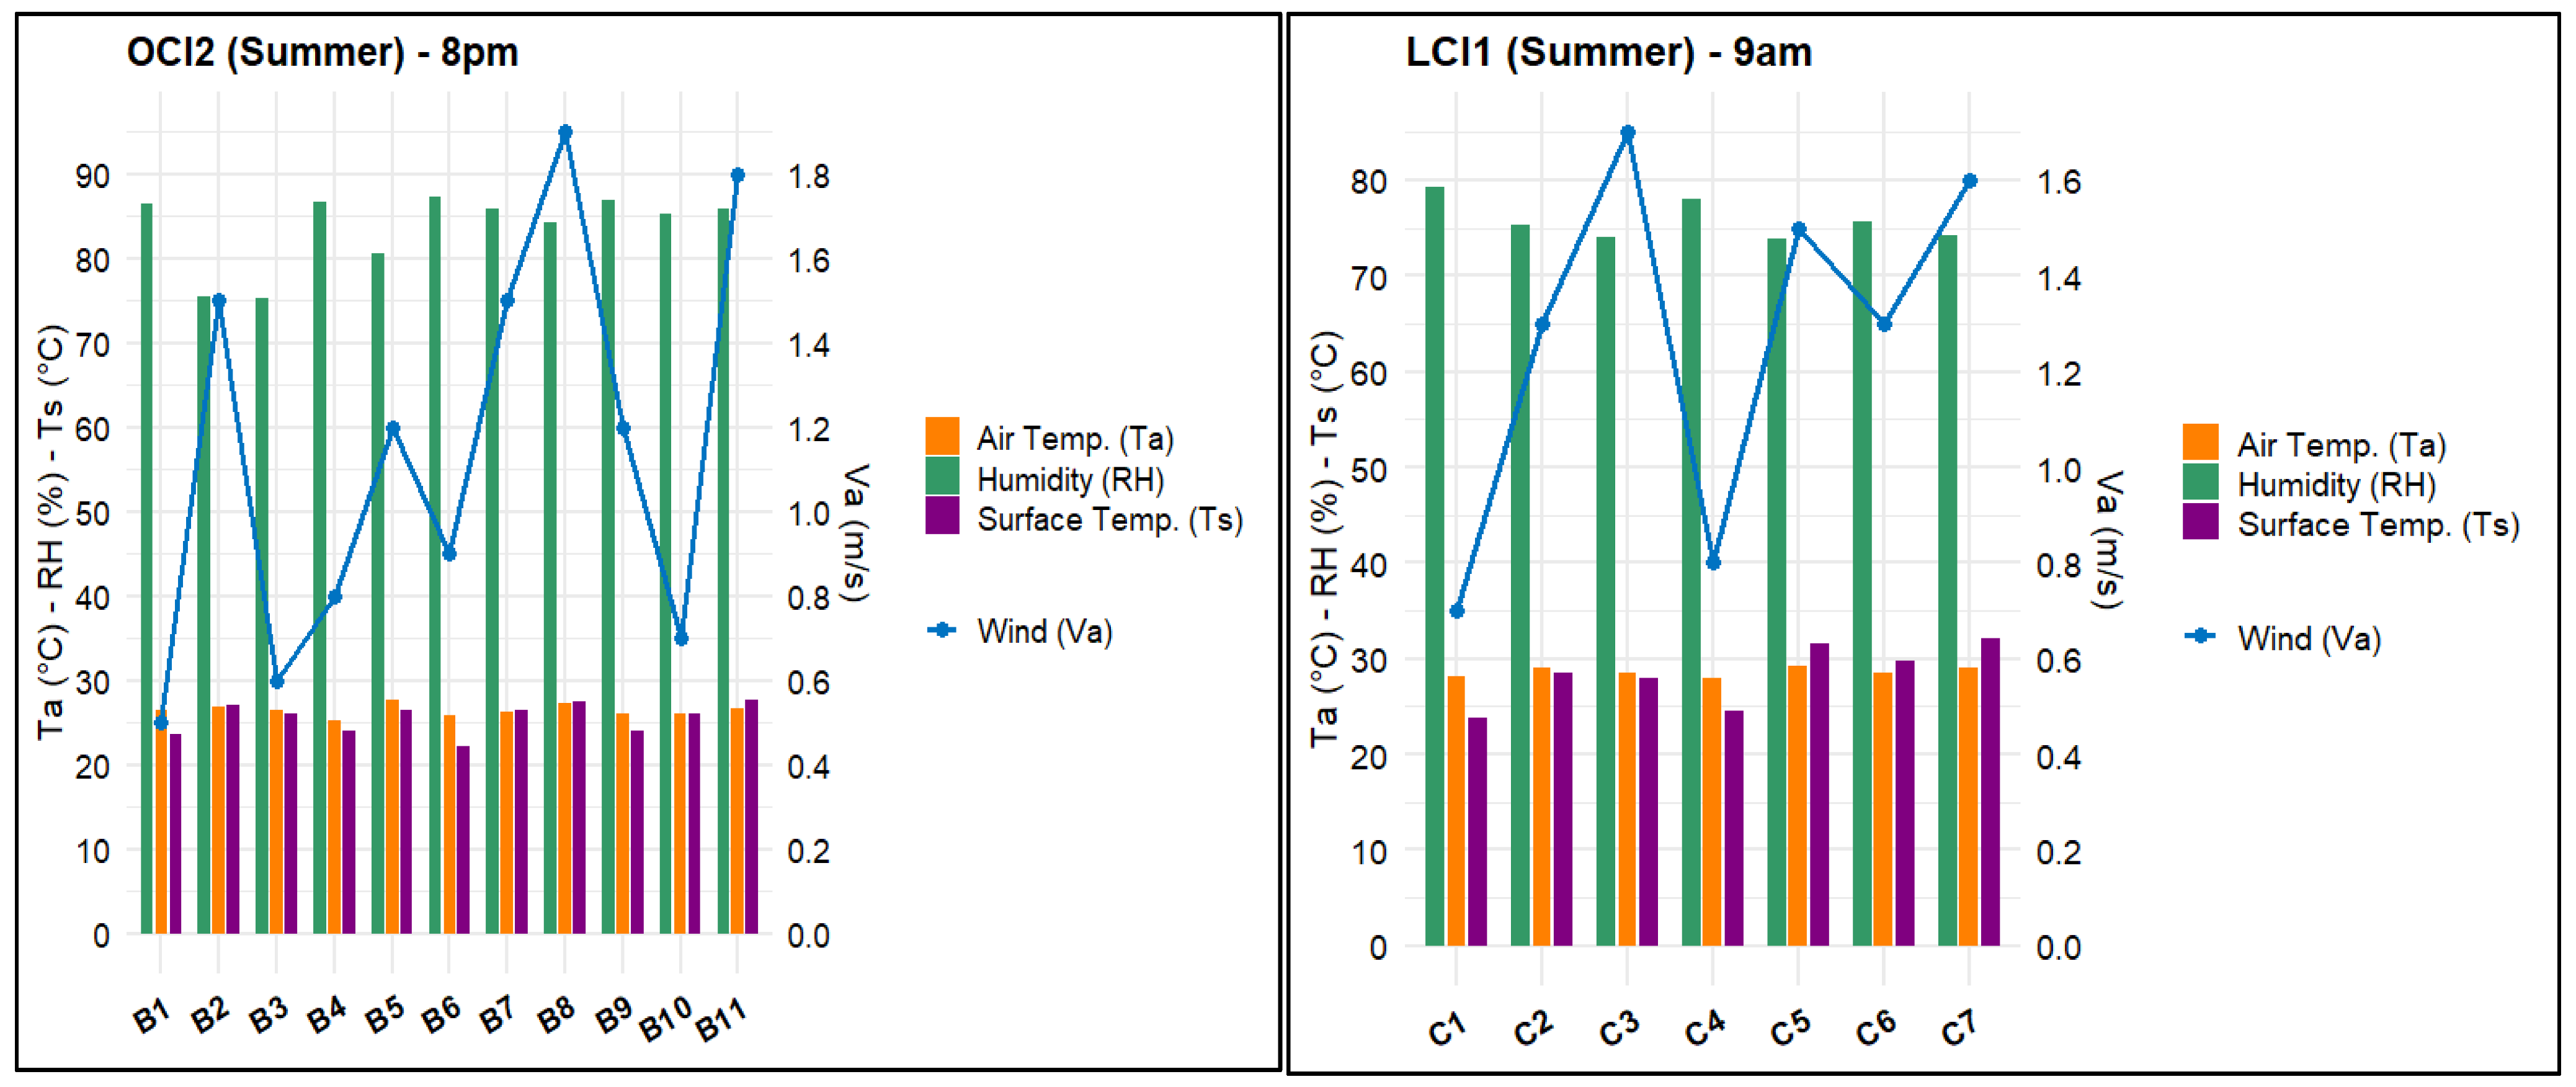
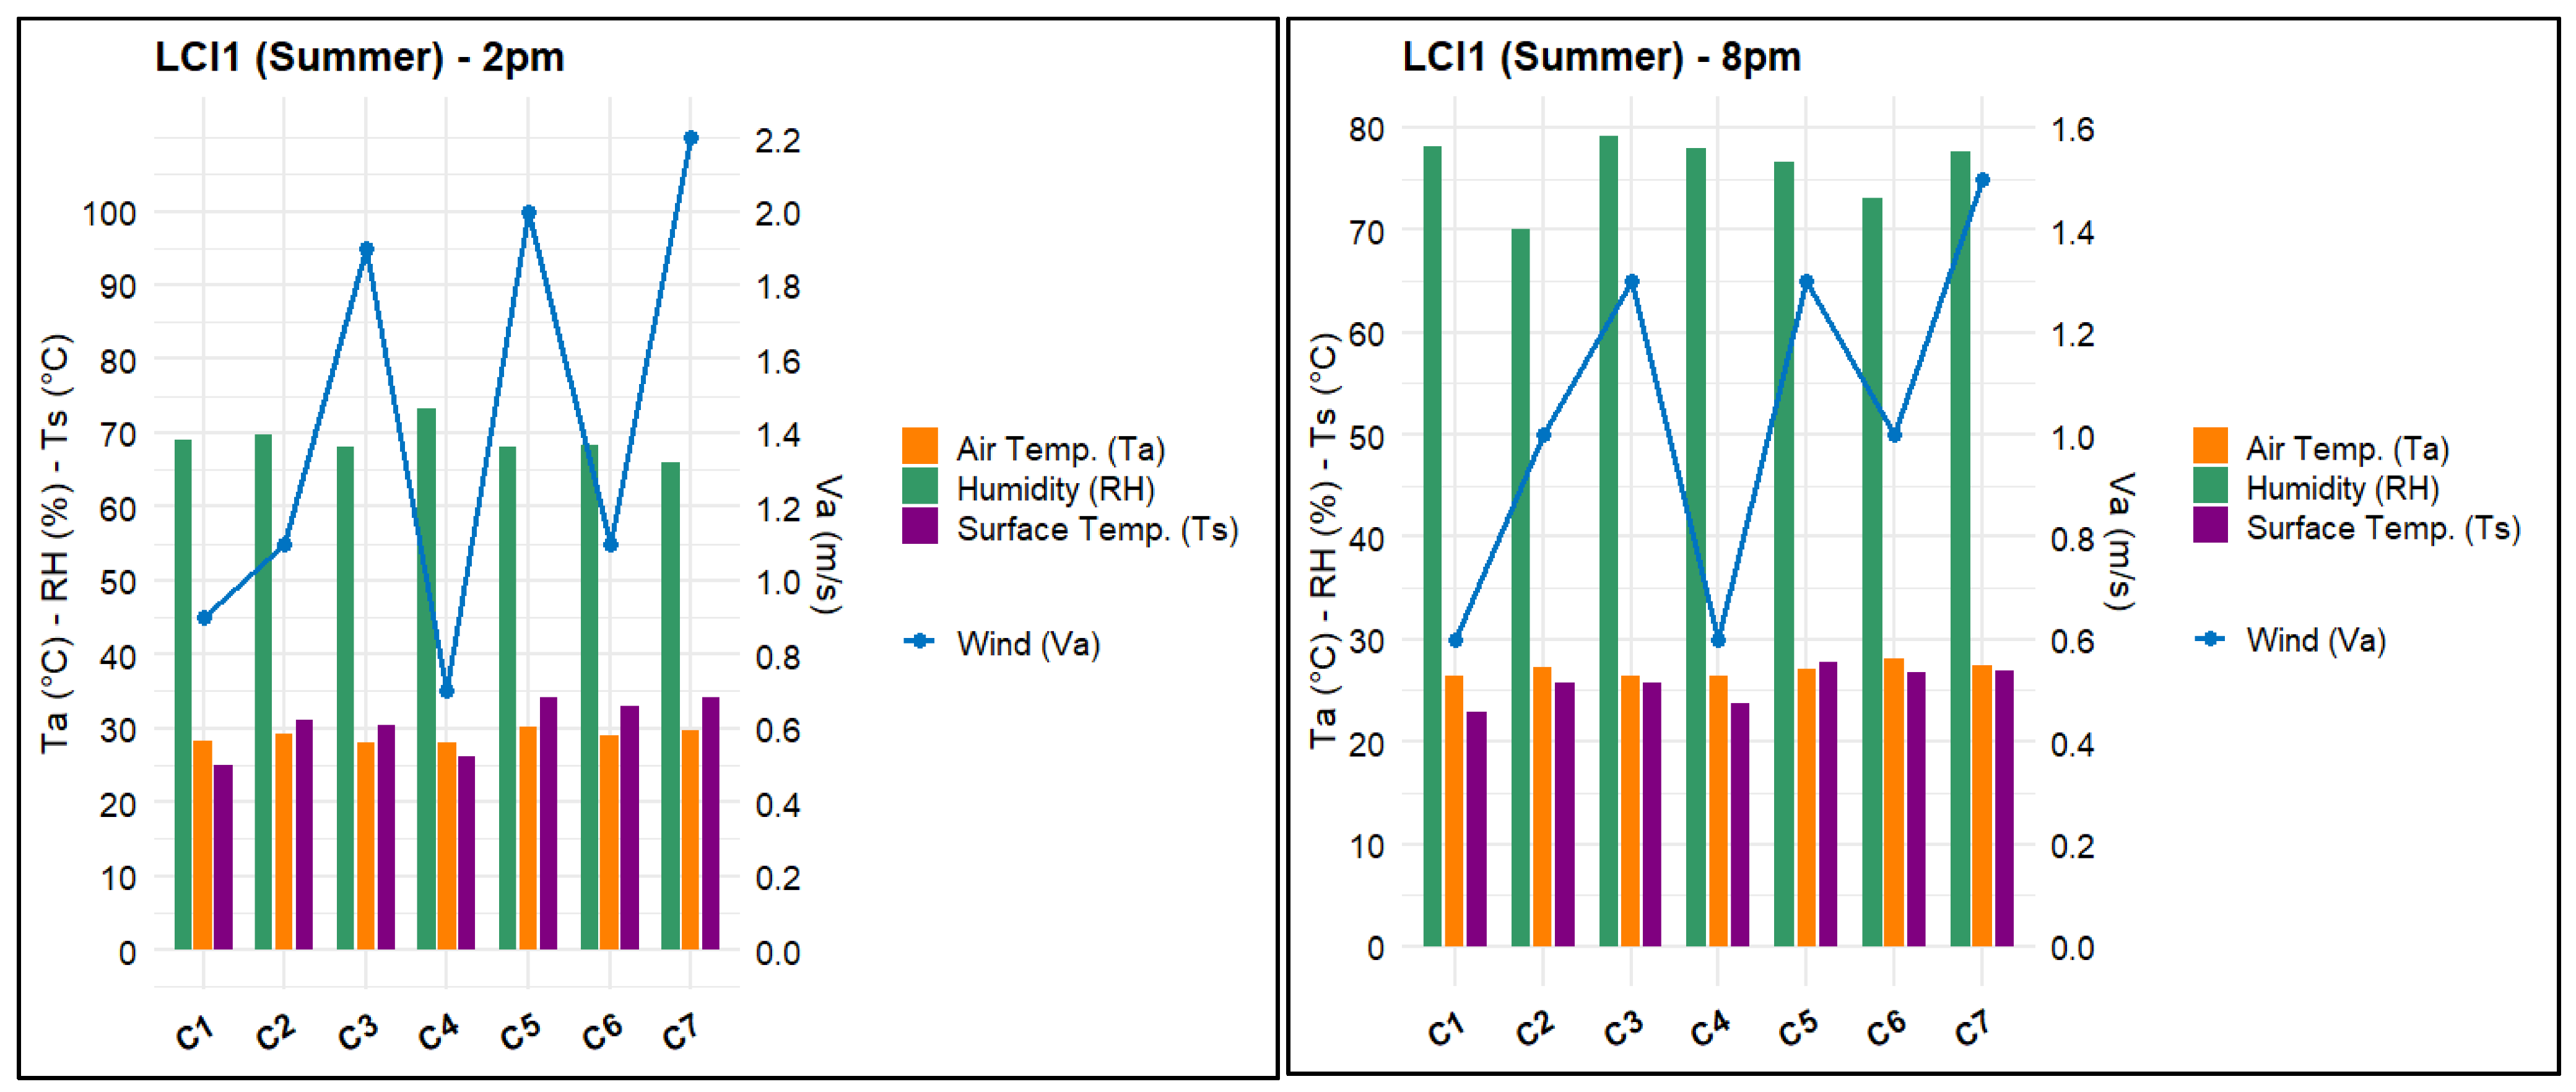
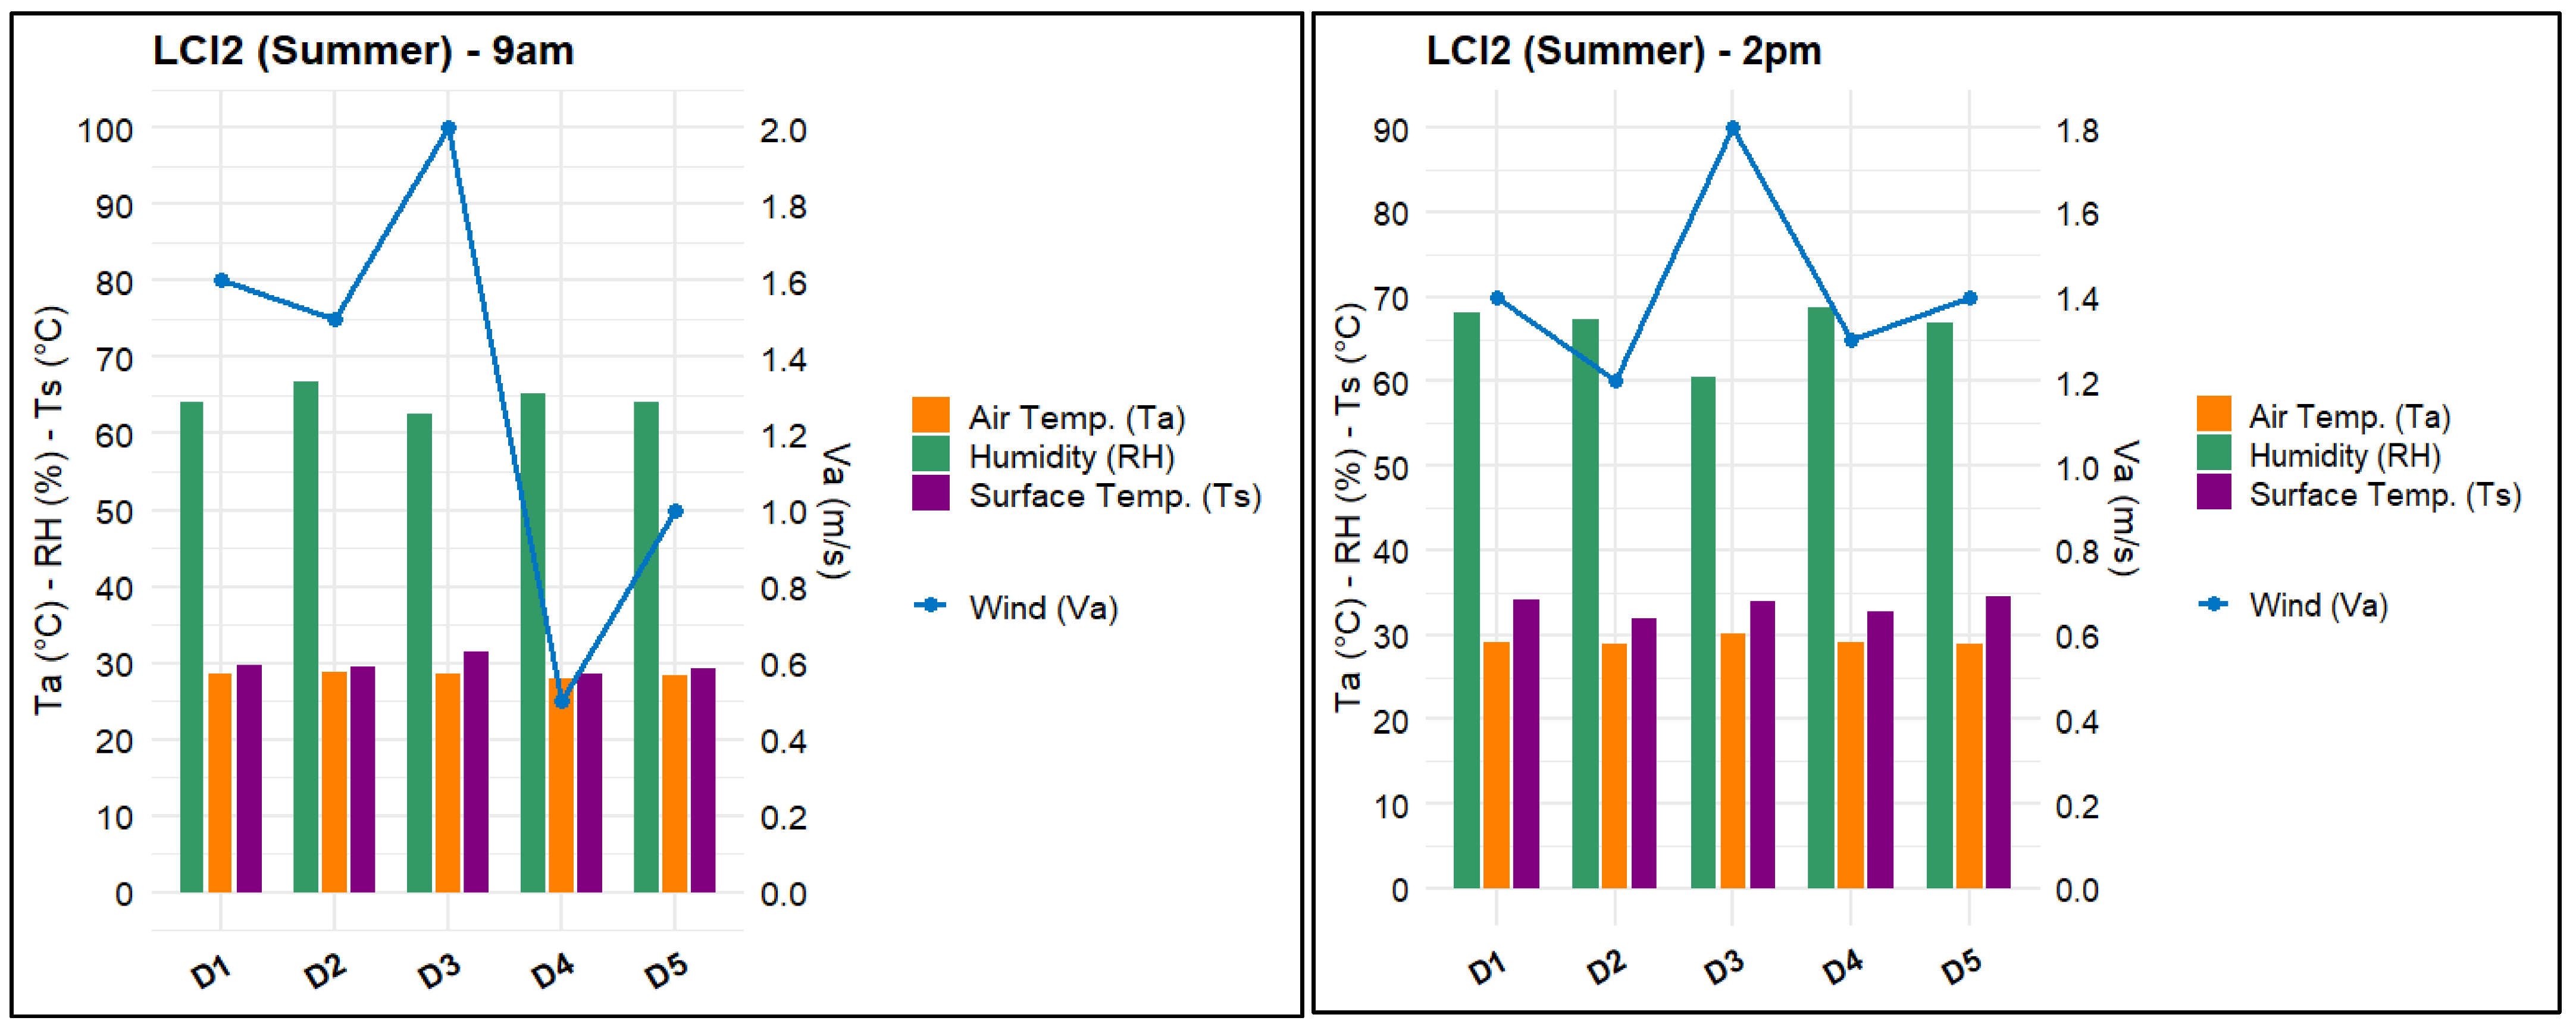
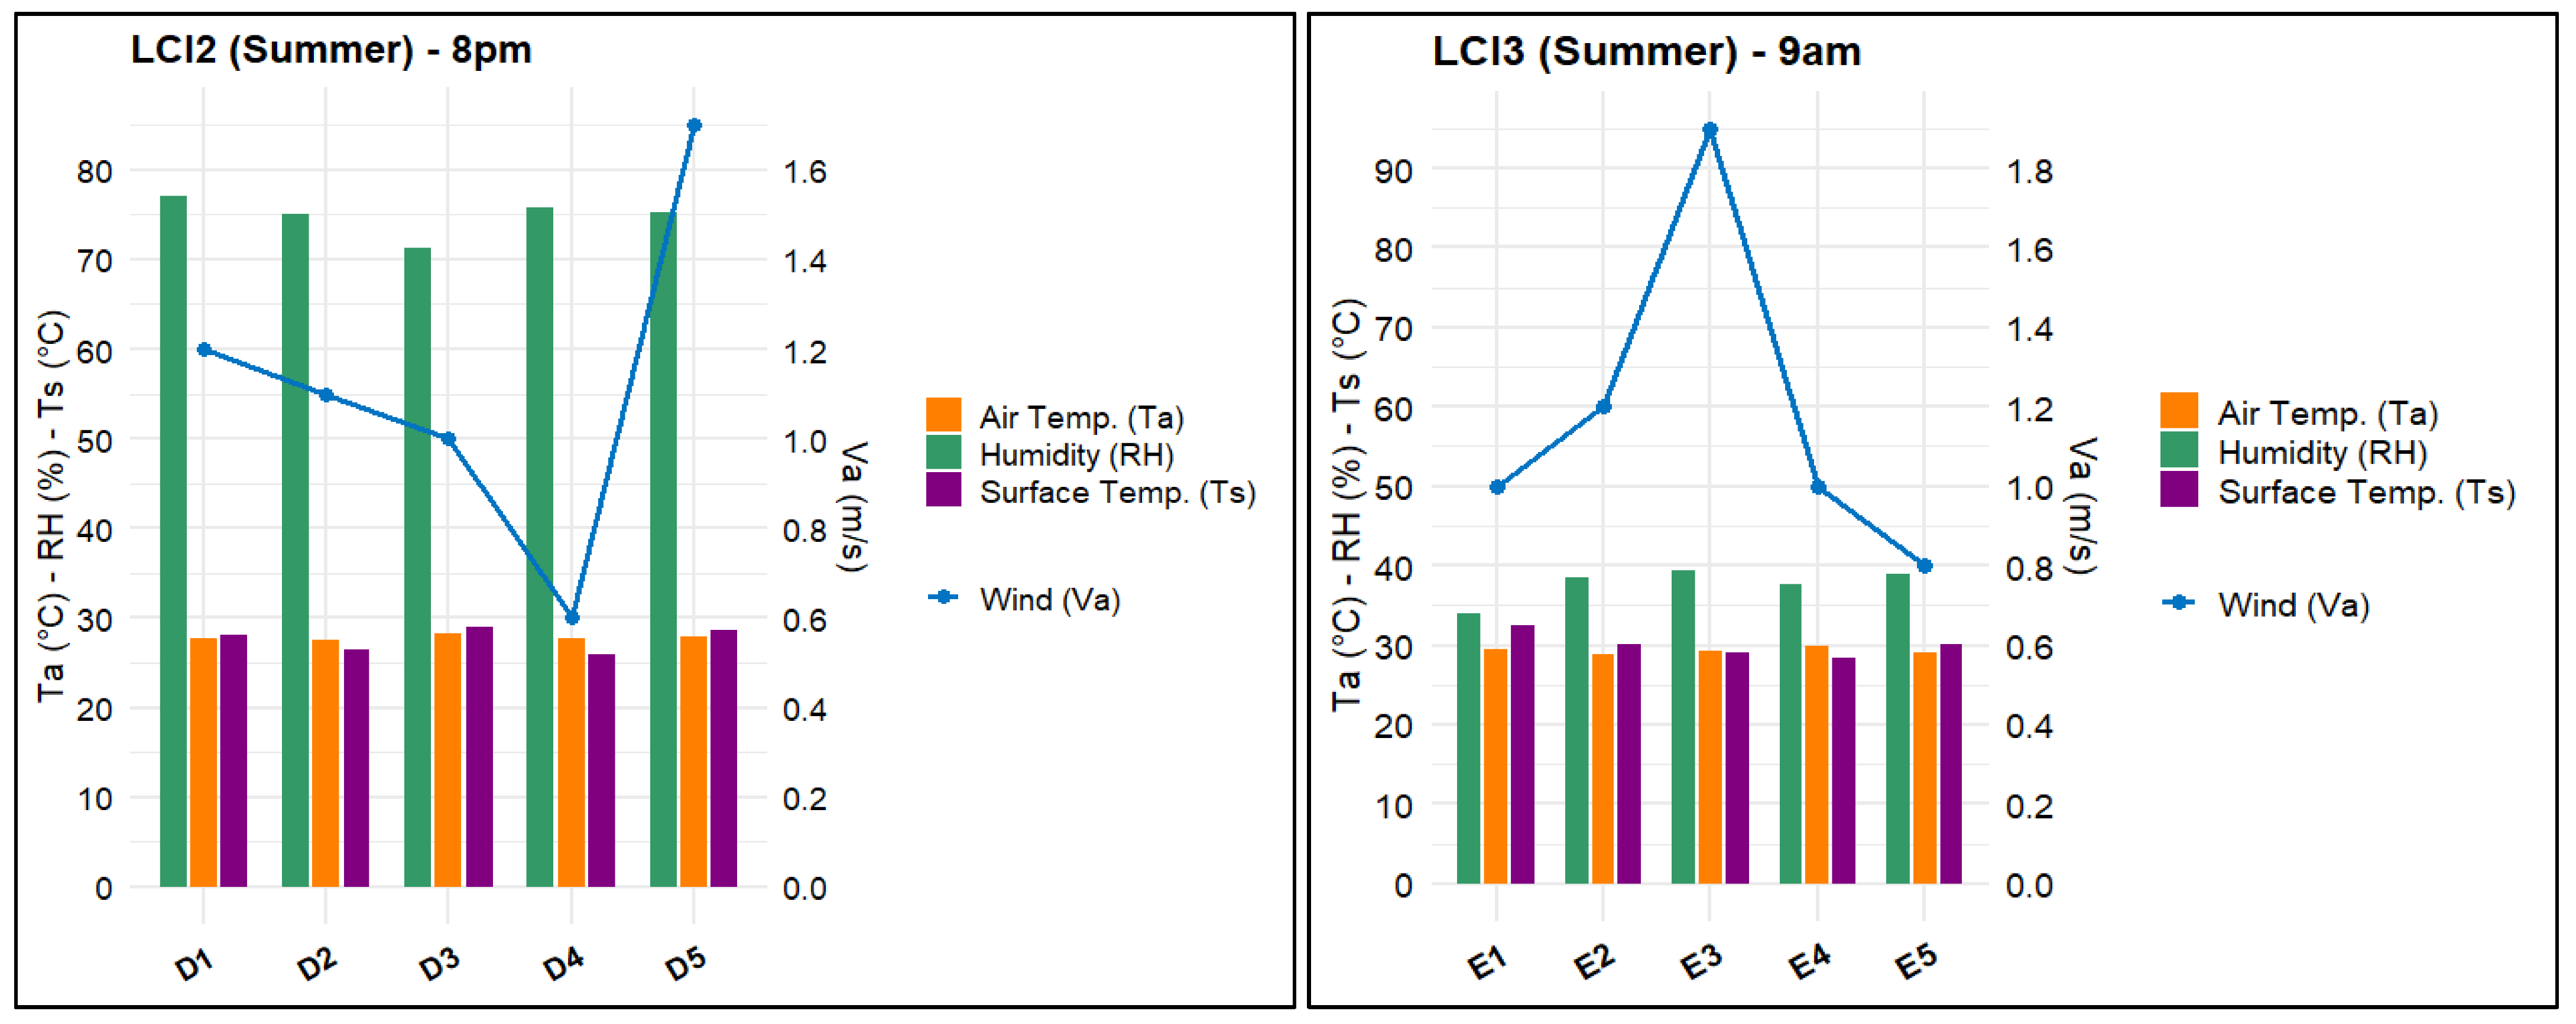
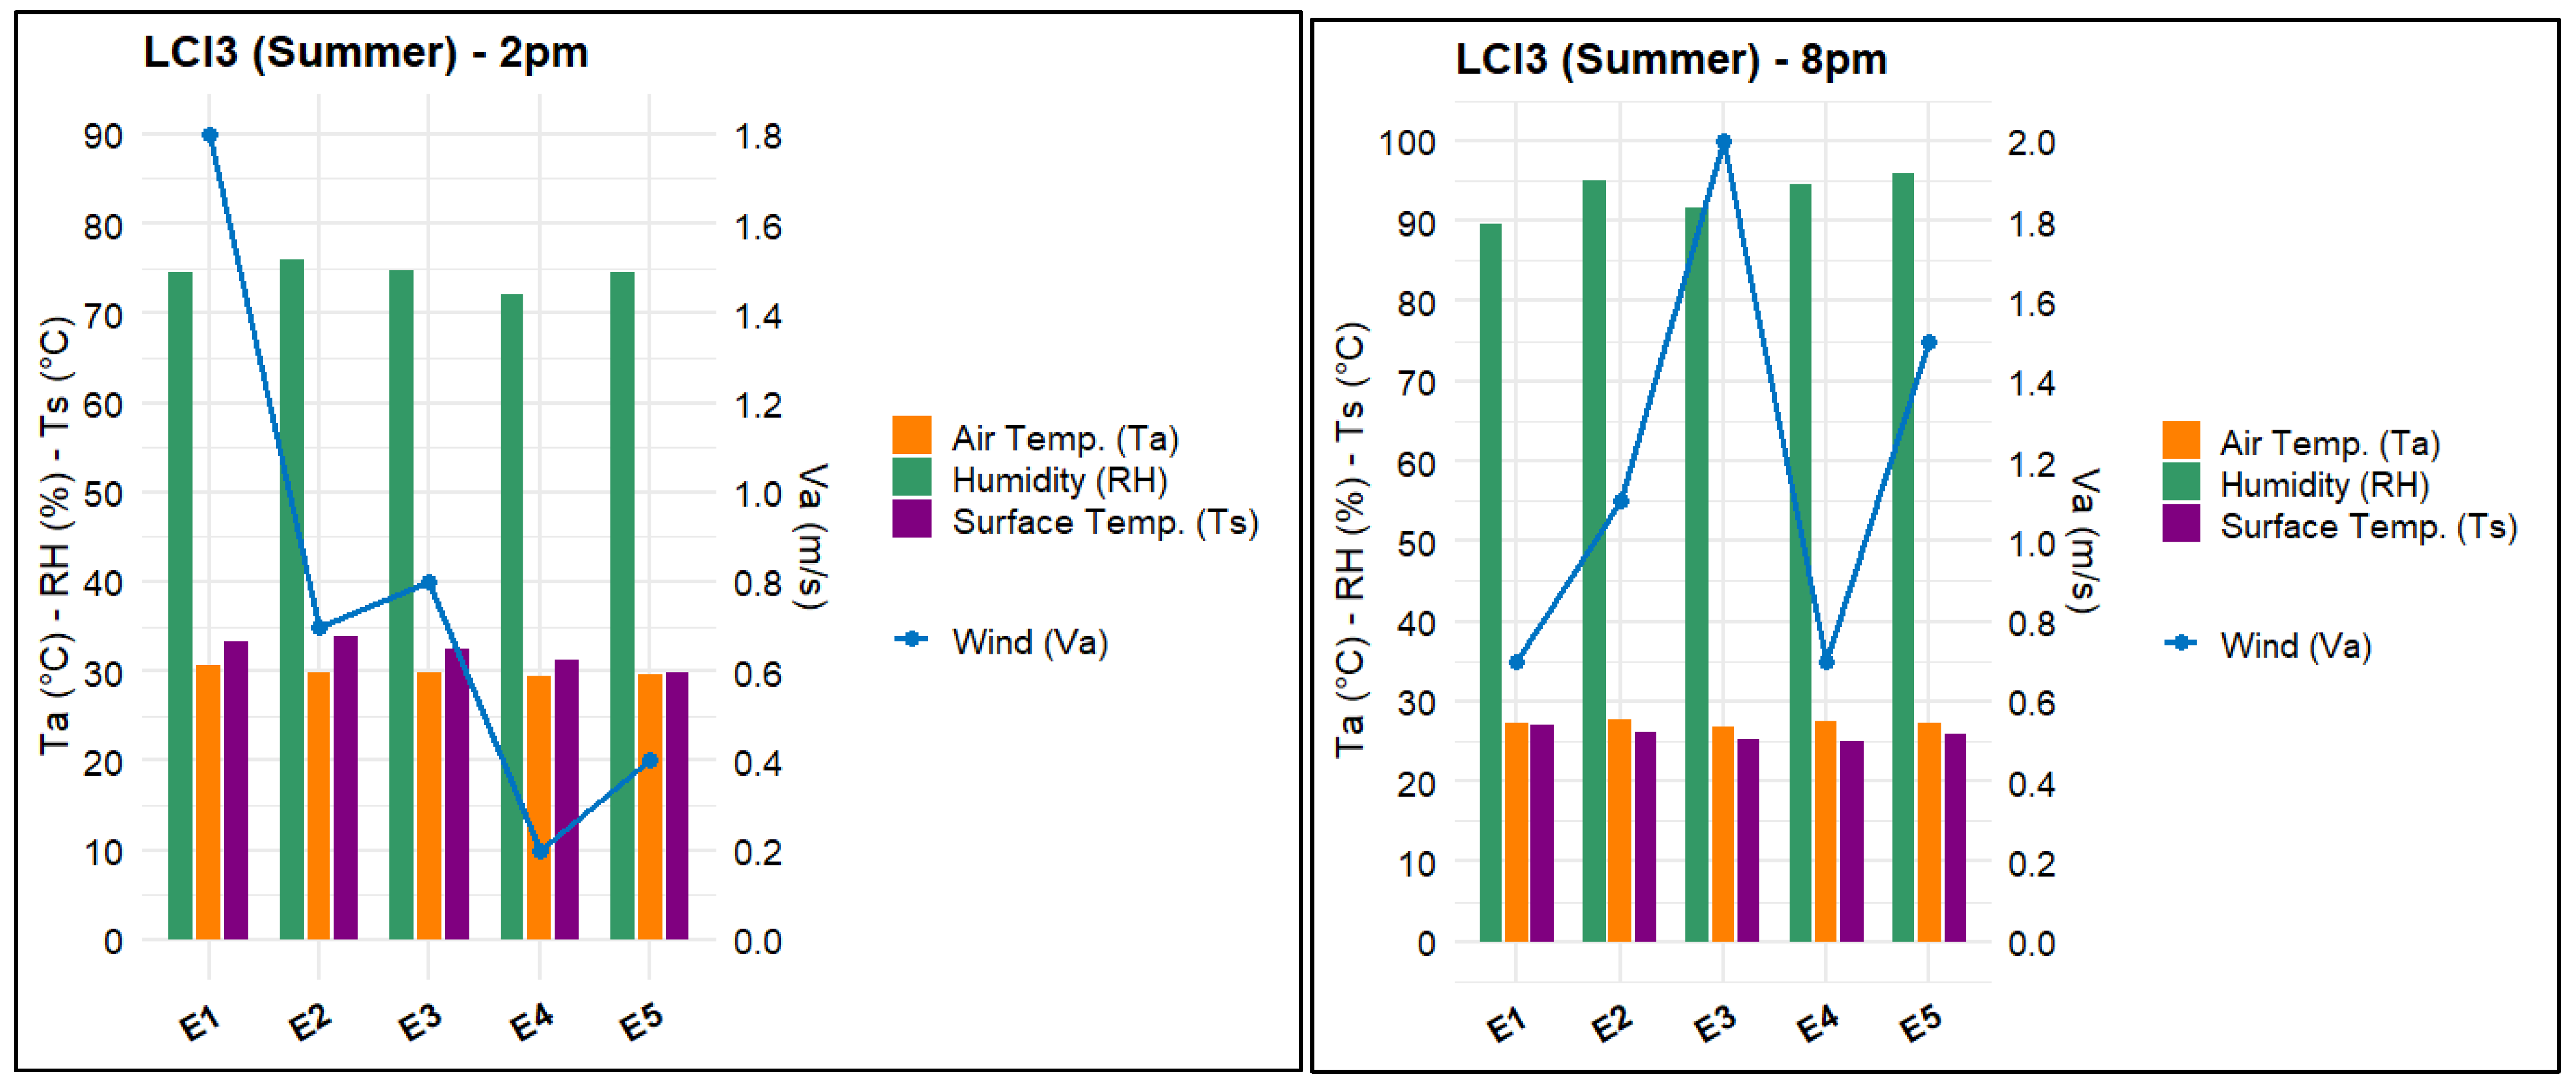
Microclimatic variations for each point were represented in three graphs for each itinerary (at 9 a.m., 2 p.m., and 8 p.m.).
The data were processed using R software. In Figure 6, we present the measurement results obtained for zone OC1, while the results for the remaining zones (OC2, LC1, LC2, LC3) are provided in Appendix E.
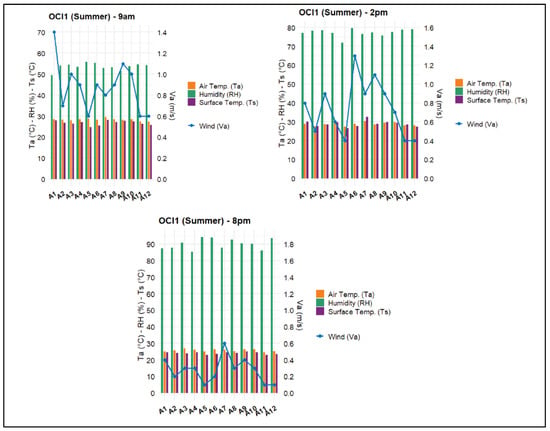
Figure 6.
Microclimatic measurement results (Ta, Ts, RH, Va) for itinerary OCI1 at 9 a.m., 2 p.m., and 8 p.m.
The microclimatic measurements collected along the different routes of the old city (OCI1, OCI2) and the lower city (LCI1, LCI2, LCI3) at 9 a.m., 2 p.m., and 8 p.m. reveal significant variations depending on the time and location. Air temperature (Ta) increases throughout the day, reaching a maximum at 2 p.m. (Tamax(PtE1) = 30.7 °C) in streets and open squares (Ta(PtA7) = 30.4 °C, Ta(PtB8) = 29.2 °C, Ta(PtC5) = 30.1 °C, Ta(PtC7) = 29.8 °C, Ta(PtD3) = 30.1 °C). Then, the temperature gradually decreases, reaching its minimum at 8 p.m. (Tamin(PtA11) = 24.7 °C), particularly in vegetated areas such as gardens. Surface temperature (Ts) variation is more pronounced and significant depending on the space. Peaks are observed at 2 p.m. (Tsmax(PtB8) = 35.2 °C), mainly in areas most exposed to solar radiation and highly asphalted spaces (e.g., PtC5, PtC7, PtB8). In contrast, shaded areas with high vegetation density help maintain lower and more stable temperatures, with values not exceeding Ts(PtB6) = 24.1 °C and Ts(PtB1) = 25.4 °C in urban gardens.
Air velocity (Va) measurements reveal significant variability depending on the types of urban spaces. Wind speeds are generally low to moderate throughout the day, averaging around 1 m/s. Some open and exposed locations, mainly in the OC2 zone of the old city, show higher values, particularly the Promenade Léonardo-Fibonacci, located directly next to the sea, with Va(PtB11) = 2.6 m/s (2 p.m.), and the Place du Premier Novembre, overlooking the port of Béjaïa, with Va(PtB4) = 2.2 m/s (2 p.m.). Overall, gardens provide moderate ventilation. Those situated in more open and exposed areas exhibit higher wind speeds, such as the Jardin El Qods with Va(PtC3) = 1.9 m/s (2 p.m.) and the Jardin de la Casbah with Va(PtB1) = 1.7 m/s (2 p.m.). Conversely, more enclosed gardens exhibit lower values, such as the Jardin de la Rue du Vieillard, with Va(PtB6) ranging from 0.0 m/s (9 a.m.) to 0.9 m/s (8 p.m.), suggesting air stagnation due to the built environment and high vegetation density.
Relative humidity (RH) values are generally high. They are sometimes lower in the morning and at 2 p.m. (49 to 70%) but increase significantly in the evening in most spaces (80 to 90%), particularly in specific locations such as the urban stairways of the old city (RH(PtA6) = 94.1%, RH(PtA12) = 93.6%) and in narrow alleys (RH(PtA5) = 94.2%).
3.2. Relationship Between SVF and Surface Temperature (Ts) at 2 p.m
Figure 7 presents the relationship between sky view factor (SVF) and surface temperature (Ts) at 2 p.m. The 2 p.m. data were prioritized in this part of the study because they represent the time of day when solar radiation is at its maximum.
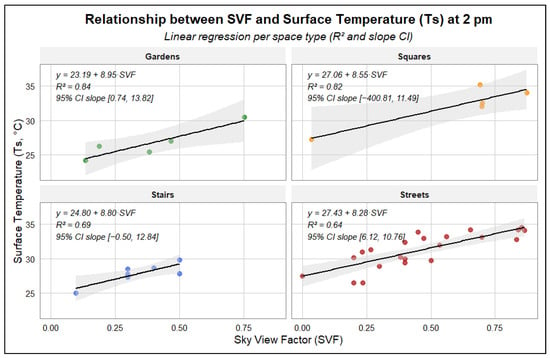
Figure 7.
Relationship between SVF and surface temperature (Ts) at 2 p.m. Colors indicate space types: green for gardens, orange for squares, blue for stairs, red for streets.
A positive relationship between SVF and surface temperature (Ts) is evident across all space types: the regression slope ranges from approximately 8.28 °C/SVF for streets (n = 23, R2 = 0.64 [95% CI slope: 6.12–10.76]) to about 8.95 °C/SVF for gardens (n = 5, R2 = 0.84 [CI: 0.74–13.82]). Stairs (n = 7, R2 = 0.69 [CI: –0.50–12.84]) follow the same upward trend, while squares (n = 5, R2 = 0.82 [CI: –400.81–11.49]) exhibit extreme uncertainty in slope estimation. Despite these wide confidence intervals, the overall effect remains clear: Ts increases with SVF, although coefficient precision is constrained by the small sample sizes for gardens and squares.
It also reveals that squares and streets have the highest Tₛ values at 2 p.m.; for example, Ts(PtB8) = 35.2 °C at Frères Boucheffa Square, Ts(PtD5) = 34.5 °C at EDIMCO Market Street (2), and Ts(PtC5) = 34.2 °C at Liberty Street, While most gardens exhibit the lowest surface temperatures (Ts) at 2 p.m. (Ts(PtB6) = 24.1 °C, Ts(PtB1) = 25.4 °C, Ts(PtC4) = 26.2 °C), an exception is observed for two gardens displaying significantly higher temperatures compared to the others, namely Ts(PtB9) = 27.0 °C and Ts(PtC3) = 30.5 °C.
3.3. Relationship Between Sky View Factor (SVF) and Air Temperature (Ta) at 2 p.m.
Figure 8 presents the relationship between sky view factor (SVF) and air temperature (Ta) at 2 p.m. A generally positive relationship between SVF and air temperature (Ta) at 2pm is observed across the different types of spaces studied. The regression slope ranges from 0.63 °C/SVF for stairs (n = 7, R2 = 0.02; 95% CI: −5.00 to 5.90) to 2.37 °C/SVF for squares (n = 5, R2 = 0.73; 95% CI: 0.30 to 150.00). Gardens (n = 5, R2 = 0.34; 95% CI: –0.18 to 8.25) and streets (n = 23, R2 = 0.31; 95% CI: 0.42 to 3.93) also confirm this positive trend. However, both the strength of the relationship and the associated uncertainty vary considerably depending on the type of space, largely due to the limited size of some subsamples. Overall, the relationship with Ta appears weaker and less pronounced than that observed between SVF and surface temperature (Ts).
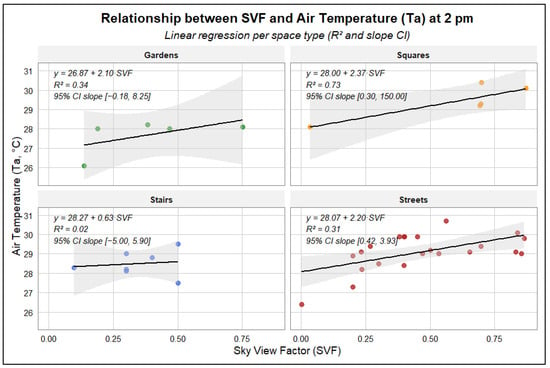
Figure 8.
Relationship between sky view factor (SVF) and air temperature (Ta) at 2 p.m. Colors indicate space types: green for gardens, orange for squares, blue for stairs, red for streets.
Figure 8 also indicates that squares and streets have the highest air temperatures (Ta) at 2 p.m.; for example, Ta(PtE1) = 30.7 °C at Krim Belkacem Boulevard, Ta(PtA7) = 30.4 °C at Sidi Soufi Square, and Ta(PtD3) = 30.1 °C at House of Culture Square, whereas gardens maintain a lower and more stable Tₐ (Ta(PtB1) = 28.2 °C, Ta(PtB6) = 26.1 °C, Ta(PtB9) = 28.0 °C, Ta(PtC3) = 28.1 °C, Ta(PtC4) = 28.0 °C).
3.4. Questionnaire Results
Figure 9 illustrates the median votes of perceived thermal variables at 2 p.m. for different urban itineraries (OCI1, OCI2, LC1, LC2, and LC3), evaluated through various types of votes, including ASV, dASV, WSV, and WTC, allowing for an analysis of thermal perception based on the environmental characteristics of each itinerary.
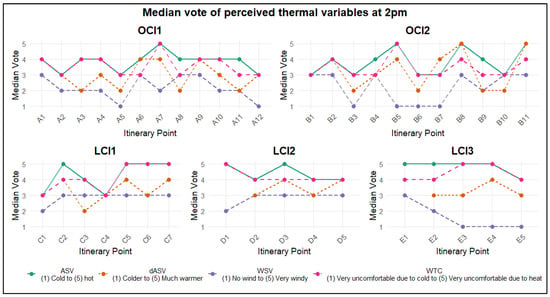
Figure 9.
Median vote of perceived thermal variables at 2 p.m.
The results show that the votes for thermal sensation (ASV) range between (ASV = 3, neither hot nor cool) to (ASV = 4, warm), with peaks at certain points (ASV = 5, hot). The LCI1 and LCI3 routes in the lower city have the most points where ASV is rated as hot (ASV = 5).
The dASV varies between (dASV = 2, cooler), (dASV = 3, neither hot nor cool), and (dASV = 4, warmer) at all points, except for two locations (dASV(PtB8) = 5) and (dASV(PtB11) = 5), where the dASV increased to (dASV = 5, much warmer). The two itineraries in the old city (OCI and OCI2) exhibit the most varied dASV, possibly due to the morphological diversity of the traversed spaces and the presence of gardens. It is observed that dASV is often rated as (dASV = 4, warmer) when transitioning from a sheltered area to a more open space, as seen in the case of the transition from point B10, characterized by a low SVF (SVF(PtB10) = 0.0), to the more open point B11 (SVF(PtB11) = 0.69) in the OCI2 route. This phenomenon is also observed in the transition from point C1 (SVF(PtC1) = 0.09; Ta(PtC1) = 28.3 °C; Ts(PtC1) = 25.0 °C) to point C2 (SVF(PtC2) = 0.23; Ta(PtC2) = 29.1 °C; Ts(PtC2) = 31.0 °C) in the LCI1 itinerary.
Wind perception (WSV) varies significantly from one space to another in the two itineraries of the old city (OCI1 and OCI2) and is slightly more stable in the lower city itineraries (LCI1, LCI2, LCI3). Most votes range between (light breeze, WSV = 2) and (pleasant, WSV = 3).
Walking comfort related to thermal perception (WTC) generally ranges between (comfortable, WTC = 3) and (uncomfortable due to heat, WTC = 4). Some peaks are observed at two points in the old city (A7 and B5) and at several points in the lower city itineraries (C5, C6, C7, D1, E3, and E4). In these locations, walking comfort is rated as (very uncomfortable due to heat, WTC = 5). It is noted that the WTC curves are almost parallel to those of the thermal sensation (ASV) and are sometimes superimposed, which may indicate a significant relationship between these two types of votes. To verify this hypothesis, we analyzed the association between ASV and WTC at 2 p.m., as illustrated in Figure 12.
- Comparison of squares, gardens, and urban staircases:
Gardens B1, B6, and C4 show an ASV that is neither hot nor cool, except for the garden at Porte Sarazine B9 (ASV(PtB9) = 4). However, all gardens provide good walking comfort (WTC), except for the El Qods Garden C3, where WTC is rated as uncomfortable due to heat (WTC(PtC3) = 4).
Unlike gardens, public squares generally have a warm ASV and walking discomfort due to heat, except for Gueydon Square B4, which offers good walking comfort (WTC(PtB4) = 3), mainly due to pleasant wind perception (WSV(PtB4) = 3, pleasant). The square with the worst walking comfort is Sidi Soufi Square A7 (WTC(PtA7) = 5), where the thermal sensation is hot (ASV(PtA7) = 5) and wind perception is weak (WSV(PtA7) = 2, corresponding to a light breeze). This square, A7, is also characterized by a high sky view factor (SVF(PtA7) = 0.7).
Urban staircases generally provide good walking comfort related to thermal perception (WTC). However, an exception is observed at the Tahar Tamindjout staircase A9 (SVF(PtA9) = 0.5), where WTC is rated as uncomfortable due to heat.
The graph presented in Figure 10 compares walking thermal comfort (WTC) at 2 p.m. for five routes (OC1, OC2 in the old city; LC1, LC2, LC3 in the lower city). The scale ranges from 1 (very uncomfortable due to cold) to 5 (very uncomfortable due to heat). In both parts of the old city (OC1 and OC2), the medians are around 3 and 4, indicating votes ranging from comfortable and uncomfortable.
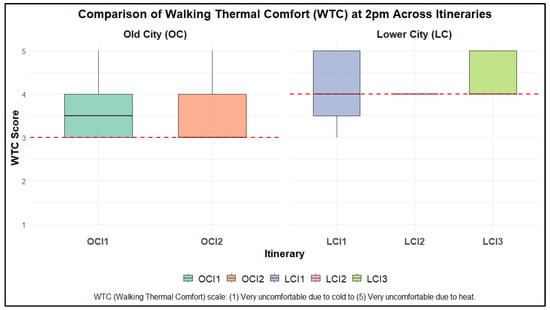
Figure 10.
Comparison of walking thermal comfort (WTC) at 2 p.m. across itineraries in old city (OC) and lower city (LC).
For the three areas in the lower city (LC1, LC2, and LC3), the medians are higher (closer to 4), with votes ranging from 4 to 5, suggesting a more pronounced walking discomfort. The whisker and box plots reveal variability in walking thermal comfort (WTC). Overall, the lower city (LC) appears to be more affected by heat at 2 p.m. than the old city (OC).
Figure 11 presents the relationship between surface temperature (Ts) and actual sensation vote (ASV) at 2 p.m. A strong monotonic relationship was found between surface temperature (Ts) and actual sensation vote (ASV) at 2 p.m.: Spearman’s ρ = 0.82 (95% CI [0.68, 0.90], p < 0.001). The linear regression line shows ASV increasing with Ts, and the shaded band represents the 95% confidence interval around the trend, indicating the uncertainty of the slope estimate. However, because ASV is an ordinal scale (1–5) and the sample size is moderate, these results, although statistically robust, should be generalized with caution.
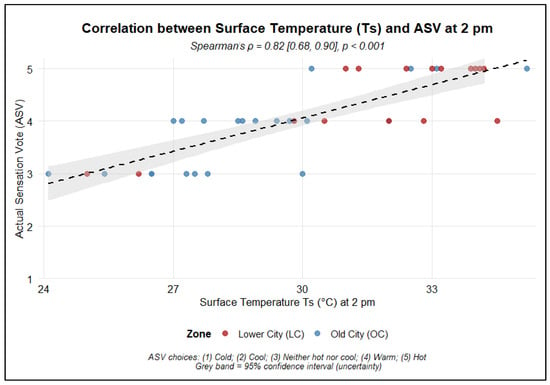
Figure 11.
Relationship between surface temperature (Ts) and actual sensation vote (ASV) at 2 p.m.
Figure 12 presents the distribution of walking thermal comfort (WTC) responses across ASV (actual sensation vote) levels at 2 p.m. A significant positive association is observed between ASV and WTC (Kendall’s τᵦ = 0.79, 95% CI [0.70, 0.88], p < 0.001). As thermal sensation increases, the proportion of participants reporting thermal discomfort while walking (especially due to heat) rises noticeably. Comfortable responses dominate at ASV 3, while discomfort due to heat becomes predominant at ASV 4 and especially at ASV 5.
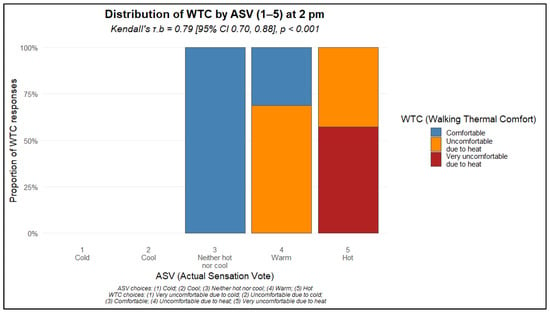
Figure 12.
Distribution of walking thermal comfort (WTC) responses across ASV levels at 2 p.m.
By simultaneously observing the voting results represented in Figure 9, it can be noted that despite a strong correlation, the ASV curve does not always overlap with the WTC curve. In many instances, WTC is rated as less uncomfortable, even when ASV is rated as very hot (ASV = 5). This is often observed when wind speed is higher and wind perception is perceived pleasant (WSV = 3).
3.5. Mental Map Results
The results of the mental maps created by participants at the end of each walking itinerary (OCI1, OCI2, LCI1, LCI2, LCI3) were processed using NVIVO and then represented as word clouds (Figure 13).
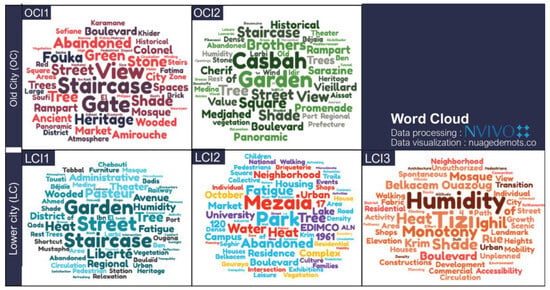
Figure 13.
Results (word clouds) of mind map study for each itinerary.
Figure 13 presents the results obtained from the study of mental maps drawn by participants at the end of each walking itinerary carried out in the old city (OCI1 and OCI2) and the lower city (LCI1, LCI2, and LCI3).
It is noticeable that perceptions vary from one itinerary to another. The OCI1 itinerary, which passes through the Bab el-Louz and Karamane neighborhoods, shows a contrast in terms of thermal perception. Elements such as “trees” and “shade” suggest a positive perception in certain spaces. On the other hand, negative elements are also noted, such as “fatigue” and “abandoned”, which convey an image of discomfort, probably due to a lack of maintenance or the physical effort required to climb the stairs. The term “view” is also very prominent, suggesting that the sea view provided by this itinerary significantly contributes to pedestrians’ perceptions. In the OCI2 itinerary, an important dimension dominates: nature (garden, tree, vegetation). Other elements such as “wind”, “shade”, and “panoramic” suggest a positive perception in many areas. The term “rest”, although not very prominent, highlights the importance of resting spaces (such as gardens) for pedestrians. However, some negatively perceived elements are also noted, particularly humidity. It is also observed that in both itineraries of the old city (OCI1 and OCI2), the heritage dimension is strongly expressed through terms such as “heritage”, “stone”, “gate”, and “staircase”.
The LCI1 itinerary presents a duality in terms of thermal perception. Just like OCI1, the vegetation and airflow were well noted by pedestrians and perceived positively. However, terms such as “heat” and “fatigue” were also mentioned, often associated with specific locations, notably Rue de la Liberté, which was frequently highlighted in the mental maps. One participant stated: “When I reach this street (Rue de la Liberté), I start to feel the heat and fatigue; it’s completely different from the beginning of the itinerary.” (M_22).
In the LCI2 itinerary, elements emerged that were not previously identified in the questionnaires, specifically the natural features of Mezaïa Park, represented by terms such as “park”, “Mezaïa”, “water”, “tree”, and “shade”. Walking along this park was perceived very positively: “I wish the entire path we walked had been as green as this park.” (W_25). However, just like in the previous itinerary, the presence of terms such as “sun”, “heat”, and “fatigue” indicates a negative perception in many areas, mainly along the EDIMCO market. The term “abandoned” also suggests the deterioration of certain walking-related infrastructures.
The LCI3 itinerary is characterized by a negative thermal perception. This is expressed multiple times in the mental maps. Terms such as “fatigue”, “sun”, “heat”, and “monotonous” suggest that this itinerary was challenging for pedestrians. However, some positive terms like “shade” were also present, but their significance was minimal.
3.6. Influence of Non-Physical vs. Physical Factors on Walking Thermal Comfort
Figure 14 demonstrates the influence of non-physical vs. physical factors on walking thermal comfort (WTC). The top panel shows that non-physical factors such as vegetation (OR = 1.50 [1.20–1.90]), maintenance (OR = 1.40 [1.10–1.80]), and views (OR = 1.3 [1.00–1.60]) markedly increase the odds of better WTC, whereas fatigue (OR = 0.70 [0.50–0.90]) and safety concerns (OR = 0.80 [0.60–1.05]) decrease them. In the bottom panel, an increase in air temperature (Ta; OR = 0.85 [0.75–0.95]) reduces comfort, while an increase in wind speed (Va; OR = 1.30 [1.05–1.60]) enhances it. The relatively wide confidence intervals for safety and fatigue highlight the uncertainty associated with small subsamples.
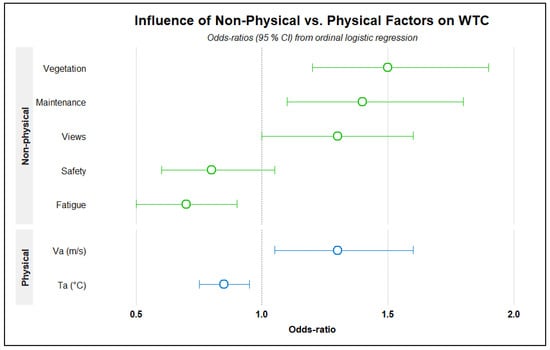
Figure 14.
Influence of non-physical vs. physical factors on walking thermal comfort (WTC).
4. Discussion and Recommendations
The present research aims to determine the influence of microclimatic variables on pedestrians’ thermal perception and walking comfort in two contrasting parts of the city of Béjaïa (the old city and the lower city). Data were collected using microclimatic measurements and questionnaires, which were conducted at strategic points set along five walking routes, which were determined through an in-depth morphological analysis of the city. Mental maps created at the end of each route provided additional information to complement the other methods.
4.1. Influence of Sky View Factor (SVF) on Microclimatic Variables and Pedestrian Perception
The study showed that SVF plays a crucial role in the thermal regulation of urban spaces. It helps reduce air and surface temperatures by limiting the direct penetration of solar radiation. This effect is particularly significant in summer when solar exposure is prolonged and intense. This phenomenon is mainly observed on the OCI2 itinerary in OC1 of the old city of Béjaïa, as well as on the LCI1 itinerary in LC1 of the lower city. These areas are characterized by a large number of covered or semi-covered spaces with vegetation, which reduces the SVF and thus creates more shaded areas compared to other sectors. This configuration ensures better thermal comfort during the summer period. The positive effect of a reduced SVF in summer has been demonstrated in several studies, notably in the research conducted by Arrar et al. [] on the Casbah of Algiers, where it was found that temperatures decrease by 2 °C in areas highly protected from solar radiation. In winter, these same spaces help retain heat, ensuring higher temperatures []. These findings also align with the work of Ali-Toudert et al. [] on the city of Beni Isguene in the Mzab region of Algeria [].
4.2. Influence of Wind on Heat Perception (ASV) and Walking Comfort (WTC)
The results of the questionnaires showed that the sensation of heat can decrease in the presence of wind speeds, and Figure 14 illustrates a clear positive association between wind speed and walking thermal comfort. However, this was not observed in all cases. Indeed, when the temperature increases further, the influence of wind seems to diminish. At Frères Boucheffa Square (B8), with a temperature of Ta(PtB8) = 28.4 °C, the thermal sensation becomes “hot”, despite an ideal wind speed of 1.7 m/s. A similar phenomenon is observed at point B11 at 2 p.m., where ASV(PtB11) = 4, under a temperature reaching Ta(PtB11) = 29.4 °C and a wind speed of 2.6 m/s. This suggests that at higher temperatures, the cooling effect of wind may become insufficient. The human body’s cooling mechanism primarily relies on the evaporation of sweat. The presence of high heat combined with high humidity levels reduces the efficiency of evaporation, which keeps the sensation of heat uncomfortable even in the presence of moderate or strong wind speeds. Sometimes, even if the perceived heat is not significantly reduced, the discomfort related to thermal perception (WTC) can decrease due to improvements in physiological and psychological walking conditions, thereby enhancing overall pedestrian comfort.
4.3. Influence of Urban Morphology on dASV
The dASV is strongly influenced by slight changes in microclimatic variables, particularly temperature. In many cases, even if two points receive the same vote, the dASV can vary significantly from one location to another depending on changes in physical and spatial characteristics. This observation aligns with the work of Vasilikou et al. [], conducted in the cities of Rome and London. In their study, they demonstrated that morphological descriptors, particularly the variation between the height and width of spaces, as well as differences in spatial sequences, play a crucial role in differentiating the thermal comfort of places [].
4.4. Comparison Between the Old City Zones (OC1 and OC2)
The OC1 zone, characterized by a predominantly precolonial urban fabric and encompassing the two historic neighborhoods of Bab el-Louz and Karamane, presents several features favorable to thermal perception and walking comfort during the summer period. The presence of multiple areas with low SVF, the use of thermoregulatory materials such as stone and brick, as well as shaded surfaces, are key elements ensuring pedestrian comfort. However, this part of the medina faces several shortcomings in terms of adequate urban planning, including the degradation of certain pathways, the lack of vegetation in some areas, and the absence of breathing spaces, all of which negatively impact pedestrian comfort.
The OC2 zone also has certain characteristics that contribute to pedestrian comfort. The presence of gardens and landscaped squares, which serve as breathing spaces, helps improve walking conditions. However, some deficiencies remain, particularly in the management of certain gardens, such as the garden of Porte Sarrazine. In recent years, the vegetation in some green spaces, including those in the lower city, has become less dense, leading to an increase in SVF and a reduction in shaded areas. Additionally, the ground covering used is not always suitable, which further contributes to the rise in surface temperature. Regarding wind speed, it is strongly assumed that the OC2 zone of the old city of Béjaïa benefits more from the sea breeze due to the presence of wide boulevards, such as Boulevard Bouaouina (B7), lined with trees, as well as open squares that provide significant exposure to the sea, such as Place Gueydon (B4) (Va(PtB4) 2 p.m. = 2.2 m/s), which received a very positive rating (WSV(PtB4) 2 p.m. = 3). Indeed, streets aligned with prevailing winds benefit from better ventilation. Additionally, the H/L ratio affects wind speed, and the arrangement of buildings forming corridors can also increase wind velocity. These observations align with studies conducted in various cities worldwide [,,]. However, it is highly recommended that this study be strengthened by conducting a more in-depth analysis specifically focused on wind dynamics within the medina.
4.5. Comparison Between the Lower City Zones (LC1, LC2, LC3)
The LC1 zone consists of two main parts. The first part, located closer to the old city (OC), is characterized by a good density of vegetation and the presence of resting areas, such as gardens. The second part, however, lacks these features. This contrast has impacted both thermal perception and the walking comfort experienced by pedestrians. In Figure 9, it can be observed that the WTC curve fluctuates between comfortable and uncomfortable from point C1 to point C4. However, this curve rises to “very uncomfortable due to heat” for points C5, C6, and C7. These three points (C5 to C7) exhibit high air and surface temperatures, particularly along Rue de la Liberté. This is mainly due to the high SVF, which allows a significant amount of solar radiation to penetrate, combined with low-albedo, heat-absorbing surface materials such as asphalt. Additionally, the lack of shaded and resting areas makes summer walking conditions particularly challenging. It is strongly recommended to integrate heat mitigation solutions, such as the installation of shading structures and the use of high-albedo urban materials, such as light-colored pavers. Previous studies have shown that increasing albedo and enhancing urban vegetation significantly reduce the urban heat island effect [,,]. Moreover, integrating resting spaces that help alleviate thermal stress for pedestrians is essential in this part of the lower city.
Just like LC1, the mixed industrial zone (LC2) presents two contrasting situations: areas with concentrated residential buildings exhibit less unfavorable conditions. In contrast, in the section primarily composed of factories and workshops, there is a worsening of thermal conditions, as observed in Rue du Marché_1 (SVF = 0.83) and Rue du Marché_2 (SVF = 0.85), where air and surface temperatures are exceptionally high. This itinerary lacks breathing spaces for pedestrians. Additionally, the square of the Maison de la Culture is not designed to enhance thermal comfort, and Parc Mezzaia, despite being located at the heart of this zone, operates as a paid amusement park. As a result, it is not freely accessible to residents and pedestrians, preventing it from playing a beneficial role in daily urban commutes. The LC3 zone experiences more unfavorable thermal conditions compared to other areas of the lower city, negatively impacting thermal perception. Pedestrian circulation spaces are often very limited or even absent, making walking more complex compared to LC2 and LC1. However, this zone does offer some advantages, particularly in the shaded areas created by the positioning of buildings. Improvements are both possible and recommended, including the creation of sufficiently wide sidewalks, breathing spaces (squares, gardens), and the incorporation of elements that enhance freshness and shade, such as vegetation.
4.6. Pedestrians’ Subjective Perceptions Through Mental Maps and Questionnaires in Relation to Microclimatic Measurements
The results represented by word clouds (Figure 13) demonstrate that thermal perception is closely linked to urban morphology, vegetation, and urban planning. This finding is confirmed by several studies on the effects of SVF and vegetation on the urban microclimate [,,,,]. Several dimensions emerge from mental maps, some of which cannot be identified through questionnaires. Pedestrians have expressed a strong sensitivity to the heritage and historical character of the old city, considering that the materials used (mainly stone) and the shaded surfaces created by historical elements contribute to thermal comfort. This effect is well documented in research on traditional and historic urban fabrics and their impact on urban heat regulation and thermal perception [,,]. Pedestrians also display a strong attachment to the historical fabric of the old city. This finding had already been highlighted in a study on the sensitive landscape of the Béjaïa medina []. However, they also report the degradation of several pedestrian spaces, as well as certain historical structures, such as Porte Fouka, mentioned in the OCI1 itinerary. This gate, considered one of the city’s emblematic landmarks, plays a significant role in shaping the urban ambience, thanks to its grandeur and the shaded areas it creates. Therefore, it is necessary to restore it, along with the old city walls and historical urban staircases, by integrating them into the Permanent Plan for the Safeguarding and Enhancement of the Protected Sector (PPSMVSS), which is currently under development. Another important element that emerged from the analysis is the presence (or absence) of breathing spaces along pedestrian routes. These spaces, such as squares, gardens, parks, and esplanades, play a crucial role in the walking experience and the thermal comfort of pedestrians. They serve as thermal regulation hubs and spatial pauses, allowing for both physiological and psychological adaptation to climatic and physical constraints during movement [,]. Additionally, due to thermal memory, these spaces help reduce perceived fatigue and enhance overall walking comfort. When a pedestrian crosses a shaded space, they retain that experience, making the rest of the journey more pleasant. Several researchers also emphasize the importance of thermal memory, stating that thermal comfort does not only depend on the present moment but is also influenced by previous thermal experiences [,].
Vegetation exerts a strong and statistically significant positive influence on walking thermal comfort (OR = 1.50 [1.20–1.90], Figure 14). Pedestrians have expressed very positive perceptions regarding the presence of green spaces and water, particularly along the OCI2, LCI1, and LCI2 routes. They also emphasize the value of Mezaïa Park, located at the heart of the city of Béjaïa. This park represents a high-value walking space and should be made more accessible to the public. Microclimatic measurements and questionnaires have also confirmed these findings. In most vegetated areas, surface and air temperatures are lower, primarily due to the shading effects and cooling provided by vegetation elements, such as trees and grass. In some exceptional cases, certain areas are perceived as comfortable despite high air temperatures. These exceptions are often observed in densely vegetated zones, suggesting that vegetation may also have an indirect influence on pedestrians’ heat perception. For example, at point C1, corresponding to the theater staircase surrounded by vegetation, the ASV at 2 p.m. is rated as 3 (“neither hot nor cool”), despite a high temperature (Ta(PtC1) = 28.3 °C). A similar phenomenon is observed at other locations, such as the Fouka staircase (A2), where the temperature is also high (Ta(PtA2) = 27.5 °C) but still perceived as “neither hot nor cool”. It is evident that even when temperatures are high, the mere visual presence of vegetation in the environment triggers a perception of freshness and creates a calming effect. The integration of vegetation into pedestrian routes should be considered not only as a means of reducing heat but also as a psychological and sensory comfort factor that influences how pedestrians experience walking. This finding aligns with numerous studies that have confirmed that urban vegetation influences mental well-being and encourages walking activity [,,,].
High humidity has been perceived as a major discomfort factor affecting walking comfort across all the studied routes. Indeed, high humidity intensifies the sensation of heat and limits sweat evaporation, causing discomfort, suffocation, and fatigue among pedestrians, thereby reducing their overall walking comfort in urban environments. These observations align with the study conducted on the Casbah of Algiers by Arrar et al. []. This research confirmed a significant correlation between humidity levels and the physiological equivalent temperature (PET), with a correlation coefficient of 0.81 in winter and 0.79 in summer [].
The term “fatigue” was reported in the mental maps of the OCI route, mainly during uphill segments. Figure 14 confirm that higher fatigue levels reduce the odds of better WTC (OR = 0.70 [0.50–0.90]). This suggests that topography plays a role in thermal perception and walking comfort, which was also confirmed through questionnaires. At point A6, despite the presence of thermal discomfort (ASV(PtA6) = 4), walking comfort remained moderate (WTC(PtA6) = 3). A similar observation was made on Fatima Street (A8), where the evaluations were identical (ASV(PtA8) = 4; WSV(PtA8) = 3; WTC(PtA8) = 3). Likewise, Mekki Bacha Staircase (A11) showed moderate walking comfort (WTC(PtA11) = 3), despite a perceived temperature of discomfort (ASV(PtA11) = 4) and a light breeze perception (WSV(PtA11) = 2). The common feature among these locations is that they are descended paths, indicating that topography plays a significant role in thermal perception and pedestrian comfort. Fatigue was reported across all other routes except for the OCI2 itinerary. The uniqueness of this route lies in its varied environment, alternating between sunlit and shaded areas. The presence of well-designed squares, such as Place Gueydon, along with gardens, shaded surfaces (trees, architectural elements), and underground passages (Sidi Abdelkader Tunnel) creates a dynamic walking experience, reducing fatigue and monotony.
When a pedestrian continuously walks under direct sunlight, mainly uphill, they accumulate heat, which increases perceived fatigue due to cumulative thermal load. Conversely, when a route is diverse and offers resting opportunities, such as shaded spaces, even for a short period, it allows the body to recover and cool down. According to Ali Smail et al. [], environmental diversity provides numerous psychological benefits. Their study confirms that negative alliesthesia (prolonged exposure to uncomfortable conditions) increases fatigue, whereas positive alliesthesia (thermal recovery) reduces fatigue and enhances walking comfort [].
4.7. Strengths and Limitations of the Research
4.7.1. Strengths
This research presents several key elements that enhance its relevance. One of its main strengths is the use of accompanied walks and walking journals, which serve as powerful methods and tools that facilitate close engagement with pedestrians and an in-depth understanding of their perceptions and lived experiences. This study fills a significant gap in the scientific literature by integrating sensory perceptions and pedestrian affective experiences, mainly through the use of mental maps and the cross-analysis of qualitative results with microclimatic measurements and questionnaires. Additionally, the research takes into account pedestrians’ perceptions of two crucial microclimatic variables (temperature and wind), while also analyzing spatial transitions and variations in thermal perceptions. Moreover, this research is the first study conducted in the city of Béjaïa. To our knowledge, no previous studies on outdoor thermal comfort have been conducted in this area, making this research a significant and original contribution to the geographical context and the broader literature on Maghreb and North African cities. The comparative approach between two contrasting urban zones (the old city and the lower city) and five different urban fabrics (precolonial, colonial, planned, spontaneous, and industrial/mixed) adds significant value to this study provides valuable insights and recommendations aimed at enhancing the current urban conditions in specific areas. A promising next step in the analysis would be to calculate the thermal comfort index (physiological equivalent temperature, PET) by determining the Mean Radiant Temperature (Tmrt) from the already collected microclimatic data and conducting simulations using the RayMan software. This approach would further strengthen the existing findings.
4.7.2. Limitations
This research presents certain limitations. First, the number of daily measurement sessions was restricted to three times per day (9 a.m., 2 p.m., and 8 p.m.), mainly due to significant challenges in recruiting participants, a common issue in research. In the future, it would be beneficial to increase the number of study days as well as the frequency of walks per day to further strengthen the findings. Additionally, the current number of participants (n = 70) could be expanded to enhance the robustness and representativeness of the results.
Moreover, a comparison with winter data would be of great interest to better understand seasonal variations in outdoor thermal perception and comfort.
4.8. Practical and Research Implications
4.8.1. For Urban Planners
This study helps urban planners understand that walking comfort in cities is not solely determined by environmental and infrastructural factors but is also significantly influenced by sensory perception, particularly thermal perception. It plays a crucial role in shaping pedestrians’ route choices, walking pace, and overall behavior in urban environments. Moreover, the study urges urban designers to thoughtfully integrate vegetation and select high-albedo materials in urban planning, as these are among the most effective solutions for enhancing thermal comfort in cities, particularly in the urban fabrics of Béjaïa and other North African cities facing similar climatic challenges.
Additionally, areas identified as uncomfortable or marginalized in both parts of Béjaïa, such as public squares, should be reconsidered and enhanced by urban planners to encourage pedestrian activity. As mentioned in the introduction of this article, an urban renovation plan (PPSMVSS) has been developed for Béjaïa and is currently being implemented []. The recommendations from this research provide valuable insights to enhance ongoing initiatives. They could be directly integrated into current urban planning operations to improve thermal comfort in the old city of Béjaïa and promote urban walkability.
4.8.2. For Researchers
This research enriches the existing literature on the impact of microclimatic variables on pedestrian perception and urban walking practices. It also provides a valuable methodological contribution to researchers working on urban walkability and pedestrian thermal perception. Qualitative methodologies, such as accompanied walks, walking journals, and mental maps, though sometimes underestimated, significantly complement and enhance the findings obtained from microclimatic measurements and questionnaires. Researchers can build on the methodology presented in this study and apply it to various research contexts worldwide.
One promising research avenue for Béjaïa in the future would be to investigate further the impact of wind and sea breeze on thermal comfort in the city. Additionally, it would be relevant to develop scenarios analyzing the influence of vegetation, particularly in the unplanned area LCI3. This analysis could be conducted using advanced modeling software such as ENVI-met, combined with RayMan, which was used in this study.
5. Conclusions
This research examined the impact of microclimatic variations on pedestrian thermal perception and walking comfort during the summer period (July 2022) in two contrasting areas of the city of Béjaïa (the old city and the lower city). The study was conducted along five routes crossing five distinct urban fabrics (precolonial, colonial, planned, industrial-mixed, and spontaneous). Microclimatic data and pedestrian perceptions were recorded at each strategic point along the routes. Additionally, the use of mental maps provided a comprehensive perception of each itinerary.
The key findings are as follows:
(1) Each microclimatic variable influences pedestrian thermal perception. Air temperature has a direct impact on the sensation of heat or coolness. In summer, this variable can cause thermal discomfort, affecting walking practices. The perception of heat can be significantly intensified if surface temperature, another crucial variable, is also high. Surface temperature increases when spaces are highly exposed to solar radiation for prolonged periods and when surface materials have low albedo, absorbing a large amount of solar radiation. A high percentage of relative humidity can create discomfort, as it reduces the efficiency of human perspiration and impairs skin evaporation. Finally, wind is a key factor in thermal perception. Air velocity enhances body heat dissipation, helping cool the body by increasing sweat evaporation, thereby improving walking comfort. In the context of this research, it was concluded that air velocity must reach a minimum threshold of 1 m/s to have a beneficial effect on pedestrian thermal comfort.
(2) The sky view factor (SVF), which represents the degree of openness to the sky, impacts microclimatic variables, primarily surface temperature. Additionally, high exposure of pedestrians to direct solar radiation increases their sensation of discomfort and distress. The presence of shaded surfaces, created by various obstacles, provides a significant advantage in reducing thermal stress by limiting heat accumulation.
(3) Diversified routes are more favorable for walking and enhance pedestrians’ thermal perception. This type of urban itinerary creates a diverse range of atmospheres due to the presence of multiple factors, including shade, vegetation, varied materials, and the alternation between narrow and open spaces. Furthermore, breathing spaces, such as designed squares, urban gardens, or even vegetated areas, help regenerate thermal sensations and increase pedestrians’ desire to walk. Moreover, these breathing spaces should be strategically positioned within the urban fabric and along walking routes to provide moments of rest and thermal and sensory regeneration.
(4) A study on thermal perception must consider the transitions between traversed spaces. It is not enough to analyze each space in isolation; it is crucial to consider the changes from one environment to another for a rich and comprehensive analysis of pedestrian perceptions. The perception experienced in one space can be influenced by the sensation felt when passing through the previous space. This highlights the importance of studying thermal memory in depth, an essential but often overlooked factor in research. This approach requires the use of appropriate methodologies, including, for example, incorporating questions about dASV in questionnaires and using mental maps and walking journals.
(5) The old city of Béjaïa, particularly zone OC2, despite several shortcomings, offers better walking comfort in relation to thermal perception compared to the lower city. The area comprising the Bab el-Louz and Karamane urban fabrics (OC1) could be improved by integrating cooling elements, such as vegetation, and by developing public squares to transform them into actual breathing spaces for pedestrians. Sidi Soufi Square, which occupies a strategic position in the historical fabric, could be particularly enhanced for this purpose. In the lower city, the Lekhmis neighborhood presents some interesting advantages, particularly the presence of gardens and shaded areas. However, redevelopment and requalification operations are essential for zone LC2. The routes and open spaces in this area are highly exposed to solar radiation, and the materials used have a low albedo. It is strongly recommended to relocate the industrial zone outside the city center to allow for the creation of more comfortable and livable spaces. Finally, the spontaneous zone of the city (LC3) requires urgent attention from urban planners to improve walking comfort. Some existing advantages could be positively leveraged, such as a reduced SVF in certain spaces and the presence of shaded areas.
These recommendations, developed for Béjaïa, also apply to similar urban fabrics along the Algerian and wider North African coast, where comparable measures could enhance outdoor thermal comfort and encourage walking. They involve, first, increasing shade by planting climate-appropriate deciduous trees and installing lightweight pergolas or tensile canopies along pedestrian routes; cooling surfaces by replacing dark asphalt or paving with light-colored, permeable, or high-albedo materials; preserving sea-breeze corridors through street layouts that remain open toward the waterfront and by controlling height-to-width ratios to maintain natural ventilation; and, finally, regularly introducing water and greenery, such as fountains, misting devices, or pocket gardens roughly every 100 m, to promote evaporation and provide cool resting spots for pedestrians.
Author Contributions
Conceptualization, Y.M., M.E.M. and S.A.; methodology, Y.M., M.E.M., A.A., W.A.M. and S.A.; software, Y.M.; validation, M.E.M., A.A. and S.A.; formal analysis, Y.M.; investigation, Y.M. and A.A.; resources, Y.M., A.A. and S.A.; data curation, Y.M.; writing—original draft preparation, Y.M.; writing—review and editing, Y.M., M.E.M., A.A., W.A.M. and S.A.; visualization, Y.M.; supervision, M.E.M., W.A.M. and S.A.; project administration, M.E.M. and S.A.; funding acquisition, Y.M., W.A.M. and S.A. All authors have read and agreed to the published version of the manuscript.
Funding
This research received no external funding.
Institutional Review Board Statement
This study did not require ethical approval from an Institutional Review Board (IRB) under the University of Liège regulations, as it is purely an observational, non-interventional study without the collection of identifiable personal data and relies solely on fully anonymized datasets. This exemption is in accordance with: Belgian Law of 7 May 2004 on experiments on the human person (which explicitly excludes purely observational studies from its scope), and EU Regulation 2016/679 (GDPR) principles on data anonymization (anonymous data being exempt). You may consult the official text of the Belgian Law of 7 May 2004 on the Federal e-Justice portal at: https://www.ejustice.just.fgov.be/eli/loi/2004/05/07/2004022376/moniteur. Accessed on 19 June 2025.
Informed Consent Statement
Informed consent was obtained from all subjects involved in the study.
Data Availability Statement
The data presented in this study are available on request from the corresponding author.
Conflicts of Interest
The authors declare no conflicts of interest.
Abbreviations
The following abbreviations are used in this manuscript:
| Symbol/Abbreviation | Definition | Unit |
| ASV | Actual sensation vote | [–] |
| dASV | Differential ASV—change in ASV between two successive points | [–] |
| WSV | Wind Sensation Vote—perceived wind intensity | [–] |
| WTC | Walking thermal comfort | [–] |
| Ta | Air temperature | [°C] |
| Ts | Surface temperature | [°C] |
| Va | Air velocity | [m/s] |
| RH | Relative humidity | [%] |
| ε | Emissivity | [–] |
| SVF | Sky view factor | [–] |
| H/W | Height-to-width ratio of an urban canyon | [–] |
| PET | Physiological equivalent temperature | [°C] |
| Tmrt | Mean Radiant Temperature | [°C] |
| CWI | Comfort Walkability Index | [–] |
| NDVI | Normalized Difference Vegetation Index | [–] |
| R2 | Coefficient of determination (regression model fit) | [–] |
| ρ (Spearman’s) | Spearman’s rank correlation coefficient | [–] |
| τᵦ (Kendall’s) | Kendall’s tau correlation coefficient | [–] |
| R | Statistical computing and data visualization software | [–] |
| OR | Odds Ratio | [–] |
| CI | Confidence Interval | [–] |
| OC | Old city zone (OC1, OC2) | [–] |
| LC | Lower city zone (LC1 to LC3) | [–] |
| OCI | Old city pedestrian itinerary (OCI1, OCI2) | [–] |
| LCI | Lower city pedestrian itinerary (LCI1 to LCI3) | [–] |
| PPSMVSS | Plan Permanent de Sauvegarde et de Mise en Valeur du Secteur Sauvegardé (Algerian urban heritage conservation plan) | [–] |
Appendix A. Information Regarding Temperature and Vegetation in the City of Béjaïa
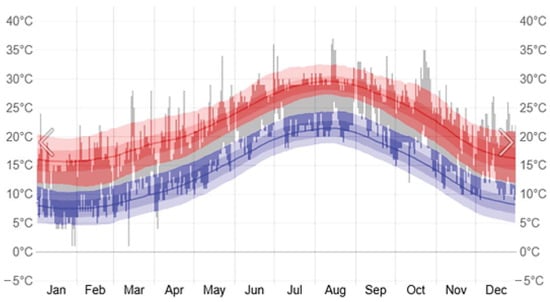
Figure A1.
Temperature history for 2022 in the city of Béjaïa. © WeatherSpark.com. The red area shows the typical range of daily high temperatures, the blue area indicates the typical range of daily low temperatures, and the gray line represents the average daily temperature.
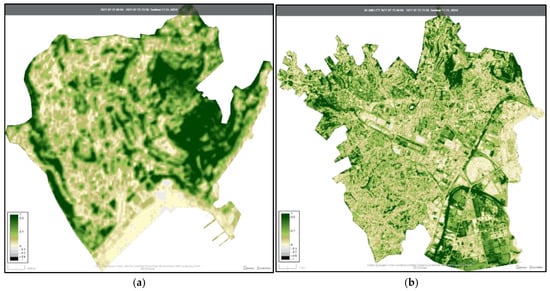
Figure A2.
NDVI maps for both parts of the city of Béjaïa for July 2022. (a) NDVI map of the old city of Béjaïa for July 2022. (b) NDVI map of the lower city of Béjaïa for July 2022. Maps were generated using Sentinel-2 satellite imagery. Processed by authors.
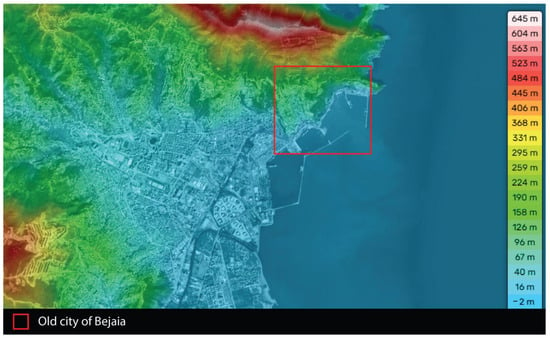
Figure A3.
Elevation map of the city of Béjaïa. Source: Esri Imagery. Processed by authors.
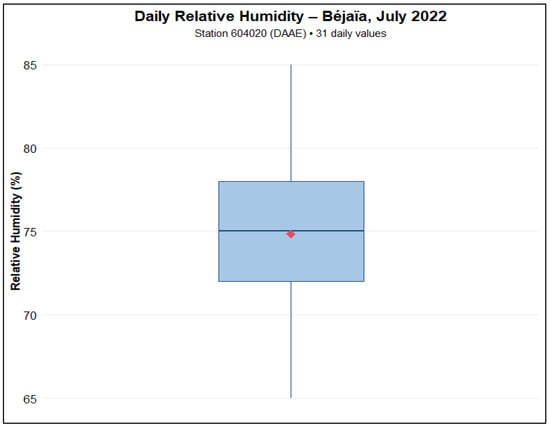
Figure A4.
Distribution of daily mean relative humidity (%) in Béjaïa during July 2022. Data reported by weather station 604020 (DAAE). Latitude 36.71° N, longitude 5.06° E, altitude 2 m. Figure created by authors.
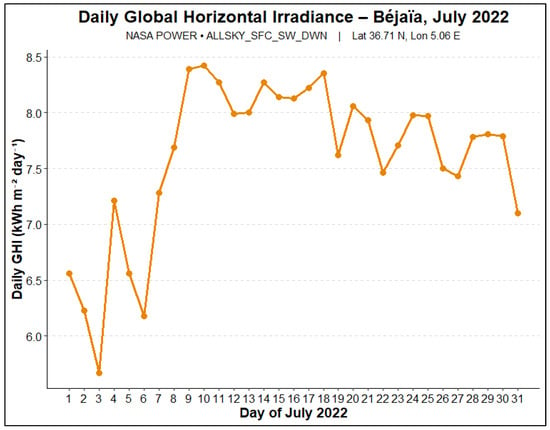
Figure A5.
Daily global horizontal irradiance (GHI) at Béjaïa during July 2022, derived from NASA POWER (parameter ALLSKY_SFC_SW_DWN; 36.71° N, 5.06° E). Figure prepared by authors.
Appendix B. Sky View Factor (SVF) Values for All Points Across the Five Urban Areas

Table A1.
Sky view factor (SVF) values for all points across five urban areas.
Table A1.
Sky view factor (SVF) values for all points across five urban areas.
| Point A | SVF A | Point B | SVF B | Point C | SVF C | Point D | SVF D | Point E | SVF E |
|---|---|---|---|---|---|---|---|---|---|
| A1 | 0.2 | B1 | 0.383 | C1 | 0.097 | D1 | 0.654 | E1 | 0.561 |
| A2 | 0.5 | B2 | 0.698 | C2 | 0.233 | D2 | 0.533 | E2 | 0.451 |
| A3 | 0.4 | B3 | 0.235 | C3 | 0.752 | D3 | 0.872 | E3 | 0.399 |
| A4 | 0.5 | B4 | 0.035 | C4 | 0.188 | D4 | 0.833 | E4 | 0.267 |
| A5 | 0.2 | B5 | 0.382 | C5 | 0.839 | D5 | 0.854 | E5 | 0.690 |
| A6 | 0.3 | B6 | 0.136 | C6 | 0.471 | — | — | — | — |
| A7 | 0.7 | B7 | 0.399 | C7 | 0.864 | — | — | — | — |
| A8 | 0.3 | B8 | 0.692 | — | — | — | — | — | — |
| A9 | 0.5 | B9 | 0.467 | — | — | — | — | — | — |
| A10 | 0.4 | B10 | 0.001 | — | — | — | — | — | — |
| A11 | 0.3 | B11 | 0.697 | — | — | — | — | — | — |
| A12 | 0.3 | — | — | — | — | — | — | — | — |
Appendix C. Methodology for Studying Mental Maps and an Example Created by a Pedestrian Participant

Figure A6.
Methodology used in this study of mental maps created by pedestrians at the end of each route.
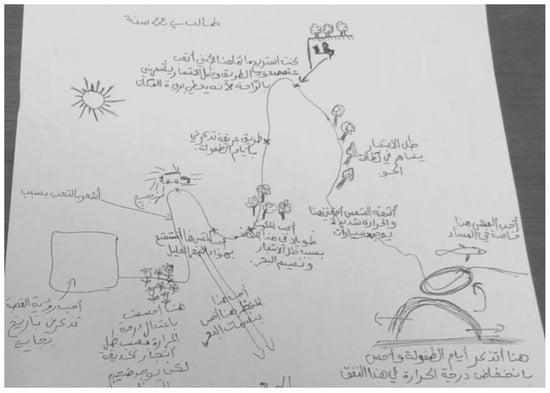
Figure A7.
Example of a mental map created by a 22-year-old student on OCI2 itinerary.
Appendix D. Details of the Participation Rates in the Study

Table A2.
Table of details on participation rates for each itinerary.
Table A2.
Table of details on participation rates for each itinerary.
| Zone/Itinerary | Number of Participants | Participants in Both Zones | Unique Participants for This Itinerary | % of Total Participants |
|---|---|---|---|---|
| Old City | ||||
| OCI1 | 16 | 13 | 3 | 22.9% |
| OCI2 | 15 | 12 | 3 | 21.4% |
| Total Old City | 31 | 25 | 6 | 44.3% |
| Lower City | ||||
| LCI1 | 15 | 11 | 4 | 21.4% |
| LCI2 | 13 | 9 | 4 | 18.6% |
| LCI3 | 11 | 5 | 6 | 15.7% |
| Total Lower City | 39 | 25 | 14 | 55.7% |
| Overall Total (Summer) | 70 | 25 | 20 | 100% |

Table A3.
Sociodemographic characteristics of survey participants.
Table A3.
Sociodemographic characteristics of survey participants.
| Category | Number of Participants | Percentage (%) |
|---|---|---|
| Total Participants | 70 | 100.0% |
| Gender | ||
| - Male | 44 | 62.9% |
| - Female | 26 | 37.1% |
| Age Group | ||
| - Under 18 | 10 | 14.3% |
| - 18–30 years | 24 | 34.3% |
| - 31–45 years | 19 | 27.1% |
| - 46–60 years | 14 | 20.0% |
| - Over 60 | 3 | 4.3% |
| Occupation | ||
| - Students | 36 | 51.4% |
| - Professionals | 24 | 34.3% |
| - Retirees | 5 | 7.1% |
| - Others | 5 | 7.1% |
| Status | ||
| - Local residents | 49 | 70.0% |
| - Domestic tourists | 17 | 24.3% |
| - International tourists | 4 | 5.7% |
Appendix E. Results of the Microclimatic Measurements for Each Itinerary
References
- Distefano, N.; Leonardi, S. Fostering Urban Walking: Strategies Focused on Pedestrian Satisfaction. Sustainability 2023, 15, 16649. [Google Scholar] [CrossRef]
- Kuşkapan, E.; Çodur, M.Y. Promoting Pedestrian Transportation to Reducing Air Pollution from Urban Transport. J. Environ. Earth Sci. 2022, 4, 47–53. [Google Scholar] [CrossRef]
- Mansouri, Y.; Attar, A. The Role of Walkability in Creating Sustainable Cities and Communities. Case of the City of Bejaia in Algeria. In Proceedings of the OIC Youth Scientific Congress, Kazan, Russia, 21–25 November 2022. [Google Scholar]
- World Health Organization. WHO Guidelines on Physical Activity and Sedentary Behaviour, 1st ed.; World Health Organization: Geneva, Switzerland, 2020; ISBN 978-92-4-001512-8. [Google Scholar]
- Westenhöfer, J.; Nouri, E.; Reschke, M.L.; Seebach, F.; Buchcik, J. Walkability and Urban Built Environments—A Systematic Review of Health Impact Assessments (HIA). BMC Public Health 2023, 23, 518. [Google Scholar] [CrossRef] [PubMed]
- Karolemeas, C.; Mitropoulos, L.; Koliou, K.; Tzamakos, D.; Stavropoulou, E.; Moschou, E.; Kepaptsoglou, K. A Systematic Literature Review on Health Benefits, Incentives, and Applications to Promote Walking in Urban Areas. Future Transp. 2023, 3, 1385–1400. [Google Scholar] [CrossRef]
- Ungvari, Z.; Fazekas-Pongor, V.; Csiszar, A.; Kunutsor, S.K. The Multifaceted Benefits of Walking for Healthy Aging: From Blue Zones to Molecular Mechanisms. GeroScience 2023, 45, 3211–3239. [Google Scholar] [CrossRef]
- Brouillard, M.; Calleja, E.; Gadaleta, T.; Lang, K. Walking Our Way to a Healthier Australia. Heart Lung Circ. 2024, 33, 144. [Google Scholar] [CrossRef]
- Forsyth, A. What Is a Walkable Place? The Walkability Debate in Urban Design. URBAN Des. Int. 2015, 20, 274–292. [Google Scholar] [CrossRef]
- Hajna, S.; Ross, N.A.; Brazeau, A.-S.; Bélisle, P.; Joseph, L.; Dasgupta, K. Associations between Neighbourhood Walkability and Daily Steps in Adults: A Systematic Review and Meta-Analysis. BMC Public Health 2015, 15, 768. [Google Scholar] [CrossRef]
- Mansouri, Y.; Attar, A. Walking as a Vector of Urban and Landscape Requalification, Focused on the Perception of Lived Spaces. In Proceedings of the 58th ISOCARP World Planning Congress, Brussels, Belgium, 3–6 October 2022. [Google Scholar]
- Tobin, M.; Hajna, S.; Orychock, K.; Ross, N.; DeVries, M.; Villeneuve, P.J.; Frank, L.D.; McCormack, G.R.; Wasfi, R.; Steinmetz-Wood, M.; et al. Rethinking Walkability and Developing a Conceptual Definition of Active Living Environments to Guide Research and Practice. BMC Public Health 2022, 22, 450. [Google Scholar] [CrossRef]
- Venerandi, A.; Mellen, H.; Romice, O.; Porta, S. Walkability Indices—The State of the Art and Future Directions: A Systematic Review. Sustainability 2024, 16, 6730. [Google Scholar] [CrossRef]
- Gao, W.; Qian, Y.; Chen, H.; Zhong, Z.; Zhou, M.; Aminpour, F. Assessment of Sidewalk Walkability: Integrating Objective and Subjective Measures of Identical Context-Based Sidewalk Features. Sustain. Cities Soc. 2022, 87, 104142. [Google Scholar] [CrossRef]
- Huang, X.; Zeng, L.; Liang, H.; Li, D.; Yang, X.; Zhang, B. Comprehensive Walkability Assessment of Urban Pedestrian Environments Using Big Data and Deep Learning Techniques. Sci. Rep. 2024, 14, 26993. [Google Scholar] [CrossRef] [PubMed]
- Chiang, Y.-C.; Lei, H.-Y. Using Expert Decision-Making to Establish Indicators of Urban Friendliness for Walking Environments: A Multidisciplinary Assessment. Int. J. Health Geogr. 2016, 15, 40. [Google Scholar] [CrossRef] [PubMed]
- Poklewski-Koziełł, D.; Dudzic-Gyurkovich, K.; Duarte, C.M. Investigating Urban Form, and Walkability Measures in the New Developments. The Case Study of Garnizon in Gdansk. Land Use Policy 2023, 125, 106471. [Google Scholar] [CrossRef]
- Labdaoui, K.; Mazouz, S.; Acidi, A.; Cools, M.; Moeinaddini, M.; Teller, J. Utilizing Thermal Comfort and Walking Facilities to Propose a Comfort Walkability Index (CWI) at the Neighbourhood Level. Build. Environ. 2021, 193, 107627. [Google Scholar] [CrossRef]
- Fanger, P.O. Thermal Comfort: Analysis and Applications in Environmental Engineering; McGraw-Hill: New York, NY, USA, 1970. [Google Scholar]
- Liu, Z.; Li, J.; Xi, T. A Review of Thermal Comfort Evaluation and Improvement in Urban Outdoor Spaces. Buildings 2023, 13, 3050. [Google Scholar] [CrossRef]
- Boumaraf, H.; Amireche, L. Microclimatic Quality of Urban Routes and Pedestrian Behavior in Arid Zones Case of the City of Biskra, South-East Algeria. Front. Eng. Built Environ. 2023, 3, 93–107. [Google Scholar] [CrossRef]
- Muslimin, R.; Brasier, N. An Analysis of Outdoor Thermal Comfort Impact on Pedestrian Walking Patterns at Sub-Hour Timescales with Agent-Based Modelling. Smart Sustain. Built Environ. 2024. ahead of print. [Google Scholar] [CrossRef]
- Krüger, E.L.; Minella, F.O.; Rasia, F. Impact of Urban Geometry on Outdoor Thermal Comfort and Air Quality from Field Measurements in Curitiba, Brazil. Build. Environ. 2011, 46, 621–634. [Google Scholar] [CrossRef]
- Qaoud, R.; Adel, B.; Sayad, B.; Alkama, D.; Attia, S. Assessing the Influence of Neighborhood Urban Form on Outdoor Thermal Conditions in the Hot Dry City of Biskra, Algeria. Ain Shams Eng. J. 2023, 14, 102525. [Google Scholar] [CrossRef]
- Guo, F.; Luo, M.; Zhang, C.; Cai, J.; Zhang, X.; Zhang, H.; Dong, J. The Mechanism of Street Spatial Form on Thermal Comfort from Urban Morphology and Human-Centered Perspectives: A Study Based on Multi-Source Data. Buildings 2024, 14, 3253. [Google Scholar] [CrossRef]
- Sharmin, T.; Steemers, K.; Matzarakis, A. Microclimatic Modelling in Assessing the Impact of Urban Geometry on Urban Thermal Environment. Sustain. Cities Soc. 2017, 34, 293–308. [Google Scholar] [CrossRef]
- Lau, T.-K.; Lin, T.-P. Lowering the Difficulty of Mesoscale Sky View Factor Mapping Using Satellite Products. Remote Sens. Appl. Soc. Environ. 2024, 34, 101174. [Google Scholar] [CrossRef]
- Nikolopoulou, M. Designing Open Spaces in the Urban Environment: A Bioclimatic Approach; Centre for Renewable Energy Sources, EESD, FP5: Attica, Greece, 2004; ISBN 960-86907-2-2. [Google Scholar]
- Elnabawi, M.H.; Hamza, N.; Dudek, S. Thermal Perception of Outdoor Urban Spaces in the Hot Arid Region of Cairo, Egypt. Sustain. Cities Soc. 2016, 22, 136–145. [Google Scholar] [CrossRef]
- Liu, Z.; Yao, Z.; Wang, R. Evaluating the Surface Temperature and Vegetation Index (Ts/VI) Method for Estimating Surface Soil Moisture in Heterogeneous Regions. Hydrol. Res. 2018, 49, 689–699. [Google Scholar] [CrossRef]
- Salvati, A.; Kolokotroni, M.; Kotopouleas, A.; Watkins, R.; Giridharan, R.; Nikolopoulou, M. Impact of Reflective Materials on Urban Canyon Albedo, Outdoor and Indoor Microclimates. Build. Environ. 2022, 207, 108459. [Google Scholar] [CrossRef]
- Lopez-Cabeza, V.P.; Alzate-Gaviria, S.; Diz-Mellado, E.; Rivera-Gomez, C.; Galan-Marin, C. Albedo Influence on the Microclimate and Thermal Comfort of Courtyards under Mediterranean Hot Summer Climate Conditions. Sustain. Cities Soc. 2022, 81, 103872. [Google Scholar] [CrossRef]
- Lindner-Cendrowska, K.; Kuchcik, M. The Impact of Wind Speed Measurement Method on MRT and PET Values in Limited Air Flow Conditions on Warm, Sunny Days. Int. J. Biometeorol. 2024, 68, 807–810. [Google Scholar] [CrossRef]
- Shooshtarian, S.; Rajagopalan, P. Perception of Wind in Open Spaces. Climate 2019, 7, 106. [Google Scholar] [CrossRef]
- Watanabe, H.; Sugi, T.; Saito, K.; Nagashima, K. Mechanism Underlying the Influence of Humidity on Thermal Comfort and Stress under Mimicked Working Conditions. Physiol. Behav. 2024, 285, 114653. [Google Scholar] [CrossRef]
- Middel, A.; Selover, N.; Hagen, B.; Chhetri, N. Impact of Shade on Outdoor Thermal Comfort—A Seasonal Field Study in Tempe, Arizona. Int. J. Biometeorol. 2016, 60, 1849–1861. [Google Scholar] [CrossRef] [PubMed]
- Chapman, S.; Thatcher, M.; Salazar, A.; Watson, J.E.M.; McAlpine, C.A. The Effect of Urban Density and Vegetation Cover on the Heat Island of a Subtropical City. J. Appl. Meteorol. Climatol. 2018, 57, 2531–2550. [Google Scholar] [CrossRef]
- Weng, Q.; Liu, H.; Lu, D. Assessing the Effects of Land Use and Land Cover Patterns on Thermal Conditions Using Landscape Metrics in City of Indianapolis, United States. Urban Ecosyst. 2007, 10, 203–219. [Google Scholar] [CrossRef]
- Zhao, Q.; Sailor, D.J.; Wentz, E.A. Impact of Tree Locations and Arrangements on Outdoor Microclimates and Human Thermal Comfort in an Urban Residential Environment. Urban For. Urban Green. 2018, 32, 81–91. [Google Scholar] [CrossRef]
- Arrar, F.H.; Kaoula, D.; Matallah, M.E.; Abdessemed-Foufa, A.; Taleghani, M.; Attia, S. Quantification of Outdoor Thermal Comfort Levels under Sea Breeze in the Historical City Fabric: The Case of Algiers Casbah. Atmosphere 2022, 13, 575. [Google Scholar] [CrossRef]
- Ali-Toudert, F.; Mayer, H. Numerical Study on the Effects of Aspect Ratio and Orientation of an Urban Street Canyon on Outdoor Thermal Comfort in Hot and Dry Climate. Build. Environ. 2006, 41, 94–108. [Google Scholar] [CrossRef]
- Ali Smail, S.; Zemmouri, N.; Djenane, M.; Nikolopoulou, M. Investigating the Transient Conditions of “Sabat” Space and Its Influence on Pedestrian Sensations during Thermal Walks. Algiers’ Casbah Case Study. Build. Environ. 2024, 261, 111760. [Google Scholar] [CrossRef]
- Vasilikou, C.; Nikolopoulou, M. Outdoor Thermal Comfort for Pedestrians in Movement: Thermal Walks in Complex Urban Morphology. Int. J. Biometeorol. 2020, 64, 277–291. [Google Scholar] [CrossRef]
- Boumezoued, S.; Bada, Y.; Bougdah, H. Pedestrian Itinerary Choice: Between Multi-Sensory, Affective and Syntactic Aspects of the Street Pattern in the Historic Quarter of Bejaia, Algeria. Int. Rev. Spat. Plan. Sustain. Dev. 2020, 8, 91–108. [Google Scholar] [CrossRef]
- Ikni, K.; Debache-Benzagouta, S.; Woloszyn, P. La Chronotopie Du Paysage Sonore Urbain Des Places Publiques: Le Cas de La Place 1er Novembre 1954 à Béjaïa (Algérie). Cybergeo: European Journal of Geography. Environnement Nature Paysage, Document 942. Available online: http://journals.openedition.org/cybergeo/34704 (accessed on 15 January 2022). [CrossRef]
- Bouaifel, K.; Madani, S. Urban landscape and sensitive dimension. The Case of the old city of Béjaia, Algeria. Bull. Société Géographique Liège 2021, 77, 45–67. [Google Scholar] [CrossRef]
- Caillart, E.; Cusenier, P.; Bazizi, K. Pour la Sauvegarde et la Mise en Valeur de la Médina de Béjaïa 2004. Available online: https://whc.unesco.org/fr/activites/769/ (accessed on 11 January 2022).
- Salvator, L. Bougie, la Perle de l’Afrique du Nord; Jambert, V., Translator; L’Harmattan: Paris, France, 1999. [Google Scholar]
- Mansouri, Y.; Stefàno, D. The Perception of Mediterranean Cities through Walking. The Landscape of Béjaïa in Algeria and Loulé in Portugal. In Proceedings of the International Conference on Changing Cities VI: Spatial, Design, Landscape, Heritage & Socio-economic Dimensions, Rhodes Island, Greece, 24–28 June 2024. [Google Scholar]
- Bardin, L. Le texte et l’image. Commun. Lang. 1975, 26, 98–112. [Google Scholar] [CrossRef]
- Mucchielli, R. L’Analyse de Contenu des Documents et des Communications; ESF Éditeur: Paris, France, 1974; ISBN 978-2-7101-3719-1. [Google Scholar]
- ISO 7726:1998; Ergonomics of the Thermal Environment—Instruments for Measuring Physical Quantities. International Organization for Standardization: Geneva, Switzerland, 1998.
- World Meteorological Organization Guide to Instruments and Methods of Observation; WMO-No. 8; World Meteorological Organization: Geneva, Switzerland, 2018.
- Matallah, M.E.; Alkama, D.; Ahriz, A.; Attia, S. Assessment of the Outdoor Thermal Comfort in Oases Settlements. Atmosphere 2020, 11, 185. [Google Scholar] [CrossRef]
- Matzarakis, A.; Graw, K. Human Bioclimate Analysis for the Paris Olympic Games. Atmosphere 2022, 13, 269. [Google Scholar] [CrossRef]
- Matzarakis, A.; Gangwisch, M.; Fröhlich, D. RayMan and SkyHelios Model. In Urban Microclimate Modelling for Comfort and Energy Studies; Palme, M., Salvati, A., Eds.; Springer International Publishing: Cham, Switzerland, 2021; pp. 339–361. ISBN 978-3-030-65420-7. [Google Scholar]
- Matzarakis, A.; Laschewski, G.; Muthers, S. The Heat Health Warning System in Germany—Application and Warnings for 2005 to 2019. Atmosphere 2020, 11, 170. [Google Scholar] [CrossRef]
- Fröhlich, D.; Gangwisch, M.; Matzarakis, A. Effect of Radiation and Wind on Thermal Comfort in Urban Environments—Application of the RayMan and SkyHelios Model. Urban Clim. 2019, 27, 1–7. [Google Scholar] [CrossRef]
- Matzarakis, A. Comments about Urban Bioclimate Aspects for Consideration in Urban Climate and Planning Issues in the Era of Climate Change. Atmosphere 2021, 12, 546. [Google Scholar] [CrossRef]
- Matzarakis, A.; Fröhlich, D. Influence of Urban Green on Human Thermal Bioclimate—Application of Thermal Indices and Micro-Scale Models. Acta Hortic. 2018, 1215, 1–10. [Google Scholar] [CrossRef]
- Matzarakis, A.; Rutz, F.; Mayer, H. Modelling Radiation Fluxes in Simple and Complex Environments: Basics of the RayMan Model. Int. J. Biometeorol. 2010, 54, 131–139. [Google Scholar] [CrossRef]
- Matzarakis, A.; Rutz, F.; Mayer, H. Modelling Radiation Fluxes in Simple and Complex Environments—Application of the RayMan Model. Int. J. Biometeorol. 2007, 51, 323–334. [Google Scholar] [CrossRef]
- Vallejo-Borda, J.A.; Cantillo, V.; Rodriguez-Valencia, A. A Perception-Based Cognitive Map of the Pedestrian Perceived Quality of Service on Urban Sidewalks. Transp. Res. Part F Traffic Psychol. Behav. 2020, 73, 107–118. [Google Scholar] [CrossRef]
- Huguenin-Richard, F.; Cloutier, M.-S. Mesure du Potentiel de Marche et de l’accessibilité dans les Espaces Urbains pour les Piétons Âgés. Flux 2021, 123, 30–53. [Google Scholar] [CrossRef]
- Limna, P. The Impact of NVivo in Qualitative Research: Perspectives from Graduate Students. J. Appl. Learn. Teach. 2023, 6, 6.2.17. [Google Scholar] [CrossRef]
- ISO 20252:2019; Market, Opinion and Social Research, Including Insights and Data Analytics—Vocabulary and Service Requirements. International Organization for Standardization: Geneva, Switzerland, 2019.
- Kuo, C.-Y.; Wang, R.-J.; Lin, Y.-P.; Lai, C.-M. Urban Design with the Wind: Pedestrian-Level Wind Field in the Street Canyons Downstream of Parallel High-Rise Buildings. Energies 2020, 13, 2827. [Google Scholar] [CrossRef]
- Adamek, K.; Vasan, N.; Elshaer, A.; English, E.; Bitsuamlak, G. Pedestrian Level Wind Assessment through City Development: A Study of the Financial District in Toronto. Sustain. Cities Soc. 2017, 35, 178–190. [Google Scholar] [CrossRef]
- Wang, R.; Liu, Y. A Long Sequence Urban Block Wind Speed Prediction and Wind-Induced Pedestrian Risk Analysis Method. In Proceedings of the IEEE 2024 3rd International Conference on Artificial Intelligence, Internet of Things and Cloud Computing Technology (AIoTC), Wuhan, China, 13 September 2024; pp. 248–251. [Google Scholar]
- Wu, B.; Zhang, Y.; Wang, Y.; He, Y.; Wang, J.; Wu, Y.; Lin, X.; Wu, S. Mitigation of Urban Heat Island in China (2000–2020) through Vegetation-Induced Cooling. Sustain. Cities Soc. 2024, 112, 105599. [Google Scholar] [CrossRef]
- Calhoun, Z.D.; Willard, F.; Ge, C.; Rodriguez, C.; Bergin, M.; Carlson, D. Estimating the Effects of Vegetation and Increased Albedo on the Urban Heat Island Effect with Spatial Causal Inference. Sci. Rep. 2024, 14, 540. [Google Scholar] [CrossRef]
- Schlaerth, H.L.; Silva, S.J.; Li, Y.; Li, D. Albedo as a Competing Warming Effect of Urban Greening. J. Geophys. Res. Atmospheres 2023, 128, e2023JD038764. [Google Scholar] [CrossRef]
- Wei, R.; Yan, J.; Cui, Y.; Song, D.; Yin, X.; Sun, N. Studies on the Specificity of Outdoor Thermal Comfort during the Warm Season in High-Density Urban Areas. Buildings 2023, 13, 2473. [Google Scholar] [CrossRef]
- Lau, K.K.-L.; Choi, C.Y. The Influence of Perceived Aesthetic and Acoustic Quality on Outdoor Thermal Comfort in Urban Environment. Build. Environ. 2021, 206, 108333. [Google Scholar] [CrossRef]
- Guergour, H.; Cheraitia, M.; Dechaicha, A.; Alkama, D. Optimization of Urban Morphology to Enhance Outdoor Thermal Comfort: A Microclimate Analysis. J. Bulg. Geogr. Soc. 2024, 51, 107–130. [Google Scholar] [CrossRef]
- Salmanian, M.; Mousavi, M.; Nasirimehr, P.; Takhmiri, H.; Binti Ujang, N.; Fairuz Shahidan, M.; Binti Dahlan, N.D. Examining the influence of urban form on the thermal comfort of street canyons in tehran: A case study of narmak neighbourhood. J. Archit. Plan. Constr. Manag. 2024, 14. [Google Scholar] [CrossRef]
- Diz-Mellado, E.; López-Cabeza, V.P.; Roa-Fernández, J.; Rivera-Gómez, C.; Galán-Marín, C. Energy-Saving and Thermal Comfort Potential of Vernacular Urban Block Porosity Shading. Sustain. Cities Soc. 2023, 89, 104325. [Google Scholar] [CrossRef]
- Siani, R.; De Luca, F.; Gherri, B. Improving Climate Adaptation of Urban Spaces in Historical Contexts Through Shading Structures—A Case Study of Integration of Research and Student Work in Italy. In Blucher Design Proceedings; Editora Blucher: Punta del Este, Uruguay, 2024; pp. 82–93. [Google Scholar]
- Behzad, Z.; Guilandoust, A. Enhancing Outdoor Thermal Comfort in a Historic Site in a Hot Dry Climate (Case Study: Naghsh-e-Jahan Square, Isfahan). Sustain. Cities Soc. 2024, 102, 105209. [Google Scholar] [CrossRef]
- Gehl, J. Life Between Buildings: Using Public Space; Island Press: Washington, DC, USA, 2011; ISBN 978-1-59726-827-1. [Google Scholar]
- Bowler, D.E.; Buyung-Ali, L.M.; Knight, T.M.; Pullin, A.S. A Systematic Review of Evidence for the Added Benefits to Health of Exposure to Natural Environments. BMC Public Health 2010, 10, 456. [Google Scholar] [CrossRef]
- Ji, W.; Cao, B.; Luo, M.; Zhu, Y. Influence of Short-Term Thermal Experience on Thermal Comfort Evaluations: A Climate Chamber Experiment. Build. Environ. 2017, 114, 246–256. [Google Scholar] [CrossRef]
- Lau, K.K.-L.; Shi, Y.; Ng, E.Y.-Y. Dynamic Response of Pedestrian Thermal Comfort under Outdoor Transient Conditions. Int. J. Biometeorol. 2019, 63, 979–989. [Google Scholar] [CrossRef]
- Jiang, Y.; Liu, D.; Ren, L.; Grekousis, G.; Lu, Y. Tree Abundance, Species Richness, or Species Mix? Exploring the Relationship between Features of Urban Street Trees and Pedestrian Volume in Jinan, China. Urban For. Urban Green. 2024, 95, 128294. [Google Scholar] [CrossRef]
- Norton, B.A.; Mears, M.; Warren, P.H.; Siriwardena, G.M.; Plummer, K.E.; Turner, T.; Hancock, S.; Grafius, D.R.; Evans, K.L. Biodiversity and Environmental Stressors along Urban Walking Routes. Urban For. Urban Green. 2023, 85, 127951. [Google Scholar] [CrossRef]
- Janeczko, E.; Czyżyk, K.; Korcz, N.; Woźnicka, M.; Bielinis, E. The Psychological Effects and Benefits of Using Green Spaces in the City: A Field Experiment with Young Polish Adults. Forests 2023, 14, 497. [Google Scholar] [CrossRef]
- Rathnayke, S.; Amofah, S. Health and Wellbeing Implications of Urban Green Exposure on Young Adults in a European City. J. Adv. Res. Soc. Sci. 2023, 6, 53–70. [Google Scholar] [CrossRef]
Disclaimer/Publisher’s Note: The statements, opinions and data contained in all publications are solely those of the individual author(s) and contributor(s) and not of MDPI and/or the editor(s). MDPI and/or the editor(s) disclaim responsibility for any injury to people or property resulting from any ideas, methods, instructions or products referred to in the content. |
© 2025 by the authors. Licensee MDPI, Basel, Switzerland. This article is an open access article distributed under the terms and conditions of the Creative Commons Attribution (CC BY) license (https://creativecommons.org/licenses/by/4.0/).