Article

Core–Periphery Dynamics and Spatial Inequalities in the African Context: A Case Study of Greater Casablanca

1
School of Architecture, Planning & Design (SAP + D), Mohammed VI Polytechnic University, UM6P, Benguerir 43150, Morocco
2
College of Chemical Sciences and Engineering (CCSE), African Research Center on Air Quality and Climate (ARC Air), Mohammed VI Polytechnic University, UM6P, Benguerir 43150, Morocco
*
Authors to whom correspondence should be addressed.
Urban Sci. 2025, 9(10), 420; https://doi.org/10.3390/urbansci9100420 (registering DOI)
Submission received: 19 August 2025 / Revised: 2 October 2025 / Accepted: 6 October 2025 / Published: 11 October 2025

Abstract

Greater Casablanca, one of Africa’s largest metropolitan regions, is undergoing significant spatial and demographic transformation. Yet, the underlying patterns of these dynamics remain poorly understood. This study investigates population dynamics and spatial inequalities in Greater Casablanca between 2014 and 2024. The analysis combines geospatial data, regression modeling, and clustering techniques to explore the interplay between demographic change, housing affordability, public-transport accessibility, and economic activity, providing a data-driven perspective on how these factors shape spatial inequalities and the region’s urban development trajectory. The results reveal a clear core–periphery divide. The central prefecture has lost population despite continued land consumption, while peripheral communes have experienced rapid demographic and economic expansion. This growth is strongly associated with affordable housing and high rates of new-firm formation, but it occurs where transport access remains weakest. Cluster analysis identifies four socio-spatial types, ranging from a shrinking but well-served core to fast-growing, poorly connected peripheries. The study underscores the need for integrated policy interventions to improve transport connectivity, implement inclusive housing strategies, and manage economic decentralization in ways that foster balanced and sustainable metropolitan development. By situating Greater Casablanca’s trajectory within global urbanization debates, this research extends core–periphery and shrinking-city frameworks to a North African context and provides evidence-based insights to support progress towards Sustainable Development Goal 11.

1. Introduction

Urbanization is often described as a story of continuous growth: in 2020, more than 56% of the world’s population lived in urban areas, and this proportion is projected to rise to nearly 70% by mid-century [1]. Yet, alongside this expansion, a contrasting dynamic has emerged. An increasing number of cities across the world are experiencing long-term population decline, a process now widely described as urban shrinkage, challenging the assumption that urban development is synonymous with continuous growth [2]. Satellite analyses estimate that the proportion of shrinking cities worldwide increased from 9% in the 1990s to over 25% by the late 2010s and could reach nearly 40% by 2050 [3].
This global paradox is now evident in Greater Casablanca, Morocco’s largest metropolitan region and economic hub. Recent census data indicate a population decline in the Casablanca prefecture, even as surrounding provinces experience rapid demographic and economic growth [4]. Understanding these divergent trends is essential for informing policies aligned with Sustainable Development Goal 11, which aims to make cities inclusive, safe, resilient, and sustainable.
Research from diverse international contexts has identified a set of recurring mechanisms that underpin urban shrinkage. For instance, Detroit, USA, experienced a dramatic population decline from 1.85 million residents in 1950 to around 639,000 in 2020, driven by deindustrialization and economic stagnation, leading to widespread urban decay and vacant properties. Similarly, Leipzig, Germany, suffered substantial population loss after German reunification due to industrial decline and suburbanization, although recent regeneration efforts have partially reversed this trend [5]. In Osaka, Japan, economic decline and an aging population have contributed to sustained population shrinkage since the 1970s [2]. Moreover, housing market dynamics, particularly rising central-city land prices and worsening affordability, have displaced residents toward more affordable suburban and peripheral zones, a trend well documented in European cities such as Berlin and London where housing prices significantly influence residential mobility [5]. This issue particularly affects specific demographic groups, such as families, who frequently move to suburban or less densely populated areas in search of affordable living spaces [5]. These patterns are further reinforced by improvements in transport accessibility, particularly road infrastructure. In U.S. cities, for example, Baum-Snow (2007) found that each additional highway constructed between 1950 and 1990 was associated with an 18% decline in central city population [6]. Similarly, García-López et al. (2024), examining 579 European cities, demonstrate that increased road-based transport accessibility contributed to a significant shift in population away from urban cores toward peripheral areas [7].
These dynamics are well captured by two complementary theoretical perspectives. Core–periphery theory and models of suburbanization explain how economic restructuring, land-use policies, and housing-market pressures drive population and investment away from dense, high-cost cores toward more affordable peripheral zones [8,9,10]. This shift is reinforced by transport improvements and planning strategies that enable decentralization. In turn, the concept of spatial justice, rooted in Lefebvre’s (1968) “right to the city” and elaborated by Soja (2010), emphasizes how uneven access to housing, mobility, and services reflects and reproduces socio-spatial inequalities [11,12]. From this perspective, urban shrinkage is not only demographic but also a relational and political process in which economic restructuring, mobility systems, and land markets interact to reshape metropolitan space and generate new inequalities [2,13].
While the evidence base on shrinking cities has expanded rapidly, it remains heavily weighted toward the Global North. Only recently have studies begun to document similar patterns in the Global South, for example, in Chinese cities [3,14] and in Morocco’s mining towns and some urban cores [15], and, to our knowledge, no metropolitan-scale analysis has examined the contrasting trajectories of core decline and peripheral growth in Greater Casablanca. Another key limitation in existing literature is the underutilization of advanced spatial analysis tools and machine learning methods, which have the potential to uncover hidden patterns and spatial structures in metropolitan areas. Techniques such as k-means clustering and GIS-based spatial modeling have proven effective in analyzing complex urban dynamics, especially in identifying socio-economic inequalities and infrastructure gaps. K-means clustering has been applied to detect urban sprawl by analyzing population density and spatial entropy, providing valuable insights into uncontrolled urban expansion [16]. Similarly, GIS-based spatial modeling has played a significant role in urban studies [17]. A systematic review highlighted the growing use of GIS in analyzing urban disparities, particularly in identifying and visualizing spatial inequalities. However, the review also noted that most GIS-based research focuses on accessibility analysis, while more comprehensive geospatial studies remain limited [18]. These examples underscore the potential of advanced methodologies to uncover socio-spatial inequalities and support evidence-based interventions.
This study addresses these gaps by analyzing the population dynamics and spatial inequalities of the communes of Greater Casablanca through a multi-method approach that integrates remote sensing, spatial statistics, spatial regression and k-means clustering. Guided by the conceptual lenses of core–periphery dynamics and spatial justice, the analysis tackles two interrelated research questions:
Q1—How do housing affordability, public-transport accessibility and local economic activity shape the emerging spatial structure of the Greater Casablanca metropolitan area?
Q2—What distinct types of communes can be identified through a data-driven typology derived from k-means clustering, and how do these types reflect the metropolitan core–periphery divide and associated spatial inequalities?
From these questions we derive the following hypotheses:
H1—Communes with relatively affordable housing experience higher rates of population growth than communes with higher housing costs.
H2—Peripheral communes exhibit higher rates of firm formation, yet lower public-transport accessibility compared with the metropolitan core.
By combining fine-grained demographic and socio-economic data with geospatial and statistical analysis, this paper extends the shrinking-city debate to North Africa and provides empirical evidence on how housing markets, transport networks and economic restructuring interact to produce core decline and peripheral expansion. It thus contributes both to comparative urban scholarship and to the policy agenda of building inclusive and sustainable metropolitan regions.

2. Methodology

2.1. Study Area

Greater Casablanca (Figure 1) is one of North Africa’s largest urban agglomerations, home to over 4.7 million residents in 2024 and covering 1615 km2 [19]. It is the largest economic center in Morocco, contributing nearly one-third of the national GDP and hosting 14.83% of the country’s economic establishments [4]. The public transport network in this region consists of a multi-modal system designed to serve the growing population and urban sprawl. It includes tram lines with ongoing expansions, a metropolitan bus network, and shared transport services such as Grand Taxis [20]. The housing sector is characterized by a mix of modern and traditional Moroccan-style residences, with 29.7% of households renting and over 66% owning their homes [4]. This combination of high population density, economic weight and rapid spatial change makes Greater Casablanca an exemplary case for analyzing metropolitan restructuring and the emergence of spatial inequalities in the Global South.

2.2. Data Sources

The data used in this study comes from a combination of remote-sensing products, geospatial layers, and official statistics (Table 1).

2.3. Methods

This study used an integrative quantitative methodology to examine the metropolitan transformation of Greater Casablanca between 2014 and 2024. We combined official statistics, remote-sensing products and geospatial data to construct four indicators capturing complementary dimensions of urban change: sustainable urbanization (SDG 11.3.1), housing affordability (Price-to-Income Ratio), public transport accessibility (SDG 11.2.1) and economic vitality (New Firm Formation Rate). After harmonizing temporal coverage and normalizing the indicators, we conducted exploratory Spearman correlation to describe bivariate relationships and check multicollinearity. We then estimated ordinary least squares (OLS) models of annualized population change to test hypotheses on the links between affordability, accessibility and economic activity. Finally, k-means clustering identified multidimensional spatial typologies, providing an empirical basis for interpreting the coexistence of central-city decline and peripheral expansion.
(1)
Computation of Indicators
  • Sustainable urbanization: SDG 11.3.1
Sustainable urbanization was assessed through the Land-Consumption-Rate to Population-Growth-Rate ratio (LCRPGR), the official indicator for SDG 11.3.1. This metric evaluates the balance between land consumption and population growth, thereby offering valuable insights into land-use efficiency. Following UN guidelines [23], the land-consumption rate (LCR) and the population-growth rate (PGR) were computed as average annual log rates:
P G R   = L N P o p t + n / P o p t T
L C R = L N ( U r B U t + n /   U r B U t ) T
where  P o p t + n   a n d   P o p t  are the populations in 2024 and 2014, respectively.  U r B U t + n   a n d   U r B U t  are the built-up areas in 2024 and 2014, respectively, and  T  is the number of years between two measurement periods (2024–2014).
The SDG indicator LCRPGR is the ratio:
L C R P G R = L C R P G R
  • Housing Affordability: Price-to-Income Ratio (PIR)
Housing affordability is a crucial component of social and economic well-being, directly tied to SDG 11.1, which aims to ensure universal access to adequate, safe, and affordable housing by 2030. Among the various affordability metrics, the Price-to-Income Ratio (PIR) is widely accepted for its simplicity and comparability [24,25]. It measures the number of years of gross annual household income required to purchase a median-priced home, without taking into account variations in access to housing finance or financing terms [24,26]. In this, we used the ratio of the average housing price to the average annual household income to calculate the PIR (Equation (4)) [24,26].
P I R = a v e r a g e   h o u s i n g   p r i c e a v e r a g e   a n n u a l   h o u s e h o l d   i n c o m e  
Housing prices were obtained from real estate price references and aggregated at the commune level. The average housing price was estimated by multiplying the average price per square meter by a standardized housing unit size of 80 m2, aligning with local standards and UN-Habitat guidelines for adequate housing space. For Morocco, where the average household consists of four individuals, this size reflects both private living space per person and necessary shared areas. The average annual household income was set at 91,933 MAD (Moroccan Dirham), based on data from the High Commission for Planning [4]
  • Economic vitality: New Firm Formation Rate (NFFR)
The New Firm Formation Rate (NFFR) is used as the primary economic indicator to assess the spatial and temporal dynamics of economic activity in Greater Casablanca. Widely applied in regional economic studies, NFFR serves as an indicator of economic vitality and entrepreneurial activity [27]. This metric is measured by the number of new firms created between 2010 and 2024 divided by the stock of existing firms at the start of the period, expressed as an average annual rate [27]:
N F F R = N F t 14   E F t n 100
where  N F t  represents the Number of new Firms during the period and  E F t n  represents the Number of Existing firms at the start of the period.
  • Public Transport Accessibility: SDG 11.2
Public transport accessibility is evaluated in alignment with SDG 11.2, which emphasizes universal access to safe, affordable, and sustainable transport systems. A network-based accessibility analysis was conducted using road network data and public transport stops, which were pre-processed to ensure topological accuracy and spatial consistency. A network dataset was then built to model real-world pedestrian accessibility using shortest path algorithms, ensuring that the analysis reflected realistic travel paths rather than simple Euclidean distances [28]. To quantify accessibility, service area analysis was performed, delineating zones within different distance to public transport stops. Population data was overlaid onto these service areas to compute the proportion of residents with adequate transport access using Equation (6) [28]:
A d = i S ( d ) P i i T P i
where  A d  represents the proportion of the population within a given distance  d , and  P i  represents the population at location  i S ( d )  is the set of locations within the threshold distance  d , and  T  denotes the total population in the study area.
(2)
Data harmonization and normalization
All growth measures were annualized for temporal comparability. Variables were then scaled to the [0, 1] range using min–max normalization, to prevent scale-driven bias in subsequent analyses.
N o r m a l i z e d   I n d i c a t o r = X X m i n X m a x X m i n
where  X  is the original value of the indicator for a given commune, and  X m i n  and  X m a x   are the minimum and maximum values across all communes.
(3)
Exploratory analysis
As an initial descriptive step, we calculated pairwise Spearman rank correlation among the variables. Spearman’s correlation was chosen because some variables violate normality assumptions (Supplementary Table S1) [29]. We used the correlation matrix to inspect pairwise associations and to screen for potential multicollinearity. These correlation diagnostics are descriptive; the hypotheses were tested in subsequent regression modeling.
(4)
Regression analysis
In addition to the descriptive analysis, we estimated multiple linear regressions to quantify how local economic activity, transport accessibility, housing affordability and spatial location shape commune-level population growth in Greater Casablanca. The ordinary least squares (OLS) regression was used to analyze the relationship between population growth and key variables.
We grounded the modeling approach in urban economic theory and empirical studies of metropolitan restructuring [30,31,32]. Six models were specified: a baseline with all predictors; a reduced affordability model; a firm-formation and public-transport model; a statistically streamlined model retaining only significant variables; an interaction model; and a core–periphery dummy model (detailed specifications are presented in the result section.).
The interaction specification was motivated by evidence that urban processes are rarely uniform across space and may vary according to distance from the core [33,34]. We therefore included multiplicative terms between distance to Casablanca central business district (CBD) and the main predictors (new-firm formation, public-transport access, and housing affordability) to test whether their effects differ between center and periphery. Such interaction-based approaches are widely used in the Global North and increasingly in Global South cities to reveal non-linear or spatially contingent urban dynamics [35].
The general form of the baseline model is:
P G R i = β 0 + β 1 N F F R i + β 3 P T i + β 3 P I R i + β 4 D i s t _ C B D i + ε i , t
with successive models simplifying or extending this structure. The dependent variable  P G R i  is the population growth rate for commune  i β 0  is a constant;  N F F R i  is new-firm formation rate capturing local economic activity;  P T i  is the proportion of residents within 500 m of a public transport stop, reflecting transit accessibility in commune  i ; and  P I R i  is price-to-income indicating housing affordability.
Statistical fit was evaluated using adjusted  R 2 , AIC and BIC.
(5)
Clustering Analysis for Commune Classification:
To address Q2, k-means clustering was applied to the scaled indicators. K-Means is an unsupervised machine learning method that partitions data into a predefined number of clusters (k) by minimizing intra-cluster variance, ensuring that data points within each cluster exhibit similar characteristics while maximizing differences between clusters [16]. The algorithm follows an iterative process, beginning with the initialization of cluster centroids. Once initialized, each data point is assigned to the nearest cluster based on Euclidean distance, calculated as [16]:
d ( x i , C j ) = m = 1 n ( x i m C j m ) 2
where  x i m    represents the value of the  m -th feature of the  i -th data point, and  C j m  is the corresponding coordinate of the centroid  C j .  After the assignment step, the centroids are updated by computing the mean of all data points within each cluster, recalculating their positions iteratively until convergence is reached. The new centroid  C j    is determined as:
C j = 1 N j i = 1 N j x i
where  N j  is the number of data points assigned to cluster  j . Convergence occurs when cluster assignments stabilize, meaning that centroid positions no longer change significantly between iterations. Determining the optimal number of clusters is a critical step in K-Means clustering. In this study, the Elbow Method was used to evaluate the Within-Cluster Sum of Squares (WCSS), which quantifies the total variance within clusters. By plotting WCSS against different values of k, the point at which additional clusters yield diminishing improvements was identified as the optimal number of clusters [16]. Subsequently, each cluster was profiled based on average indicator values and further validated using the Silhouette Score.

3. Results

This section reports the empirical findings of our study. It moves from descriptive mapping of population change and land consumption to the factors shaping demographic redistribution and, finally, to the commune typology revealed by clustering.

3.1. Urbanization Sustainability

3.1.1. Population Dynamics

The demographic analysis reveals a clear core–periphery gradient of demographic change. From 2014 to 2024 the southern and eastern peripheries, including Oulad Salah, Oued Hassar and Nouaceur, recorded the highest population growth rates (12–16%), while communes such as Bouskoura and Dar Bouazza grew more moderately with growth rates ranging between 4% and 8% (Figure 2a). Conversely, the central areas of the Casablanca prefecture show evidence of population decline. Anfa commune, for instance, exhibits a negative growth rate of −3.55%.

3.1.2. Land Consumption

Regarding the land expansion, the map, in Figure 2b, shows a shift in urban development toward the southern and southeastern peripheries. Built-up areas as of 2014 (green) are concentrated in the central zones, indicating a saturated metropolitan core. In contrast, newly constructed areas (red) between 2014 and 2024 are found in suburban and peri-urban zones, particularly in provinces such as Nouaceur and Mediouna. This expansion reflects increased demand for residential, commercial, and industrial spaces on the outskirts.

3.1.3. SDG 11.3.1

Table 2 shows that although the Casablanca prefecture experienced negative population growth (–0.43% yr−1), it continued to consume land (LCR = 0.41% yr−1), producing an LCRPGR of −0.94. This results in an LCRPGR value of −0.94, an uncommon but mathematically valid outcome in urban analysis. However, negative LCRPGR values pose interpretative challenges, as they highlight a growing urban footprint alongside population loss [36]. This implies less efficient land use, yet it remains unclear whether a higher negative value reflects a more concerning trend.
By contrast, suburban provinces such as Nouaceur and Mediouna combined rapid population growth (≈7% yr−1) with more moderate land expansion (≈2.5% yr−1), leading to LCRPGR values below 1 (0.36 and 0.40, respectively). This suggests relatively efficient land use, as urban expansion is occurring at a slower rate than population growth.
At the metropolitan scale, Greater Casablanca registered a positive LCRPGR of 0.77, suggesting a more controlled urban expansion where land consumption (0.82% yr−1) is relatively proportional to population growth (1.06% yr−1).

3.2. Housing Affordability

Housing prices and the Price-to-Income Ratio (PIR) display a strong center–periphery contrast (Figure 2c). Central communes, such as Anfa and El Maarif, exhibit the highest median housing prices, exceeding 1.4 million MAD. Intermediate communes, such as Bouskoura and Hay Hassani, show moderately high prices ranging between 0.6 and 1 million MAD. On the other hand, peripheral communes like Sidi Hajjaj Oued Hassar, and Mediouna have significantly lower housing prices, typically below 0.6 million MAD, which makes them more affordable for households earning the national median income. The analysis of the PIR reveals that 78% of communes exceed the affordability threshold defined by the United Nations (UN), which considers a PIR between 3 and 5 as indicative of affordable housing [25]. Notably, only 12% of communes, primarily located in peripheral areas, fall within the affordable range (4.1 ≤ PIR ≤ 5.0). However, the majority, accounting for 58% of communes, are classified as moderately unaffordable, with PIR values ranging from 5.1 to 8.99. Meanwhile, 30% of communes, predominantly in the urban core, exhibit PIR values exceeding 9.0, placing them in the “severely unaffordable” category.
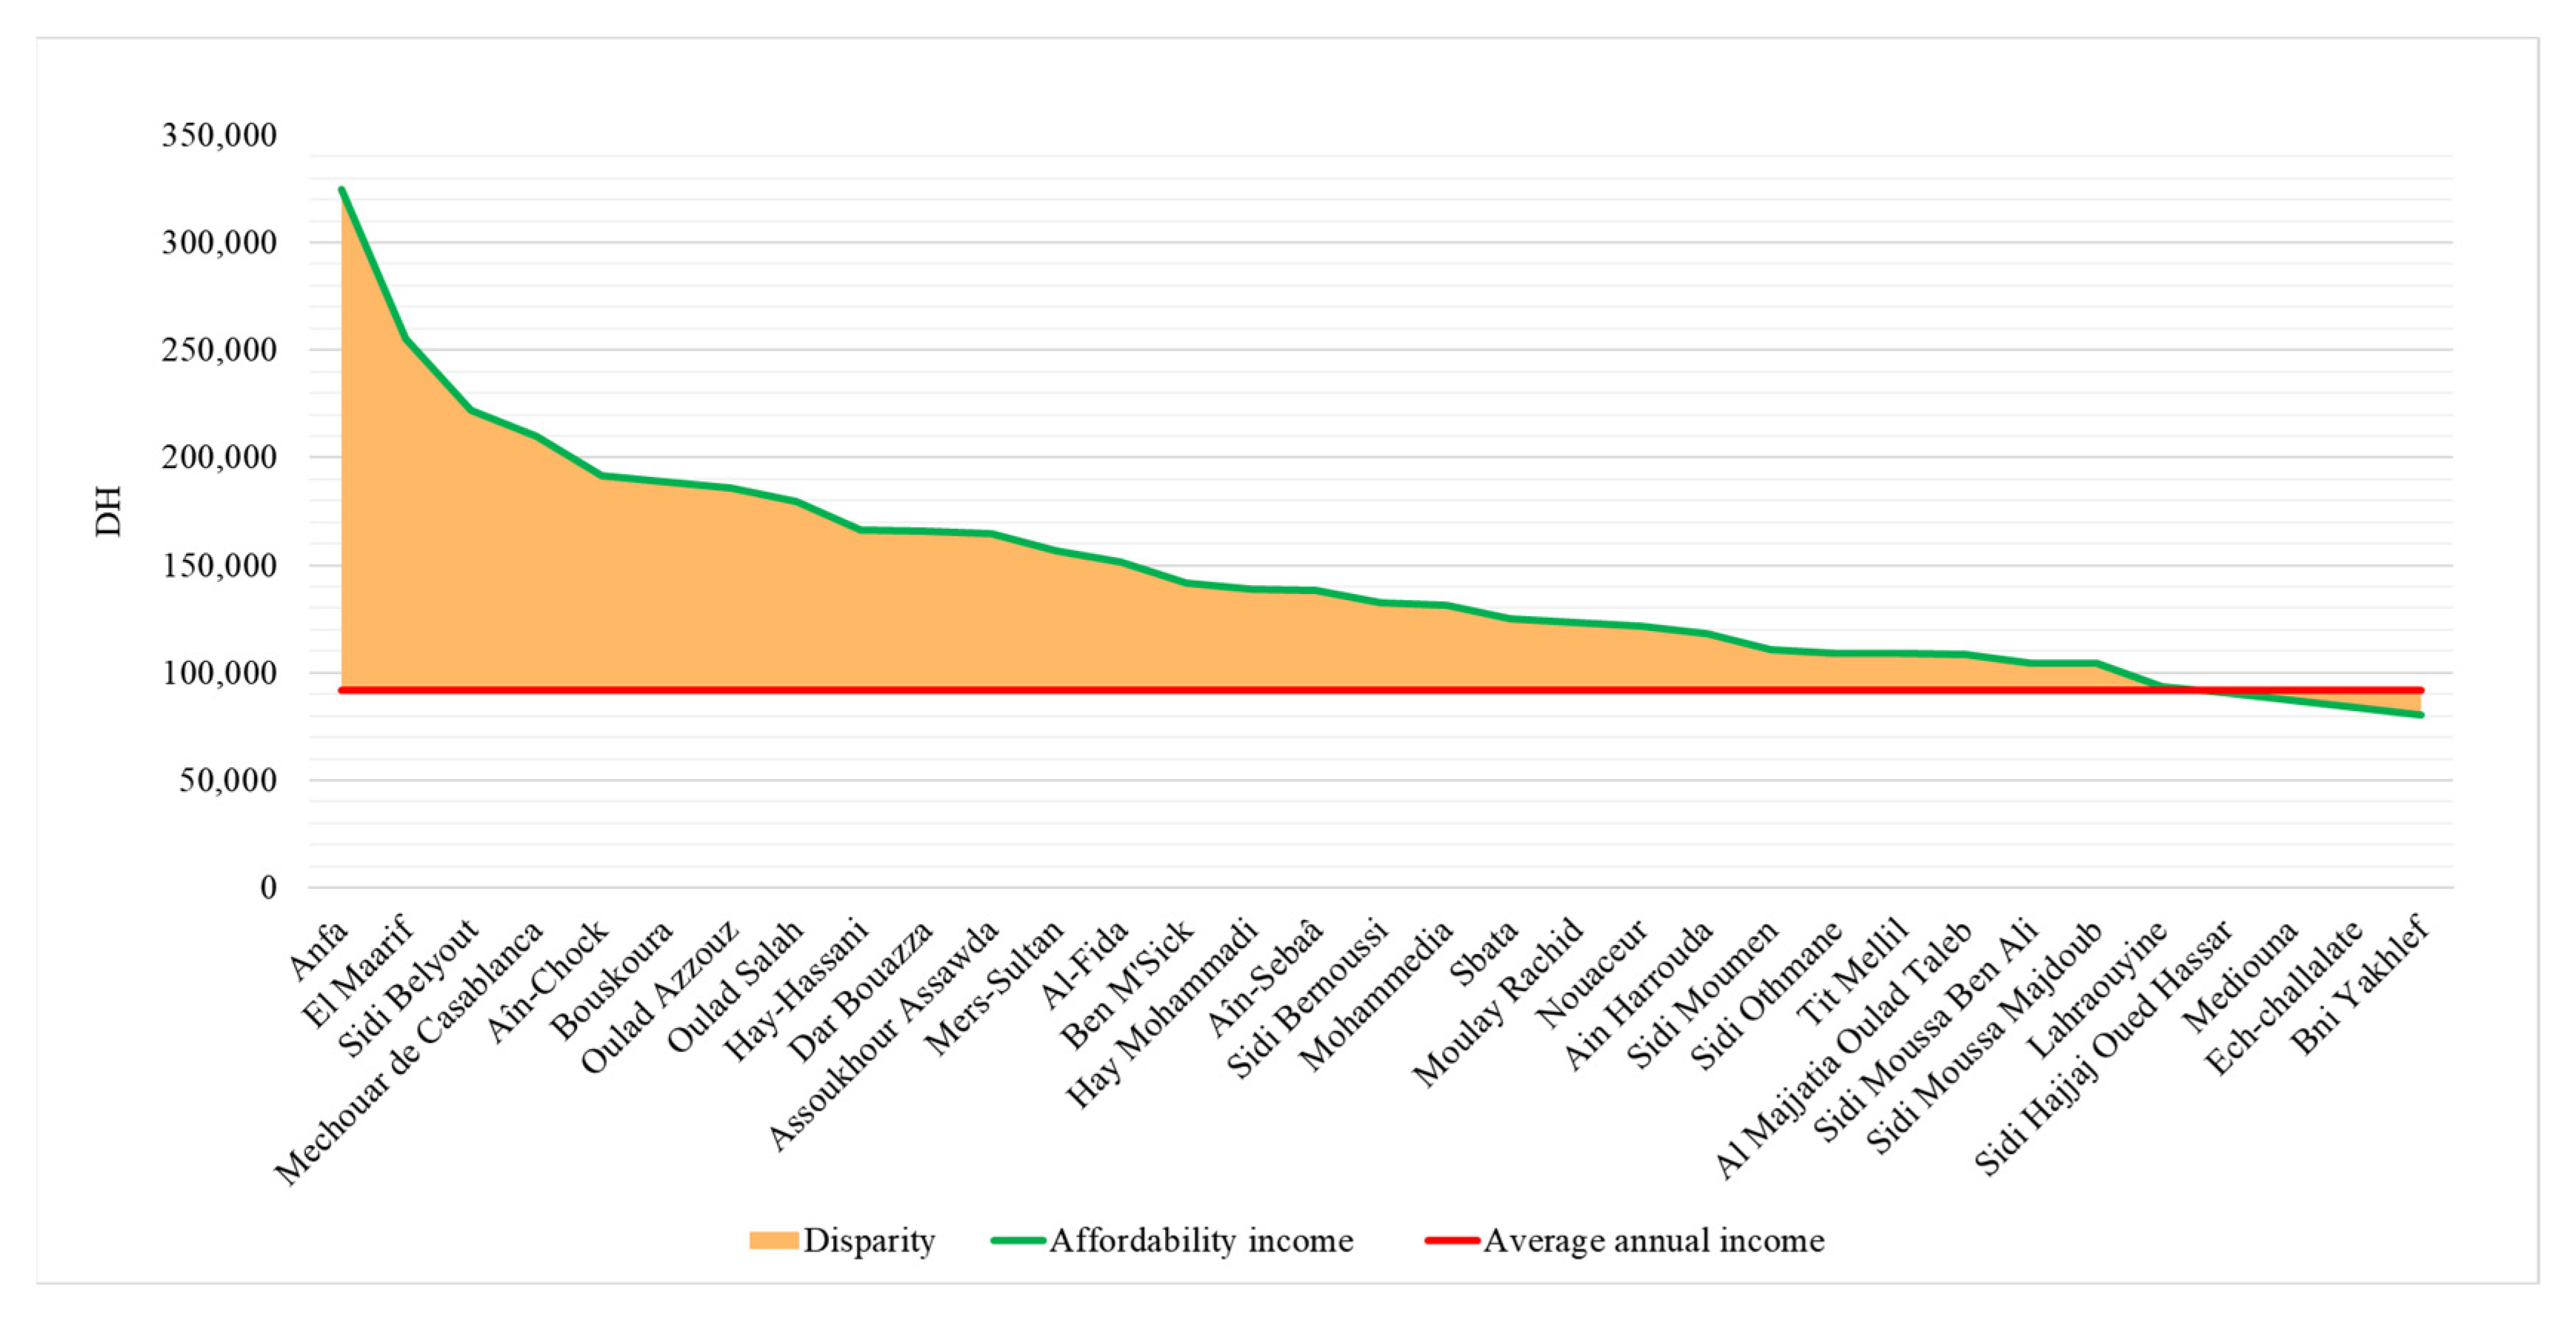
In order to quantify the financial burden, the income required to purchase a sufficient housing unit (assumed to be 80 square meters) was calculated using a 5-year income, which represent the upper limit of the affordability range [25] (Figure 3). In central communes like Anfa and El Maarif, the required income exceeds 300,000 MAD annually, which is more than three times the national average income. whereas the required incomes in peripheral communes, such as Sidi Hajjaj Oued Hassar and Bni Yakhlef, are closely comparable to the national average income. These findings reinforce Hypothesis 1, showing that the fastest-growing communes coincide with areas of relatively affordable housing.

3.3. Economic Activity

The analysis of the New Firm Formation Rate (NFFR) highlights emerging economic activity patterns in Greater Casablanca between 2010 and 2024. As shown in Figure 2d and Figure 4, peripheral areas such as Bni Yakhlef, Dar Bouazza and Ech-challalate recorded strong increases in NFFR values, suggesting that economic activity is gradually moving from the central urban core to the suburban and peripheries. The communes of Casablanca province, which have historically served as major economic hubs and collectively host over 70% of the total economic establishments in the metropolitan area, exhibit lower NFFR values, indicating a slowdown in business growth in these districts. On the other hand, the size of businesses varies across communes, with Nouaceur standing out for having the largest average employment per establishment (around 24 employees), while Ech-challalate had the smallest, with an average of just 2 employees per establishment. Indicating small business activity in these communes.
These patterns answer part of Research Q1, indicating that economic dynamism in the periphery accompanies rapid population growth, a key element of Hypothesis 2.

3.4. Public Transport Accessibility and Connectivity Gaps

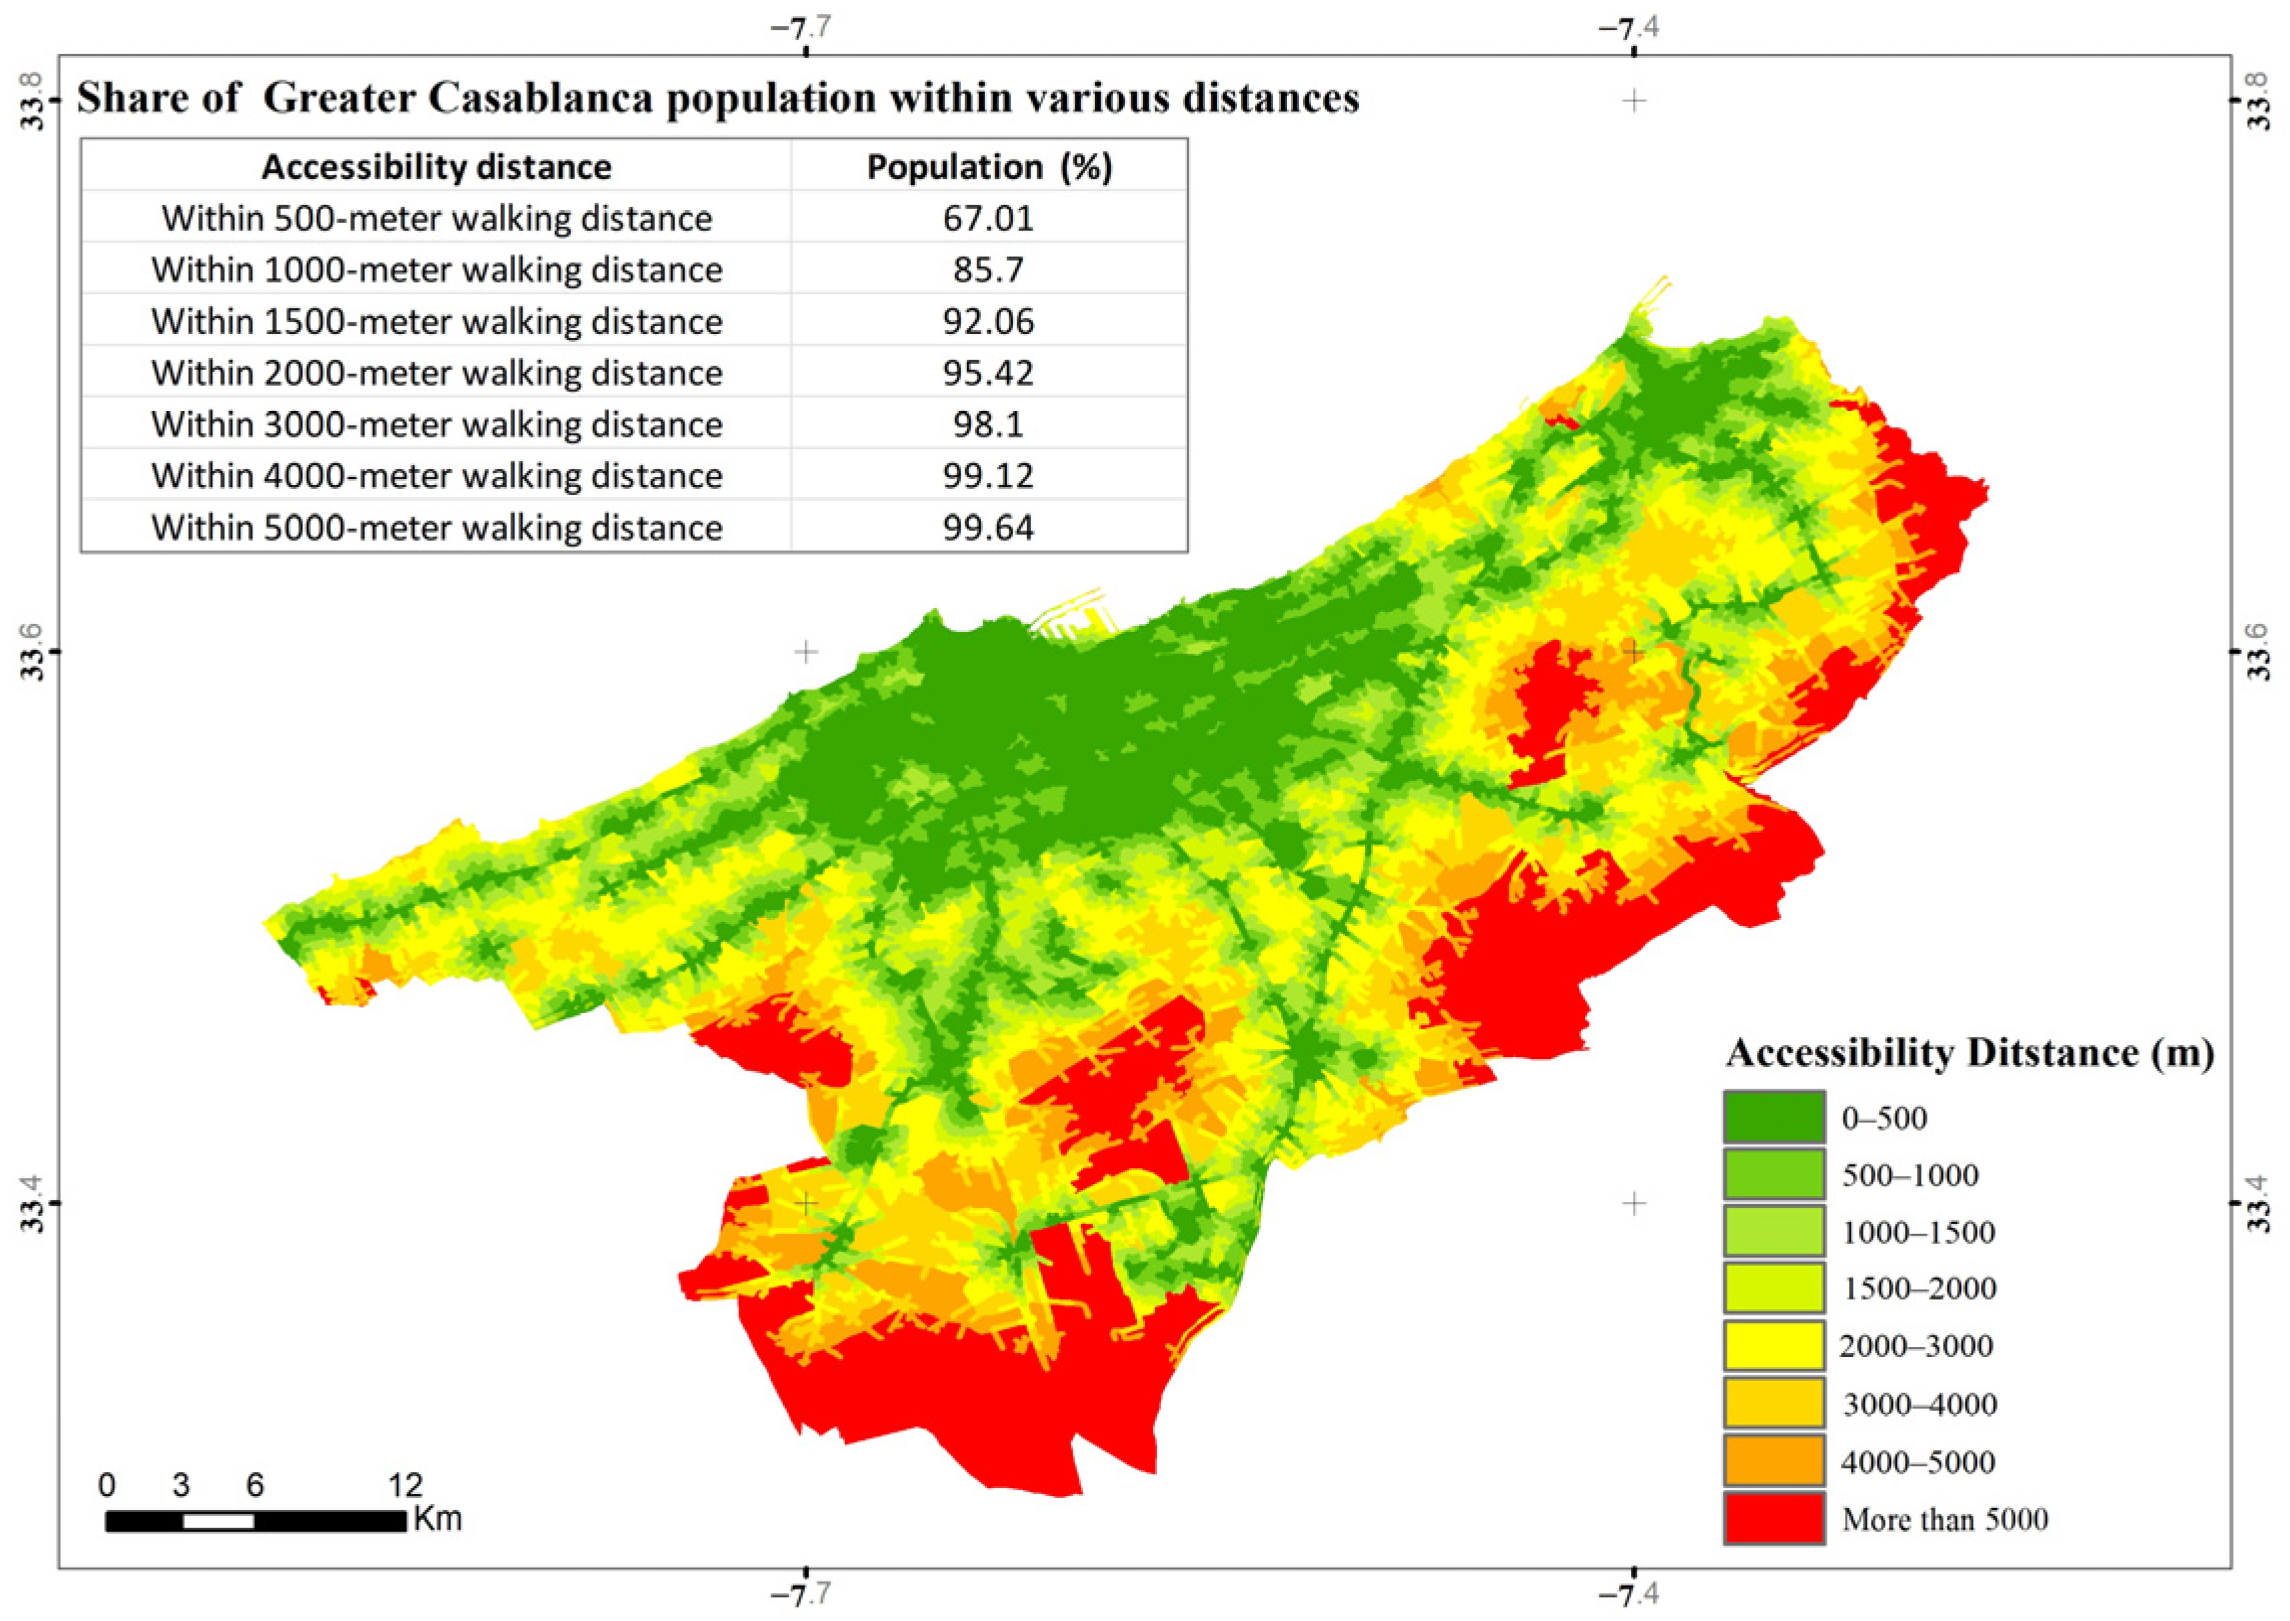
This section presents the results of the public transport accessibility analysis, evaluating the spatial distribution of accessibility levels across Greater Casablanca in alignment with SDG 11.2. Figure 5 illustrates the spatial distribution of accessibility, with areas closest to public transport stops (0–500 m, shown in green) predominantly located in the urban core, while areas with lower accessibility (more than 3000 m, shown in red) are concentrated in the southern and southeastern suburban regions. The figure shows that 67% of the total population live within 500 m of a public transport stop, indicating that majority of the metropolitan areas are very accessible and contribute positively to SDG 11.2. Accessibility increases to 85.7% within 1000 m, 92.1% within 1500 m, and 95.4% within 2000 m, covering the majority of the population.
Table 3 indicates that central areas such as Al-Fida (99.04%) and Ben M’Sick (98.12%) exhibit high accessibility rates, largely due to well-developed public transportation networks, including bus and tram services. In contrast, peripheral and suburban communes in neighboring provinces, such as Nouaceur, show significantly lower coverage, with accessibility rates ranging between 11% and 27%. Other areas, like Mohammedia (65.79%), demonstrate moderate levels of accessibility, reflecting infrastructure development that is underway but not yet fully completed. This pattern supports Hypothesis 2, which anticipates that peripheral communes have weaker public-transport access.

3.5. Correlation Analysis

To examine bivariate relationships, we calculated Spearman’s rank correlations (ρ) with 95% bootstrap confidence intervals and Benjamini–Hochberg FDR-adjusted p-values (Table 4; n = 33 communes). Population growth shows a strong positive association with the new-firm formation rate (ρ = 0.93; 95% CI 0.85–0.96; p < 0.001), indicating that communes experiencing the most dynamic business creation are also those with the fastest demographic growth. Conversely, population growth is strongly and negatively related to public transport accessibility (ρ = −0.76; 95% CI −0.86 to −0.58; p < 0.001), suggesting that the fastest-growing areas are the least well served by the existing public transport network. Housing affordability (PIR) is moderately and inversely correlated with population growth (ρ = −0.48; 95% CI −0.77 to −0.11; p = 0.006), meaning that communes with more affordable housing (lower PIR) tend to attract more residents. Patterns for NFFR mirror those for population growth: it is negatively correlated with public-transport accessibility (ρ = −0.78; 95% CI −0.88 to −0.60; p < 0.001) and with PIR (ρ = −0.55; 95% CI −0.80 to −0.23; p = 0.001). Finally, public-transport accessibility shows a weak but positive link with PIR (ρ = 0.35; 95% CI 0.01–0.63; p = 0.048), indicating that better-served communes also tend to have higher housing prices and thus lower affordability.
For robustness, Pearson’s product–moment correlations were also computed (Supplementary Table S2). They yield the same qualitative conclusions.

3.6. Determinants of Population Growth

Table 5 summarizes the results of the OLS regression model, showing the relationships between urbanization trends in Greater Casablanca, local economic activity, transport accessibility, housing affordability and spatial location.
Among the significant predictors, NFFR (p < 0.001) shows a persistent and positive coefficient across all model specifications, indicating that communes with higher local economic dynamism are better positioned to sustain population growth. This finding aligns with urban economics literature highlighting the critical role of firm concentration, industrial development, and agglomeration economies in shaping urban concentration [32,34]. The implications of this finding are significant, as they underscore local economic dynamism as a major determinant of population growth in Greater Casablanca, while also quantifying the strength of this relationship. By contrast, public transport accessibility (PT) and housing affordability (PIR) show weaker or inconsistent effects in the baseline model. The interaction model, while not yielding statistically strong coefficients for its multiplicative terms, still provides the highest explanatory power (R2 = 0.813; RMSE = 2.01). Its inclusion of distance-based interactions allows us to detect emerging spatial tendencies: the coefficients suggest that the positive effect of NFFR on population growth strengthen with greater distance from the CBD, and that lower housing costs in the periphery could attract more residents, while public transport gaps may persist. Although these interaction effects are not statistically significant, their direction is consistent with the hypothesized decentralization and affordability dynamics.

3.7. Clustering Analysis and Urban Typologies in Greater Casablanca

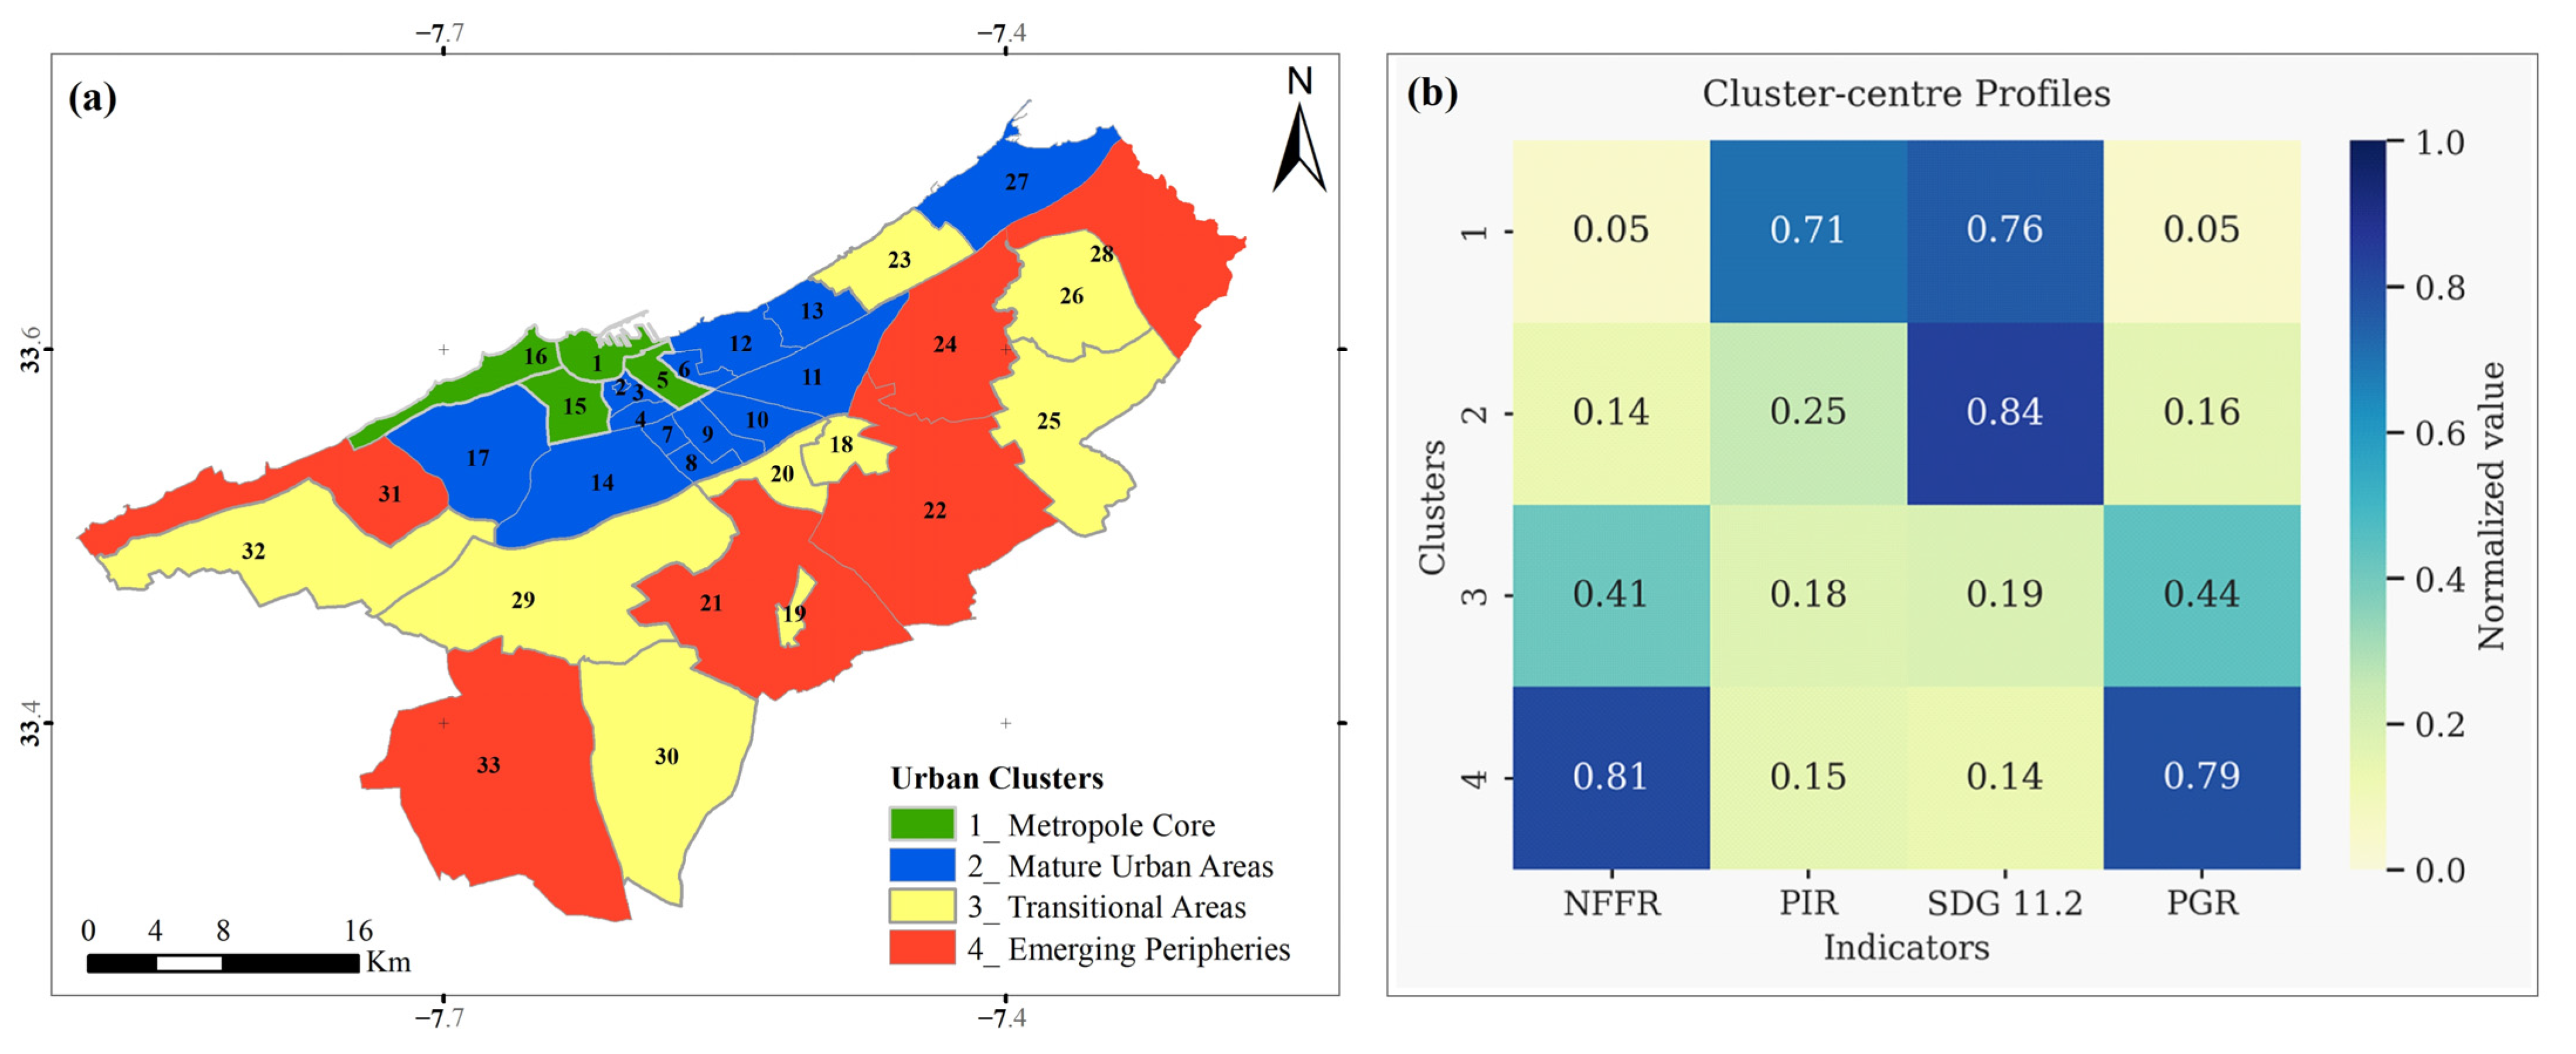
K-means clustering of four indicators—population growth, NFFR, public-transport accessibility and PIR—identifies four distinct socio-spatial types (Figure 6).
  • Model-selection diagnostics
Candidate solutions with k = 2–8 were evaluated using the within-cluster sum of squares (SSE) and the average silhouette coefficient. SSE declined monotonically as k increased, with a clear “elbow’’ at k ≈ 4. Silhouette values peaked at k = 2 (0.54) and remained moderate at k = 3 (0.43) and k = 4 (0.39). Because a two-cluster split would be too coarse to capture the range of metropolitan patterns, we retained four clusters as the best compromise between statistical fit and interpretability. Cluster-center profiles in normalized values are shown in Figure 6b, and centroid values in raw units are provided in Supplementary Table S3 for reference.
  • Metropolitan typology
The clusters delineate a clear core–periphery gradient:
Cluster 1—Metropolitan Core (Green Zones): This cluster includes 4 communes: Sidi Belyout, El Maarif, Anfa, and Assoukhour Assawda. They combine high housing costs (high PIR) and excellent public-transport accessibility, but show population decline and very low firm-formation rates. These mature districts face the classic challenges of highly urbanized centers: infrastructure saturation and housing-market pressure.
Cluster 2—Mature Urban Areas (Blue Zones): Fourteen communes including Sidi Othmane, Sidi Moumen, Mohammedia and Hay Hassani exhibit very high public-transport accessibility and low population growth. Economic activity grows at a steady, moderate pace and housing affordability is a moderate concern. These communes represent established urban zones with relatively stable urban characteristics and infrastructure.
Cluster 3—Transitional Suburbs (Yellow Zones): Nine communes such as Nouaceur, Bouskoura and Ain Harrouda display moderate housing-affordability pressures, balanced economic growth and weak transport accessibility. These are transitional spaces integrating into the metropolitan system, facing both opportunities and infrastructural limitations.
Cluster 4—Emerging Peripheries (Red Zones): Six communes including Oulad Salah, Ech-Challalate and Dar Bouazza record the fastest population growth and highest NFFR, combined with relatively low housing prices but the weakest transport connectivity. The red zones represent rapidly developing peripheries where economic opportunities are emerging but infrastructure lags behind.
  • Robustness check: hierarchical clustering
Hierarchical agglomerative clustering provides a robustness check, yielding high agreement with the k-means result: Adjusted Rand Index (ARI) = 0.79 and Normalized Mutual Information (NMI) = 0.81. (Supplementary Figure S2)

4. Discussion

4.1. Key Findings and Theoretical Implications

Our analysis shows a clear core–periphery restructuring of the Greater Casablanca Metropolitan Region. The central prefecture has experienced population decline despite continued national economic growth, while peripheral communes have recorded rapid demographic and economic expansion.
Population growth is closely linked to affordable housing and higher rates of new-firm formation, but it is concentrated in areas with poor public-transport access. Typology analysis identified four socio-spatial clusters: a shrinking but well-served core, mature urban areas with stable populations, transitional suburbs, and fast-growing but weakly connected peripheries. These results support our hypotheses: population growth is greatest where housing is more affordable, and peripheral communes combine strong economic dynamism with weaker accessibility.
These findings align with core–periphery and suburbanization theories [8,9,10]. At the same time, uneven access to housing, employment and transport resonates with spatial-justice theory, which emphasizes how inequalities are produced and reinforced across urban space. The Greater Casablanca case demonstrates that these theoretical frameworks, originally developed for Europe and North America, also illuminate the restructuring of rapidly urbanizing North-African metropolitan areas.

4.2. Economic Dynamism and Housing Policy as Drivers of Peripheral Growth

The strong association between population growth and new-firm formation underscores the role of economic dynamism in reshaping the metropolitan structure. This reflects the orientations of the Urban Master Plan (Schéma Directeur d’Aménagement Urbain, SDAU) of Greater Casablanca, which explicitly promotes development around peripheral economic ecosystems [37]. A central mechanism has been the creation of new Economic Activity Zones (zones d’activités économiques) in peri-urban communes such as Nouaceur and Mediouna, alongside the airport–Nouaceur corridor that has emerged as a hub for aeronautics and advanced manufacturing. These initiatives have relocated industry and logistics functions outward, generating new employment poles that attract firms and households.
Housing policy has reinforced this outward shift. State-backed new cities (villes Nouvelles) and resettlement programs have channeled metropolitan growth toward the periphery. Zenata Eco-City, designed to host about 300,000 residents and 100,000 jobs, exemplifies this strategy of planned decentralization [38] . Likewise, the City Without Slums (Villes Sans Bidonvilles) program relocated households from inner-city slums such as Karyan Central in Hay Mohammadi to planned developments like Nouvelle Lahraouiyine in Mediouna [39]. These interventions contributed to reducing the share of informal housing in Casablanca province from about 7.9% in 2014 to 7.2% in 2024 [4], while stimulating population growth on the metropolitan fringe. Although informality persists, these policies have encouraged a more formal and planned suburban expansion than is typical in many sub-Saharan cities.

4.3. Public-Transport Accessibility and Spatial Inequalities

Economic and demographic growth in the periphery contrasts with limited public-transport provision. Only 11–25% of residents in some outer communes live within 500 m of a public-transport stop, compared with near-universal coverage in the core. This disparity reflects the current configuration of Casablanca’s tramway lines and main bus corridors, which remain concentrated in central districts and have not yet been extended to the outer communes [20,39]. Nouvelle Lahraouiyine, for example, lies beyond the planned tram and BRT network and relies on private buses and shared taxis [39]. Comparable accessibility gaps between fast-growing suburbs and established cores have been documented in other cities of the Global South, including Lagos and Dakar [40,41]. From a spatial-justice perspective, such inequalities threaten to entrench socio-economic segregation and undermine progress towards SDG 11.2, which calls for access to safe, affordable and sustainable transport for all [40].

4.4. Lessons from North-African and Global Metropolitan Dynamics

Greater Casablanca’s dynamics are part of a broader regional pattern. Studies of Algiers show that since the 1980s the hyper-center has lost residents as middle-class households relocated to peripheral enclaves under public housing programs, producing a more segregated metropolitan structure [42]. Similarly, in Oran, peri-urban real-estate development since the 1970s has generated demographic decline and functional change in the historic center, with young adults moving outward and central districts becoming increasingly commercial and aged [43]. Rabat, Morocco, has not seen the same level of core shrinkage but large-scale planning projects show similar decentralizing pressures [44]. By contrast, Greater Cairo illustrates a different model: since the 1970s, new desert towns such as 6th of October and New Cairo have absorbed much of the expansion, yet the historic core remains dense [45]. These comparisons suggest that core decline combined with peripheral expansion is an emerging phenomenon in North-African.
Globally, Greater Casablanca’s trajectory echoes patterns in the U.S. Rustbelt, the Ruhr area, and Chinese cities, where population loss in the core coincides with growth in the periphery [2,3]. Yet, the Moroccan case is distinctive: shrinkage occurs through policy-driven decentralization and housing programs. This highlights the need to adapt the concept of urban shrinkage to Global South realities, where redistribution often stems from planned interventions rather than industrial decline.

4.5. Moving Towards a Sustainable Metropolitan Future: Policy Implications

The transformation of Greater Casablanca demonstrates both the opportunities and risks of rapid, policy-driven suburbanization. Programs such as Villes Sans Bidonvilles and large-scale “villes Nouvelles” have formalized much of the metropolitan fringe, but they also created challenges of accessibility, integration, and service provision. Zenata Eco-City illustrates this tension: while promoted as Morocco’s first ecological city and a major hub for middle-income households, it remains weakly integrated with its surrounding districts, raising concerns of producing enclaves rather than inclusive urban nodes [46]. From this analysis, three priorities emerge. First, transport infrastructure must expand in pace with demographic and economic growth. Fast-growing communes such as Mediouna and Nouaceur remain poorly connected to the metropolitan grid, despite hosting major industrial zones and resettlement programs. Extending tram and bus lines into these areas is essential to prevent widening spatial divides. International experience shows that the integration of suburban economic zones through transit-oriented development has successfully reduced pressure on the urban core while promoting economic decentralization [47]. Second, housing and employment strategies must be jointly planned. Relocation and housing programs have shifted large numbers of households outward, often without nearby jobs or services. Future housing projects must therefore be collocated with employment hubs and supported by schools, healthcare, and reliable transport. Third, economic decentralization requires strong environmental safeguards. A 32-year analysis of Casablanca’s surface urban heat island (SUHI) highlights significant heat anomalies over industrial localities [19]. New economic zones must incorporate urban greening, sustainable building codes, and energy-efficient infrastructure. Aligning these measures with SDG 11.6 (reducing environmental impacts), alongside SDG 11.2 (transport access) and SDG 11.3 (land-use efficiency), would create measurable benchmarks for sustainable metropolitan development.

4.6. Limitations and Future Research

Despite its contributions, this study faces several limitations. First, the analysis was constrained by data availability. Second, the research design is correlational and cross-sectional in nature, preventing strong claims about causality. Third, the focus on Greater Casablanca, while analytically rich, limits the generalizability of the findings to other metropolitan regions with different institutional or spatial contexts.
To address these limitations, future research should expand the temporal scope through longitudinal or panel-based designs, incorporate comparative case studies across North African or Global South cities, and integrate a broader set of socioeconomic and environmental indicators. Such approaches would enhance our understanding of urban restructuring processes in Casablanca and improve the applicability of the findings to wider urban development challenges in the Global South.

5. Conclusions

This study examined the recent population dynamics and spatial inequalities of Greater Casablanca. The results show that the central prefecture has lost population despite continued land consumption and national economic growth, while peripheral communes have experienced rapid demographic and economic expansion. These trends are closely linked to housing affordability and new-firm formation, though they occur in areas where public transport access remains weakest. In doing so, the study confirms both hypotheses: that communes with more affordable housing grow faster, and that peripheral areas combine economic dynamism with weaker transport provision. Theoretically, this research extends core–periphery and shrinking-city frameworks, traditionally applied in Europe and North America, to a North African case. It shows that Casablanca’s core shrinking is not the result of deindustrialization but of state-led decentralization and housing policy. Methodologically, the integration of remote sensing, regression analysis, and clustering demonstrates the value of combining geospatial and socioeconomic data to identify urban typologies that conventional statistics would not reveal. From a policy perspective, three priorities stand out. First, transport infrastructure must keep pace with demographic and economic growth in peripheral communes such as Mediouna and Nouaceur. Second, housing, services and employment strategies need to be planned together, ensuring that relocation and new-city projects are supported by services and accessible labor markets. Third, economic decentralization should incorporate environmental safeguards, given evidence of heat stress over industrial zones. Stronger metropolitan governance will be essential to align interventions across housing, transport, and economic development. This study links local urban trends to global theories and SDG-aligned planning, offering both new insight into metropolitan change in North Africa and a transferable framework for other Global South cities confronting comparable challenges.

Supplementary Materials

The following supporting information can be downloaded at: https://www.mdpi.com/article/10.3390/urbansci9100420/s1, Figure S1: Elbow curve for K-mean clustering, Figure S2: Dendrogram of hierarchical clustering (Ward linkage) with cut at k = 4, Table S1: Descriptive statistics for the four indicators (n = 33 communes), Table S2: Pearson correlation matrix of key indicators with 95% bootstrap confidence intervals [in brackets] and Benjamini–Hochberg FDR-adjusted p-values (after the semicolon) for 33 communes of Greater Casablanca, Table S3: Cluster sizes, centroid values (original units) and cluster-specific silhouette scores for the four-cluster k-means solution (n = 33 communes).

Author Contributions

Conceptualization, S.T. and H.B.; Methodology, S.T. and R.E.-B.; Software, S.T. and R.E.-B.; Validation, S.T. and R.E.-B. and H.B.; Formal analysis, S.T.; Investigation, R.E.-B.; Resources, S.T. and H.B. and R.E.-B.; Data curation, S.T.; Writing—original draft preparation, S.T.; Writing—review and editing, S.T. and R.E.-B. and H.B.; Visualization, S.T. and R.E.-B.; Supervision, H.B.; Project administration, S.T. All authors have read and agreed to the published version of the manuscript.

Funding

This research received no external funding.

Data Availability Statement

The data presented in this study are available on request from the corresponding author.

Conflicts of Interest

The authors declare no conflicts of interest.

References

  1. United Nations, 2018 World Urbanization Prospects—Population Division—United Nations. Available online: https://population.un.org/wup/ (accessed on 24 September 2022).
  2. Martinez-Fernandez, C.; Weyman, T.; Fol, S.; Audirac, I.; Cunningham-Sabot, E.; Wiechmann, T.; Yahagi, H. Shrinking Cities in Australia, Japan, Europe and the USA: From a Global Process to Local Policy Responses. Prog. Plan. 2016, 105, 1–48. [Google Scholar] [CrossRef]
  3. Zhai, W.; Jiang, Z.; Meng, X.; Zhang, X.; Zhao, M.; Long, Y. Satellite Monitoring of Shrinking Cities on the Globe and Containment Solutions. iScience 2022, 25, 104411. [Google Scholar] [CrossRef] [PubMed]
  4. HCP Site Institutionnel du Haut-Commissariat au Plan du Royaume du Maroc. Available online: https://www.hcp.ma (accessed on 18 December 2024).
  5. Gans, P. Urban Population Development in Germany (2000–2014): The Contribution of Migration by Age and Citizenship to Reurbanisation. Comp. Popul. Stud. 2017, 42. [Google Scholar] [CrossRef]
  6. Baum-Snow, N. Did Highways Cause Suburbanization? Q. J. Econ. 2007, 122, 775–805. [Google Scholar] [CrossRef]
  7. Garcia-López, M.-À.; Pasidis, I.; Viladecans-Marsal, E. Suburbanization and Transportation in European Cities. J. Econ. Geogr. 2024, 24, 843–869. [Google Scholar] [CrossRef]
  8. Couch, C.; Karecha, J.; Nuissl, H.; Rink, D. Decline and Sprawl: An Evolving Type of Urban Development—Observed in Liverpool and Leipzig. Eur. Plan. Stud. 2005, 13, 117–136. [Google Scholar] [CrossRef]
  9. Klimczuk, A.; Klimczuk-Kochańska, M. Core-Periphery Model. In The Palgrave Encyclopedia of Global Security Studies; Palgrave Macmillan: Cham, Switzerland, 2019; pp. 1–8. ISBN 978-3-319-74336-3. [Google Scholar]
  10. Friedmann, J. Regional Development Policy: A Case Study of Venezuela; MIT Press: Cambridge, MA, USA, 1966; ISBN 978-0-262-06013-4. [Google Scholar]
  11. Buchholz, T. Seeking Spatial Justice—By EDWARD SOJA. Tijdschr. Econ. Soc. Geogr. 2011, 102, 378–380. [Google Scholar] [CrossRef]
  12. Harvey, D. The Right to the City: New Left Review. In The City Reader; Routledge: London, UK, 2008; pp. 23–40. [Google Scholar]
  13. Haase, A.; Rink, D.; Grossmann, K.; Bernt, M.; Mykhnenko, V. Conceptualizing Urban Shrinkage. Environ. Plan. A 2014, 46, 1519–1534. [Google Scholar] [CrossRef]
  14. Wu, K.; Yao, C. Exploring the Association between Shrinking Cities and the Loss of External Investment: An Intercity Network Analysis. Cities 2021, 119, 103351. [Google Scholar] [CrossRef]
  15. Rousseau, M.; Harroud, T. When Urban Shrinkage Goes South. Morocco’s Extreme Management of Declining Mining Towns between Paternalism, Entrepreneurialism and Abandonment. Political Geogr. 2023, 106, 102954. [Google Scholar] [CrossRef]
  16. Liu, L.; Peng, Z.; Wu, H.; Jiao, H.; Yu, Y.; Zhao, J. Fast Identification of Urban Sprawl Based on K-Means Clustering with Population Density and Local Spatial Entropy. Sustainability 2018, 10, 2683. [Google Scholar] [CrossRef]
  17. Chettry, V. A Critical Review of Urban Sprawl Studies. J. Geovis. Spat. Anal. 2023, 7, 28. [Google Scholar] [CrossRef]
  18. Malaker, T.; Meng, Q. Urban Disparity Analytics Using GIS: A Systematic Review. Sustainability 2024, 16, 5956. [Google Scholar] [CrossRef]
  19. Bahi, H.; Rhinane, H.; Bensalmia, A.; Fehrenbach, U.; Scherer, D. Effects of Urbanization and Seasonal Cycle on the Surface Urban Heat Island Patterns in the Coastal Growing Cities: A Case Study of Casablanca, Morocco. Remote Sens. 2016, 8, 829. [Google Scholar] [CrossRef]
  20. Tayi, S.; Radoine, H.; El-Bouayady, R. Assessing Urban Sustainability with Geospatial Technologies: Mapping Public Transport Accessibility in Casablanca to Support SDG 11.2. In Proceedings of the International Conference on Emerging Technologies and Innovation for Sustainability (EmergIN), Greater Noida, India, 20–21 December 2024; Institute of Electrical and Electronics Engineers Inc.: New York, NY, USA, 2024; pp. 152–156. [Google Scholar]
  21. Carioli, A.; Schiavina, M.; Freire, S.; MacManus, K. GHS-POP R2023A—GHS Population Grid Multitemporal (1975–2030); European Commission, Joint Research Centre (JRC): Brussels, Belgium, 2023. [Google Scholar]
  22. Gong, P.; Li, X.; Wang, J.; Bai, Y.; Chen, B.; Hu, T.; Liu, X.; Xu, B.; Yang, J.; Zhang, W.; et al. Annual Maps of Global Artificial Impervious Area (GAIA) between 1985 and 2018. Remote Sens. Environ. 2020, 236, 111510. [Google Scholar] [CrossRef]
  23. UN, H. Metadata on SDGs Indicator 11.3.1. Available online: https://unhabitat.org/sites/default/files/2020/07/metadata_on_sdg_indicator_11.3.1.pdf (accessed on 15 January 2024).
  24. Lynch, C.; Singh, A.; Zhang, Y.F. Towards a More Nuanced Approach to Measuring Housing Affordability: Evidence from Pakistan; Policy Research Working Papers; The World Bank: Washington, DC, USA, 2023. [Google Scholar]
  25. UN-Habitat. Global Urban Indicators Database. United Nations Human Settlements Programme; UN-Habitat: Nairobi, Kenya, 2002. [Google Scholar]
  26. Cox, W. Demographia International Housing Affordability, 2024 Edition; Frontier Centre for Public Policy: Winnipeg, MB, Canada, 2024. [Google Scholar]
  27. Moiz, M.; Ileri, Ş.G. The Relationship Between Firm Formation and Unemployment: Evidence from Türkiye. Economies 2025, 13, 28. [Google Scholar] [CrossRef]
  28. Mączka, M. Accessibility model for the evaluation of transport infrastructure policy. Pr. Inst. Lotnictwa 2016, 245, 116–133. [Google Scholar] [CrossRef]
  29. Hauke, J.; Kossowski, T. Comparison of Values of Pearson’s and Spearman’s Correlation Coefficients on the Same Sets of Data. Quaest. Geogr. 2011, 30, 87–93. [Google Scholar] [CrossRef]
  30. Dadashpoor, H.; Malekzadeh, N. Evolving Spatial Structure of Metropolitan Areas at a Global Scale: A Context-Sensitive Review. GeoJournal 2022, 87, 4335–4362. [Google Scholar] [CrossRef]
  31. El-Bouayady, R.; Radoine, H.; El Faouzi, N.-E.; Tayi, S.; Ozkan, H.C. Assessing and Modeling the Impact of Urbanization on Infrastructure Development in Africa: A Data-Driven Approach. Cities 2024, 155, 105486. [Google Scholar] [CrossRef]
  32. Henderson, V. The Urbanization Process and Economic Growth: The So-What Question. J. Econ. Growth 2003, 8, 47–71. [Google Scholar] [CrossRef]
  33. Yang, J.; Li, J.; Xu, F.; Li, S.; Zheng, M.; Gong, J. Urban Development Wave: Understanding Physical Spatial Processes of Urban Expansion from Density Gradient of New Urban Land. Comput. Environ. Urban Syst. 2022, 97, 101867. [Google Scholar] [CrossRef]
  34. Turok, I.; McGranahan, G. Urbanization and Economic Growth: The Arguments and Evidence for Africa and Asia. Environ. Urban. 2013, 25, 465–482. [Google Scholar] [CrossRef]
  35. Storper, M.; Scott, A.J. Current Debates in Urban Theory: A Critical Assessment. Urban Stud. 2016, 53, 1114–1136. [Google Scholar] [CrossRef]
  36. Schiavina, M.; Melchiorri, M.; Freire, S.; Florio, P.; Ehrlich, D.; Tommasi, P.; Pesaresi, M.; Kemper, T. Land Use Efficiency of Functional Urban Areas: Global Pattern and Evolution of Development Trajectories. Habitat Int. 2022, 123, 102543. [Google Scholar] [CrossRef]
  37. Agence Urbaine de Casablanca, Schéma Directeur d’Aménagement Urbain Du Grand Casablanca. Available online: https://www.auc.ma/gestion-planification-urbaine/schema-directeur-damenagement-urbain/ (accessed on 1 October 2025).
  38. Côté-Roy, L.; Moser, S. “Fast Urban Model-Making”: Constructing Moroccan Urban Expertise through Zenata Eco-City. Urban Geogr. 2023, 44, 2016–2036. [Google Scholar] [CrossRef]
  39. Beier, R. The World-Class City Comes by Tramway: Reframing Casablanca’s Urban Peripheries through Public Transport. Urban Stud. 2020, 57, 1827–1844. [Google Scholar] [CrossRef]
  40. UN-Habitat. World Cities Report 2020: The Value of Sustainable Urbanization; UN-Habitat: Nairobi, Kenya, 2020. [Google Scholar]
  41. Bueno Rezendede Castro, A.; Ortega Sandoval, A.D.; Odamtten, G. Up around the Bend? How Transport Poverty Can Lead to Social Exclusion in a Low-Income Community in Lagos, Nigeria. J. Transp. Geogr. 2022, 102, 103388. [Google Scholar] [CrossRef]
  42. Safar Zitoun, M. Alger d’aujourd’hui: Une ville à la recherche de ses marques sociales. Rev. Algér. D’anthropologie Sci. Soc. 2009, 13, 33–55. [Google Scholar] [CrossRef]
  43. Trache, S.; Khelifi, M. Périurbanisation et décroissance démographique de la ville centre: L’exemple d’Oran (Algérie). Cah. Géogr. Qué. 2020, 64, 169–189. [Google Scholar] [CrossRef]
  44. Elhamdouni, S.; Idrissi, Y.; Cherkaoui, E.; Nounah, A.; Khamar, M. Dynamics of Urbanization in the City of Rabat-Morocco, Which Sustainable Transition? Civ. Environ. Eng. 2024, 20, 1140–1151. [Google Scholar] [CrossRef]
  45. Salem, M.; Tsurusaki, N.; Xu, X.; Xu, G. Revealing the Transformation of Spatial Structure of Greater Cairo: Insights from Satellite Imagery and Geospatial Metrics. J. Urban Manag. 2024, 13, 565–579. [Google Scholar] [CrossRef]
  46. Alillouch, R.; Harroud, T. The “New Generation” of New Cities in Morocco: From the “Dormitory” City to the “Sustainable” City, What Has Changed? Afr. Mediterr. J. Archit. Urban. 2022, 4, 99–122. [Google Scholar] [CrossRef]
  47. Yang, J.; Zhou, J. Metropolitan Shenzhen: Rail Plus Property for Transit-Oriented Development; Greater Than Parts Case Study No. 9; World Bank: Washington, DC, USA, 2020. [Google Scholar]
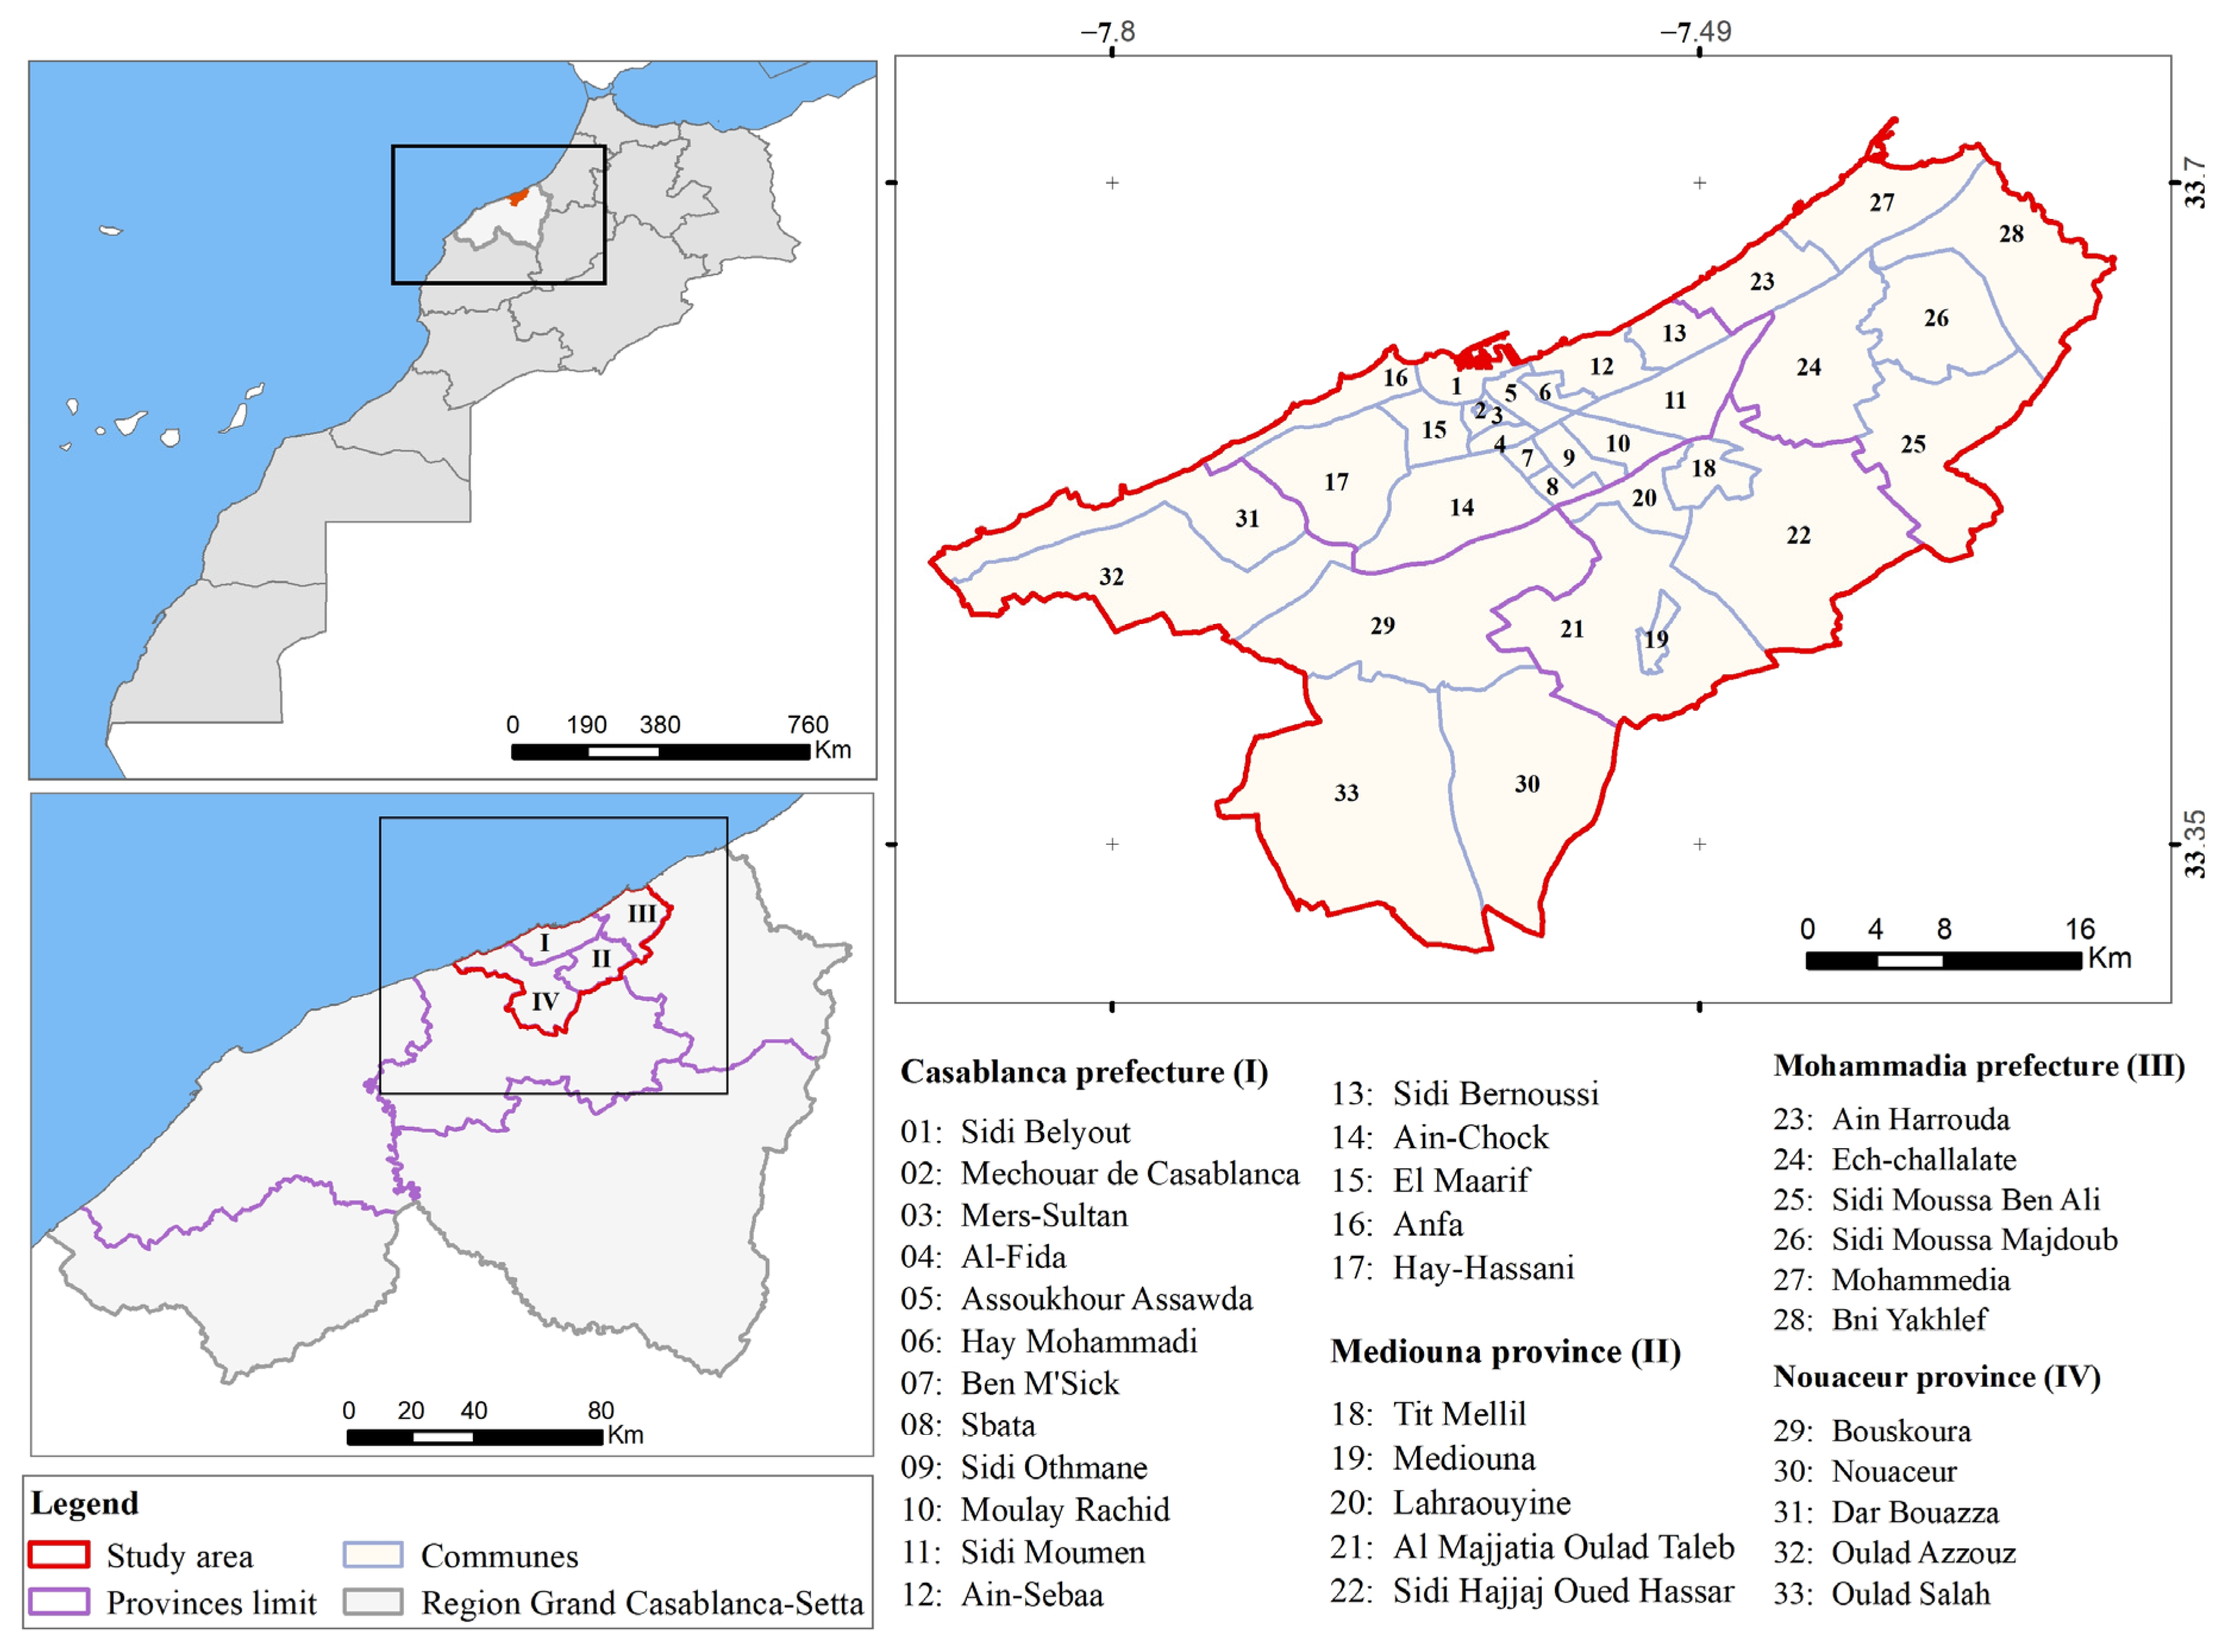
Figure 1. Geographic context and administrative boundaries of Greater Casablanca.
Urbansci 09 00420 g001
Figure 2. Spatial Distribution of indicators Across Communes of Greater-Casablanca: (a) Population growth rate 2014–2024. (b) Built-up areas in Greater-Casablanca (2014–2024), (c) Housing affordability (Price-to-Income Ratio: PIR), (d) Annual New Firm Formation Rate (NFFR).
Urbansci 09 00420 g002
Figure 3. Gap between Average household income and the income required to afford median housing prices across communes of Greater Casablanca.
Urbansci 09 00420 g003
Figure 4. The annualized New-firm formation rate and average size of economic establishments by commune.
Urbansci 09 00420 g004
Figure 5. Spatial distribution of public-transport accessibility zones.
Urbansci 09 00420 g005
Figure 6. (a) Spatial distribution of the four socio-spatial clusters in Greater Casablanca. (b) Heatmap of cluster-center profiles (PGR: population growth rate; NFFR: new-firm formation rate; PIR: price-to-income ratio; SDG 11.2: public-transport accessibility).
Urbansci 09 00420 g006
Table 1. Datasets Utilized in the Study.
DataSourceTypeResolution/Details
Population Spatial DistributionGlobal Population Surfaces (GHSL Pop)Remote sensing100 m resolution population density grids (2025) [21]
Population DataHigh Commission for Planning (HCP)Statistical DataAnnual population statistics by commune (2004, 2014, 2024) [4]
Built-Up Area DataGaia DatasetRemote sensing30 m resolution global built-up area (2014–2024) [22]
Administrative BoundariesHigh Commission for Planning (HCP)Geospatial DataCommune-level boundaries (2024) [4]
Housing Price National Council of Notaries of Morocco (CNONM)Geospatial DataThis is a reference for real estate prices in Morocco published by National Council of Notaries of Morocco.
Economic Establishments in Greater CasablancaHigh Commission for Planning (HCP)Static dataThe dataset provides statistics on economic establishments created between 2010 and 2024, extracted from the Cartography of Economic Establishments (CEE 2023–2024) [4]
Public Transport StopsOpenStreetMap (OSM)Geospatial DataGeolocated public transport stops (tram and bus, 2024)
Road NetworkOpenStreetMap (OSM)Geospatial DataDetailed road network (2024)
Table 2. Land-consumption rate (LCR), population-growth rate (PGR) and LCRPGR (2014–2024) by province for Greater-Casablanca.
AreaPopulation 2014Population 2024PGR (%)LCR (%)LCRPGR
Casablanca prefecture3,359,8183,218,036−0.430.41−0.94
Mediouna province172,680345,7876.942.800.40
Mohammadia prefecture404,648514,0572.391.100.46
Nouaceur province333,604672,3247.012.530.36
Greater Casablanca4,270,7504,750,2041.060.820.77
Table 3. Population rate within 500 m of public transport accessibility coverage (SDG 11.2) across Greater-Casablanca by commune.
ProvinceCommuneSDG 11.2ProvinceCommuneSDG 11.2
CasablancaSbata95.55MohammadiaAin Harrouda32.01
Mechouar de Casablanca58.26Bni Yakhlef33
Aîn-Chock78.04Ech-challalate20.57
Aîn-Sebaâ81.40Sidi Moussa Ben Ali13.02
Hay Mohammadi93.60Sidi Moussa Majdoub20.51
Mers-Sultan97.78Mohammedia65.79
Sidi Bernoussi76.53Mohammedia65.79
Sidi Moumen65.99NouaceurBouskoura25.03
Sidi Othmane74.79Nouaceur15.57
Hay-Hassani82.18Dar Bouazza24.58
Moulay Rachid84.54Oulad Azzouz11.64
Sidi Belyout82.84Oulad Salah27.16
Anfa71.45MediounaTit Mellil37.47
Al-Fida99.04Mediouna68.05
Assoukhour Assawda95.80Lahraouyine45.94
Ben M’Sick98.12Al Majjatia Oulad Taleb20.96
El Maarif93.10Sidi Hajjaj Oued Hassar14.43
Table 4. Spearman’s rank correlations (ρ) with 95% bootstrap confidence intervals [in brackets] and Benjamini–Hochberg FDR-adjusted p-values (after the semicolon) for 33 communes of Greater Casablanca. Indicators: PGR: annualized population growth, NFFR: annualized new-firm formation rate, SDG11.2: public-transport accessibility, and PIR: housing affordability.
Indicator PairPGRNFFRSDG11.2PIR
PGR1.00 (−)0.93 [0.85–0.96] < 0.001−0.76 [–0.86–−0.58]; <0.001−0.48 [–0.77–−0.11]; 0.006
NFFR0.93 [0.85–0.96]; <0.0011.00 (–)−0.78 [–0.88–−0.60]; <0.001−0.55 [–0.80–−0.23]; 0.001
SDG11.2−0.76 [–0.86–−0.58]; <0.001−0.78 [–0.88–−0.60]; <0.0011.00 (−)0.35 [0.01–0.63]; 0.048
PIR−0.48 [–0.77–−0.11]; 0.006−0.55 [–0.80–−0.23]; 0.0010.35 [0.01–0.63]; 0.0481.00 (−)
Table 5. Regression analysis results for the six model specifications (number of observations = 33).
(I): Baseline Model(II): Affordability Model(III): NFFR and PT Model(IV): Reduced Model(V): Interaction Model(VI): Core-Periphery Model
  N F F R 0.152 ***
(0.052)
0.151 ***
(0.051)
0.172 ***
(0.051)
0.084
(0.118)
0.156 ***
(0.052)
  P T −0.027
(0.027)
−0.028
(0.021)
−0.029
(0.030)
−0.028
(0.024)
  P I R 0.023
(0.345)
−0.037
(0.278)
−0.548
(0.418)
−0.020
(0.230)
  D i s t C B D 0.108
(0.161)
0.433 ***
(0.104)
0.103
(0.104)
0.151
(0.102)
−0.452
(0.513)
  N F F R × D i s t C B D 0.005
(0.006)
  P T × D i s t C B D 0.000
(0.003)
  P I R × D i s t C B D 0.063
(0.050)
core_periphery 1.269
(1.089)
  R 2 0.7690.5370.7690.7570.8130.765
  R 2 Adj.0.7260.5060.7450.7410.7600.731
AIC160.5177.5156.5156.1157.6159.1
BIC171.0183.4164.0162.1171.1168.0
Log.Lik.−73.245−84.730−73.254−74.065−69.804−73.530
RMSE2.233.152.232.282.012.25
Notes: Models specifications are as follows: (I):  P G R i = β 0 + β 1 N F F R i + β 2 P T i + β 3 P I R i + β 4 D i s t C B D i + ε i , t ; (II):  P G R i = φ 0 + φ 1 P I R i + φ 2 D i s t C B D i + ε i , t ; (III):  P G R i = γ 0 + γ 1 N F F R i + γ 2 P T i + γ 3 D i s t C B D i + ε i , t ; (IV):  P G R i = 0 + 1 N F F R i + 2 D i s t C B D i + ε i , t ; (V):  P G R i = μ 0 + μ 1 N F F R i + μ 2 P T i + μ 3 P I R i + μ 4 D i s t C B D i + μ 5 N F F R × D i s t C B D i + μ 6 P T × D i s t C B D i + μ 7 P I R × D i s t C B D i + ε i , t ; (VI):  P G R i = θ 0 + θ 1 N F F R i + θ 2 P T i + θ 3 P I R i + θ 4 c o r e _ p e r i p h e r y i + ε i , t . Figures in parentheses () are standard errors. *, **, and *** indicate statistical significance at the 10%, 5%, and 1% levels, respectively.
Disclaimer/Publisher’s Note: The statements, opinions and data contained in all publications are solely those of the individual author(s) and contributor(s) and not of MDPI and/or the editor(s). MDPI and/or the editor(s) disclaim responsibility for any injury to people or property resulting from any ideas, methods, instructions or products referred to in the content.