Net-Zero Energy Retrofitting in Perth’s Residential Sector: Key Features and Strategies for Sustainable Building Transformation
Abstract
1. Introduction
2. Literature Review
- External Wall:
- Thermal Insulation:
- Window Glazing:
- Window–Wall Ratio:
- Shading Device:
- Airtightness:
3. Materials and Methods
4. Results
4.1. An Overview of the Case Buildings
4.2. Current Heating and Cooling Energy Use of the Case Study Buildings
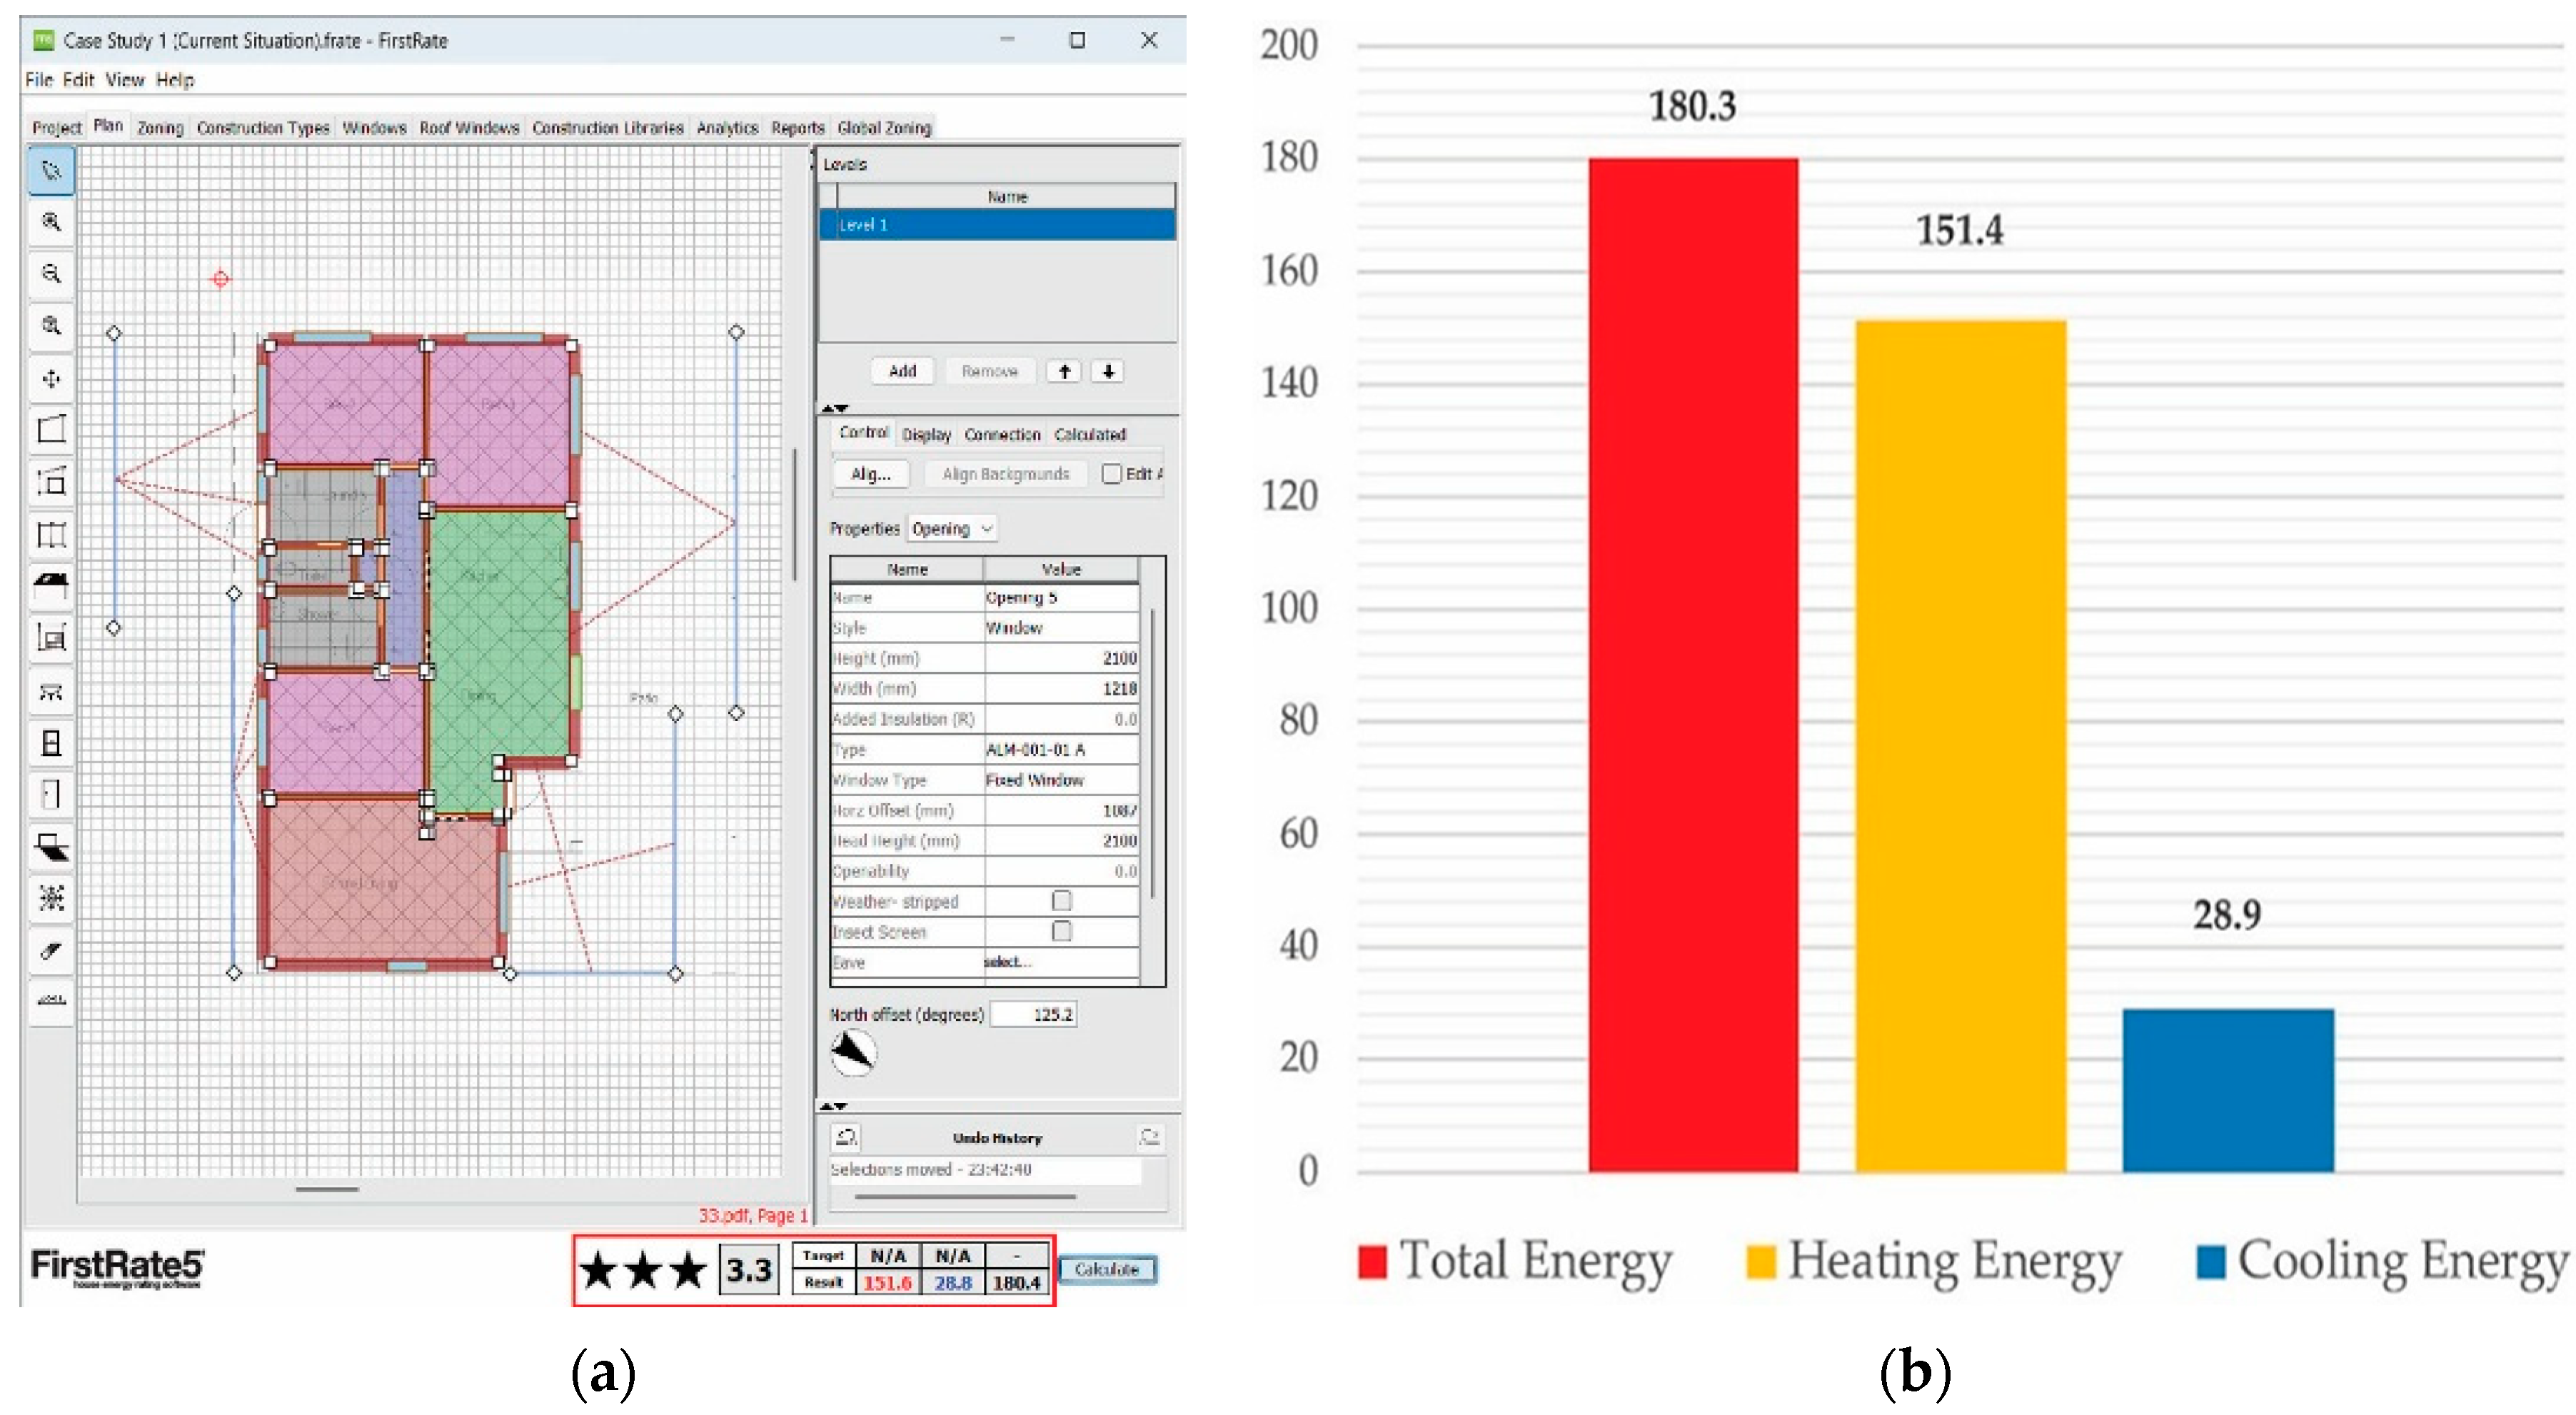
4.3. Case Study 1
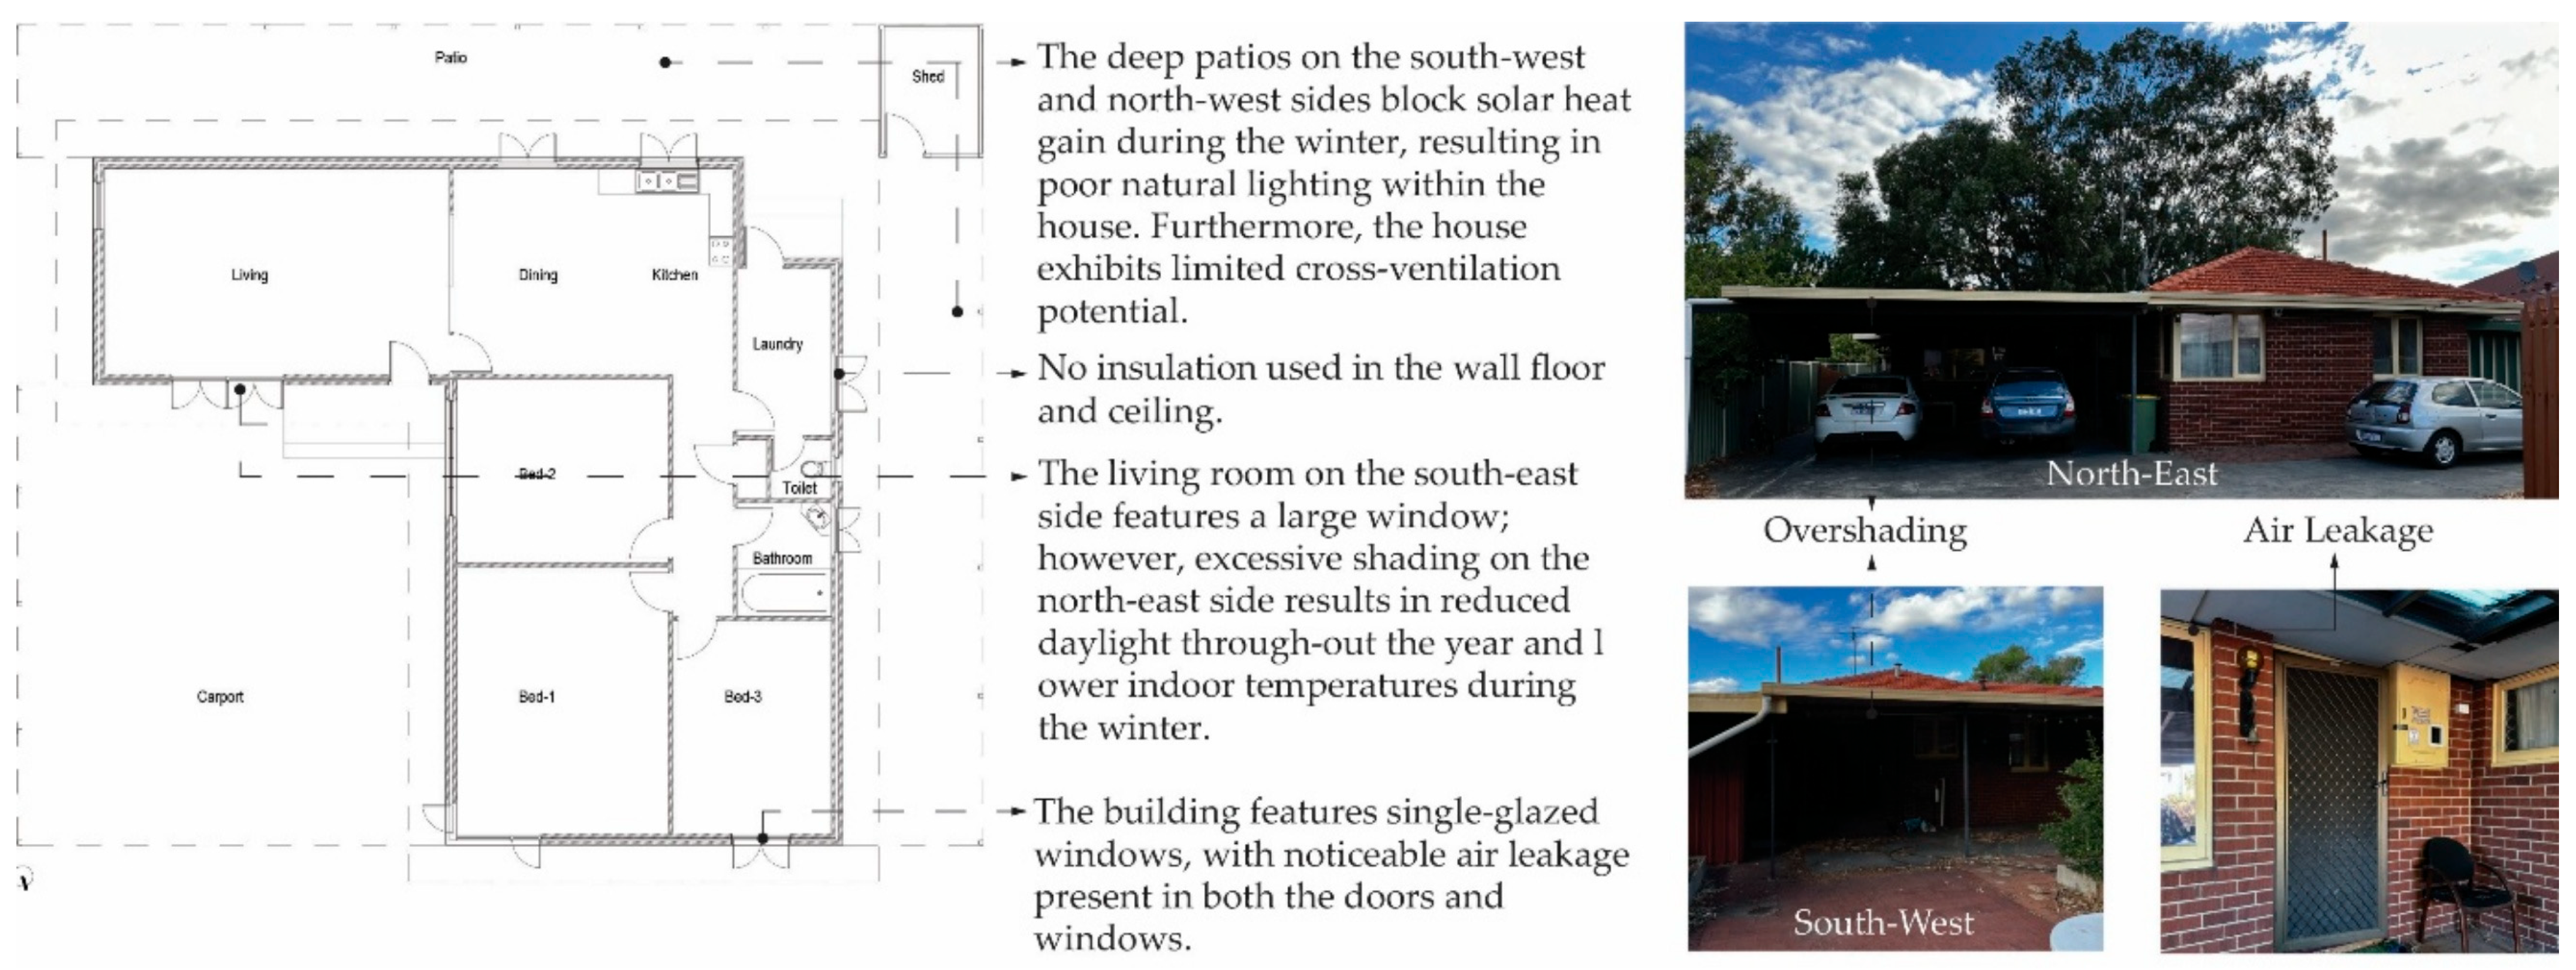
4.3.1. Case Study 2
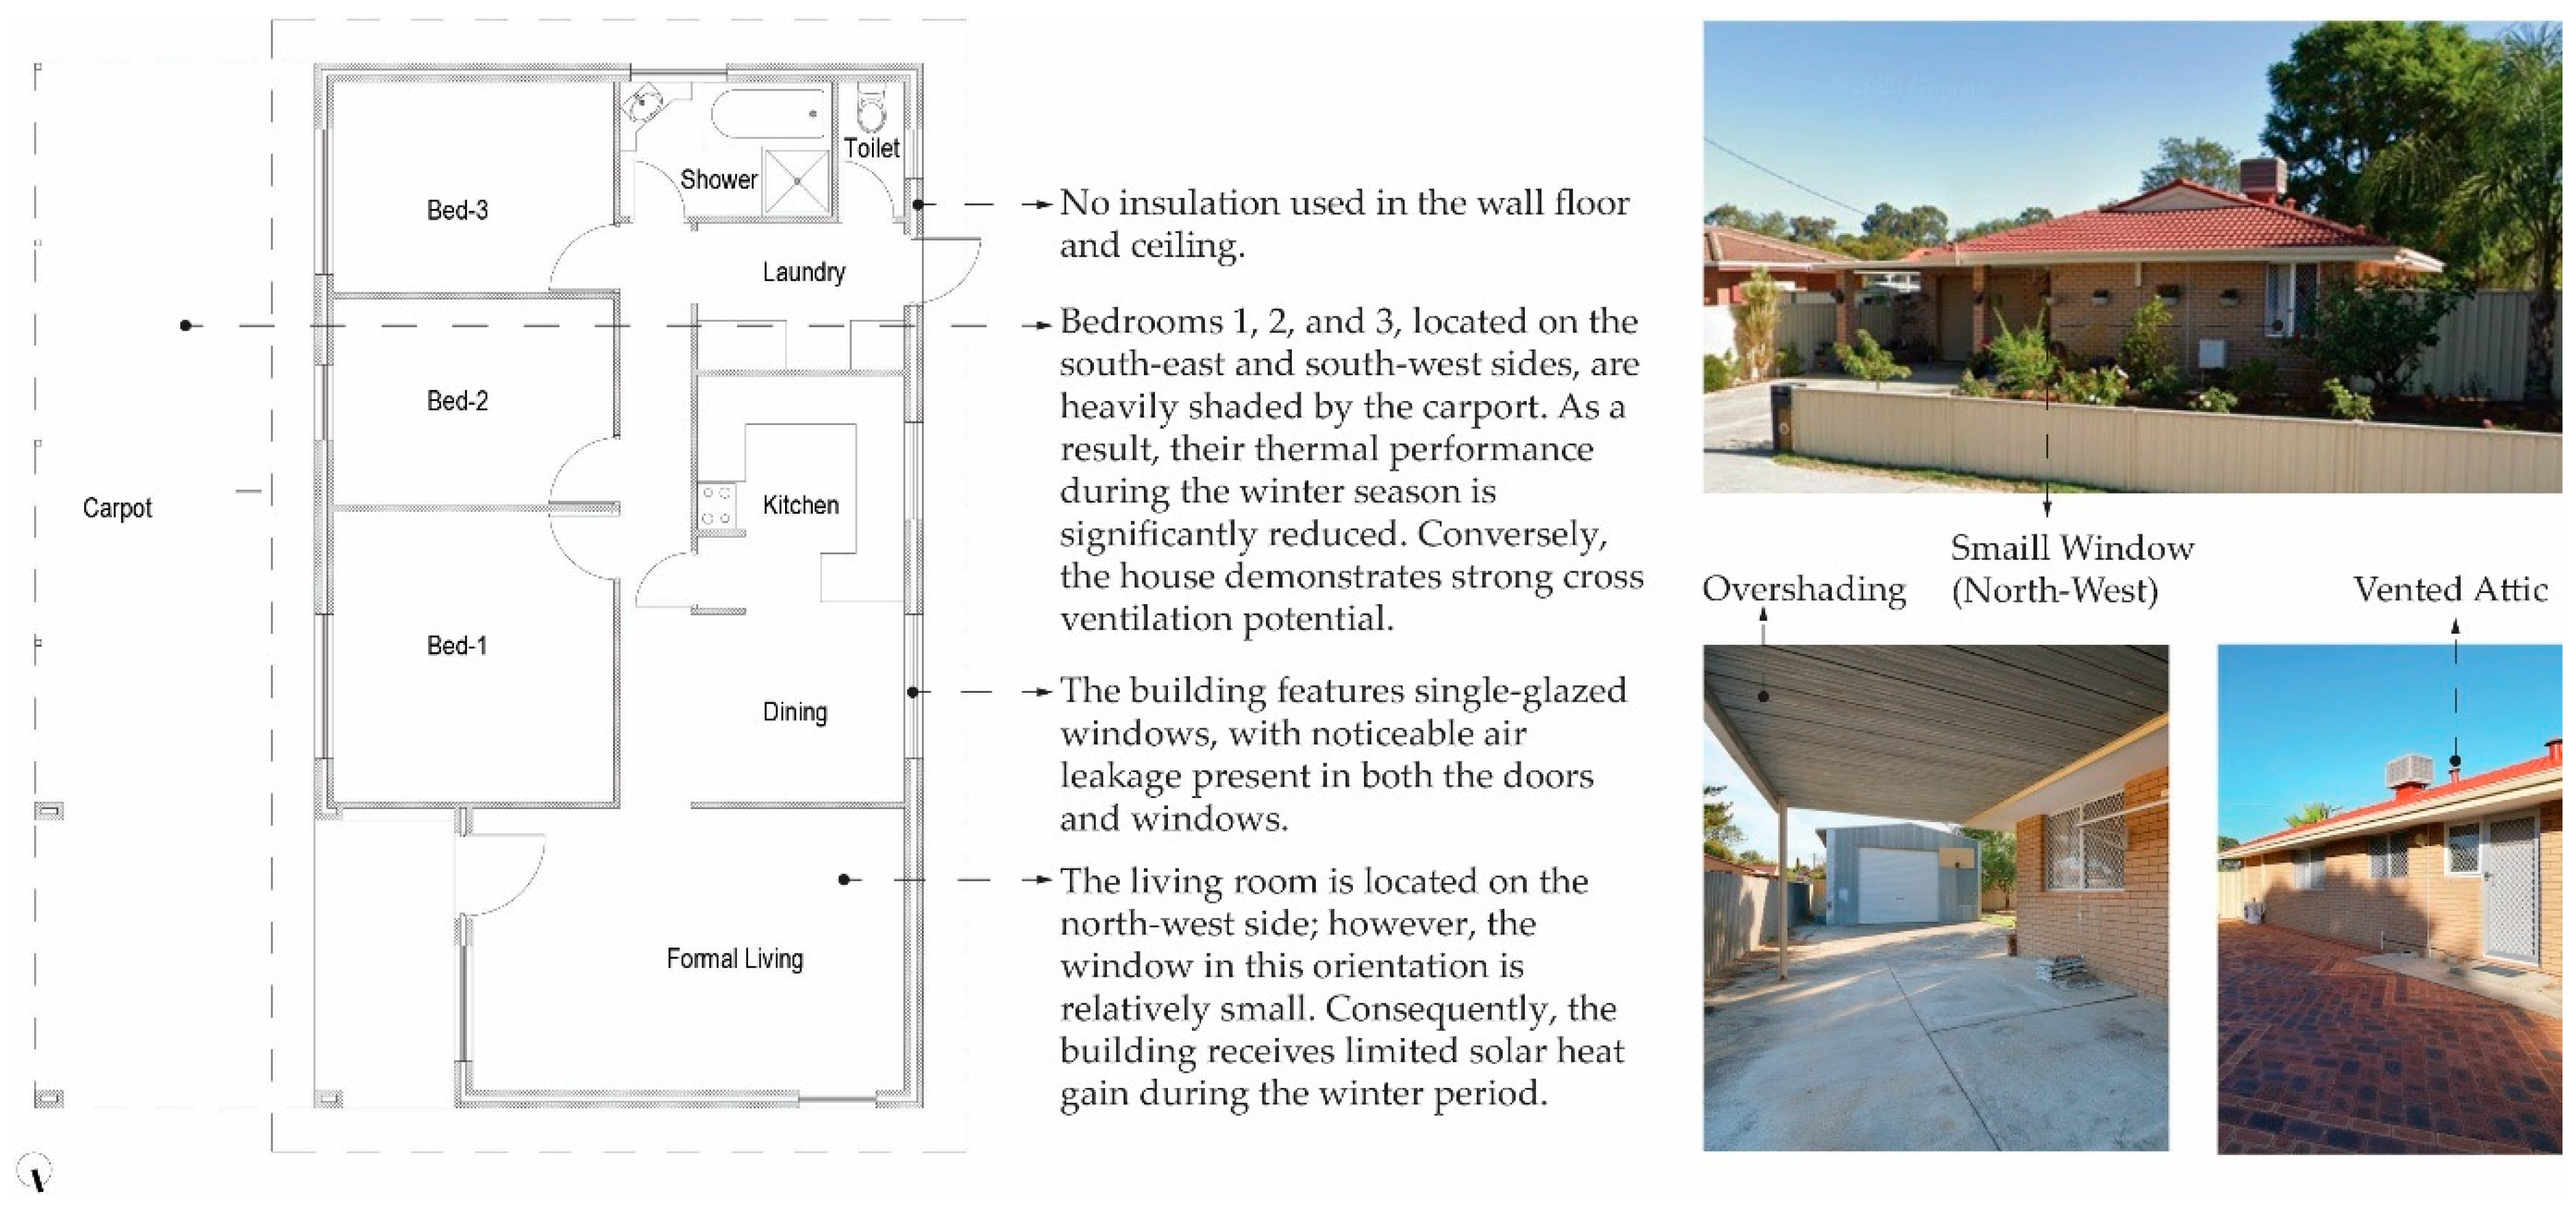
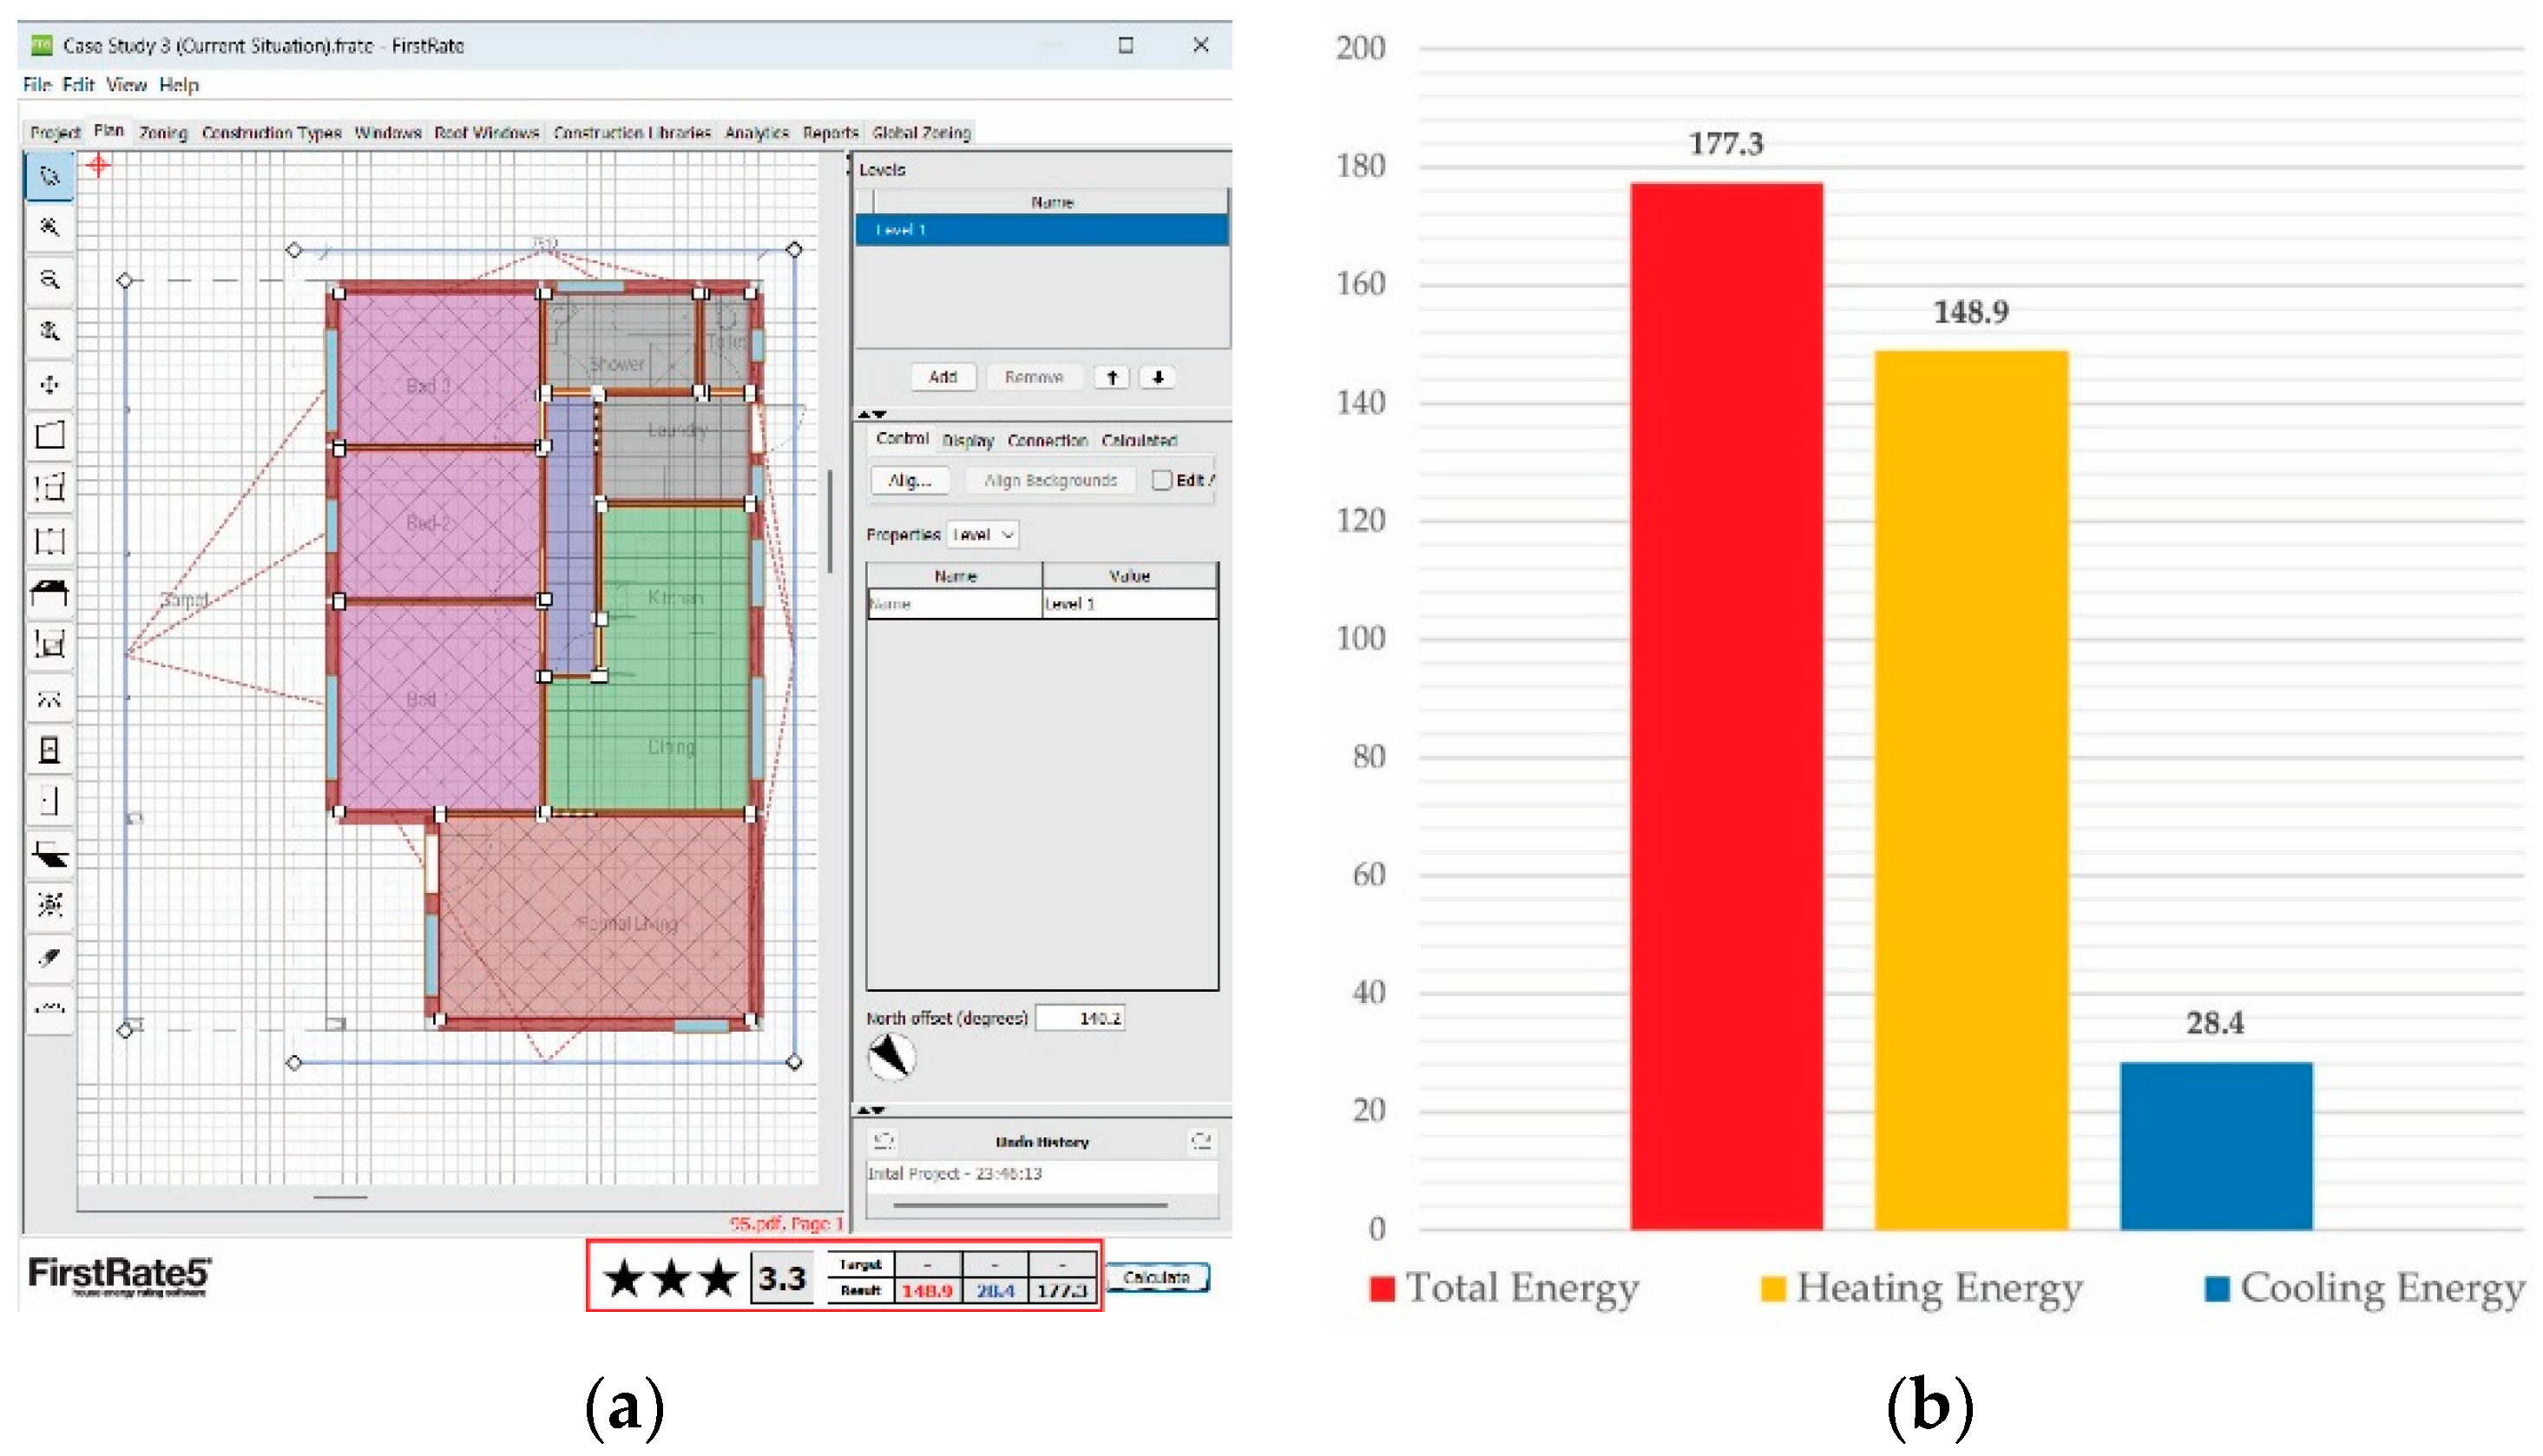
4.3.2. Case Study 3
4.4. Overall Findings from Case Study Buildings
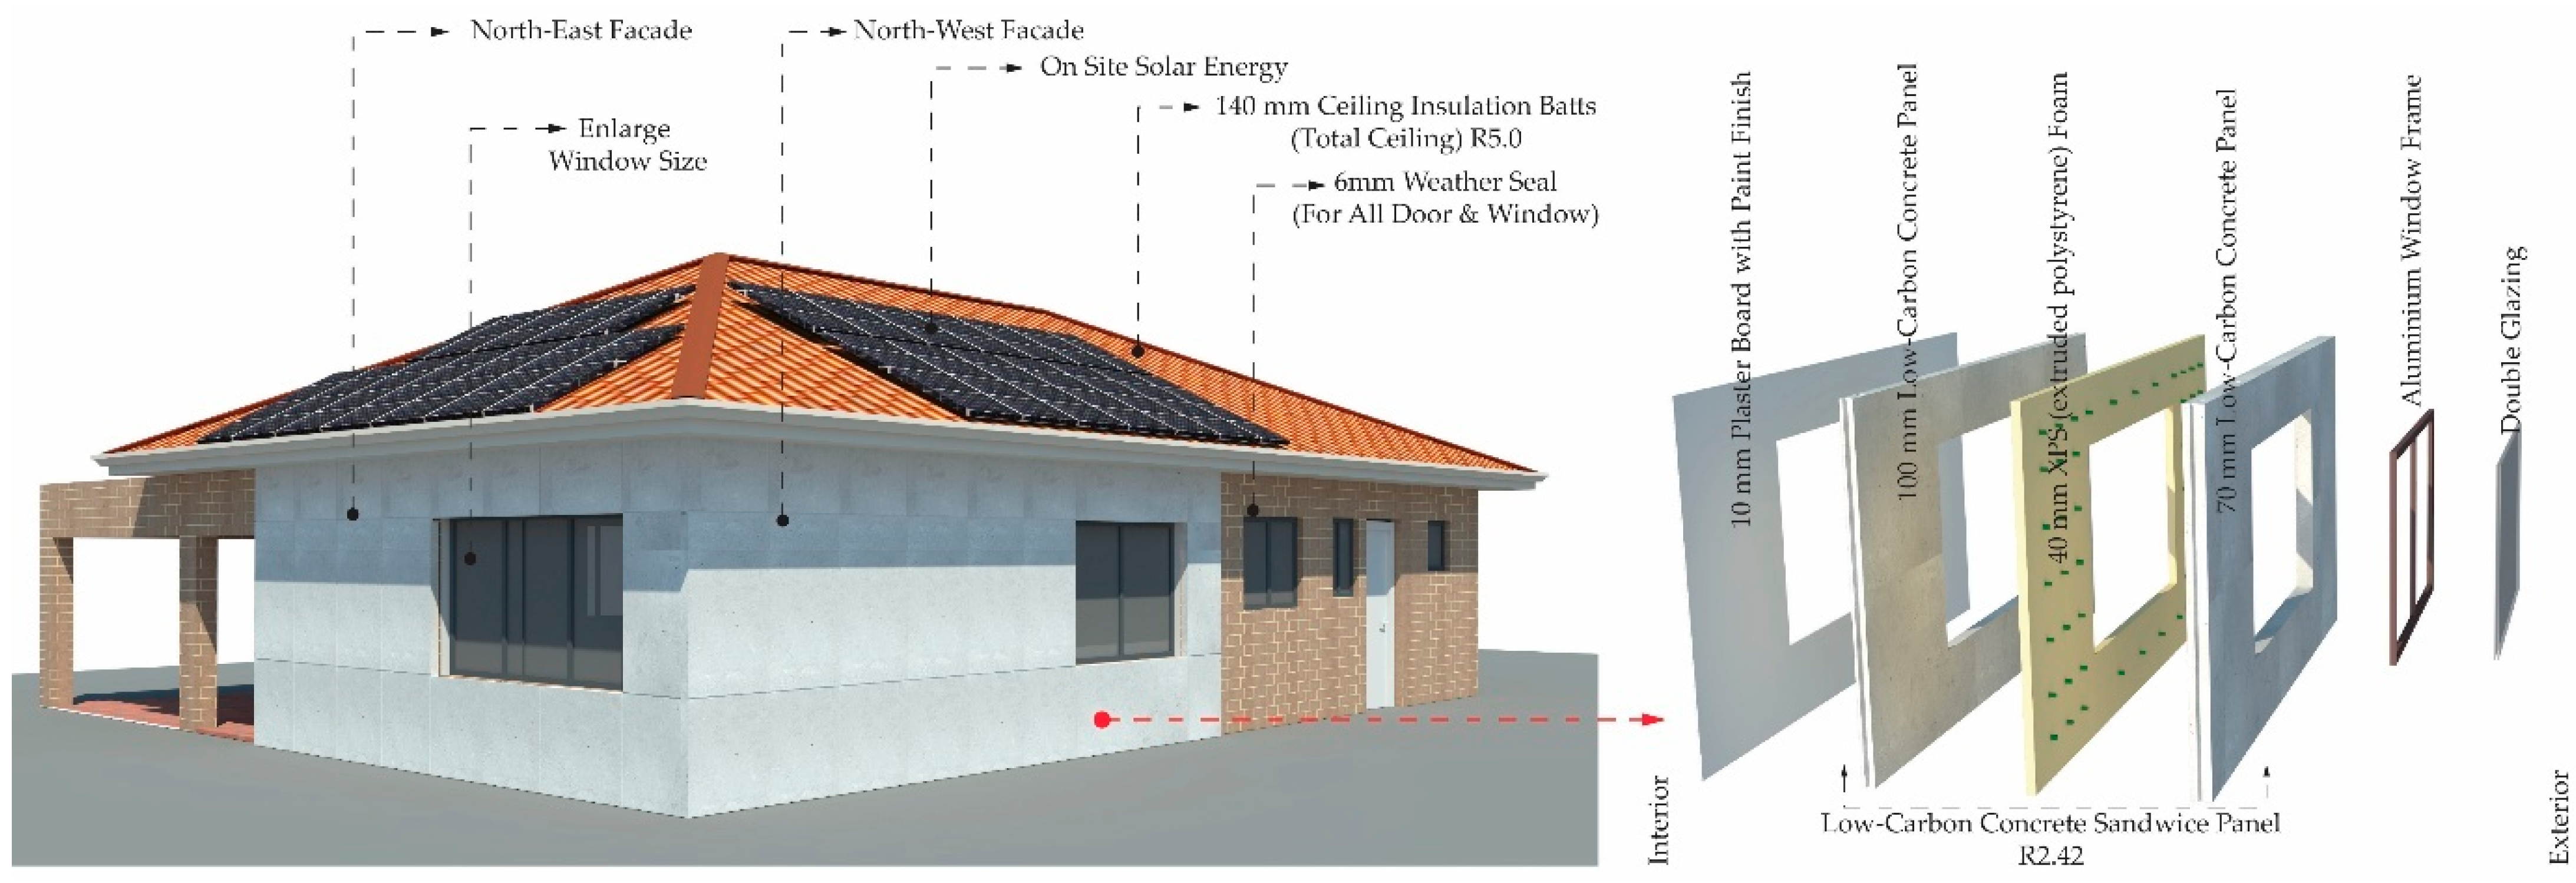
4.5. Proposed Optimum Retrofitting Options for Case Study Buildings
4.5.1. Case Study 1
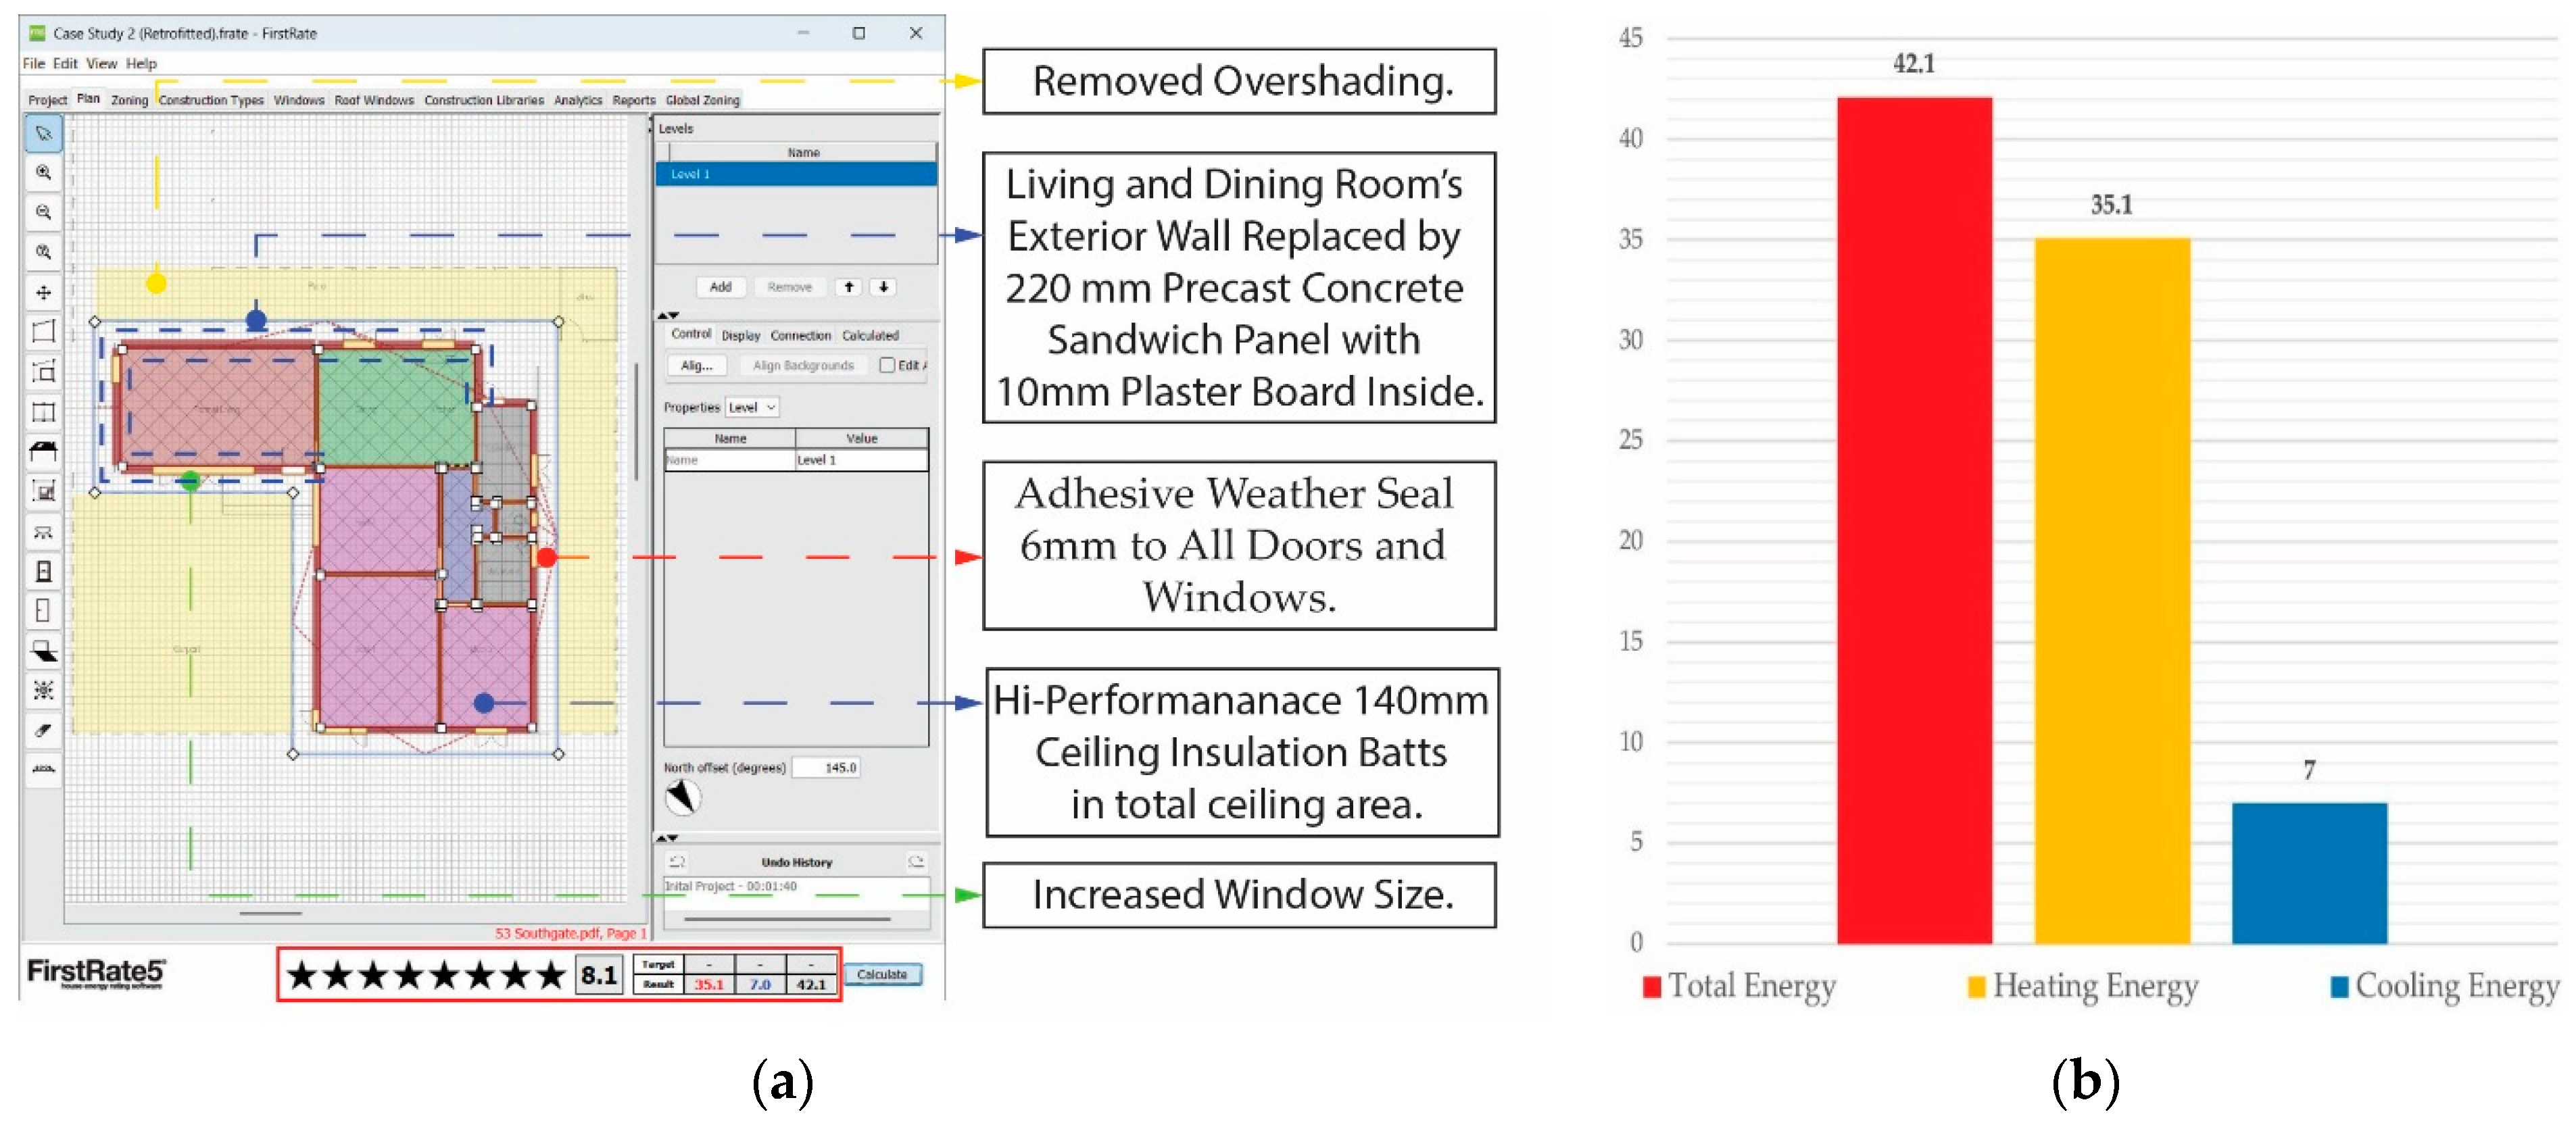
4.5.2. Case Study 2
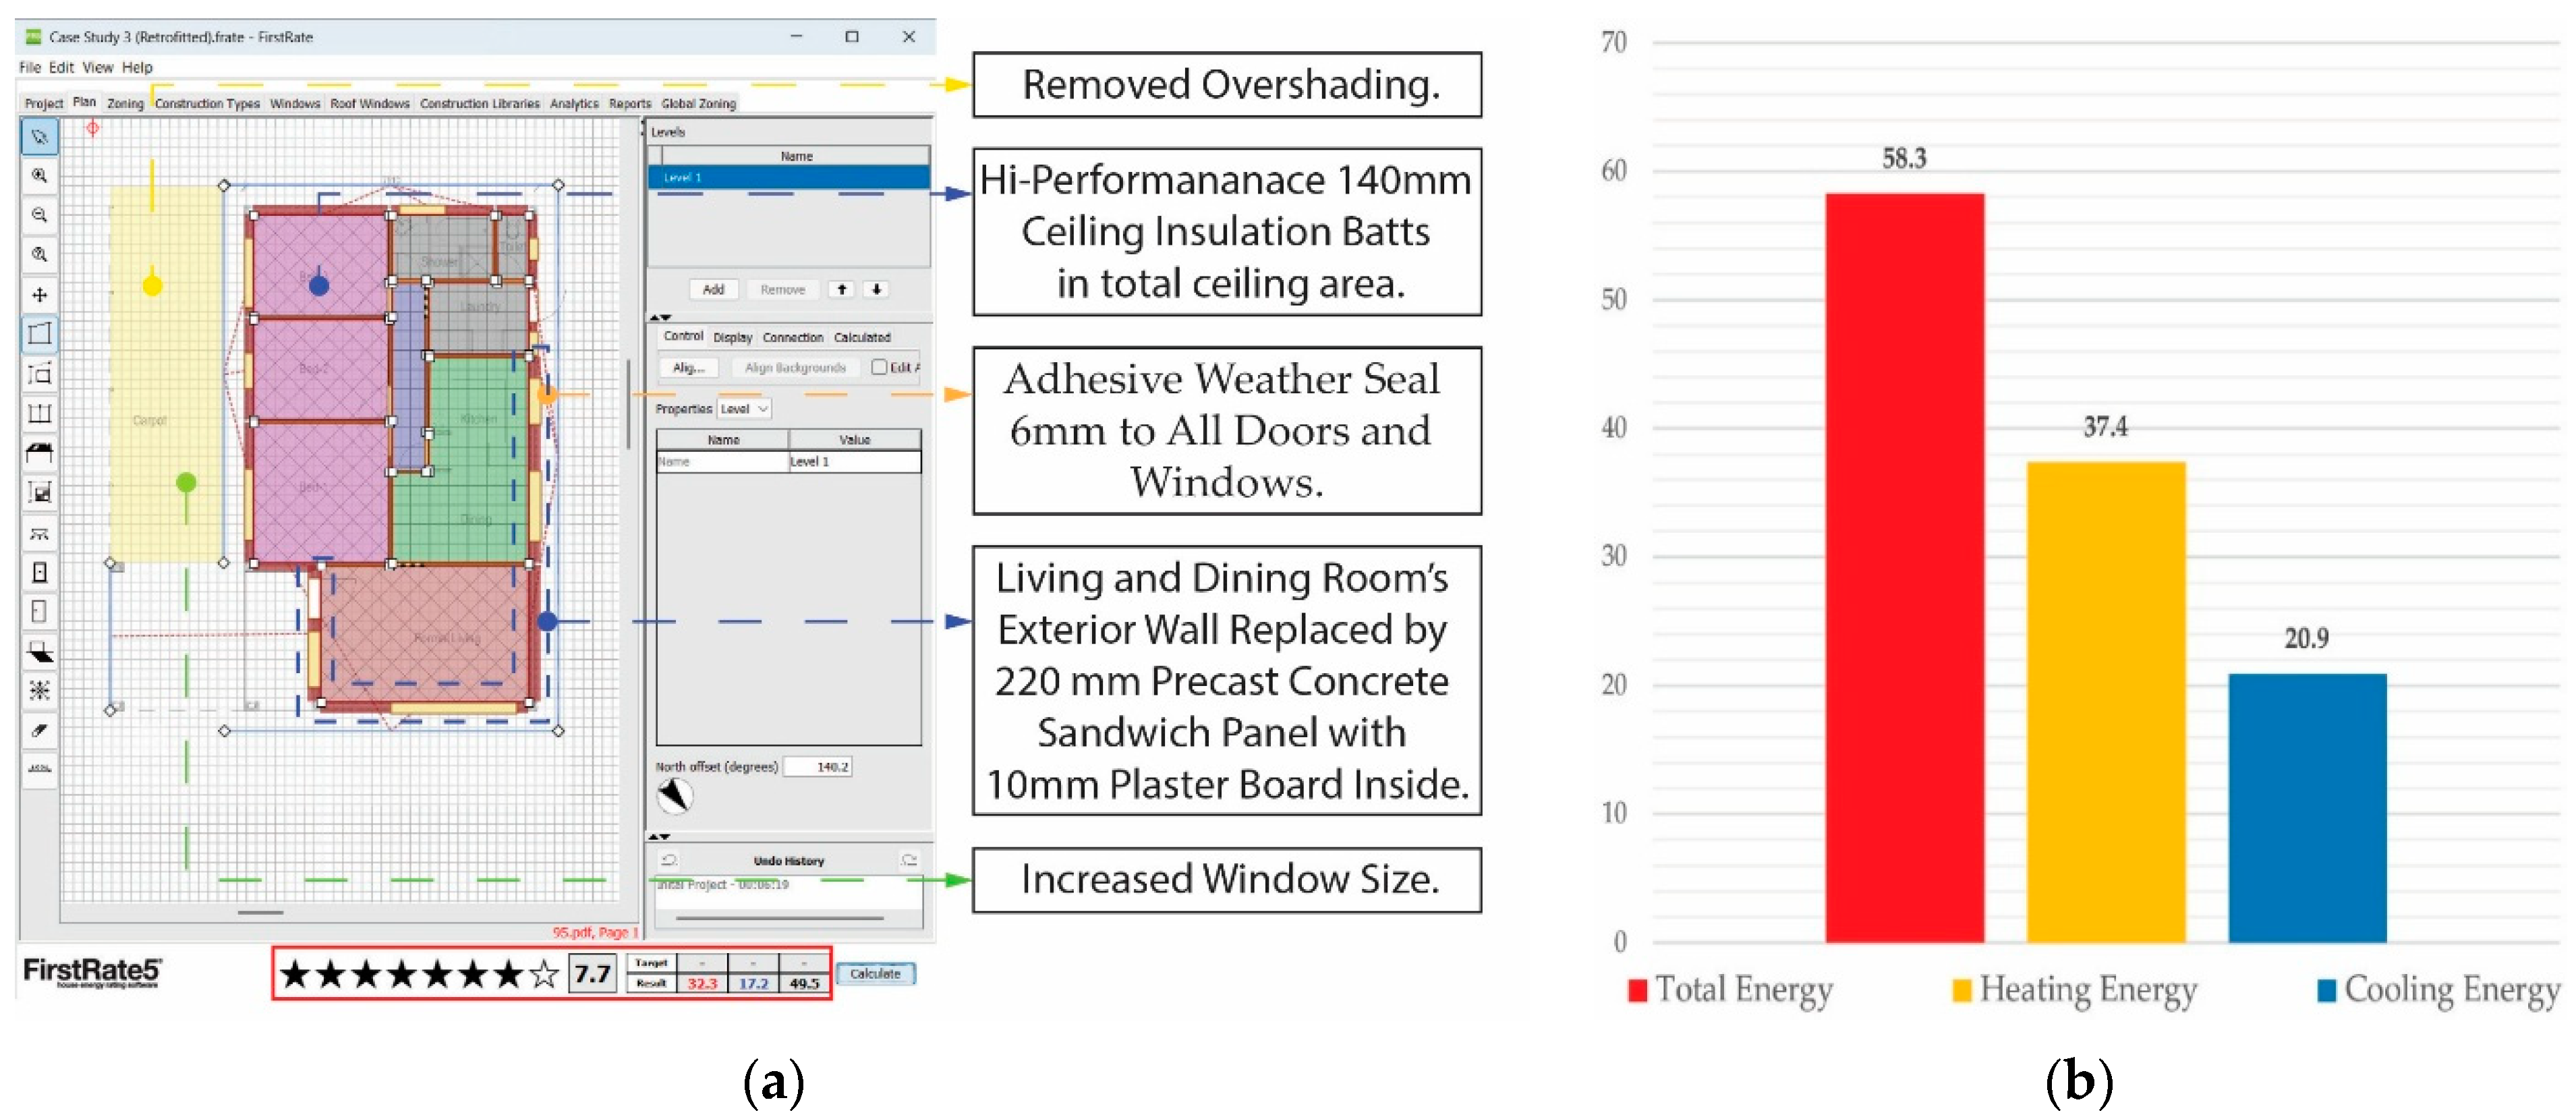
4.5.3. Case Study 3
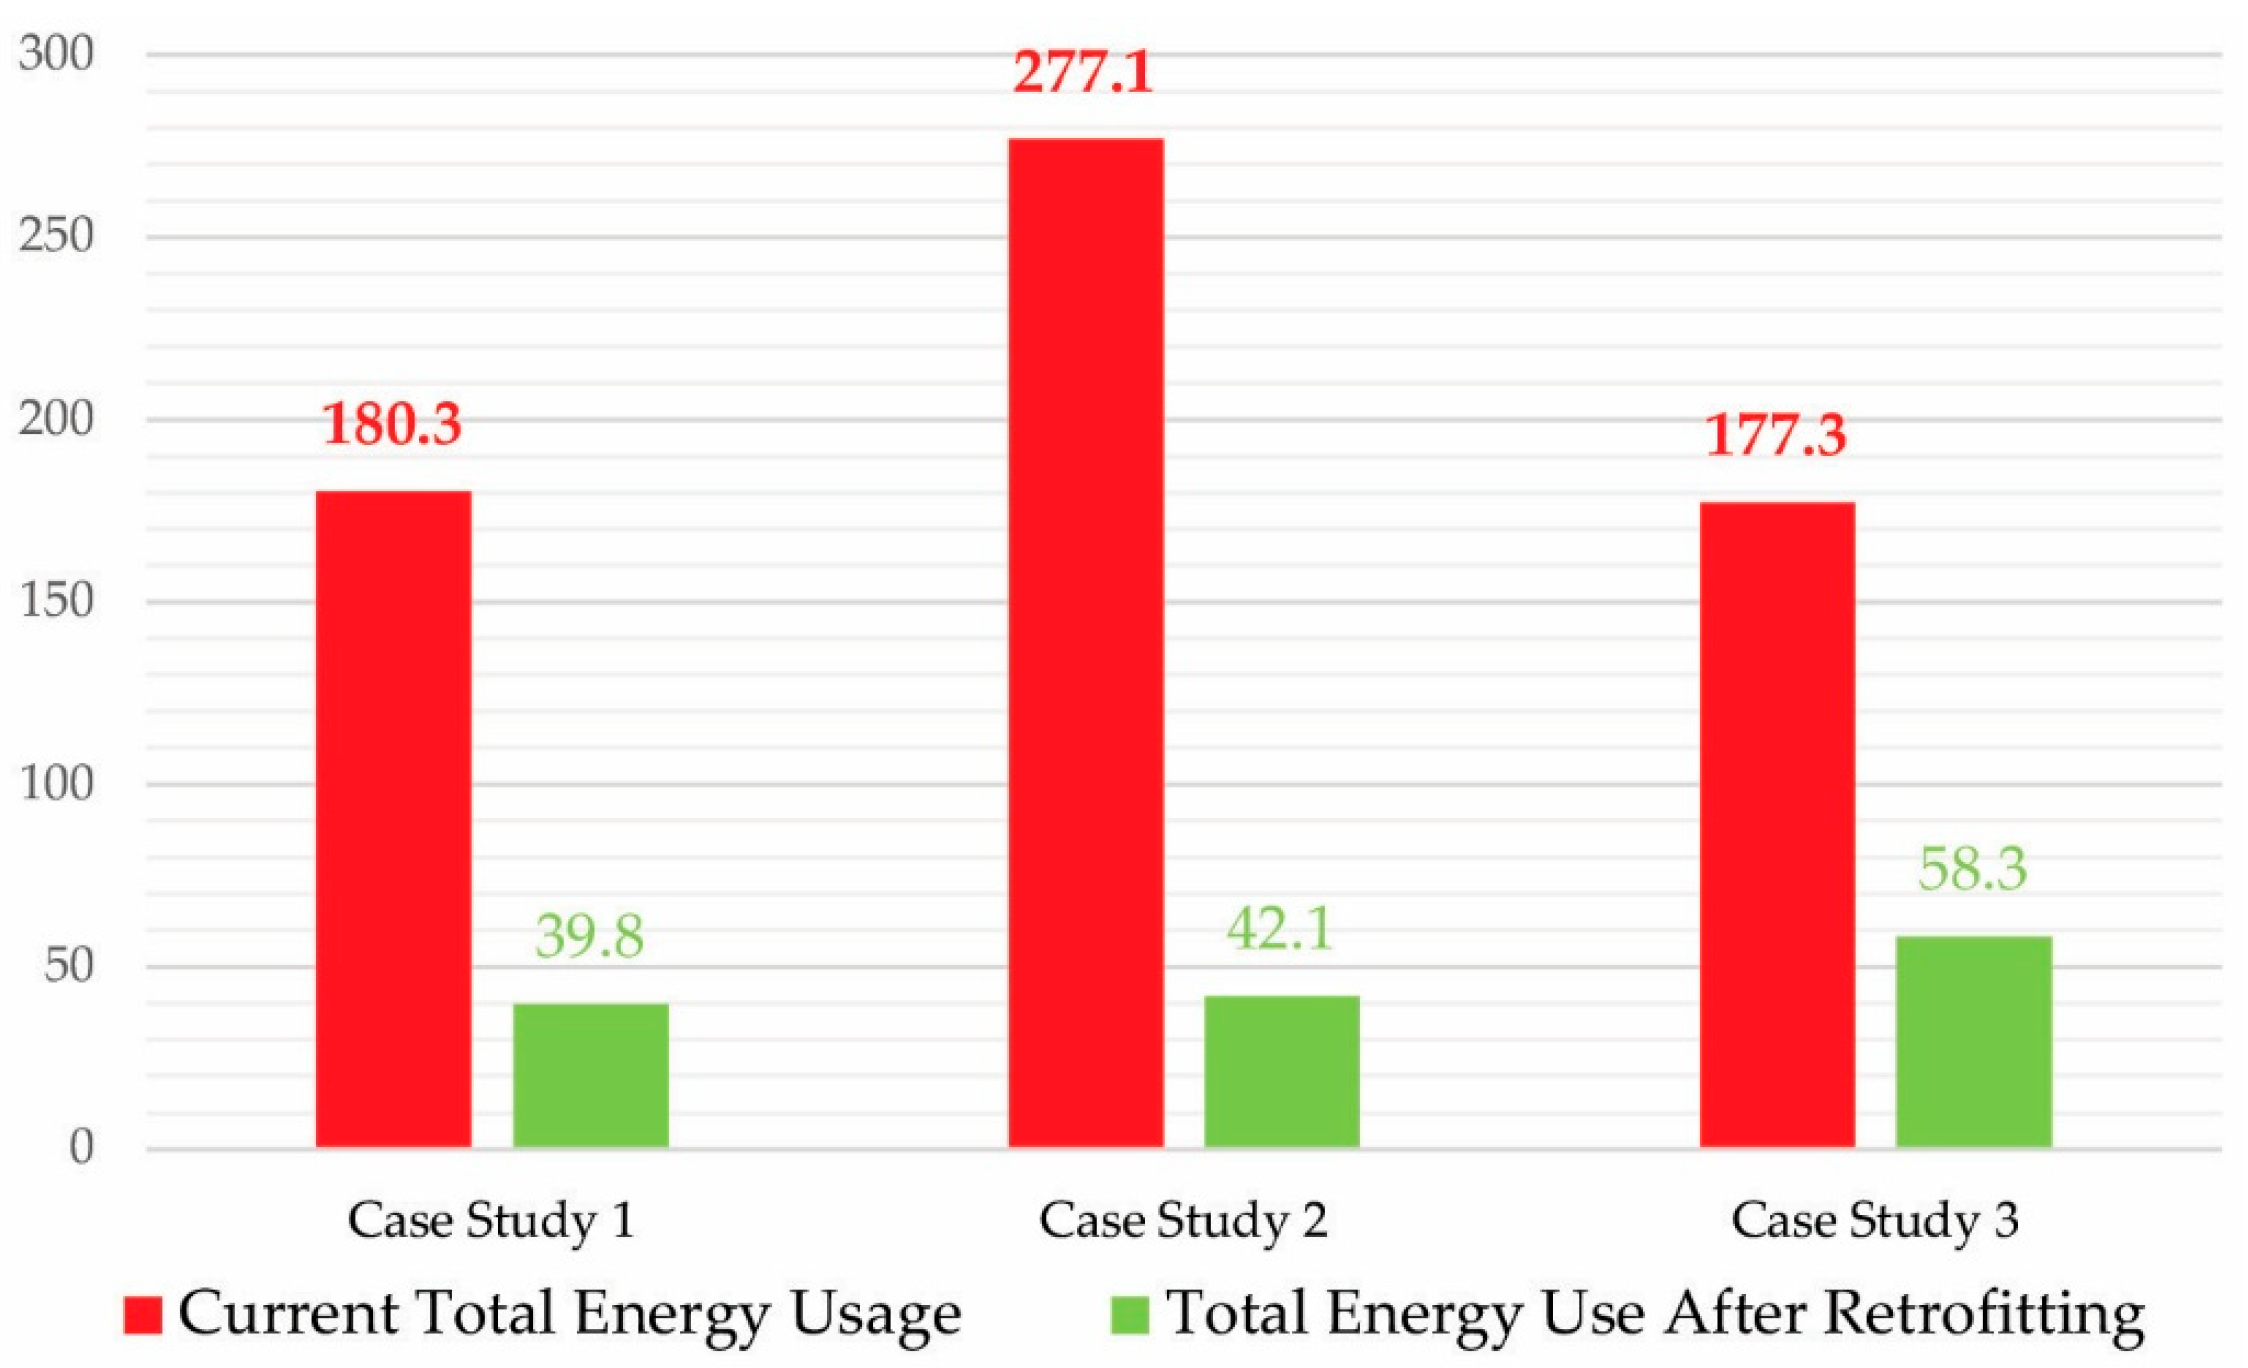
4.6. Comparative Analysis: Before and After Retrofitting of Case Study Buildings
5. Discussion
6. Conclusions
Author Contributions
Funding
Institutional Review Board Statement
Informed Consent Statement
Data Availability Statement
Acknowledgments
Conflicts of Interest
Appendix A
Appendix B
- ELECTRICITY CONSUMPTION AND CARBON EMISSION CALCULATION
- Current Condition (Case Study Houses): From Simulation
- After Retrofitting: From Simulation
- Western Australia Scenario:
- Australia Scenario:
- Emission Target For Australia:
- Emission Reduction Achieved by Retrofitting:
References
- GABC. Not Just Another Brick in the Wall: The Solutions Exist. Scaling Them Will Build on Progress and Cut Emissions Fast. New York. 2025. Available online: https://globalabc.org/sites/default/files/2025-03/Global-Status-Report-2024_2025.pdf (accessed on 3 September 2025).
- UNEP. Beyond Foundations: Mainstreaming Sustainable Solutions to Cut Emissions from the Buildings Sector. New York. 2024. Available online: https://globalabc.org/sites/default/files/2024-11/global_status_report_buildings_construction_2023.pdf (accessed on 29 September 2025).
- Masson-Delmotte, V.; Zhai, P.; Pörtner, H.-O.; Roberts, D.; Skea, J.; Shukla, P.R.; Pirani, A.; Moufouma-Okia, W.; Péan, C.; Pidcock, R.; et al. (Eds.) Global Warming of 1.5 °C: IPCC Special Report on Impacts of Global Warming of 1.5 °C Above Pre-Industrial Levels in Context of Strengthening Response to Climate Change, Sustainable Development, and Efforts to Eradicate Poverty; Cambridge University Press: Cambridge, UK; New York, NY, USA, 2018. [Google Scholar]
- ACT. Climate Change Authority Emissions Reduction Plan 2024. 2024. Available online: https://www.climatechangeauthority.gov.au/sites/default/files/documents/2024-10/CCA%20Emissions%20Reduction%20Plan%202024.pdf (accessed on 3 September 2025).
- Department of Climate Change Energy the Environment and Water. Buildings. Available online: https://www.dcceew.gov.au/energy/energy-efficiency/buildings? (accessed on 3 September 2025).
- Dadzie, J.; Runeson, G.; Ding, G.; Bondinuba, F.K. Barriers to Adoption of Sustainable Technologies for Energy-Efficient Building Upgrade—Semi-Structured Interviews. Buildings 2018, 8, 57. [Google Scholar] [CrossRef]
- Whitehouse, M.; Osmond, P.; Daly, D.; Kokogiannakis, G.; Jones, D.; Picard-Bromilow, A.; Cooper, P. (Low Carbon Living CRC); Guide to Low Carbon Residential Buildings—Retrofit; Low Carbon Living CRC: Sydney, Australia, 2018; Available online: https://apo.org.au/sites/default/files/resource-files/2019-05/apo-nid235556.pdf (accessed on 9 May 2024).
- ABS. Housing: Census. Available online: https://www.abs.gov.au/statistics/people/housing/housing-census/latest-release? (accessed on 3 September 2025).
- NatHERS. Home Energy Ratings. 2021. Available online: https://www.nathers.gov.au/owners-and-builders/home-energy-star-ratings (accessed on 7 November 2023).
- ABS. Greater Perth. 2021. Available online: https://www.abs.gov.au/census/find-census-data/quickstats/2021/5GPER (accessed on 19 September 2025).
- Nicholas, J. Why so many Australian homes are either too hot or too cold. In The Guardian; Guardian News & Media (GNM): London, UK, 2024; Available online: https://www.theguardian.com/news/ng-interactive/2024/jul/03/why-so-many-australian-homes-are-either-too-hot-or-too-cold (accessed on 10 September 2025).
- Australian Government. Home Energy Ratings Disclosure Framework Version 1; Canberra. 2024. Available online: https://www.energy.gov.au/sites/default/files/2024-07/home-energy-ratings-disclosure-framework-version-1.pdf (accessed on 5 September 2025).
- Rajagopalan, P.; Chen, D.; Ambrose, M. Investigating envelope retrofitting potential and resilience of Australian residential buildings—A stock modelling approach. Energy Build. 2024, 325, 114990. [Google Scholar] [CrossRef]
- Moore, T.; Berry, S.; Ambrose, M. Aiming for mediocrity: The case of australian housing thermal performance. Energy Policy 2019, 132, 602–610. [Google Scholar] [CrossRef]
- DCCEEW. Residential Buildings. Available online: https://www.dcceew.gov.au/energy/energy-efficiency/buildings/residential-buildings (accessed on 26 September 2025).
- Mills, B.; Schleich, J. Household transitions to energy efficient lighting. Energy Econ. 2014, 46, 151–160. [Google Scholar] [CrossRef]
- Solar Calculator. Solar Panel Efficiency. Available online: https://solarcalculator.com.au/solar-panel-efficiency/ (accessed on 26 September 2025).
- Solar Energy Masters. Benefits of Solar Panels. Available online: https://solarem.com.au/benefits-of-solar-panels/ (accessed on 26 September 2025).
- Dean, T.; Mortensen, J.; Partington, N.; Wren, M. Slattery Embodied Carbon Series: Retrofitting Reimagined. 2024. Available online: https://slattery.com.au/wp-content/uploads/2024/03/Slattery-carbon-planning-06-Retrofitting-reimagined-web.pdf (accessed on 5 September 2025).
- Green Building Council Australia. Our Homes Weigh a Tonne (of Carbon Per Square Metre): A Report Quantifying the Upfront Carbon in Australian Houses. 2025. Available online: https://www.cefc.com.au/media/d4kf04mx/gbca-homes-report.pdf (accessed on 20 September 2025).
- Baeli, M. Residential Retrofit: 20 Case Studies; RIBA Publishing, Ed.; RIBA Publishing: London, UK, 2014; Available online: https://www.ribaj.com/intelligence/residential-retrofit-20-case-studies (accessed on 10 January 2024).
- LETI (London Energy Transformation Initiative). LETI Climate Emergency Retrofit Guide: How Existing Homes Can Be Adapted to Meet UK Climate Targets; London Energy Transformation Initiative: London, UK, 2021; Available online: https://www.leti.uk/_files/ugd/252d09_c71428bafc3d42fbac34f9ad0cd6262b.pdf? (accessed on 20 January 2024).
- Biloria, N. Keen to Retrofit Your Home to Save Energy? University of Technology Sydney: Sydney, Austrila, 2022; Available online: https://www.uts.edu.au/news/2022/06/keen-retrofit-your-home-save-energy? (accessed on 10 January 2024).
- ECCMC. Update to the Trajectory for Low Energy Buildings. 2025. Available online: https://www.energy.gov.au/sites/default/files/2025-08/update-to-the-trajectory-for-low-energy-buildings.pdf (accessed on 20 September 2025).
- IPEEC. Existing Building Energy Efficiency Renovation: International Review of Regulatory Policies. 2017. Available online: https://www.dcceew.gov.au/sites/default/files/documents/existing-building-energy-effciency-renovation-international-review-regulatory-policies.pdf (accessed on 9 May 2024).
- Yang, X.; Chen, Z.; Zou, Y.; Wan, F. Improving the Energy Performance and Economic Benefits of Aged Residential Buildings by Retrofitting in Hot-Humid Regions of China. Energies 2023, 16, 4981. [Google Scholar] [CrossRef]
- Alavirad, S.; Mohammadi, S.; Hoes, P.-J.; Xu, L.; Hensen, J.L.M. Future-Proof Energy-Retrofit strategy for an existing Dutch neighbourhood. Energy Build. 2022, 260, 111914. [Google Scholar] [CrossRef]
- ABS. Climate Zone. Available online: https://www.abs.gov.au/ausstats/abs@.nsf/Lookup/4671.0main+features172012#:~:text=Zone%205%20%E2%80%93%20Warm%20temperate%20(low,hot%20summers%20with%20moderate%20humidity (accessed on 7 November 2023).
- Basińska, M.; Kaczorek, D.; Koczyk, H. Economic and Energy Analysis of Building Retrofitting Using Internal Insulations. Energies 2021, 14, 2446. [Google Scholar] [CrossRef]
- Ballarini, I.; Corrado, V.; Madonna, F.; Paduos, S.; Ravasio, F. Energy refurbishment of the Italian residential building stock: Energy and cost analysis through the application of the building typology. Energy Policy 2017, 105, 148–160. [Google Scholar] [CrossRef]
- Dehwah, A.H.A.; Krarti, M. Cost-benefit analysis of retrofitting attic-integrated switchable insulation systems of existing US residential buildings. Energy 2021, 221, 119840. [Google Scholar] [CrossRef]
- Lingard, J. Residential retrofit in the UK: The optimum retrofit measures necessary for effective heat pump use. Build. Serv. Eng. Res. Technol. 2021, 42, 279–292. [Google Scholar] [CrossRef]
- Ferreira, M.; Almeida, M.; Rodrigues, A.; Silva, S.M. Comparing cost-optimal and net-zero energy targets in building retrofit. Build. Res. Inf. 2016, 44, 188–201. [Google Scholar] [CrossRef]
- Leila, M.; Alidoost, S.; Norouzi, F.; Sattary, S.; Banihashemi, S. Trombe wall’s thermal and energy performance-A retrofitting approach for residential buildings in arid climate of Yazd, Iran. J. Renew. Sustain. Energy 2022, 14, 045101. [Google Scholar] [CrossRef]
- Aldabesh, A.; Soufi, J.; Omer, S.; Haredy, A. Unlocking the Residential Retrofitting Potential in a Three-Degree World: A Holistic Approach to Passive Design in Hot Climates. Buildings 2021, 11, 228. [Google Scholar] [CrossRef]
- Hejtmánek, P.; Sojková, K.; Volf, M.; Lupíšek, A. Development of a Modular Retrofitting System for Residential Buildings and Experience from Pilot Installation. IOP Conf. Ser. Earth Environ. Sci. 2019, 290, 012132. [Google Scholar] [CrossRef]
- Tushar, Q.; Zhang, G.; Bhuiyan, M.A.; Navaratnam, S.; Giustozzi, F.; Hou, L. Retrofit of Building Façade Using Precast Sandwich Panel: An Integrated Thermal and Environmental Assessment on BIM-Based LCA. Buildings 2022, 12, 2098. [Google Scholar] [CrossRef]
- Albatayneh, A.; Albadaineh, R.; Juaidi, A.; Abdallah, R.; Zabalo, A.; Manzano-Agugliaro, F. Enhancing the Energy Efficiency of Buildings by Shading with PV Panels in Semi-Arid Climate Zone. Sustainability 2022, 14, 17040. [Google Scholar] [CrossRef]
- Sedaghat, A.; Kalbasi, R.; Narayanan, R.; Mehdizadeh, A.; Soleimani, S.M.; Ashtian Malayer, M.; Iyad Al-Khiami, M.; Salem, H.; Hussam, W.K.; Sabati, M.; et al. Integrating solar PV systems for energy efficiency in portable cabins: A case study in Kuwait. Sol. Energy 2024, 277, 112715. [Google Scholar] [CrossRef]
- Yin, Q.; Li, A.; Han, C. The Role of Solar Photovoltaic Roofs in Energy-Saving Buildings: Research Progress and Future Development Trends. Buildings 2024, 14, 3091. [Google Scholar] [CrossRef]
- Albatayneh, A.; Albadaineh, R.; Karasneh, D. The impact of PV panels on cooling and heating loads of residential buildings in a humid subtropical climate zone. Energy Explor. Exploit. 2023, 41, 1762–1778. [Google Scholar] [CrossRef]
- Almushaikah, A.S.; Almasri, R.A. Evaluating the potential energy savings of residential buildings and utilizing solar energy in the middle region of Saudi Arabia—Case study. Energy Explor. Exploit. 2021, 39, 1457–1490. [Google Scholar] [CrossRef]
- Joshi, M.; Buddhi, D.; Singh, R. Effect of Overhang Shade on the Solar Heat Gain through Window in Composite Climatic in Mid-Western India. J. Sci. Ind. Res. 2022, 81, 1098–1106. [Google Scholar] [CrossRef]
- Koç, S.G.; Maçka Kalfa, S. The effects of shading devices on office building energy performance in Mediterranean climate regions. J. Build. Eng. 2021, 44, 102653. [Google Scholar] [CrossRef]
- Karthick, S.; Sivakumar, A.; Bhanu Chander, S.; Bharathwaj, S.; Kumar, B.V.V.N. Effect of Building Orientation, Window Glazing, and Shading Techniques on Energy Performance and Occupant Comfort for a Building in Warm-Humid Climate. In Recent Advances in Energy Technologies; Springer Nature: Singapore, 2023. [Google Scholar]
- Lu, W. Dynamic Shading and Glazing Technologies: Improve Energy, Visual, and Thermal Performance. Energy Built Environ. 2024, 5, 211–229. [Google Scholar] [CrossRef]
- Alhuwayil, W.K.; Abdul Mujeebu, M.; Algarny, A.M.M. Impact of external shading strategy on energy performance of multi-story hotel building in hot-humid climate. Energy 2019, 169, 1166–1174. [Google Scholar] [CrossRef]
- Nazari, S.; Keshavarz Mirza Mohammadi, P.; Sareh, P. A multi-objective optimization approach to designing window and shading systems considering building energy consumption and occupant comfort. Eng. Rep. 2023, 5, e12726. [Google Scholar] [CrossRef]
- Vishnubhotla, L.V.; Shanmugam, S.; Tadepalli, S. Developing climate-responsive passive strategies for residential envelopes in the warm humid climate of South India. Open House Int. 2022, 47, 428–450. [Google Scholar] [CrossRef]
- Ahmad, A.; Prakash, O.; Brar, L.S.; Irshad, K.; Hasnain, S.M.M.; Paramasivam, P.; Ayanie, A.G. Effect of Wall, Roof, and Window-to-Wall Ratio on the Cooling and Heating Load of a Building in India. Energy Sci. Eng. 2025, 13, 1255–1279. [Google Scholar] [CrossRef]
- Alsehail, A.; Almhafdy, A. The Effect of Window-to-Wall Ratio (WWR) and Window Orientation (WO) on the Thermal Performance: A preliminary overview. Environ.-Behav. Proc. J. 2020, 5, 165–173. [Google Scholar] [CrossRef]
- Jayaram, J.; Sundaram, L. Evaluation of Window-to-Wall Ratio, Shading Devices, and Site Vegetation for Enhanced Daylight Availability—Optimization of Fenestration for School Classrooms in Chennai. Preprints 2025. [Google Scholar] [CrossRef]
- Alwetaishi, M. Energy performancein residential buildings: Evaluationof the potential of buildingdesignand environmental parameter. Ain Shams Eng. J. 2022, 13, 101708. [Google Scholar] [CrossRef]
- Murano, G.; Magrini, A. The relation between nZEB requirements, local climate, and building features. The nZEB model application to two sample buildings, in different climatic conditions. Model. Meas. Control B 2018, 87, 180–187. [Google Scholar] [CrossRef]
- Amani, N. Energy efficiency of residential buildings using thermal insulation of external walls and roof based on simulation analysis. Energy Storage Sav. 2025, 4, 48–55. [Google Scholar] [CrossRef]
- Wang, X.; Xing, K.; Feng, X.; Li, Z. Low-energy building insulation through external wall modification: A case study on Lanzhou Academy of Painting in China. Int. J. Low-Carbon Technol. 2024, 19, 1547–1560. [Google Scholar] [CrossRef]
- Abdulsada, G.K.; Salih, T.W.M. The impact of efficient insulation on thermal performance of building elements in hot arid region. Renew. Energy Environ. Sustain. 2022, 7, 2. [Google Scholar] [CrossRef]
- Jouhara, H.; Yang, J. Energy efficient HVAC systems. Energy Build. 2018, 179, 83–85. [Google Scholar] [CrossRef]
- Ebrahimi, P.; Ridwana, I.; Nassif, N. Solutions to Achieve High-Efficient and Clean Building HVAC Systems. Buildings 2023, 13, 1211. [Google Scholar] [CrossRef]
- Brudermueller, T.; Potthoff, U.; Fleisch, E.; Wortmann, F.; Staake, T. Estimation of energy efficiency of heat pumps in residential buildings using real operation data. Nat. Commun. 2025, 16, 2834. [Google Scholar] [CrossRef]
- Franco, A.; Miserocchi, L.; Testi, D. HVAC Energy Saving Strategies for Public Buildings Based on Heat Pumps and Demand Controlled Ventilation. Energies 2021, 14, 5541. [Google Scholar] [CrossRef]
- Emami Javanmard, M.; Ghaderi, S.F.; Sangari, M.S. Integrating energy and water optimization in buildings using multi-objective mixed-integer linear programming. Sustain. Cities Soc. 2020, 62, 102409. [Google Scholar] [CrossRef]
- Oneda, T.M.S.; Ghisi, E. Analysing the Water–Energy Nexus Considering Rainwater Harvesting in Buildings. Water 2025, 17, 1037. [Google Scholar] [CrossRef]
- Knutsson, J.; Knutsson, P. Water and energy savings from greywater reuse: A modelling scheme using disaggregated consumption data. Int. J. Energy Water Resour. 2021, 5, 13–24. [Google Scholar] [CrossRef]
- Rashid, F.L.; Al-Obaidi, M.A.; Al Maimuri, N.M.L.; Ameen, A.; Agyekum, E.B.; Chibani, A.; Kezzar, M. Mechanical Ventilation Strategies in Buildings: A Comprehensive Review of Climate Management, Indoor Air Quality, and Energy Efficiency. Buildings 2025, 15, 2579. [Google Scholar] [CrossRef]
- Arun, M.; Gopan, G. Effects of natural light on improving the lighting and energy efficiency of buildings: Toward low energy consumption and CO2 emission. Int. J. Low-Carbon Technol. 2025, 20, 1047–1056. [Google Scholar] [CrossRef]
- Giama, E. Review on Ventilation Systems for Building Applications in Terms of Energy Efficiency and Environmental Impact Assessment. Energies 2022, 15, 98. [Google Scholar]
- Zahed, F.; Pardakhti, A.; Motlagh, M.S.; Mohammad Kari, B.; Tavakoli, A. The effect of airtightness required in building energy conservation regulations on indoor and outdoor originated pollutants. Heliyon 2023, 9, e20378. [Google Scholar] [CrossRef]
- Ambrose, M.; Syme, M. Air Tightness of New Australian Residential Buildings. Procedia Eng. 2017, 180, 33–40. [Google Scholar] [CrossRef]
- Ghosh, A.; Sundaram, S.; Mallick, T.K. Colour properties and glazing factors evaluation of multicrystalline based semi-transparent Photovoltaic-vacuum glazing for BIPV application. Renew. Energy 2019, 131, 730–736. [Google Scholar] [CrossRef]
- Hannoudi, L.; Saleeb, N.; Dafoulas, G. The impact of glass properties on the energy efficiency and embodied carbon of multi-angled façade systems. J. Clean. Prod. 2024, 437, 140725. [Google Scholar] [CrossRef]
- Li, X.; Wu, Y. A review of complex window-glazing systems for building energy saving and daylight comfort: Glazing technologies and their building performance prediction. J. Build. Phys. 2025, 48, 496–540. [Google Scholar] [CrossRef]
- Lee, Y.-J.; Kim, S.-H.; Ryu, J.-H.; Lee, K.-H. Optimizing Window Glass Design for Energy Efficiency in South Korean Office Buildings: A Hierarchical Analysis Using Energy Simulation. Buildings 2023, 13, 2850. [Google Scholar] [CrossRef]
- Dudzińska, A. Efficiency of Solar Shading Devices to Improve Thermal Comfort in a Sports Hall. Energies 2021, 14, 3535. [Google Scholar] [CrossRef]
- Ibrahim, A.; Freewan, A.; Obeidat, A. An Evaluation Study of Shading Devices and Their Impact on the Aesthetic Perception vs. Their Energy Efficiency. J. Facade Des. Eng. 2023, 11, 037–060. [Google Scholar] [CrossRef]
- Avcı, P.; Ekici, B.; Kazanasmaz, Z.T. A review on adaptive and non-adaptive shading devices for sustainable buildings. J. Build. Eng. 2025, 100, 111701. [Google Scholar] [CrossRef]
- Pérez-Carramiñana, C.; González-Avilés, Á.B.; Castilla, N.; Galiano-Garrigós, A. Influence of Sun Shading Devices on Energy Efficiency, Thermal Comfort and Lighting Comfort in a Warm Semi-Arid Dry Mediterranean Climate. Buildings 2024, 14, 556. [Google Scholar] [CrossRef]
- de, S.; Letschert, V.; Agarwal, S.; Park, W.Y.; Kaggwa, U. Energy efficiency improves energy access affordability. Energy Sustain. Dev. 2022, 70, 560–568. [Google Scholar] [CrossRef]
- Blasch, J.E.; Filippini, M.; Kumar, N.; Martinez-Cruz, A.L. Boosting the choice of energy-efficient home appliances: The effectiveness of two types of decision support. Appl. Econ. 2022, 54, 3598–3620. [Google Scholar] [CrossRef]
- Elangovan, A.; Babu, M. Path to sustainability: Analyzing usage intention of energy-efficient appliances. Energy Nexus 2025, 18, 100406. [Google Scholar] [CrossRef]
- Nguyen, H.V.; Le, B.N.; Lim, W.M.; Dang-Van, T.; Nguyen, N. Consumer purchases of energy-efficient appliances: A systematic literature review and research agenda. Energy Effic. 2025, 18, 29. [Google Scholar] [CrossRef]
- Aflaki, A.; Mahyuddin, N.; Al-Cheikh Mahmoud, Z.; Baharum, M.R. A review on natural ventilation applications through building façade components and ventilation openings in tropical climates. Energy Build. 2015, 101, 153–162. [Google Scholar] [CrossRef]
- Ma, W.; Wang, X.; Shou, W.; Wang, J. Energy-efficient façade design of residential buildings: A critical review. Dev. Built Environ. 2024, 18, 100393. [Google Scholar] [CrossRef]
- Meng, X.; Huang, Y.; Cao, Y.; Gao, Y.; Hou, C.; Zhang, L.; Shen, Q. Optimization of the wall thermal insulation characteristics based on the intermittent heating operation. Case Stud. Constr. Mater. 2018, 9, e00188. [Google Scholar] [CrossRef]
- Ascione, F.; Bianco, N.; Maria Mauro, G.; Napolitano, D.F. Building envelope design: Multi-objective optimization to minimize energy consumption, global cost and thermal discomfort. Application to different Italian climatic zones. Energy 2019, 174, 359–374. [Google Scholar] [CrossRef]
- Petrosyan, A.L. Determination of optimal thermal insulation layer thickness of outer structures of buildings according to the load of heating and cooling system. IOP Conf. Ser. Mater. Sci. Eng. 2019, 698, 022058. [Google Scholar] [CrossRef]
- Pomada, M.; Kieruzel, K.; Ujma, A.; Palutkiewicz, P.; Walasek, T.; Adamus, J. Analysis of Thermal Properties of Materials Used to Insulate External Walls. Materials 2024, 17, 4718. [Google Scholar] [CrossRef]
- Bentoumi, L.; Bouacida, T.; Bessaïh, R.; Bouttout, A. Impact of thermal insulation on energy consumption in buildings. J. Therm. Eng. 2024, 10, 924–935. [Google Scholar] [CrossRef]
- Zhang, J.; Chen, P.; Chen, M.; Chen, Y. Analysis of Energy-Saving Effects of Different Building Exterior Wall Insulation Materials. In Environmental Governance, Ecological Remediation and Sustainable Development; Springer Nature: Cham, Switzerland, 2024. [Google Scholar]
- Moghaddam, S.A.; Serra, C.; Gameiro da Silva, M.; Simões, N. Comprehensive Review and Analysis of Glazing Systems towards Nearly Zero-Energy Buildings: Energy Performance, Thermal Comfort, Cost-Effectiveness, and Environmental Impact Perspectives. Energies 2023, 16, 6283. [Google Scholar] [CrossRef]
- Simko, T.; Moore, T. Optimal window designs for Australian houses. Energy Build. 2021, 250, 111300. [Google Scholar] [CrossRef]
- Chen, J.; Gong, Q.; Lu, L. Evaluation of passive envelope systems with radiative sky cooling and thermally insulated glazing materials for cooling. J. Clean. Prod. 2023, 398, 136607. [Google Scholar] [CrossRef]
- Ohlsson, K.E.A.; Nair, G.; Olofsson, T. Uncertainty in model prediction of energy savings in building retrofits: Case of thermal transmittance of windows. Renew. Sustain. Energy Rev. 2022, 168, 112748. [Google Scholar] [CrossRef]
- Vallati, A.; Di Matteo, M.; Fiorini, C.V. Retrofit Proposals for Energy Efficiency and Thermal Comfort in Historic Public Buildings: The Case of the Engineering Faculty’s Seat of Sapienza University. Energies 2023, 16, 151. [Google Scholar]
- Bouchlaghem, N. Optimising the design of building envelopes for thermal performance. Autom. Constr. 2000, 10, 101–112. [Google Scholar] [CrossRef]
- Xue, P.; Li, Q.; Xie, J.; Zhao, M.; Liu, J. Optimization of window-to-wall ratio with sunshades in China low latitude region considering daylighting and energy saving requirements. Appl. Energy 2019, 233–234, 62–70. [Google Scholar] [CrossRef]
- Troup, L.; Phillips, R.; Eckelman, M.J.; Fannon, D. Effect of window-to-wall ratio on measured energy consumption in US office buildings. Energy Build. 2019, 203, 109434. [Google Scholar] [CrossRef]
- Tawfeeq, H.; Qaradaghi, A.M.A. Optimising Window-to-Wall Ratio for Enhanced Energy Efficiency and Building Intelligence in Hot Summer Mediterranean Climates. Sustainability 2024, 16, 7342. [Google Scholar]
- Allouhi, A.; Boharb, A.; Saidur, R.; Kousksou, T.; Jamil, A. 5.1 Energy Auditing. In Comprehensive Energy Systems; Dincer, I., Ed.; Elsevier: Oxford, UK, 2018; pp. 1–44. [Google Scholar] [CrossRef]
- Al-Yasiri, Q.; Szabó, M. A short review on passive strategies applied to minimise the building cooling loads in hot locations. Analecta Tech. Szeged. 2021, 15, 20–30. [Google Scholar] [CrossRef]
- YourHome. Shading. Available online: https://www.yourhome.gov.au/passive-design/shading (accessed on 25 August 2025).
- Cuce, E. Role of airtightness in energy loss from windows: Experimental results from in-situ tests. Energy Build. 2017, 139, 449–455. [Google Scholar] [CrossRef]
- Insulation Extract. What Are the Requirements for Insulation in WA? 2024. Available online: https://www.insulationextract.com.au/post/what-are-the-requirements-for-insulation-in-wa (accessed on 15 September 2025).
- Baş, H. Energy-efficient house design in the mediterranean climate. E3S Web Conf. 2024, 546, 01003. [Google Scholar] [CrossRef]
- Goia, F. Search for the optimal window-to-wall ratio in office buildings in different European climates and the implications on total energy saving potential. Sol. Energy 2016, 132, 467–492. [Google Scholar] [CrossRef]
- V-Star Energy. Window-to-Wall Ratio. Available online: https://vstarenergy.com.au/2024/08/19/window-to-wall-ratio/ (accessed on 11 September 2025).
- Mohammed, A.; Tariq, M.A.U.R.; Ng, A.W.M.; Zaheer, Z.; Sadeq, S.; Mohammed, M.; Mehdizadeh-Rad, H. Reducing the Cooling Loads of Buildings Using Shading Devices: A Case Study in Darwin. Sustainability 2022, 14, 3775. [Google Scholar] [CrossRef]
- Echarri-Iribarren, V.; Gómez-Val, R.; Ugalde-Blázquez, I. Energy Losses or Savings Due to Air Infiltration and Envelope Sealing Costs in the Passivhaus Standard: A Review on the Mediterranean Coast. Buildings 2024, 14, 2158. [Google Scholar] [CrossRef]
- Wills, A.D.; Beausoleil-Morrison, I.; Ugursal, V.I. A modelling approach and a case study to answer the question: What does it take to retrofit a community to net-zero energy? J. Build. Eng. 2021, 40, 102296. [Google Scholar] [CrossRef]
- Governemnt of Western Australia. The Housing We’d Choose: A study for Perth and Peel. 2013. Available online: https://www.wa.gov.au/system/files/2021-05/FUT_the-housing-we-d-choose-summary.pdf (accessed on 10 January 2024).
- Yin, R.K. Case Study Research: Design and Methods (Applied Social Research Methods), 2nd ed.; SAGE Publications: Thousand Oaks, CA, USA, 1994; Available online: https://www.amazon.com/Case-Study-Research-Methods-Applied/dp/0803920571 (accessed on 25 September 2024).
- Stake, R.E. The Art of Case Study Research; SAGE Publications: Thousand Oakes, CA, USA; London, UK, 1998; Available online: https://books.google.com.au/books?id=ApGdBx76b9kC&printsec=frontcover&redir_esc=y#v=onepage&q&f=false (accessed on 10 January 2024).
- Akgüç, A.; Yılmaz, A.Z. Determining HVAC system retrofit measures to improve cost-optimum energy efficiency level of high-rise residential buildings. J. Build. Eng. 2022, 54, 104631. [Google Scholar] [CrossRef]
- Your Home. Precast Concrete. Available online: https://www.yourhome.gov.au/materials/precast-concrete (accessed on 10 May 2024).
- DCCEEW. Built Environment Sector Plan. 2025. Available online: https://treasury.gov.au/sites/default/files/2025-09/p2025-698821.pdf (accessed on 23 September 2025).
- COAG Energy Council. Report for Achieving Low Energy Existing Homes, Commonwealth of Australia 2019. 2019. Available online: https://www.dcceew.gov.au/sites/default/files/documents/report-for-achieving-low-energy-existing-homes.pdf (accessed on 10 January 2024).
- DWER. Sectoral Emissions Reduction Strategy for Western Australia Pathways and Priority Actions for the State’s Transition to Net Zero Emissions. 2023. Available online: https://www.wa.gov.au/system/files/2024-07/sers-final-report-20240702.pdf (accessed on 3 May 2024).
- DCCEEW. Australian National Greenhouse Accounts Factors: For Individuals and Organisations Estimating Greenhouse Gas Emissions. 2024. Available online: https://www.dcceew.gov.au/sites/default/files/documents/national-greenhouse-account-factors-2024.pdf (accessed on 10 January 2025).
- DEE. National Inventory Report 2017. 2019. Available online: https://www.dcceew.gov.au/sites/default/files/documents/national-inventory-report-2017-volume-1.pdf (accessed on 10 February 2024).
- Kennedy, A. Have Emissions Fallen Since 2005, and Are They the Lowest They’ve Ever Been, as Liberal MP Katie Allen Says? ABC News: Australia. 2019. Available online: https://www.abc.net.au/news/2019-11-08/fact-check-carbon-emissions-under-the-coalition/11662018 (accessed on 24 February 2024).




| Building Features Considerations for Energy-Efficiency | Reference |
|---|---|
| Solar panel and roof shading | [38,39,40,41,42] |
| Window orientation and overhang shading | [43,44,45,46,47,48] |
| Orientation and Window-wall-ratio | [49,50,51,52,53] |
| External building facade and insulation | [54,55,56,57] |
| Efficient heat pump and high-efficiency HVAC system | [58,59,60,61] |
| Rain and grey water harvesting, renewable energy | [57,62,63,64] |
| Natural ventilation, lighting, and airtightness | [65,66,67,68,69] |
| Window glass properties | [70,71,72,73] |
| Shading device | [74,75,76,77] |
| Efficient appliances | [78,79,80,81] |
| Features | Application | Energy Reduction/Savings | Reference |
|---|---|---|---|
| Insulation (Wall + Roof) | Wall R-value 2.8 and Ceiling R-value | 40% | [103] |
| Window Glazing | Double Glazing | 20–33% | [104] |
| Window-Wall-Ratio | Optimal Window-to-wall ratio (north-facing wall 20–40%, south-facing wall 10–20%, east-facing wall 10–25% and west facing wall 10–25%) | 5–25% | [105,106] |
| Shading | Horizontal fixed with varying depths | 5–15% | [107] |
| Airtightness | Sealed all air leakage | 10–15% | [108,109] |
| Case Study 1 | Case Study 2 | Case Study 4 | |
|---|---|---|---|
| Built Year | 1982 | 1970 | 1981 |
| Land Area | 352 m2 | 692 m2 | 712 m2 |
| Built Area | 103 m2 | 60 m2 | 93 m2 |
| Construction Type | Double brick | Brick veneer | Double brick |
| Features | Descriptions |
|---|---|
| Location and Orientation | Langford, Perth, Western Australia. North facing 125.20. |
| External Wall | The double brick features 10 mm of cement plaster with a light crème colour finish internally, and face brick externally, without insulation. Total area = 97.7 m2 and R = 0.43. |
| Internal Wall | Single-brick wall with both sides 10 mm cement plaster with light crème colour finish. Total area = 85.4 m2 and R = 0.30. |
| Building Height | 3 m. |
| Floor Slab | A concrete slab on the ground, without insulation, is finished with various coloured tiles and vinyl. Total area = 84.7 m2 and R = 0.07. |
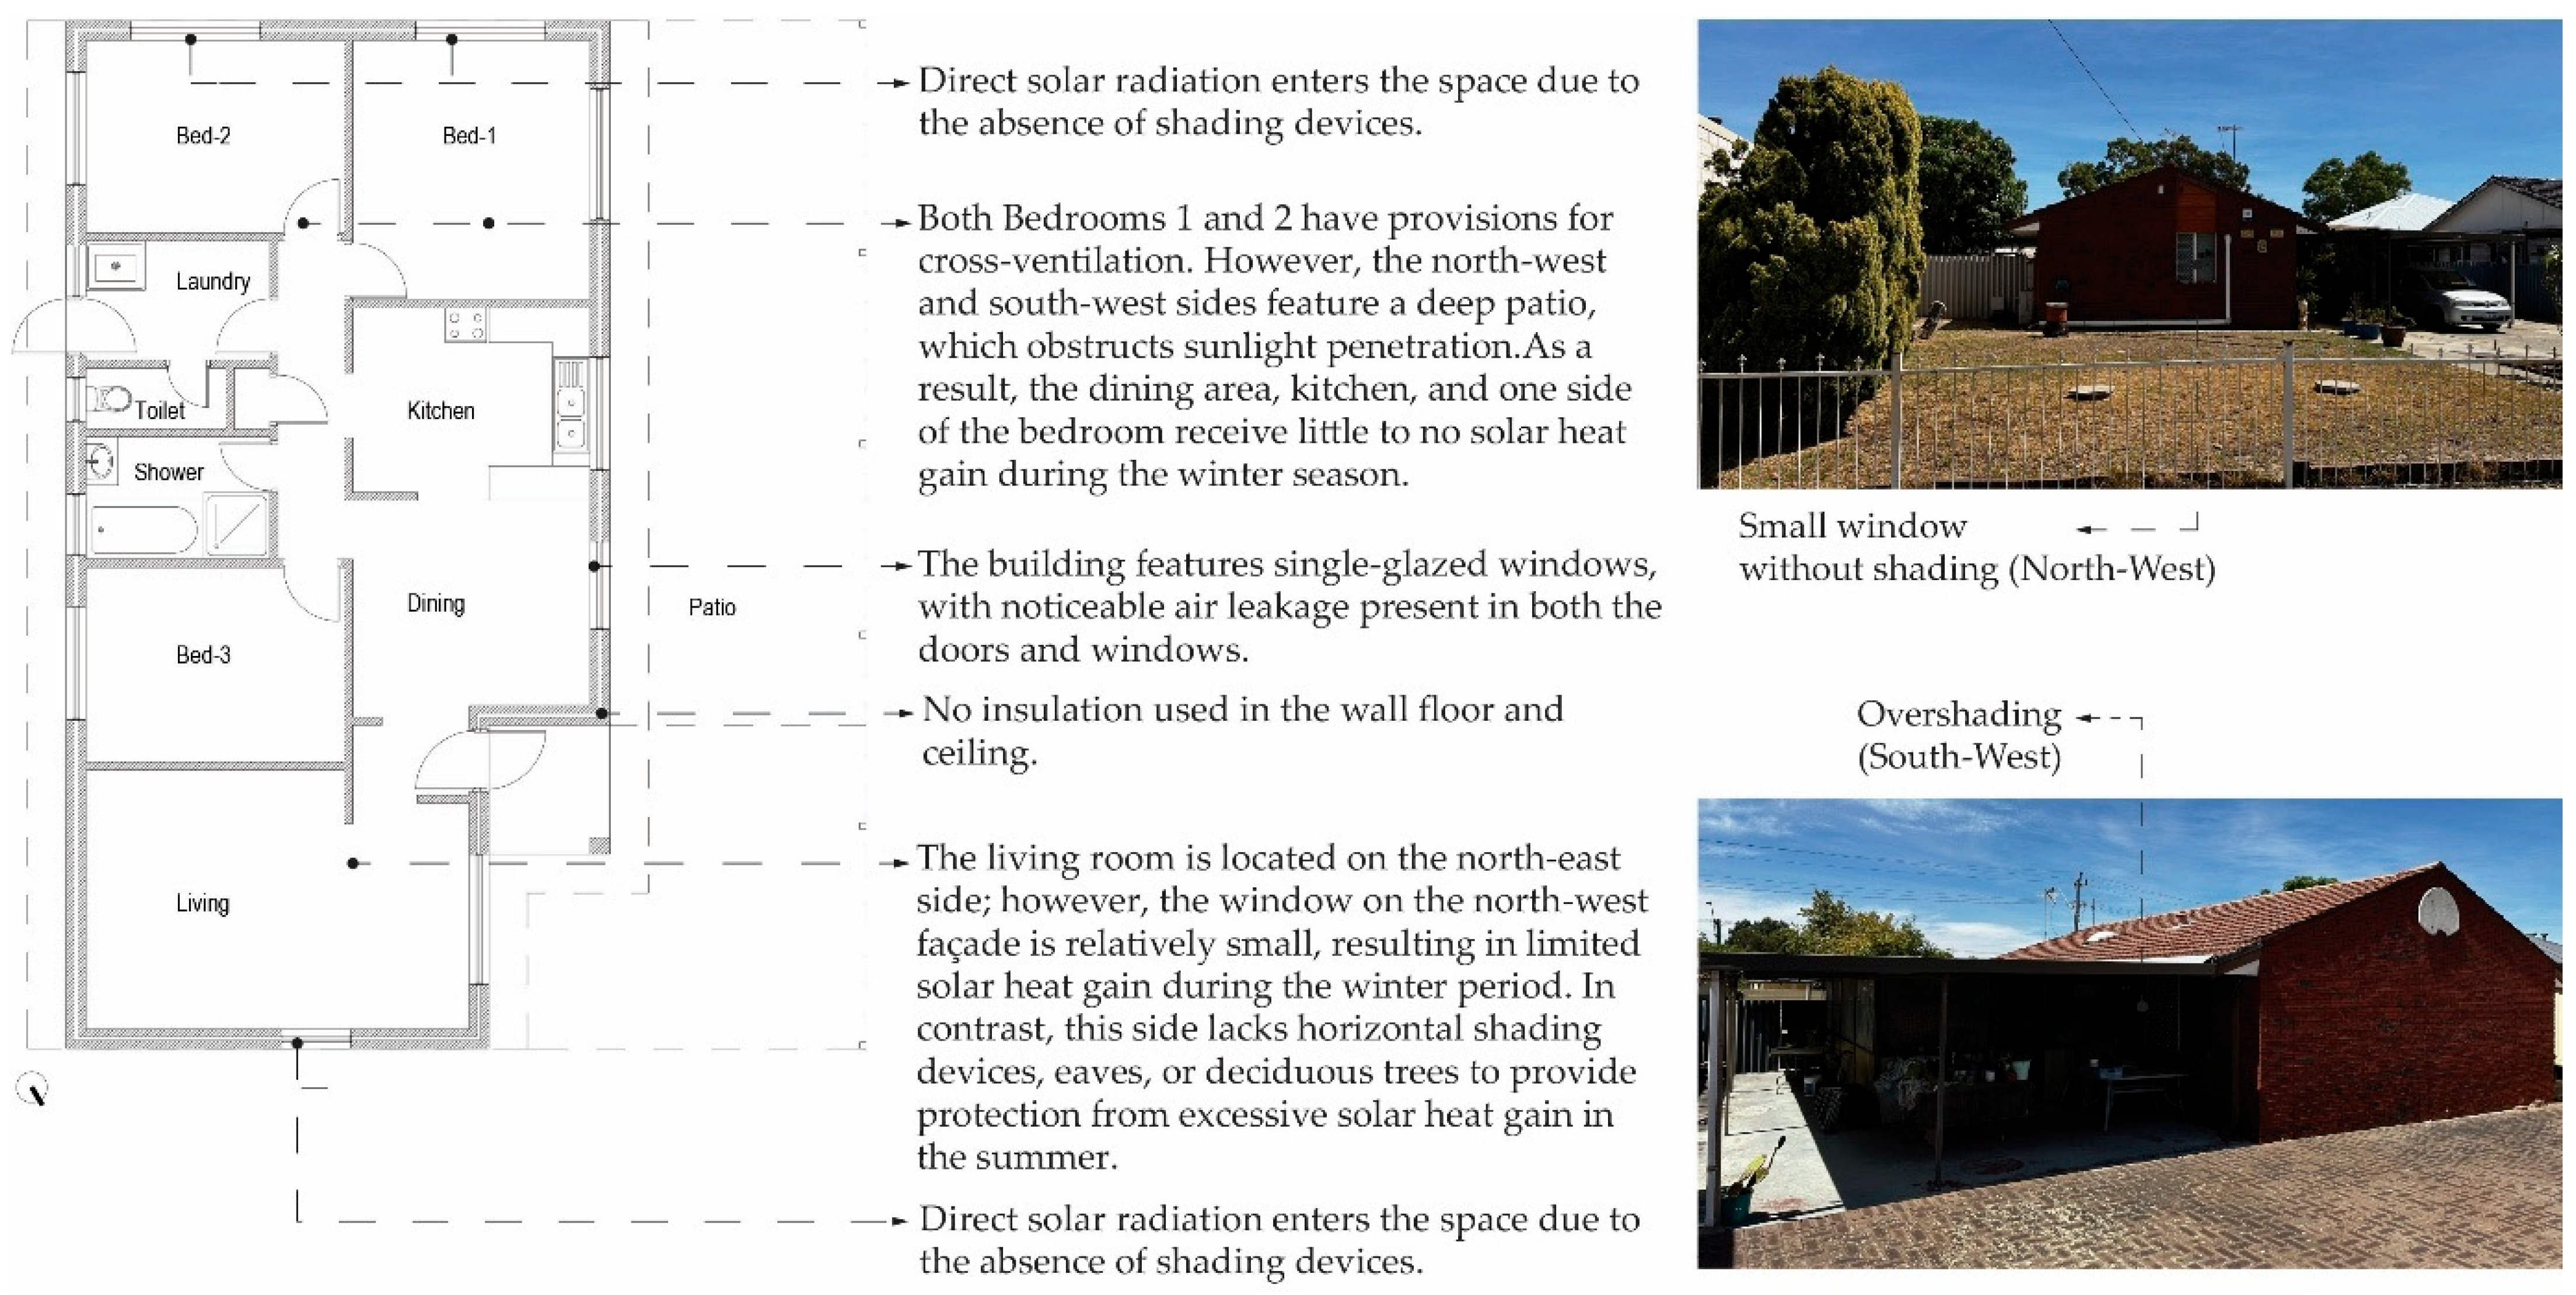
| Roof and Ceiling | Pitch roof with a continuous attic, but without insulation. Dark black cement tiles are used for roofing, and 10 mm plasterboard is used for the ceiling, which is white in colour. Total ceiling area = 84.7 m2. |
| Window Frame and Glazing | Aluminium-framed single-clear glazing sliding window with white curtains protecting from the inside; however, the bedroom and kitchen’s northwest side windows are of a fixed type. Total area = 18.97 m2 and U = 6.70 and SG = 0.57. |
| window–wall ratio | South–east = 5.2 m2, south–west = 4.3 m2, north–west = 8.3 m2 and north–east = 1.1 m2 |
| Airtightness | The exterior doors and windows have air leakage. |
| Shading | Overshading on the northwest side. |
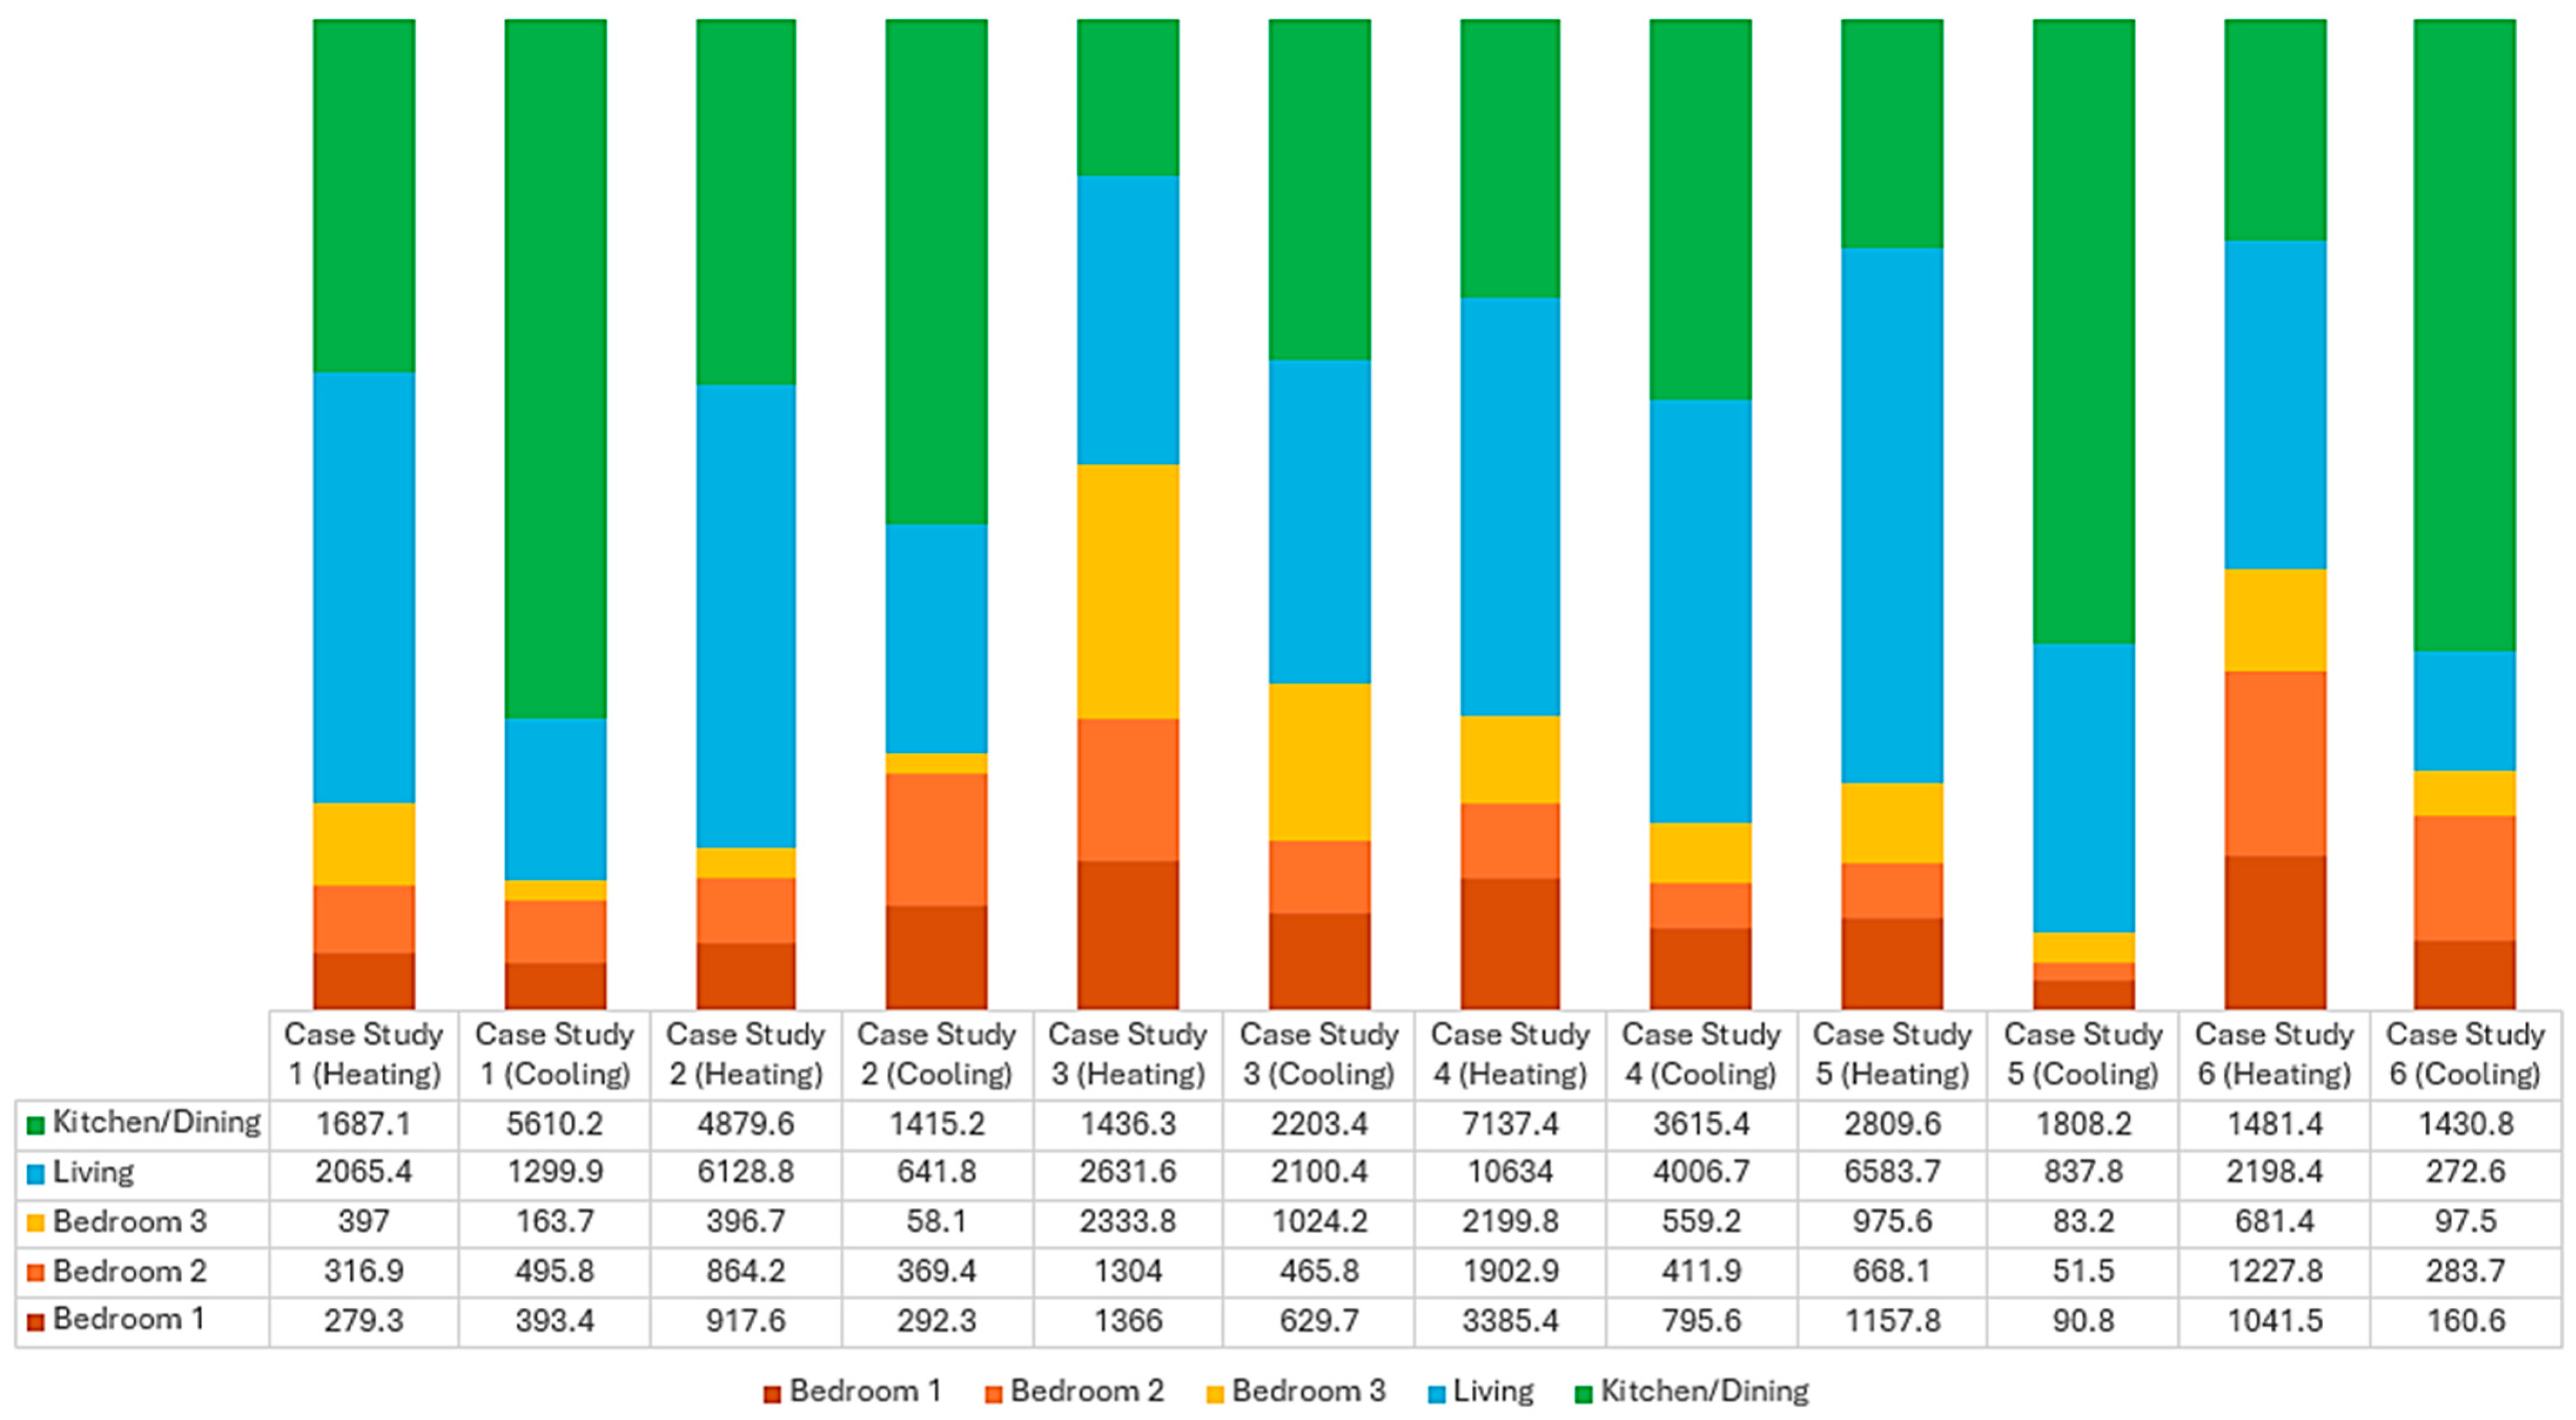
| Zone | Heating (MJ/m2) | Total Heating (MJ) | Cooling (MJ/m2) | Total Cooling (MJ) |
|---|---|---|---|---|
| Bedroom 1 | 40.8 | 396.7 | 6.0 | 58.1 |
| Bedroom 2 | 95.1 | 917.6 | 30.3 | 292.3 |
| Bedroom 3 | 72.7 | 864.2 | 31.1 | 369.4 |
| Living | 334.1 | 6128.8 | 35 | 641.8 |
| Dining/Kitchen | 239.5 | 4879.6 | 69.5 | 1415.2 |
| Service Area | 851.7 | 357.2 | 1.0 | 0.4 |
| Features | Descriptions |
|---|---|
| Location and Orientation | Langford, Perth, Western Australia. North facing 145.00. |
| External Wall | Brick veneer covers a 10 mm cement plaster with a light crème colour finish internally, and a combination of face brick and 10 mm cement plaster with a light crème colour is used externally, without insulation. Total area = 136.5 m2 and R = 0.40. |
| Internal Wall | Stud wall with both sides made of 10 mm plasterboard, featuring a light crème colour finish. Total area = 89.5 m2 and R = 0.28. |
| Building Height | 3 m. |
| Floor Slab | A 125 mm concrete suspended slab without insulation is finished with various colour tiles and vinyl. Total area = 130.3 m2 and R = 0.09. |
| Roof and Ceiling | Pitch roof with a continuous attic, but without insulation. Dark black cement tiles are used for roofing, and 10 mm plasterboard is used for the ceiling, which is white in colour. Total ceiling area = 130.3 m2. |
| Window Frame and Glazing | Wooden-framed single- clear glazing awning window with white curtains protected by inside. Total area = 16.74 m2 and U = 5.40 and SG = 0.56. |
| Window–Wall Ratio | South–east = 3.6 m2, south–west = 3.3 m2, north–west = 2.5 m2 and north–east = 7.3 m2 |
| Airtightness | The exterior doors and windows have air leakage. |
| Shading | Every side has overshading. |
| Zone | Heating (MJ/m2) | Total Heating (MJ) | Cooling (MJ/m2) | Total Cooling (MJ) |
|---|---|---|---|---|
| Bedroom 1 | 139.7 | 3385.4 | 32.8 | 795.6 |
| Bedroom 2 | 113.5 | 1902.9 | 24.6 | 411.9 |
| Bedroom 3 | 151.3 | 2199.8 | 38.5 | 559.2 |
| Living | 348.3 | 10,634.0 | 131.2 | 4006.7 |
| Dining/Kitchen | 290.5 | 7137.4 | 147.1 | 3615.4 |
| Service Area | 388.1 | 2610.7 | 92.0 | 618.6 |
| Features | Descriptions |
|---|---|
| Location and Orientation | Langford, Perth, Western Australia. North facing 140.20. |
| External Wall | The double brick features 10 mm of cement plaster with a light crème colour finish internally, and face brick externally, without insulation. Total area = 93.3 m2 and R = 0.43. |
| Internal Wall | Single brick wall with both sides 10 mm cement plaster with light crème colour finish. Total area = 82.9 m2 and R = 0.30. |
| Building Height | 3 m. |
| Floor Slab | A concrete slab on the ground, without insulation, is finished with various coloured tiles and vinyl. Total area = 81.1 m2 and R = 0.07. |
| Roof and Ceiling | Pitch roof with vented continuous attic without insulation. Dark red cement tiles are used for roofing, and 10 mm plasterboard is used for the ceiling, which is white in colour. Total ceiling area = 81.1 m2. |
| Window Frame and Glazing | Aluminium-framed single-clear glazing sliding window with white curtains protected by inside; however. Total area = 15.48 m2 and U = 6.70 and SG = 0.57. |
| Window–Wall Ratio | South–east = 8.4 m2, south–west = 0.7 m2, north–west = 5.1 m2 and north–east = 1.3 m2 |
| Airtightness | The exterior doors and windows have air leakage. |
| Shading | Overshading on the northeast side. |
| Zone | Heating (MJ/m2) | Total Heating (MJ) | Cooling (MJ/m2) | Total Cooling (MJ) |
|---|---|---|---|---|
| Bedroom 1 | 78.8 | 1001.5 | 5.4 | 68.8 |
| Bedroom 2 | 79.2 | 717.2 | 4.0 | 36.5 |
| Bedroom 3 | 123.0 | 1133.7 | 9.9 | 91.2 |
| Living | 348.0 | 6627.0 | 40.5 | 770.4 |
| Dining/Kitchen | 170.8 | 2744.2 | 102.8 | 1652.3 |
| Service Area | 391.9 | 1695.8 | 7.3 | 31.5 |
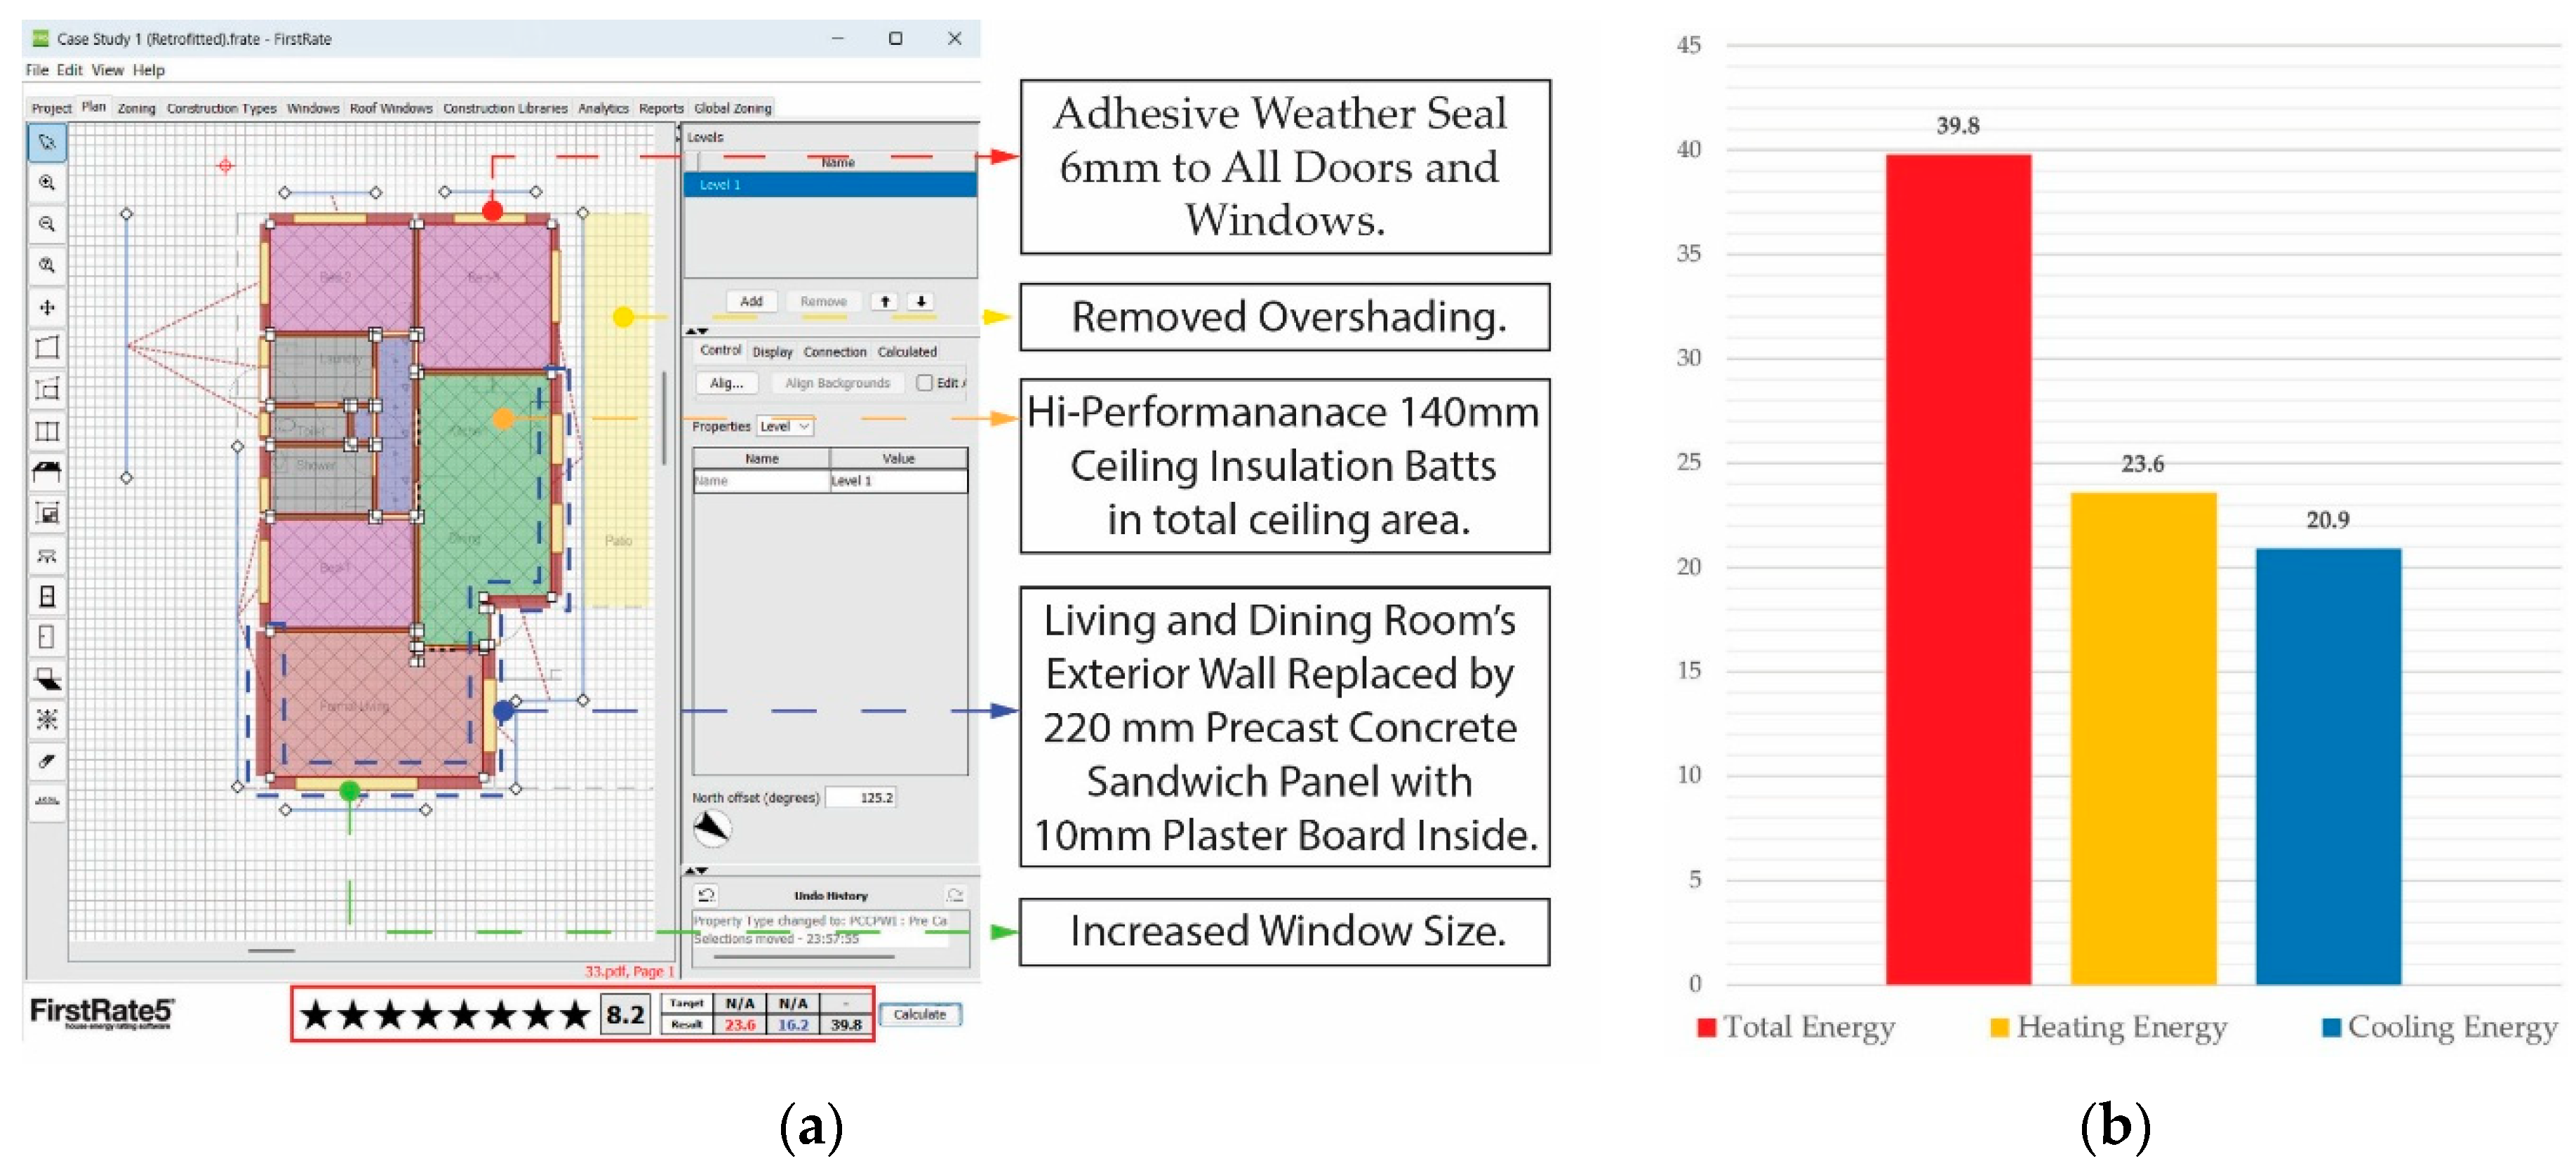
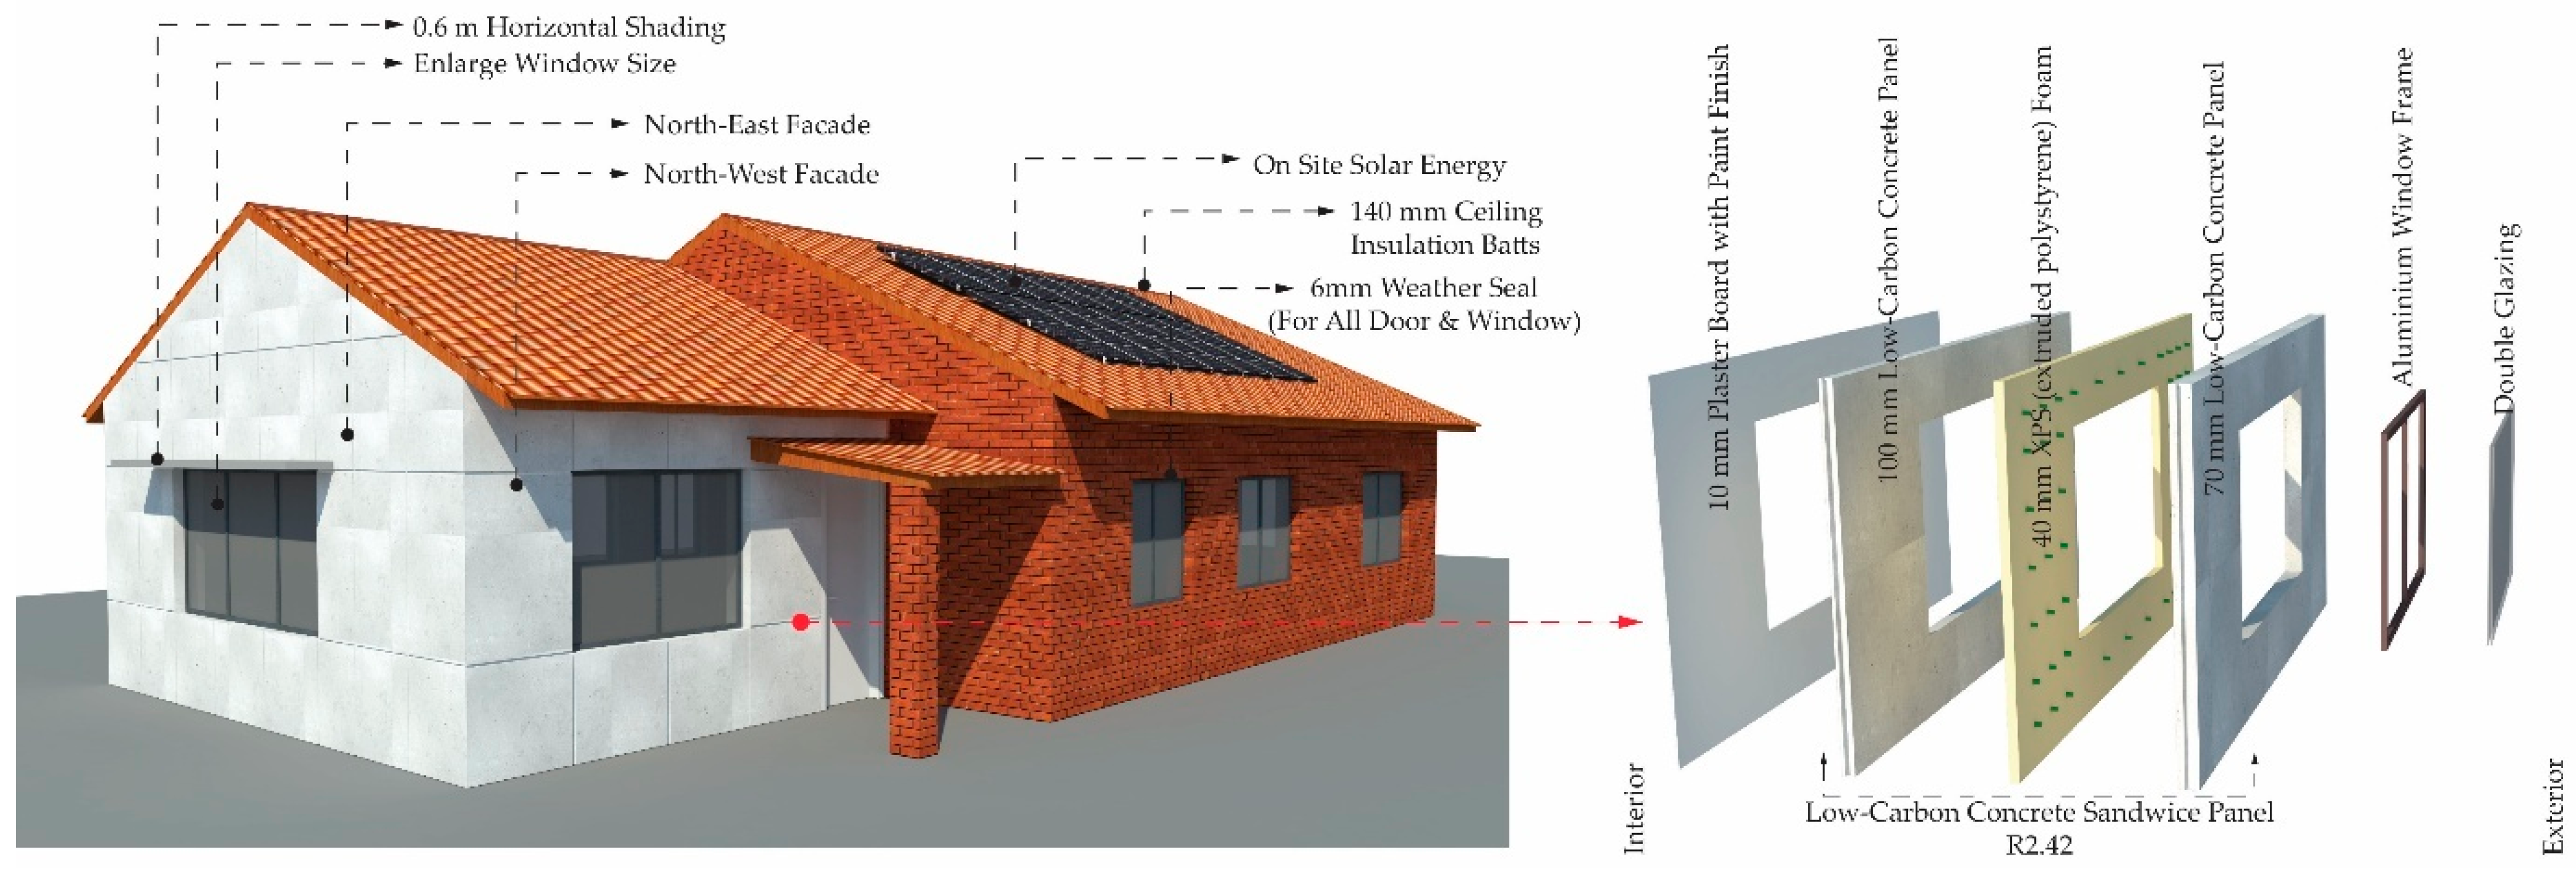
| Features | Proposed Retrofitting | Descriptions |
|---|---|---|
| Location and Orientation | N/A | Langford, Perth, Western Australia. North facing 125.20. |
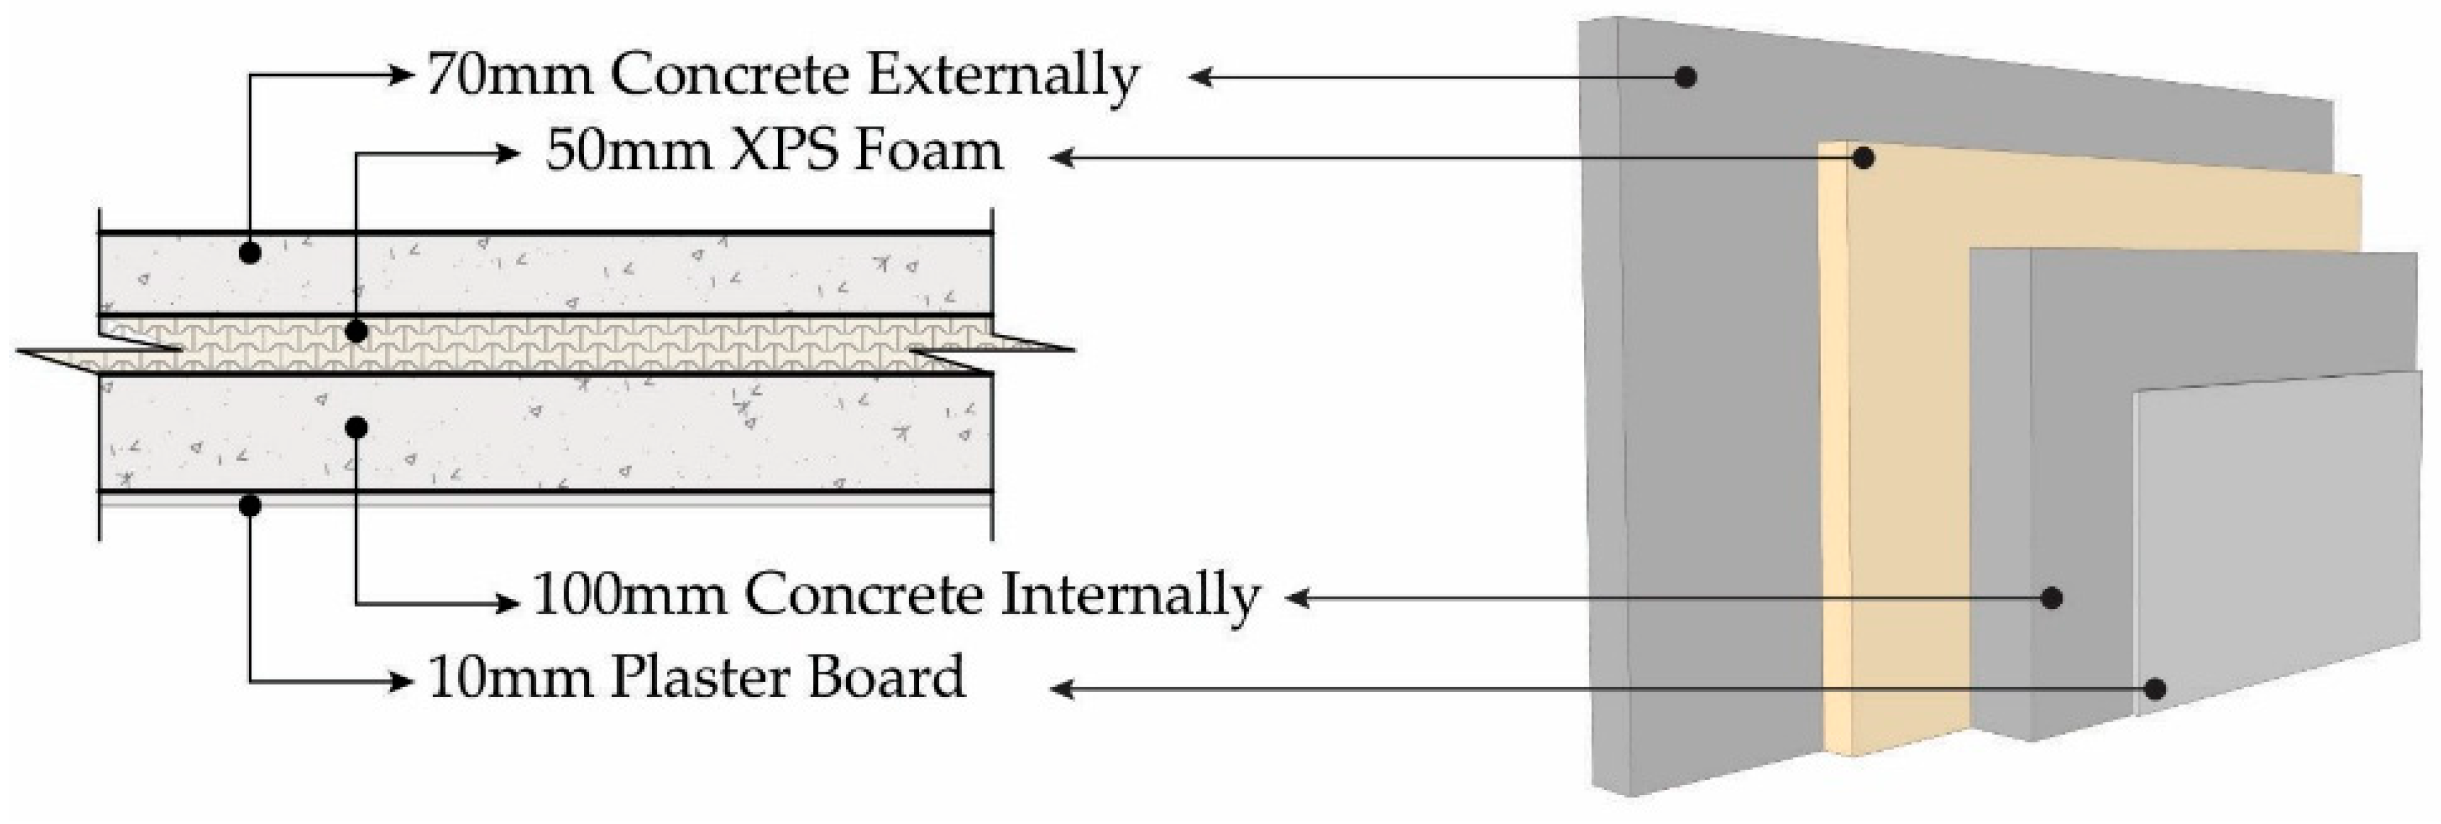
| External Wall | Yes | At the northeast and northwest sides of the living room, the external wall transitions to a low-carbon concrete sandwich panel (external concrete panel: 70 mm, middle XPS (Extruded Polystyrene Foam) foam: 40 mm, internal concrete panel: 100 mm) with a 10 mm plasterboard finish internally. Total area = 46.3 m2, R = 2.42, and U = 0.41. |
| Internal Wall | No | R = 0.30 |
| Building Height | No | 3 m. |
| Floor Slab | No | R = 0.07 |
| Roof and Ceiling | Yes | Total ceiling area (84.7 m2) insulated with 140 mm high-performance ceiling insulation batts R5. |
| Window Frame and Glazing | Yes | Aluminium-framed double- clear glazing air-filled sliding window. Total area = 21.21 m2 and U = 4.8 and SG = 0.51. |
| Window–Wall Ratio | Yes | 2.6 m2 window area increased in the north–east orientation, and the current total area is 3.7 m2. |
| Airtightness | Yes | The exterior doors and windows are air-leakage sealed. |
| Shading | Yes | Removed overshading from the northwest side. In addition, a 0.60 m horizontal shading device was added in the same orientation. |
| Features | Proposed Retrofitting | Descriptions |
|---|---|---|
| Location and Orientation | N/A | Langford, Perth, Western Australia. North facing 145.00. |
| External Wall | Yes | The external walls of the living, dining, and kitchen areas have been changed to a low-carbon concrete sandwich panel (external concrete panel: 70 mm, middle XPS (Extruded Polystyrene Foam) foam: 50 mm, internal concrete panel: 100 mm) with a 10 mm plasterboard finish internally. Total area = 63.4 m2, R = 2.42, and U = 0.41. |
| Internal Wall | No | R = 0.28 |
| Building Height | No | 3 m. |
| Floor Slab | No | R = 0.09 |
| Roof and Ceiling | Yes | Total ceiling area (10.3 m2) insulated with 140 mm high-performance ceiling insulation batts R5. |
| Window Frame and Glazing | Yes | Aluminium-framed double clear glazing awning window. Total area = 18.68 m2 and U = 4.8 and SG = 0.51. |
| Window–Wall Ratio | Yes | The window area in the north–east orientation has increased to 1.9 m2, and the current total area is 9.2 m2. |
| Airtightness | Yes | The exterior doors and windows are air-leakage sealed. |
| Shading | Yes | Removed all the overshading. |
| Features | Proposed Retrofitting | Descriptions |
|---|---|---|
| Location and Orientation | N/A | Langford, Perth, Western Australia. North facing 140.20. |
| External Wall | Yes | The living, dining, and kitchen external wall is changed to a low-carbon low-concrete sandwich panel (external concrete panel 100 mm, middle XPS (Extruded Polystyrene Foam) foam 40 mm, internal concrete panel 70 mm) with 10 mm plaster board finish internally. Total area = 34.2 m2, R = 2.42, and U = 0.41. |
| Internal Wall | No | R = 0.30. |
| Building Height | No | 3 m. |
| Floor Slab | No | R = 0.07. |
| Roof and Ceiling | Yes | Total ceiling area (130.3 m2) insulated with 140 mm high-performance ceiling insulation batts R5. |
| Window Frame and Glazing | Yes | Aluminium-framed double clear glazing air-filled sliding window. Total area = 18.59 m2 and U = 4.8 and SG = 0.51. |
| Window–Wall Ratio | Yes | 3.1 m2 window area increased in the north–east orientation, and the current total area is 4.4 m2. |
| Airtightness | Yes | The exterior doors and windows are air-leakage sealed. |
| Shading | Yes | Removed overshading from the northeast side. |
Disclaimer/Publisher’s Note: The statements, opinions and data contained in all publications are solely those of the individual author(s) and contributor(s) and not of MDPI and/or the editor(s). MDPI and/or the editor(s) disclaim responsibility for any injury to people or property resulting from any ideas, methods, instructions or products referred to in the content. |
© 2025 by the authors. Licensee MDPI, Basel, Switzerland. This article is an open access article distributed under the terms and conditions of the Creative Commons Attribution (CC BY) license (https://creativecommons.org/licenses/by/4.0/).
Share and Cite
Romeo, T.M.; Ahsan, T.; Zaman, A. Net-Zero Energy Retrofitting in Perth’s Residential Sector: Key Features and Strategies for Sustainable Building Transformation. Urban Sci. 2025, 9, 421. https://doi.org/10.3390/urbansci9100421
Romeo TM, Ahsan T, Zaman A. Net-Zero Energy Retrofitting in Perth’s Residential Sector: Key Features and Strategies for Sustainable Building Transformation. Urban Science. 2025; 9(10):421. https://doi.org/10.3390/urbansci9100421
Chicago/Turabian StyleRomeo, Taqir Mahmood, Tahmina Ahsan, and Atiq Zaman. 2025. "Net-Zero Energy Retrofitting in Perth’s Residential Sector: Key Features and Strategies for Sustainable Building Transformation" Urban Science 9, no. 10: 421. https://doi.org/10.3390/urbansci9100421
APA StyleRomeo, T. M., Ahsan, T., & Zaman, A. (2025). Net-Zero Energy Retrofitting in Perth’s Residential Sector: Key Features and Strategies for Sustainable Building Transformation. Urban Science, 9(10), 421. https://doi.org/10.3390/urbansci9100421


