Abstract
New York City is the most populous city in North America and the fourth most populous in the world. Due to the high population density and significant commuting population, the city experiences a large number of vehicles operating in a congested environment, leading to a substantial number of traffic accidents. This study examines a dataset compiled by the New York Police Department, which records every major vehicular accident in New York City from 2013 to 2023, exploring aspects such as accident types, severity, causes, and locations. This period includes the COVID-19 pandemic and other external factors like fluctuating gasoline prices, the rise of for-hire vehicle (FHV) services, and vehicles with new safety features. Data from multiple sources are analyzed to understand how these factors impacted accident rates during this timeframe. The analysis shows that the COVID-19 pandemic significantly reduced accidents due to decreased motor vehicle traffic, with post-pandemic accident rates remaining at less than half of pre-pandemic levels. This sustained decline correlates with reduced traffic, increased FHV usage over taxis, and a growing number of new vehicles with advanced safety features. This study uses these datasets to develop a mathematical model to quantify these correlations and to provide insight for urban planners and policymakers seeking to improve road safety and manage traffic flow.
1. Introduction
New York City, the most populous city in North America and the fourth most populous worldwide faces significant challenges due to its high population density and substantial commuting population. The dense concentration of vehicles operating in this urban environment contributes to a considerable number of traffic accidents. This study analyzes traffic accident trends in New York City over a decade, from 2013 to 2023, using a dataset compiled by the New York Police Department (NYPD), supplemented with data from other sources to gain a comprehensive understanding of the factors influencing accident frequency.
The paper is organized to provide a detailed examination of the factors affecting traffic accidents in New York City. It begins with an overview of the primary dataset and the research methodology. The next section explores accident trends, including analyses of accident locations, causes, and severity, based on the NYPD dataset. The subsequent section investigates the underlying causes for these trends using additional datasets from diverse sources. These datasets are then integrated with the NYPD data to develop a model that identifies factors influencing vehicle accidents. The paper concludes by using this model to offer recommendations for urban planners and policymakers, aiming to enhance road safety and traffic management in New York City and comparable urban settings.
2. Materials and Methods
2.1. New York City Accident Data
The NYPD compiles vehicle accident data, which have been made publicly available online at data.gov [1]. The structured collection of traffic collision data began in April 1998 with the launch of the NYPD’s TrafficStat program. Before this program, there was no standardized method for collecting traffic data across NYPD precincts. To address this issue, the Traffic Accident Management System (TAMS) was introduced in July 1999, requiring police precincts to manually enter key information from the MV-104AN forms to compile basic crash statistics, such as the number of accidents, injuries, and fatalities [2].
In 2013, New York City initiated the Vision Zero program with the goal of eliminating traffic-related deaths. This initiative included various policy changes and efforts to reduce accidents, as well as improvements in accident data collection. As a result, TAMS was replaced by the Finest Online Records Management System (FORMS), which allowed police officers to electronically enter all data fields from the MV-104AN forms using a department cellphone [3]. This system stores all the data in the NYPD’s crime data warehouse, and a sanitized version—removing any personally identifiable information—has been made available for researchers interested in conducting data analysis.
Table 1 summarizes the information included in the dataset for each accident, particularly the critical details such as the accident’s date, time, location, number of injuries, number of fatalities, vehicle type, and key contributing factors.

Table 1.
Summary of data included in the dataset from the New York Police Department records on vehicle accidents.
2.2. Analysis Methodology
This study follows the methodology outlined in Figure 1, using RStudio 1.4 to extract, clean, and analyze the datasets. In particular, the analysis used the dplyr and tidyverse toolboxes, which provide the necessary tools for cleaning and filtering the data.
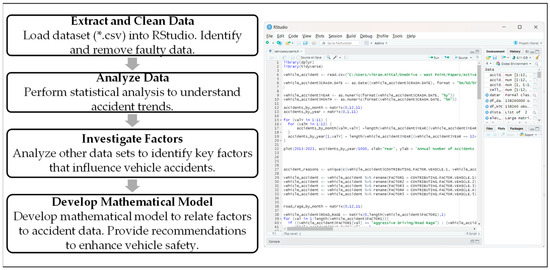
Figure 1.
Methodology used for this study.
As shown in Figure 1, the accident data were extracted from the dataset provided by the NYPD on data.gov. The data required cleaning by removing any records that appear as faulty (e.g., longitude and latitude outside New York, injury numbers that are unreasonably high). The dataset was then analyzed to understand the characteristics and trends of the accidents. Different attributes of the accidents were considered including the date, location, severity, and identified cause. From there, the study looked at different factors from external datasets to identify factors that could influence vehicle accidents during this timeframe. These factors are then used to develop a mathematical model to relate these factors to the accident trends to provide insight for urban initiatives that could enhance vehicle safety.
As shown in Figure 2, this mathematical model is based on a multivariate regression analysis, where the monthly number of traffic accidents (Y) was modeled as a linear combination of several independent variables (X1, X2,… Xn). The general form of the model is given in Equation (1):
where is the intercept, are the coefficients representing the impact of each independent variable, and is the error term capturing the variation unexplained by the model. The independent variables included data pulled from a number of different sources including the NYC Taxi and Limousine Commission, the NYC Health Department, the U.S. Energy Information Administration, and the NY Department of Motor Vehicles. The coefficients were estimated using the least squares method, which minimizes the sum of squared residuals where represents the predicted values from the model. The analysis also calculated p-values for each independent variable. Generally, a p-value less than 0.01 indicates that the associated independent variable has an affect on the dependent variable. This approach ensures that the fitted line is as close as possible to the observed data points, providing the best linear approximation of the relationship between the dependent and independent variables.
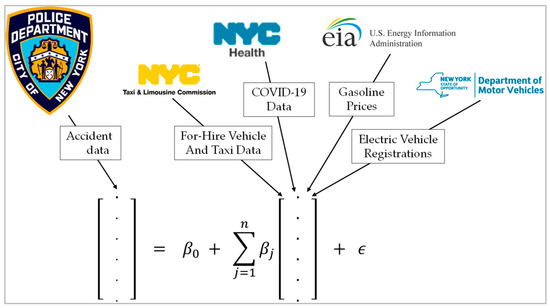
Figure 2.
Schematic for the linear model used in this analysis.
3. New York City Accident Trends
3.1. Accidents by Month
Figure 3 displays the recorded number of accidents by month in New York City from 2013 to 2023. The data show a degree of periodicity, with accidents peaking during early summer, typically in May or June, and decreasing through the winter months, likely due to fewer drivers on the roads when conditions are icy.
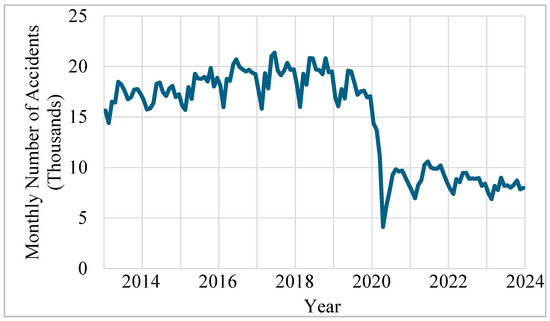
Figure 3.
Monthly number of accidents from 2013 to 2023 in New York City. The vertical grid lines are associated with January of the year indicated on the vertical axis.
Figure 3 also illustrates a dramatic decrease in the number of traffic accidents starting in April 2020, corresponding to the onset of the COVID-19 global pandemic. The pandemic led to several lockdowns, reducing the number of people on the roads, and also encouraged companies to support teleworking, further decreasing the need for commuting into the city. Although many lockdowns and quarantines remained in place through 2021, most COVID-19 restrictions were lifted by 2022. Nevertheless, the number of accidents remained low, at fewer than 10,000 accidents per month.
Similar decreases in vehicle accidents have been observed in other cities. Pathak et al. identified a similar trend in Maharashtra, India, noting that the decrease was limited to non-severe accidents [4]. Qureshi et al. found a comparable trend in Missouri, USA, and noted that there was no change in serious or fatal accidents [5]. Calderon-Anyosa and Kaufman observed this trend in Peru, noting that the drop in traffic accidents persisted after the pandemic [6]. Other studies from Greece [7], Louisiana [8], Spain [9], and Japan [10] also empirically concluded that the COVID-19 pandemic lockdowns resulted in fewer automobiles on the road, leading to a reduction in traffic accidents.
3.2. Accidents by Location
New York City consists of five boroughs: Manhattan, Brooklyn, Queens, the Bronx, and Staten Island. Table 2 provides the breakdown of accidents by borough, showing that approximately 32 percent of accidents occur in Brooklyn, 16 percent in the Bronx, 21 percent in Manhattan, 27 percent in Queens, and 4 percent in Staten Island. Despite the sharp decline in accidents in 2020, the distribution of accidents by borough remained relatively consistent.

Table 2.
Summary of the percent of accidents that occurred in each borough of New York City.
The distribution of traffic accidents across New York City’s boroughs reveals distinct patterns influenced by demographic, geographic, and infrastructural factors. Brooklyn, accounting for about 32 percent of the city’s accidents, has the highest rate. This can be attributed to its status as the most populous borough, containing a diverse mix of residential, commercial, and industrial areas. The borough’s heavy traffic congestion, complex street network, frequent construction, and numerous intersections create a challenging environment for both drivers and pedestrians [11]. Additionally, Brooklyn’s dense population leads to a high volume of vehicle and pedestrian interactions, increasing the likelihood of accidents.
Manhattan, responsible for 21 percent of traffic accidents, faces unique challenges due to its role as the city’s business and cultural center. Its dense concentration of businesses, tourist attractions, and public transportation options results in consistently high traffic volumes, including both vehicles and pedestrians [12]. The prevalence of taxis, ride-shares, and delivery vehicles further contributes to congestion. Narrow streets, frequent gridlock, and a high number of pedestrians and cyclists make navigating Manhattan particularly hazardous, leading to a significant number of accidents.
Queens, with 27 percent of the city’s traffic accidents, and the Bronx, with 16 percent, each face their own challenges. Queens, known for its expansive size and diverse neighborhoods, has major thoroughfares and expressways that handle substantial traffic volumes, contributing to its high accident rate [13]. The Bronx, although less populous than Brooklyn and Queens, still experiences significant traffic due to major highways and dense residential areas [14]. Staten Island, with only 4 percent of accidents, has the fewest incidents, likely due to its lower population density and reduced traffic volume compared to the other boroughs. The island’s more suburban layout and fewer commercial centers result in less congestion and, consequently, fewer accidents.
The data indicate a trend that during this time frame, the percentage of accidents that occurred in Manhattan decreased, with the percentage of accidents in Brooklyn and the Bronx increasing accordingly. This trend is explored in subsequent sections but correlates with the increase in FHV services, such as Uber and Lyft.
3.3. Accidents by Severity
Figure 4 and Figure 5 plot the total number of accidents that included injuries and fatalities, respectively. The fatalities and injuries include those that were incurred by the vehicle passengers in addition to pedestrians or cyclists hit by the vehicle. The number of accidents with injuries was approximately 4 million per year between 2013 and 2015, accounting for 20 percent of the accidents. The number increased to approximately 4.5 million per year between 2016 and 2019; however, these accidents still only accounted for 20 percent of the total number of accidents. The number of accidents with injuries decreased in 2020 likely due to the COVID-19 pandemic. Following the pandemic, although the total number of accidents decreased, the number of accidents with injuries returned to the 2013–2015 levels at 4 million per year. However, with the lower number of total accidents, accidents with injuries accounted for approximately 35–42 percent of the total number of accidents.
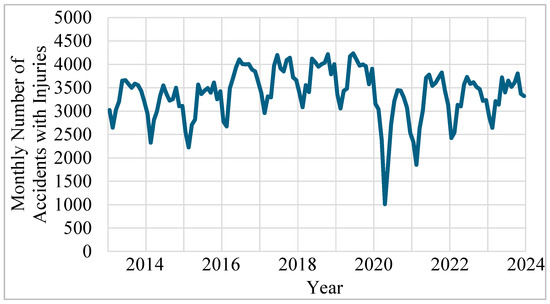
Figure 4.
Total number of accidents in New York City resulting in injuries per month.
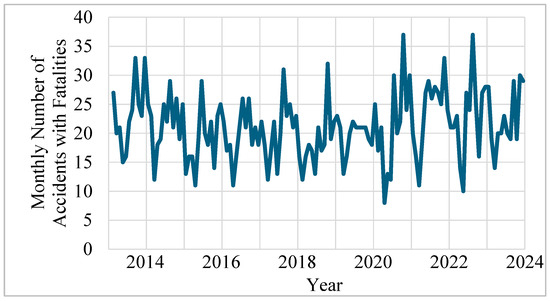
Figure 5.
Total number of accidents in New York City resulting in fatalities per month.
The number of accidents with fatalities followed a generally similar pattern. However, since only a few accidents resulted in fatalities, the sample set is small, making it difficult to analyze trends. Generally, the number of accidents with fatalities remained fairly constant around 25,000 per year. From 2013 to 2019, this accounted for approximately 0.1–0.15 percent of accidents. The percentage of fatal accidents increases substantially in 2020 since the total number of total accidents decreases significantly during this time..
These trends are similar to those that were found in other studies, which noted that the COVID-19 pandemic had little impact on serious accidents [4,5,6,7,8,9,10]. Some of these studies speculated that this was in part due to the empty roads resulting in increased speeding, resulting in more severe accidents. Others associated speeding with people attempting to minimize the amount of time that they spent outside of a quarantined environment. Meanwhile, others indicate the mental health issues associated with the pandemic and the lockdown resulted in increased road rage issues.
3.4. Accidents by Cause
When officers reported the accidents, they were able to identify the factors that caused the accident, selecting from a list of 60 different options. While that section included a free-text option, they were only used six times across the dataset.
This section looks at the number of accidents caused by road rage and distracted driving. The identified factor associated with road rage is “Aggressive Driving/Road Rage”. The identified factors associated with distracted driving include “Texting”, “Cell Phone (hand-held)”, “Cell Phone (hands-free)”, “Listening/Using Headphones”, “Other Electronic Device”, or “Driver Inattention/Distraction”.
3.4.1. Road Rage
Figure 6 plots the monthly number of accidents tied to road rage. While there is some periodicity, generally, accidents caused by road rage are lowest in January and peak during the summertime. The plot also indicates that there has been no change in the number of accidents caused by road rage over the past 10 years. However, given the decrease in total accidents, the percentage of accidents that are caused by road rage has significantly increased following the COVID-19 pandemic.
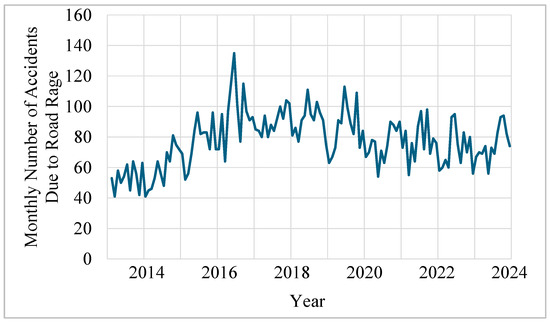
Figure 6.
Total number of accidents in New York City caused by road rage each month.
In a social commentary published in Buzzfeed entitled “17 Everyday Things The Pandemic Has Ruined That No Longer Exist”, one of the items listed stated that it seems that drivers are angrier, although there is no qualitative data [15]. The data indicate that the number of accidents caused by road rage has not increased due to the pandemic. However, the percentage of accidents associated with road rage has increased, increasing from 0.5 percent of traffic accidents pre-pandemic to 1 percent post-pandemic.
3.4.2. Distracted Driving
Figure 7 plots the monthly number of accidents caused by a distracted driver, primarily tied to cellphone usage. Similar to most accidents there is a monthly periodicity, with more accidents happening during the summer months. Similar to the total number of accidents, there is also a sharp decline in 2020 associated with the COVID-19 pandemic, with the numbers remaining low. Although only 12 percent of car accidents were related to distracted driving in 2013, the number increased steadily until 2016, when the number increased significantly from 16 percent to 25 percent of accidents. The percentage of accidents related to distracted driving has remained steady at approximately 25 percent of accidents. The 25 percent of accidents caused by distracted drivers is very close to the 29 percent of accidents reported by the National Highway Traffic Safety Administration [16].
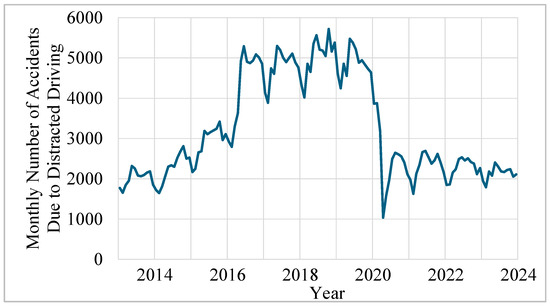
Figure 7.
Total number of accidents in New York City caused by distracted drivers each month.
The increase from 16 percent to 25 percent of accidents in 2016 coincides with the increase in FHV services such as Lyft and Uber during this timeframe [17]. Though Uber entered the New York City market in 2011, Lyft did not enter until 2014. Their usage increased substantially in the 2015–2016 timeframe. Drivers for these services often rely heavily on their phones for navigation, communication with passengers, and managing ride requests, leading to more opportunities for distraction [18]. While the data do not necessarily indicate whether or not the vehicle was part of a ride-share service, there was a significant reduction in the number of accidents with licensed taxi cabs (“yellow cabs”) starting in 2017.
3.5. Cycling and Pedestrians
Figure 8 plots the annual number of injuries of motorists, pedestrians, and cyclists from 2013 to 2023. Though there was a slight drop in the number of injuries in 2020, the decrease was not as large as that related to the number of accidents. Indeed, despite there being half the number of accidents monthly in 2023 compared to 2014, the number of injuries is comparable. Similarly, the number of pedestrians injured dipped slightly in 2020, and the number of pedestrian-related injuries did not change significantly following the COVID-19 pandemic, despite a large decrease in the overall number of accidents. The number of cyclists injured has remained steady at 5000 injuries per year and was not impacted by the COVID-19 pandemic.
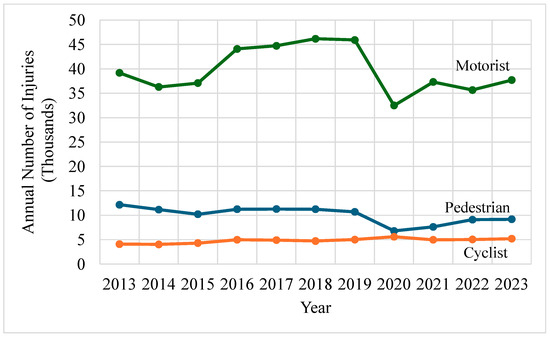
Figure 8.
Annual number of injuries from vehicle accidents for motorists, pedestrians, and cyclists from 2013 to 2023.
Pedestrian injuries in New York City have remained relatively steady from 2013 to 2023, despite a significant drop in traffic after the COVID-19 pandemic. Distracted driving and walking, largely due to smartphone use, continues to be a major issue, increasing accident risks. The city’s car-centric infrastructure, with limited crosswalks and inadequate lighting, further endangers pedestrians.
During the 2020 lockdowns, pedestrian injuries only slightly decreased (by 20%), despite lower traffic volumes. Reduced congestion led to more speeding, resulting in more severe accidents, which offset the potential reduction in injuries. Additionally, delivery services and essential workers kept vehicle traffic high, maintaining the risk for pedestrians. These factors, coupled with longstanding infrastructure and behavioral issues, explain the minimal drop in injuries during the pandemic.
Cyclist injuries have also remained stable since 2013, even with the growth of the Citi Bike program. Launched with 6000 bikes in 2013, Citi Bike expanded to over 20,000 bikes by 2023, covering areas including Queens, the Bronx, and Jersey City [19]. Despite the rise in cyclists, injuries have not increased significantly, likely due to infrastructure improvements like bike lanes and safety measures. Even during the pandemic, when cycling became more popular, these safety measures successfully maintained cyclist safety amid shifting transportation patterns.
4. Factors That Influenced the Number of Accidents in NYC from 2013 to 2023
4.1. Impact of COVID-19
The number of vehicle accidents decreased substantially in 2020 in response to the COVID-19 pandemic. The New York City Health Department tracked the number of positive cases per day from the start of the pandemic in February 2020 through 2024, with the values plotted in Figure 9 [20]. The plot reveals four significant waves spanning from February 2020 to summer 2023. Each subsequent wave followed shortly after the preceding one, requiring New York City to remain in a constant state of vigilance against COVID-19 to manage the pandemic effectively.
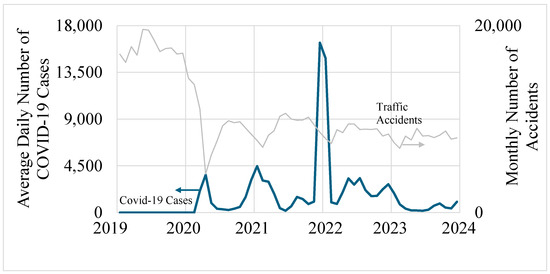
Figure 9.
Average daily number of COVID-19 cases by month from 2019 to 2024 in New York City overlayed on the monthly number of vehicle accidents.
The COVID-19 pandemic had a profound impact on motor vehicle accidents with the overall number of motor vehicle accidents decreasing by approximately 50 percent during this period. This decline can be attributed to pandemic-related restrictions and the shift to telework, which drastically reduced the number of vehicles on the road. With fewer cars commuting, the likelihood of collisions naturally diminished.
Despite the overall reduction in accidents, the number of accidents resulting in injuries or fatalities remained consistent. This suggests that the reduction in total number of accidents occurred primarily for less severe accidents. Contributing factors might include higher speeds on less congested roads, which can lead to more serious injuries when accidents occur. Additionally, essential workers and others who continued to travel during the pandemic may have encountered different driving conditions, contributing to the sustained injury rate. Generally, more severe accidents often involve complex variables, including driver behavior, road conditions, and vehicle safety features, which may not have been substantially impacted by the pandemic-related changes in traffic patterns [21].
Additionally, the shift to telework may have brought about an unexpected consequence with an increase in the percentage of accidents caused by distracted drivers. With more people working from home, the boundaries between work and personal life can get blurred, leading to instances where individuals might attempt to manage work-related tasks while driving. This distraction can significantly impair driving performance, leading to accidents. Thus, while teleworking reduced overall traffic volume and accidents, it also has the potential to introduce new risks related to driver distraction, highlighting the complexity of the pandemic’s impact on road safety in New York City.
4.2. Impact of Gasoline Prices
The number of traffic accidents scales with the number of vehicles on the road, and the number of vehicles on the road has historically decreased as gasoline becomes more expensive [22]. This trend is explored in Figure 10, which plots the average price of gasoline from 2013 to 2023 in the New York City region along with the number of monthly traffic accidents. The data for gasoline prices are available for the New York region from the U.S. Energy Information Administration [23]. The price of gasoline fluctuates significantly, with a notable peak in summer 2022, where the price reaches approximately $5 per gallon. The graph suggests that as gas prices increase, there may be a corresponding decrease in the number of accidents, which could imply a reduction in driving when fuel costs are high.
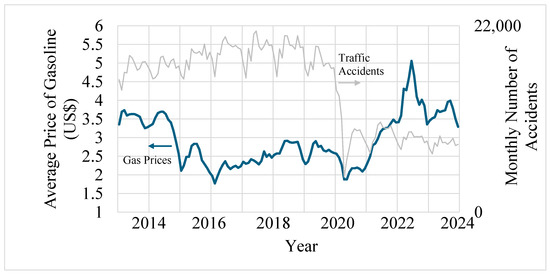
Figure 10.
Average price of gasoline in New York City from 2013 to 2024 overlayed on the monthly number of vehicle accidents.
The link between gasoline prices and traffic accidents is based on the idea that higher fuel prices deter people from driving as frequently, especially in densely populated and expensive areas like New York City [22]. When the cost of operating a vehicle rises, people may turn to alternative transportation, reducing road congestion and, consequently, the number of traffic accidents. This pattern seems visible around periods of high gas prices, particularly in 2022, where a significant spike in gas prices seems to correlate with a reduction in the number of accidents. Thus, fluctuations in fuel prices likely influence driving behaviors and overall traffic safety in New York City.
4.3. Impact of Taxis and For-Hire Vehicles
New York City has historically been famous for its yellow taxis. However, recent years have seen New York’s taxis supplanted by FHVs, run predominantly by Lyft and Uber. The New York City Open Data website provides logs of every taxi and FHV ride from 2015 to 2023 [24]. This data were cleaned and analyzed, with the results plotted in Figure 11, which displays the monthly number of taxi and FHV rides over this time frame, along with the total number of accidents. The number of FHV rides began to increase significantly around 2016. This surge coincides with the emergence and growth of ride-sharing services like Uber and Lyft, which gained popularity during this period. In contrast, the number of taxi rides steadily declined over the same timeframe, highlighting the shift in preference towards FHVs as they became more accessible and convenient for passengers.
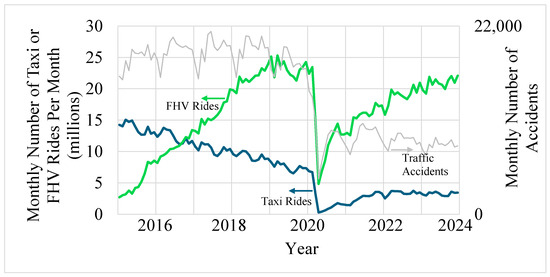
Figure 11.
Monthly number of taxi or FHV rides per month in New York City from 2015 to 2024 overlayed on the monthly number of vehicle accidents.
As stated previously, there was a large drop in traffic accidents in 2020 due to the onset of the COVID-19 pandemic when traffic volumes drastically dropped because of lockdowns and restrictions. This reduction in traffic volume is also captured in the taxi and FHV data. Although traffic accidents increased somewhat post-pandemic, the numbers remained lower than pre-pandemic levels, while FHV rides steadily returned to pre-pandemic levels.
One possible explanation for this sustained reduction is the continued preference for FHVs over personal vehicles, as many people opted for these services instead of driving themselves. FHV drivers tend to have more driving experience, leading to safer driving practices, which could contribute to the lower accident rates. Further, FHV drivers have ownership of their vehicles, as opposed to taxi drivers, whose vehicles are owned by the taxi company. This ownership likely also leads to safer driving practices since the FHV driver is responsible for the expenses and associated insurance increases due to an accident.
Further, the dataset indicates that over this time period, the percentage of accidents that occurred in Manhattan decreased relative to the other boroughs. This trend corresponds well with the increase in FHV services, which impacted Manhattan more than the other boroughs. In 2023, 41 percent of FHV rides occurred in Manhattan, compared to 26 percent in Brooklyn, 12 percent in the Bronx, 20 percent in Queens, and 1 percent in Staten Island [25].
It is also worth noting that the total number of vehicles on the road in New York City should scale proportionally with the total number of FHV and taxi rides, as these services play a significant role in meeting the city’s transportation needs. As the demand for travel within the city increases, the need for people to reach various destinations remains consistent, whether for work, leisure, or other purposes. While some individuals prefer to drive their own vehicles, a considerable percentage opt for ride-share services or taxis, especially given the convenience, cost considerations, and challenges of parking in a densely populated urban environment like New York City. This proportion of individuals who choose to drive versus those who rely on ride-shares and taxis tends to remain relatively constant, even as overall travel demand fluctuates [26]. Therefore, as the number of FHV and taxi rides rises, it directly contributes to the total number of vehicles on the road, resulting in an overall increase in traffic volume.
4.4. Impact of New Vehicle Technology
While the decrease in vehicle accidents coincides well with the lockdowns from the global pandemic, the number of accidents did not increase in 2022 and 2023, when many of the pandemic restrictions were over and many businesses required employees to come back to work in person. Although many people still teleworked, a large portion of commuters had to return to the roads. These years also coincide well with the increased adoption of new vehicles, many of which include advanced safety features.
In particular, electric vehicles have gained a large foothold, especially in New York City. Figure 12 uses data from the New York Department of Motor Vehicles to plot the number of new electric vehicle registrations in New York City from 2013 to 2023 [27]. By 2023, there were approximately 12 electric vehicle registrations per 1000 people. Electric vehicles include a large number of vehicle sensors that may have played a role in reducing the number of accidents. These sensors include technologies such as automatic emergency braking, lane-keeping assistance, blind-spot detection, and pedestrian and cyclist detection systems [28]. By constantly monitoring the vehicle’s surroundings and providing real-time feedback to the driver, these systems can prevent collisions by alerting the driver to potential hazards and, in some cases, taking corrective action automatically.
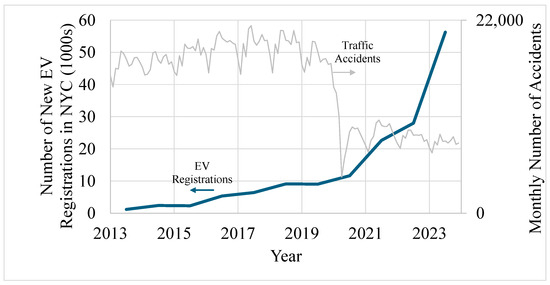
Figure 12.
Number of new electric vehicles registered in New York City overlayed on the monthly number of vehicle accidents.
The increase in electronic vehicle registrations is emblematic of the general fleet turnover. While many electric vehicles include additional sensing and potentially autopilot capabilities, most new automobiles, regardless of powertrain, have incorporated advanced safety features such as automatic emergency braking, adaptive cruise control, and lane-keeping assist to prevent collisions and enhance driver assistance. Additional technologies like blind-spot monitoring, pedestrian detection, and 360-degree cameras further improve situational awareness and safety [29]. These innovations collectively enhance vehicle safety, reducing accidents and protecting passengers and other road users.
While these technologies coincide with a reduction in the total number of accidents, they did not appear to result in a reduction in the number of accidents that resulted in injury or death. As discussed in Section 3.3, despite the decrease in overall accidents, the total number of injuries and fatalities did not significantly change between 2013 and 2023, despite the inclusion of these new technologies.
5. Quantifying the Impact of Different Factors on Accidents
5.1. Mathematical Model
To better understand the factors influencing accident trends, this study developed a linear model to calculate the monthly number of accidents based on the parameters outlined in the previous section. The model considered the following variables:
- Month: The number of accidents showed a 12-month periodicity, typically peaking in May or June. Therefore, the model used the number of months from June as a variable, with January assigned a value of 5 and December a value of 6.
- Gas Prices: As gas prices increase, drivers tend to carpool or seek alternative transportation options to reduce costs. The model included the average monthly gasoline price as a variable.
- Number of Cars on the Road: The impact of COVID-19 on vehicle accidents was largely due to decreased vehicular traffic. While this study could not identify a specific New York City dataset capturing the total number of vehicles on the road, the number of cars correlates approximately with the total number of taxi and FHV rides. Therefore, the total monthly taxi and FHV rides were used as a proxy to represent the number of cars on the road.
- Percent FHV: A potential reduction in vehicular accidents is associated with New York residents choosing FHVs over taxis. This variable represents the percentage of monthly FHV rides compared to the total monthly taxi and FHV rides.
- New Vehicle Registration: Modern cars equipped with advanced technology offer additional features to avoid accidents. This study was not able to find a New York City dataset specifically related to vehicles with advanced safety features; as such, the number of new electric vehicle registrations is used as a surrogate variable.
It is important to note that initial analyses included positive rates of COVID-19 (i.e., the values from Figure 9); however, the model revealed no statistical significance between these rates and the number of vehicle accidents. This is likely due to the repeated waves of COVID-19, resulting in the city and companies maintaining their precautions even when the number of cases was low. Rather, the number of cars on the road, measured through a proxy value of the sum of FHV and taxi rides, was found to more effectively capture the impact of COVID-19 on vehicle accidents.
The results of the model are presented in Table 3, which shows the linear coefficients and p-values. The small p-values indicate that each variable is statistically significant. Figure 13 displays a comparison of the model’s predicted values against the actual values, demonstrating good agreement between the two.

Table 3.
Results from a linear model that approximates the number of vehicle accidents as a function of the parameters listed below.
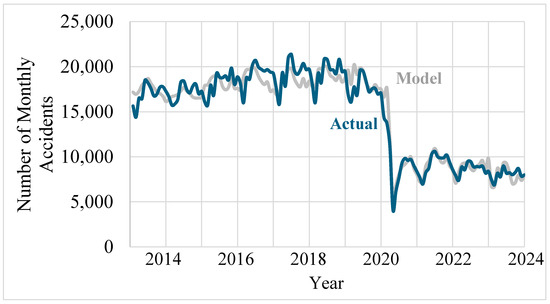
Figure 13.
Results from the model showing the predicted number of monthly accidents based on the values in Table 3, plotted with the actual number of monthly accidents.
A negative coefficient for a variable indicates that the number of accidents decreases as that factor increases. The model suggests that the number of vehicle accidents decreases as the months progress away from June, as gas prices rise, as FHVs replace taxis, and as new vehicles with advanced safety features are registered. Conversely, a positive coefficient indicates that accidents increase as that factor increases. As expected, an increase in the number of cars on the road corresponds to an increase in accidents.
Table 3 also shows the range of values for each variable. When combined with the coefficient, this range provides insight into the relative impact of each factor on accident rates. As anticipated, the number of cars on the road has the greatest impact, followed by the percentage of FHV rides. The cost of gasoline and the number of new vehicle registrations have the next most significant effects, while the month variable has the smallest impact.
5.2. Urban Initiatives to Enhance Traffic Safety
While the largest positive impact on vehicle accidents in New York City came from the COVID-19 pandemic and the subsequent reduction in vehicle traffic, a city cannot plan a pandemic as a strategy for reducing vehicle accidents. Regardless, the data indicated several trends that could provide insight into urban planning and strategies that could positively impact reducing vehicle accidents.
First, the city should support telework initiatives, particularly during the peak accident months of May and June. By encouraging companies to allow employees to work from home, especially during the summer, the overall traffic volume could be reduced, leading to fewer accidents. It is important to note that despite a reduction in the overall number of accidents, distracted driving is still responsible for a quarter of vehicle accidents. Therefore, telework policies should promote a “cameras on” policy during virtual meetings that can help prevent employees from working while driving or walking, addressing a critical source of distraction.
Additionally, promoting alternatives to driving, such as biking, walking, or using public transportation, during these peak months can further alleviate road congestion and enhance safety. As shown from the data, the increase in pedestrians and cycling traffic has not historically resulted in increased pedestrian or cyclist injuries.
Third, the city should continue to support and incentivize the use of FHVs as an alternative to personal vehicle usage and taxis. The study shows that the increasing percentage of FHV rides correlates with a reduction in accidents, suggesting that FHVs contribute to safer road conditions. Policies could include creating dedicated FHV lanes or providing subsidies for FHV rides, particularly in high-traffic areas. This would make FHVs a more attractive and safer option for commuters, reducing the overall number of private vehicles on the road.
Additionally, New York City should implement programs that encourage the adoption of newer vehicles, particularly electric vehicles (EVs), given their advanced safety features. Incentives such as rebates, tax credits, or reduced registration fees for new EV purchases can accelerate the shift toward safer, modern cars. These newer vehicles are often equipped with collision avoidance systems and other safety technologies, which can help decrease accident rates. By promoting a transition to EVs and newer vehicle models, the city can enhance road safety while simultaneously supporting environmental goals.
5.3. Model Limitations and Future Work
While the linear model developed in this study provides valuable insights into the factors influencing monthly vehicle accident trends, it is essential to recognize its limitations. Acknowledging these constraints is crucial for interpreting the model’s results and identifying areas for future refinement.
The model’s first limitation lies in the use of proxy data for the “number of cars on the road” variable. While the total monthly taxi and FHV rides provide an approximation, they do not encompass all forms of vehicular traffic, such as private cars, buses, and delivery vehicles, which also contribute to the overall traffic volume. This reliance on proxy data may result in an incomplete or skewed representation of total vehicular activity in New York City, potentially affecting the model’s accuracy in capturing the true relationship between the number of cars on the road and accident rates. Future work will look for datasets that could provide more accurate representations of the vehicles on the road.
Another limitation is that the model assumes linear relationships between the variables and accident rates, which might not fully capture the complexities of real-world interactions. For instance, the impact of gas prices on driving behavior could be non-linear, with significant changes only occurring when prices reach certain thresholds. Future work will look at the development of more advanced models, such as those using machine-learning algorithms, that have the potential to better capture these relationships.
Additionally, the model does not account for all external factors that could play a role in vehicle accidents, including weather conditions, sudden policy changes, or unique events like large public gatherings. Furthermore, driver behavior and risk aversion—critical underlying factors affecting vehicle accidents—are not directly included in the analysis. In particular, the COVID-19 pandemic fundamentally increased many people’s levels of risk aversion. This could have translated into a shift where drivers are taking less risk while driving. These factors will be explored in future studies.
6. Conclusions
This study highlights significant trends and changes in traffic accidents in New York City from 2013 to 2023, offering insights for urban planners and policymakers. The findings underscore the substantial impact of the COVID-19 pandemic, which led to a dramatic reduction in accidents due to decreased motor vehicle traffic. Even with the easing of lockdowns, accident numbers remain significantly lower than pre-pandemic levels. The study found that a number of factors likely play a role in this sustained decrease in vehicle accidents. A statistical model found that the largest reduction is due to a reduction in vehicles on the road, likely tied to companies maintaining telework policies. Other factors, including rising gasoline prices, increased use of FHVs, and the increasing number of electric vehicles were also found to play a role.
Ultimately, these findings offer valuable guidance for urban planners and policymakers seeking to enhance road safety and manage traffic congestion in a city as complex and dynamic as New York. By implementing strategies that encourage telework, support FHV use, and promote the adoption of safer, modern vehicles, New York City can continue to reduce vehicular accidents, even as it adapts to ongoing changes in transportation trends and population growth. Urban planners and policymakers can leverage this data to implement strategies that further reduce accidents and promote efficient transportation systems. By focusing on technological advancements, behavioral interventions, and effective urban planning, New York City can maintain its status as a global leader in urban innovation and livability.
Author Contributions
Conceptualization, V.M. and E.L.; methodology, V.M.; data analysis, V.M. and E.L.; writing—original draft preparation, V.M. and E.L.; writing—review and editing, V.M. and E.L. All authors have read and agreed to the published version of the manuscript.
Funding
This research received no external funding.
Data Availability Statement
This study used publicly available data sets. No new data were created.
Conflicts of Interest
The authors declare no conflicts of interest.
References
- City of New York Motor Vehicle Collisions—Crashes. Available online: https://catalog.data.gov/dataset/motor-vehicle-collisions-crashes (accessed on 4 June 2024).
- MV-104 Report of Motor Vehicle Accident. Available online: https://dmv.ny.gov/forms/mv104.pdf (accessed on 10 July 2024).
- City of New York Police Department: Electronic Record Management Systems: Impact and Use Policy. Available online: https://www.nyc.gov/assets/nypd/downloads/pdf/public_information/post-final/electronic-record-management-systems-nypd-impact-and-use-policy_4.9.21_final.pdf (accessed on 10 July 2024).
- Pathak, A.; Chandrasekaran, S.; Annamalai, B. Analysis of motor vehicle accidents: Comparison between before and during the COVID-19 lockdown in Maharashtra, India. Transp. Res. Rec. 2023, 2677, 503–516. [Google Scholar] [CrossRef] [PubMed]
- Qureshi, A.I.; Huang, W.; Khan, S.; Lobanova, I.; Siddiq, F.; Gomez, C.R.; Suri, M.F.K. Mandated societal lockdown and road traffic accidents. Accid. Anal. Prev. 2020, 146, 105747. [Google Scholar] [CrossRef] [PubMed]
- Calderon-Anyosa, R.J.C.; Kaufman, J.S. Impact of COVID-19 lockdown policy on homicide, suicide, and motor vehicle deaths in Peru. Prev. Med. 2021, 143, 106331. [Google Scholar] [CrossRef] [PubMed]
- Vandoros, S. COVID-19, lockdowns and motor vehicle collisions: Empirical evidence from Greece. Inj. Prev. 2022, 28, 81–85. [Google Scholar] [CrossRef] [PubMed]
- Barnes, S.R.; Beland, L.-P.; Huh, J.; Kim, D. The effect of COVID-19 lockdown on mobility and traffic accidents: Evidence from Louisiana. GLO Disc. Pap. 2020, 616, 2–14. [Google Scholar]
- Saladié, Ò.; Bustamante, E.; Gutiérrez, A. COVID-19 lockdown and reduction of traffic accidents in Tarragona province, Spain. Transp. Res. Interdiscip. Perspect. 2020, 8, 100218. [Google Scholar] [CrossRef] [PubMed]
- Inada, H.; Ashraf, L.; Campbell, S. COVID-19 lockdown and fatal motor vehicle collisions due to speed-related traffic violations in Japan: A time-series study. Inj. Prev. 2021, 27, 98–100. [Google Scholar] [CrossRef] [PubMed]
- Busse, B. Patterns of discursive urban place-making in Brooklyn, New York. Corpus Linguist. Context Cult. 2019, 15, 13. [Google Scholar]
- Espín Noboa, L.; Lemmerich, F.; Singer, P.; Strohmaier, M. Discovering and characterizing mobility patterns in urban spaces: A study of Manhattan taxi data. In Proceedings of the 25th International Conference Companion on World Wide Web, Montréal, QC, Canada, 11–15 April 2016; pp. 537–542. [Google Scholar]
- Ignaccolo, C.; Giuffrida, N.; Torrisi, V. The Queensway of New York City: A proposal for sustainable mobility in Queens. In Town and Infrastructure Planning for Safety and Urban Quality; CRC Press: Boca Raton, FL, USA, 2018; pp. 69–76. [Google Scholar]
- Testi, I.; Wang, A.; Paul, S.; Mora, S.; Walker, E.; Nyhan, M.; Duarte, F.; Santi, P.; Ratti, C. Big mobility data reveals hyperlocal air pollution exposure disparities in the Bronx, New York. Nat. Cities 2024, 1, 512–521. [Google Scholar] [CrossRef]
- 17 Everyday Things the Pandemic Has Ruined that No Longer Exist. Available online: https://www.buzzfeed.com/ravenishak/things-pandemic-ruined (accessed on 27 June 2024).
- Blincoe, L.B.; Miller, T.; Wang, J.-S.; Swedler, D.; Coughlin, T.; Lawrence, B.; Guo, F.; Klauer, S.; Dingus, T. The Economic and Societal Impact of Motor Vehicle Crashes, 2019 (Revised); Report No. DOT HS 813 403; National Highway Traffic Safety Administration: Washington, DC, USA, 2023. [Google Scholar]
- Lam, C.T.; Liu, M.; Hui, X. The geography of ridesharing: A case study on New York City. Inform. Econ. Policy 2021, 57, 100941. [Google Scholar] [CrossRef]
- Pfeffer-Gillett, A. When disruption collides with accountability: Holding ridesharing companies liable for acts of their drivers. Calif. L. Rev. 2016, 104, 233. [Google Scholar]
- Teixeira, J.F.; Lopes, M. The link between bike sharing and subway use during the COVID-19 pandemic: The case-study of New York’s Citi Bike. Transp. Res. Interdiscip. Perspect. 2020, 6, 100166. [Google Scholar] [CrossRef] [PubMed]
- New York City Health: COVID-19: Data. Available online: https://www.nyc.gov/site/doh/covid/covid-19-data.page (accessed on 18 September 2024).
- Hale, A.; Walker, D.; Walters, N.; Bolt, H. Developing the understanding of underlying causes of construction fatal accidents. Saf. Sci. 2012, 50, 2020–2027. [Google Scholar] [CrossRef]
- Gillingham, K.; Munk-Nielsen, A. A tale of two tails: Commuting and the fuel price response in driving. J. Urban Econ. 2019, 109, 27–40. [Google Scholar] [CrossRef]
- U.S. Energy Information Administration: Gasoline and Diesel Fuel Update. Available online: https://www.eia.gov/petroleum/gasdiesel/ (accessed on 12 September 2024).
- New York City Open Data. Available online: https://opendata.cityofnewyork.us (accessed on 19 September 2024).
- Taxi and Limousine Commission: February 2024 For-Hire Vehicle License Review. Available online: https://www.nyc.gov/assets/tlc/downloads/pdf/license-pause-report-2024-02.pdf (accessed on 23 September 2024).
- Jin, S.T.; Kong, H.; Wu, R.; Sui, D.Z. Ridesourcing, the sharing economy, and the future of cities. Cities 2018, 76, 96–104. [Google Scholar] [CrossRef]
- Electric Vehicle Registration Map. Available online: https://www.nyserda.ny.gov/-/media/Project/Nyserda/Files/Programs/ChargeNY/ny_ev_registrations.csv (accessed on 15 July 2024).
- Indu, K.; Kumar, M.A. Electric vehicle control and driving safety systems: A review. IETE J. Res. 2023, 69, 482–498. [Google Scholar] [CrossRef]
- Metzger, K.B.; Sartin, E.; Foss, R.D.; Joyce, N.; Curry, A.E. Vehicle safety characteristics in vulnerable driver populations. Traffic Inj. Prev. 2020, 21, S54–S59. [Google Scholar] [CrossRef] [PubMed]
Disclaimer/Publisher’s Note: The statements, opinions and data contained in all publications are solely those of the individual author(s) and contributor(s) and not of MDPI and/or the editor(s). MDPI and/or the editor(s) disclaim responsibility for any injury to people or property resulting from any ideas, methods, instructions or products referred to in the content. |
© 2024 by the authors. Licensee MDPI, Basel, Switzerland. This article is an open access article distributed under the terms and conditions of the Creative Commons Attribution (CC BY) license (https://creativecommons.org/licenses/by/4.0/).